
Relationship of In Vitro Toxicity of Technetium-99m to Subcellular Localisation and Absorbed Dose

 , ,
, , 
Abstract
:
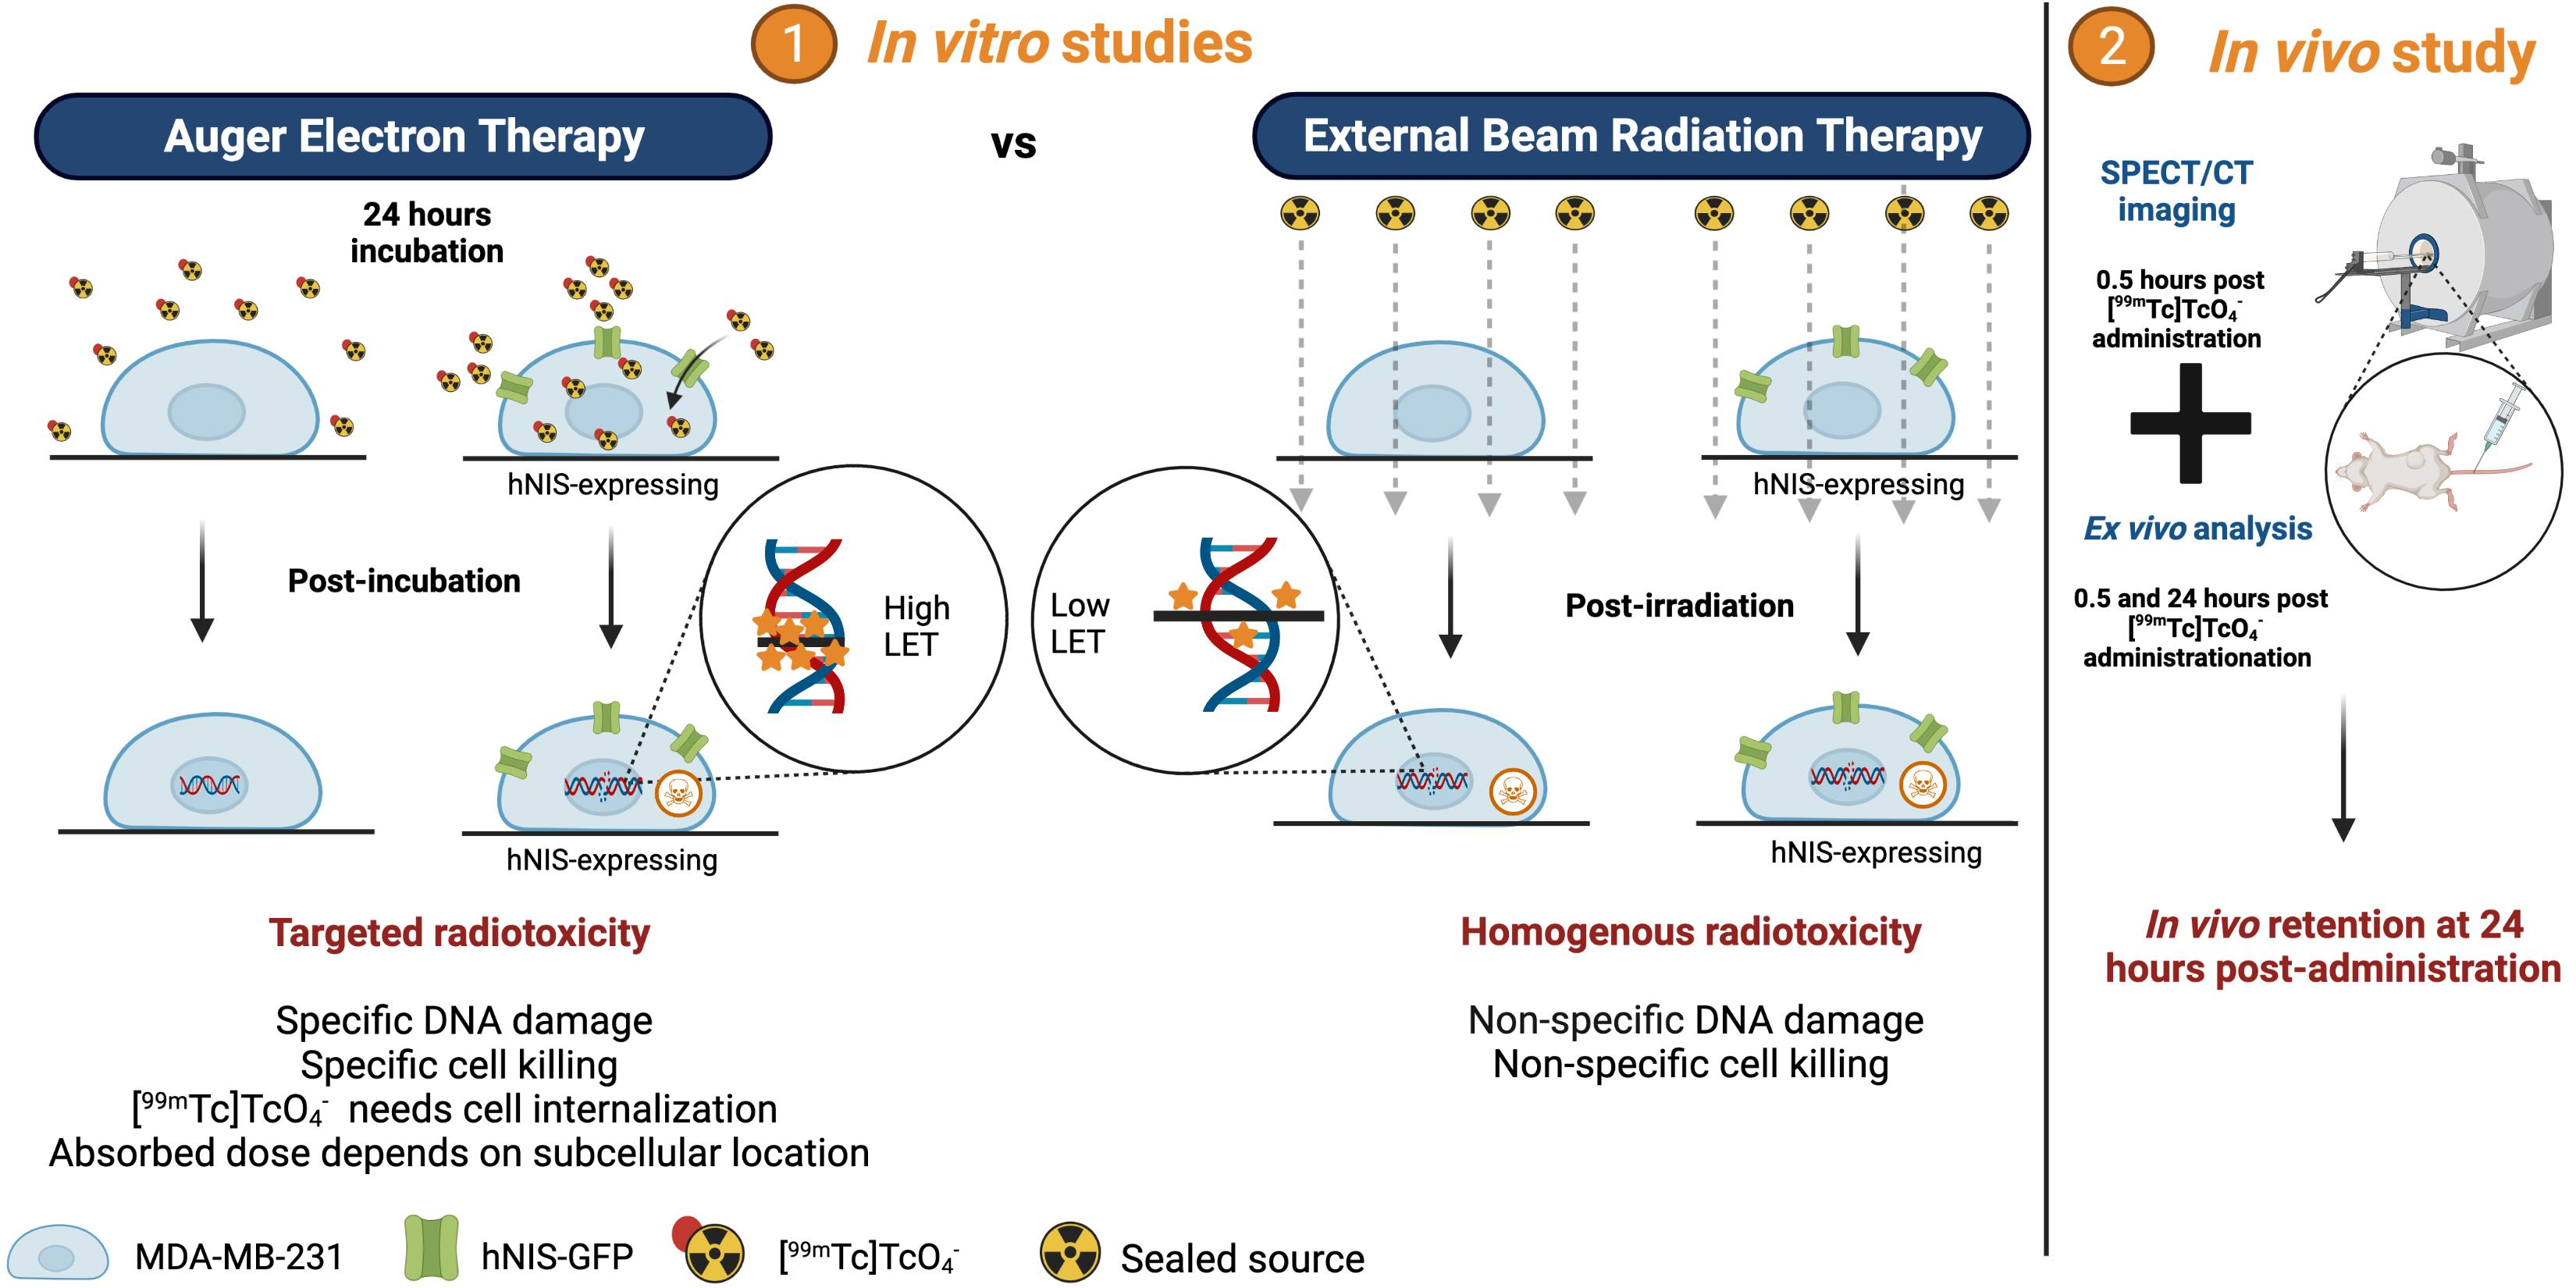
1. Introduction
2. Results
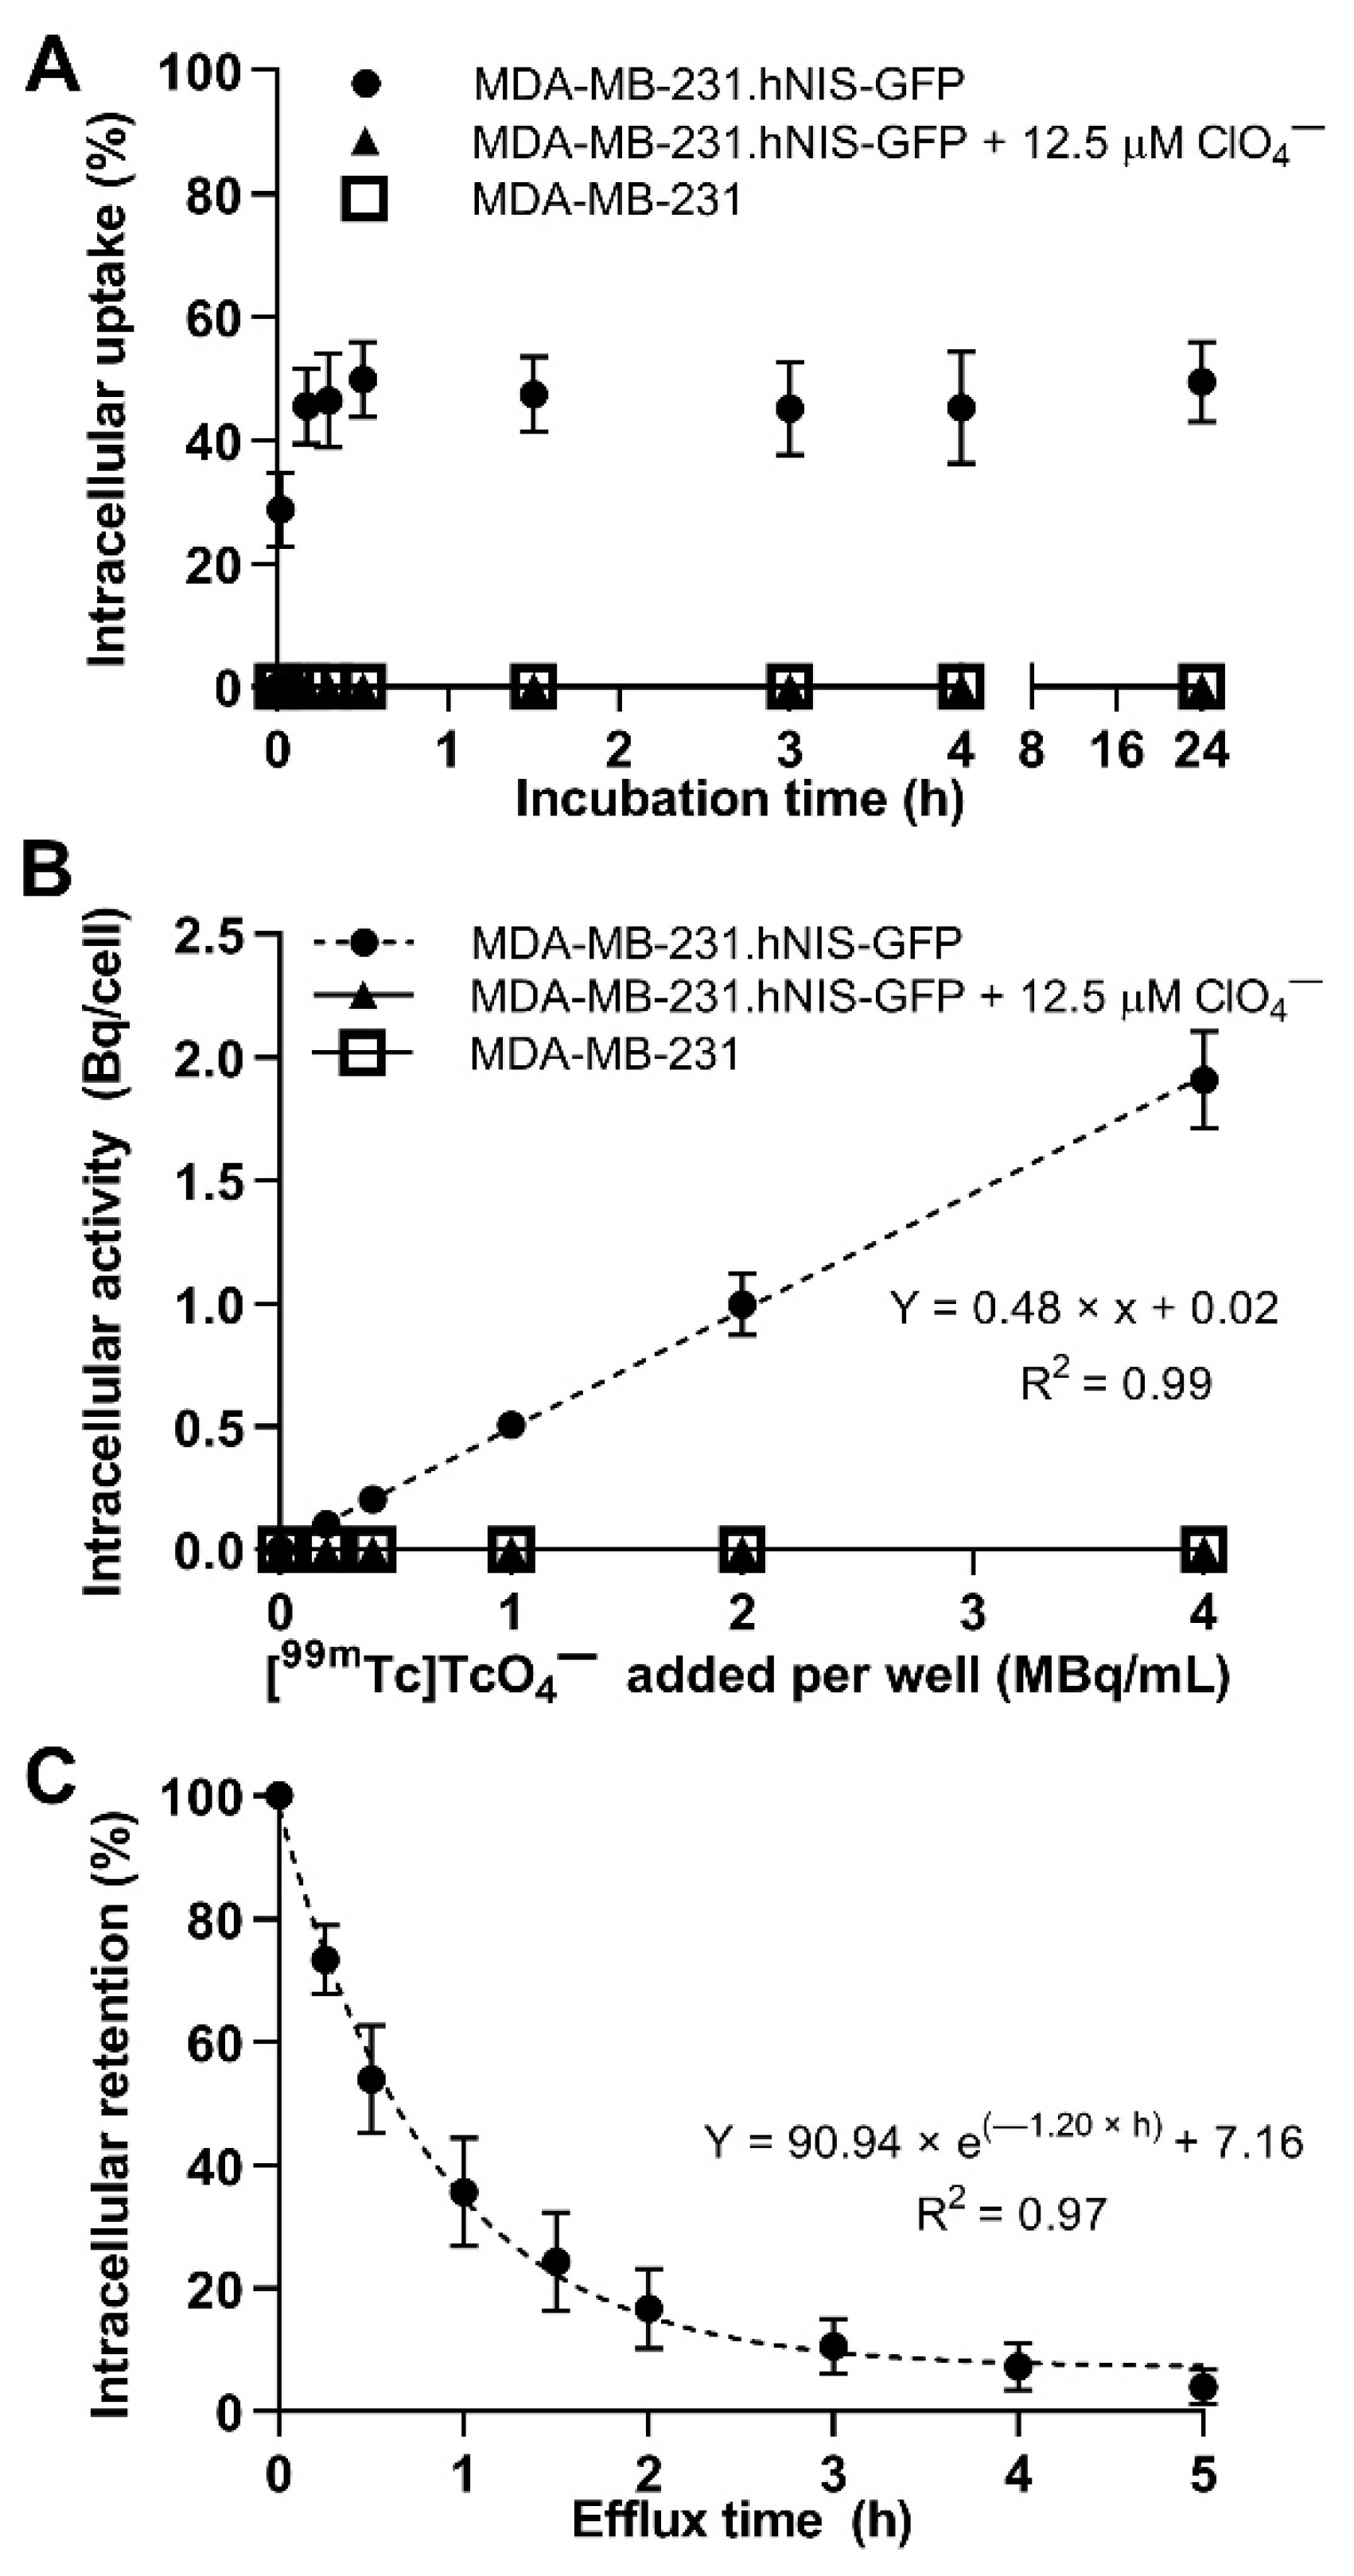
2.1. In Vitro Uptake and Efflux of [99mTc]TcO4−
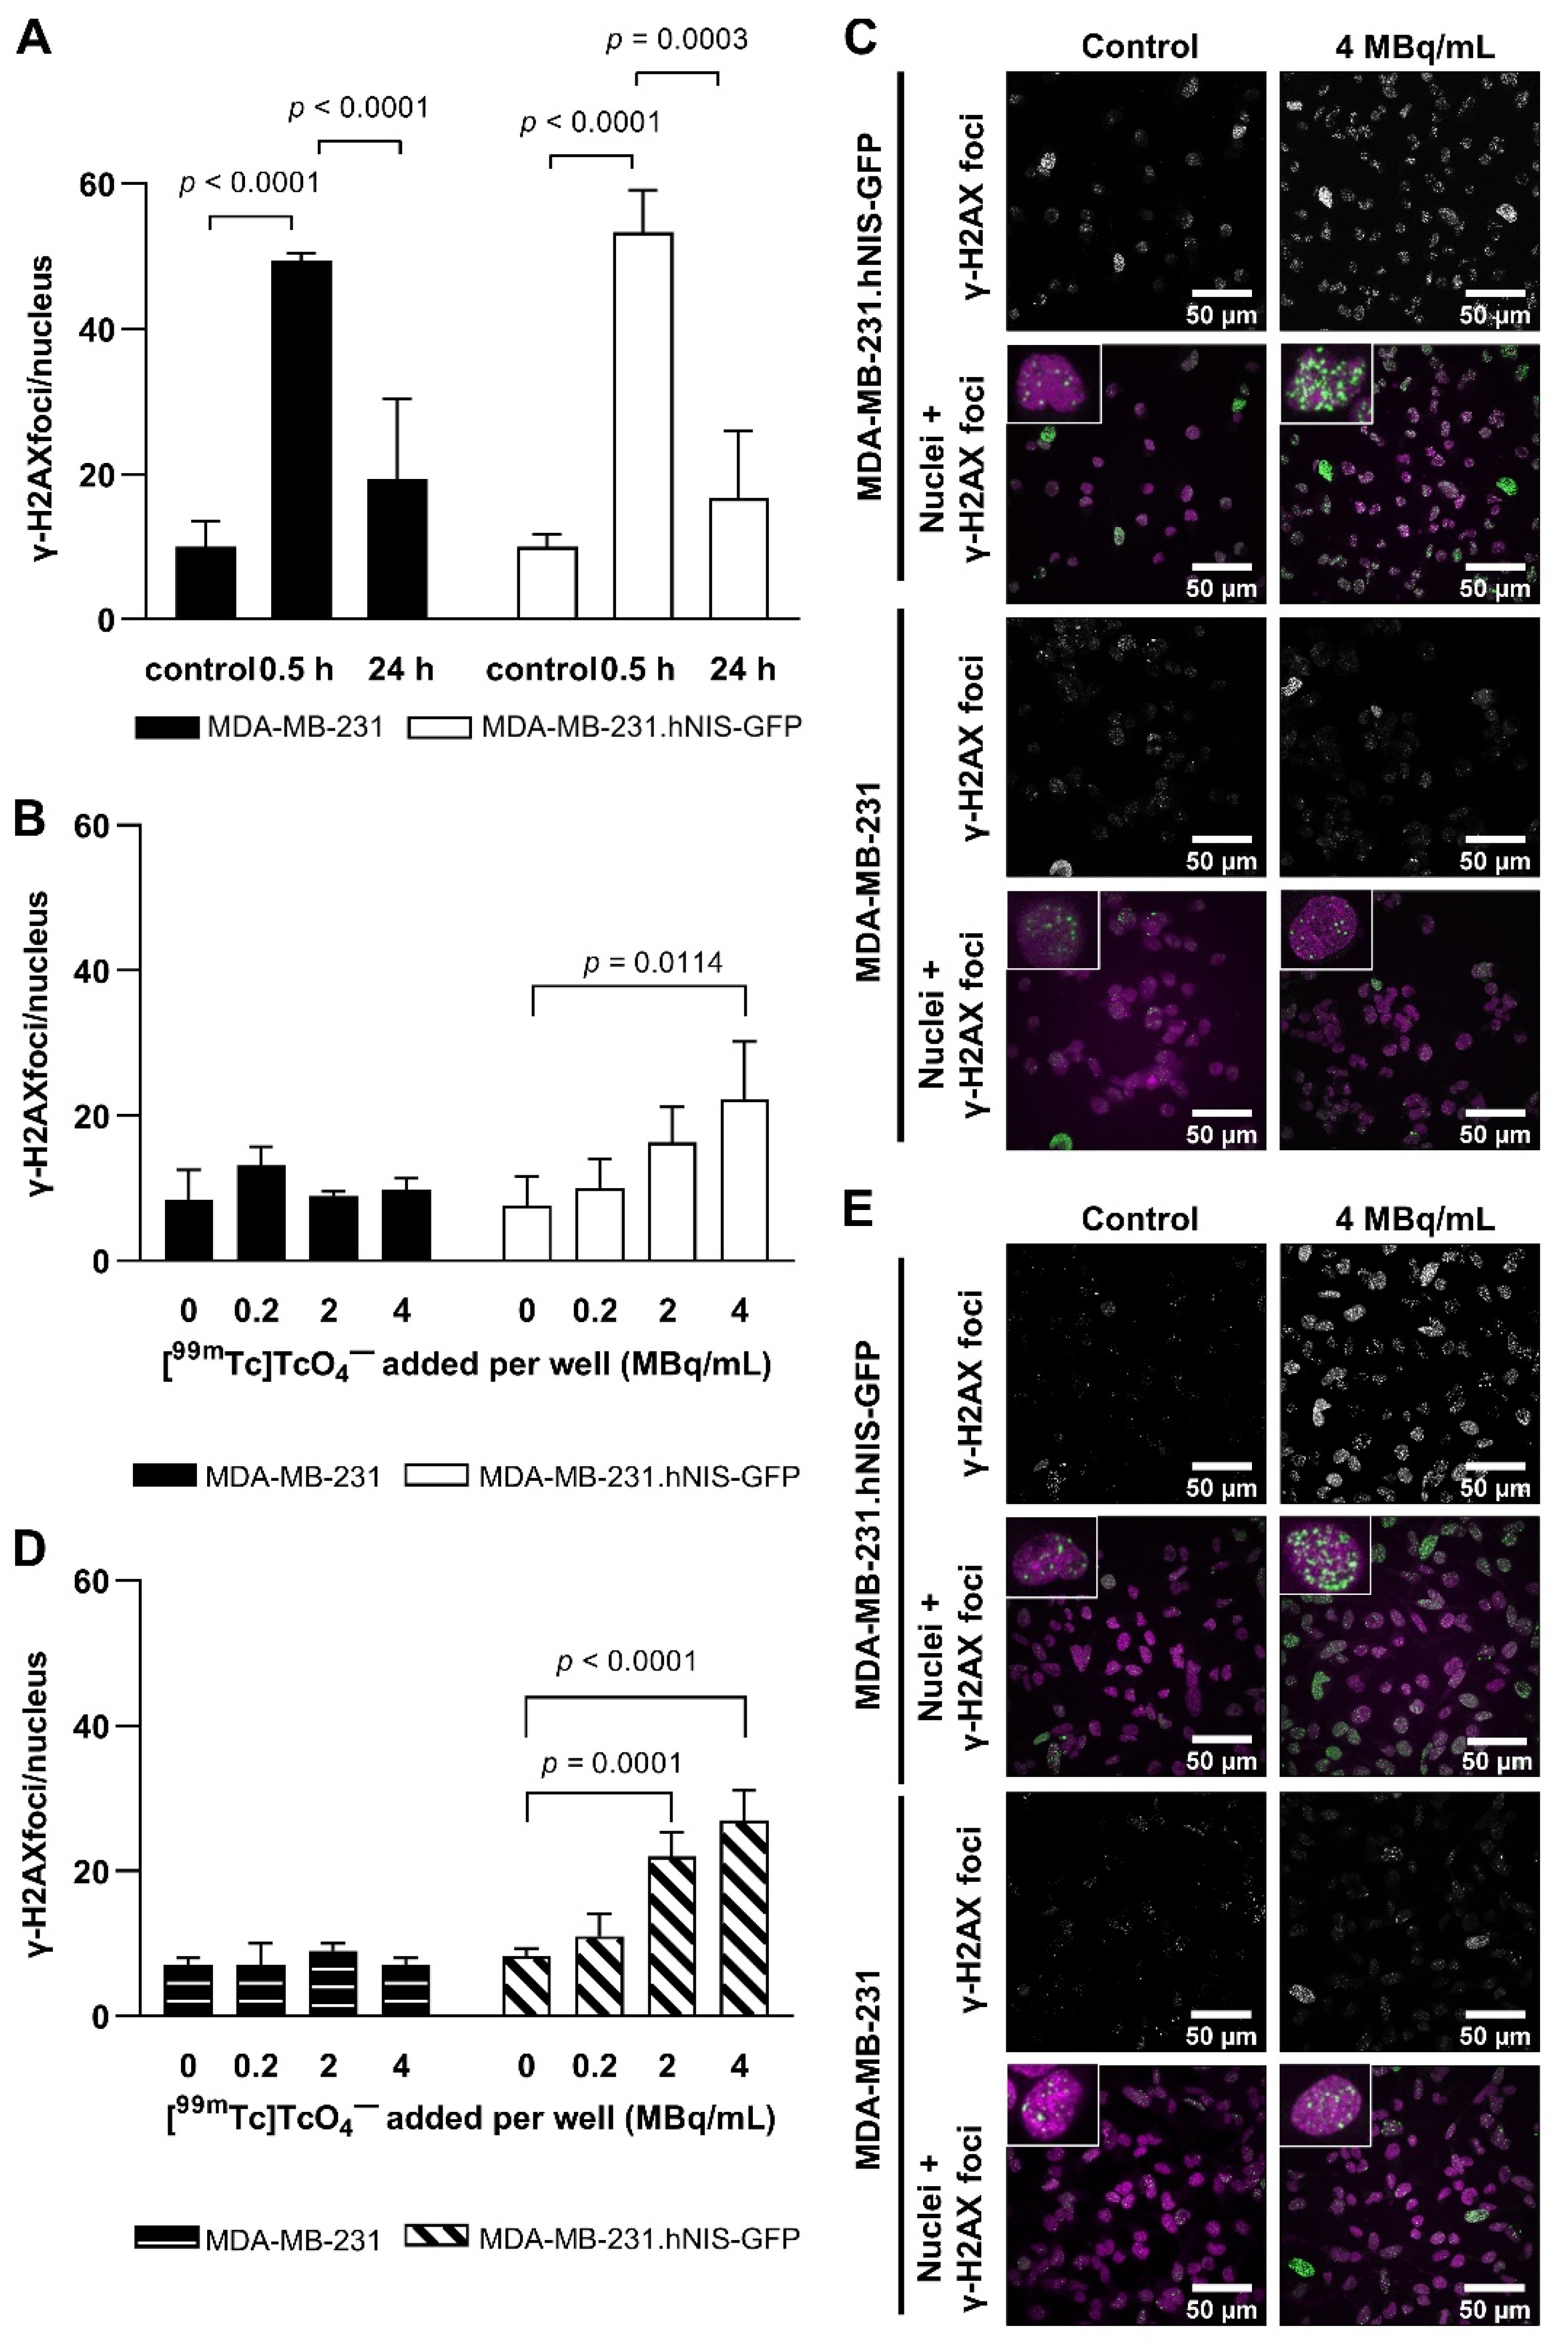
2.2. Technetium-99m and EBRT-Induced DNA Damage
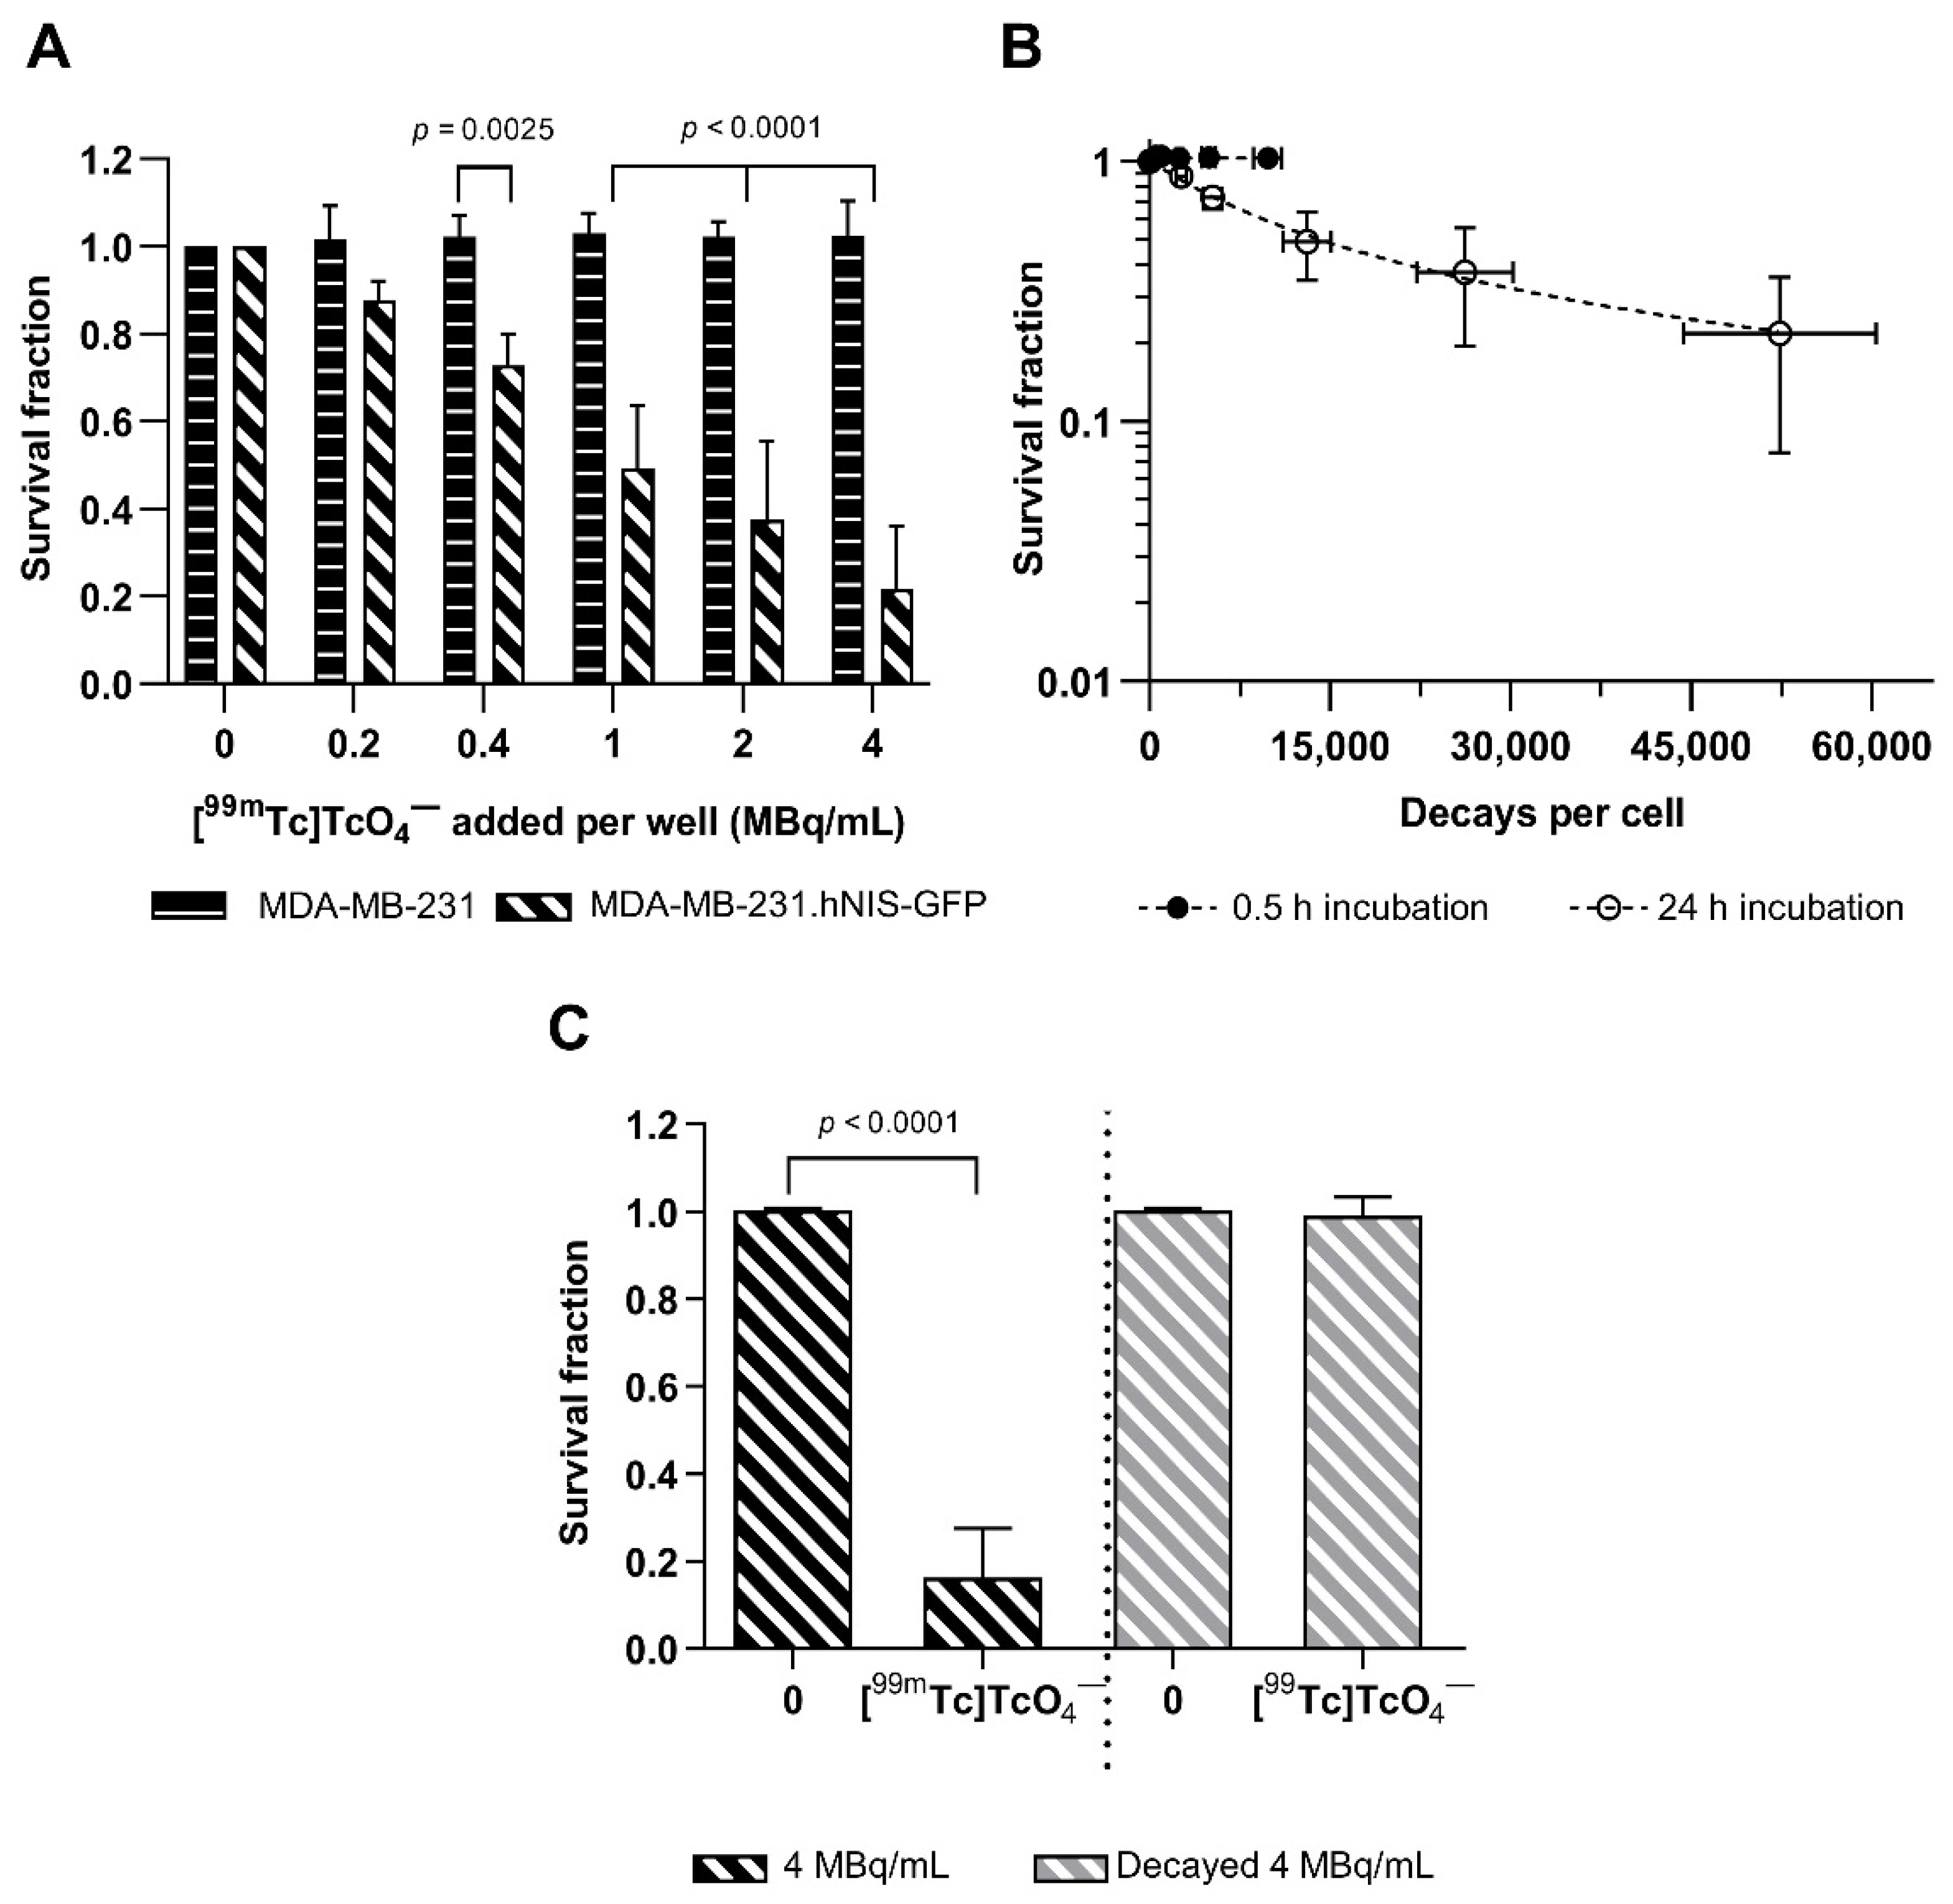
2.3. Cytotoxicity
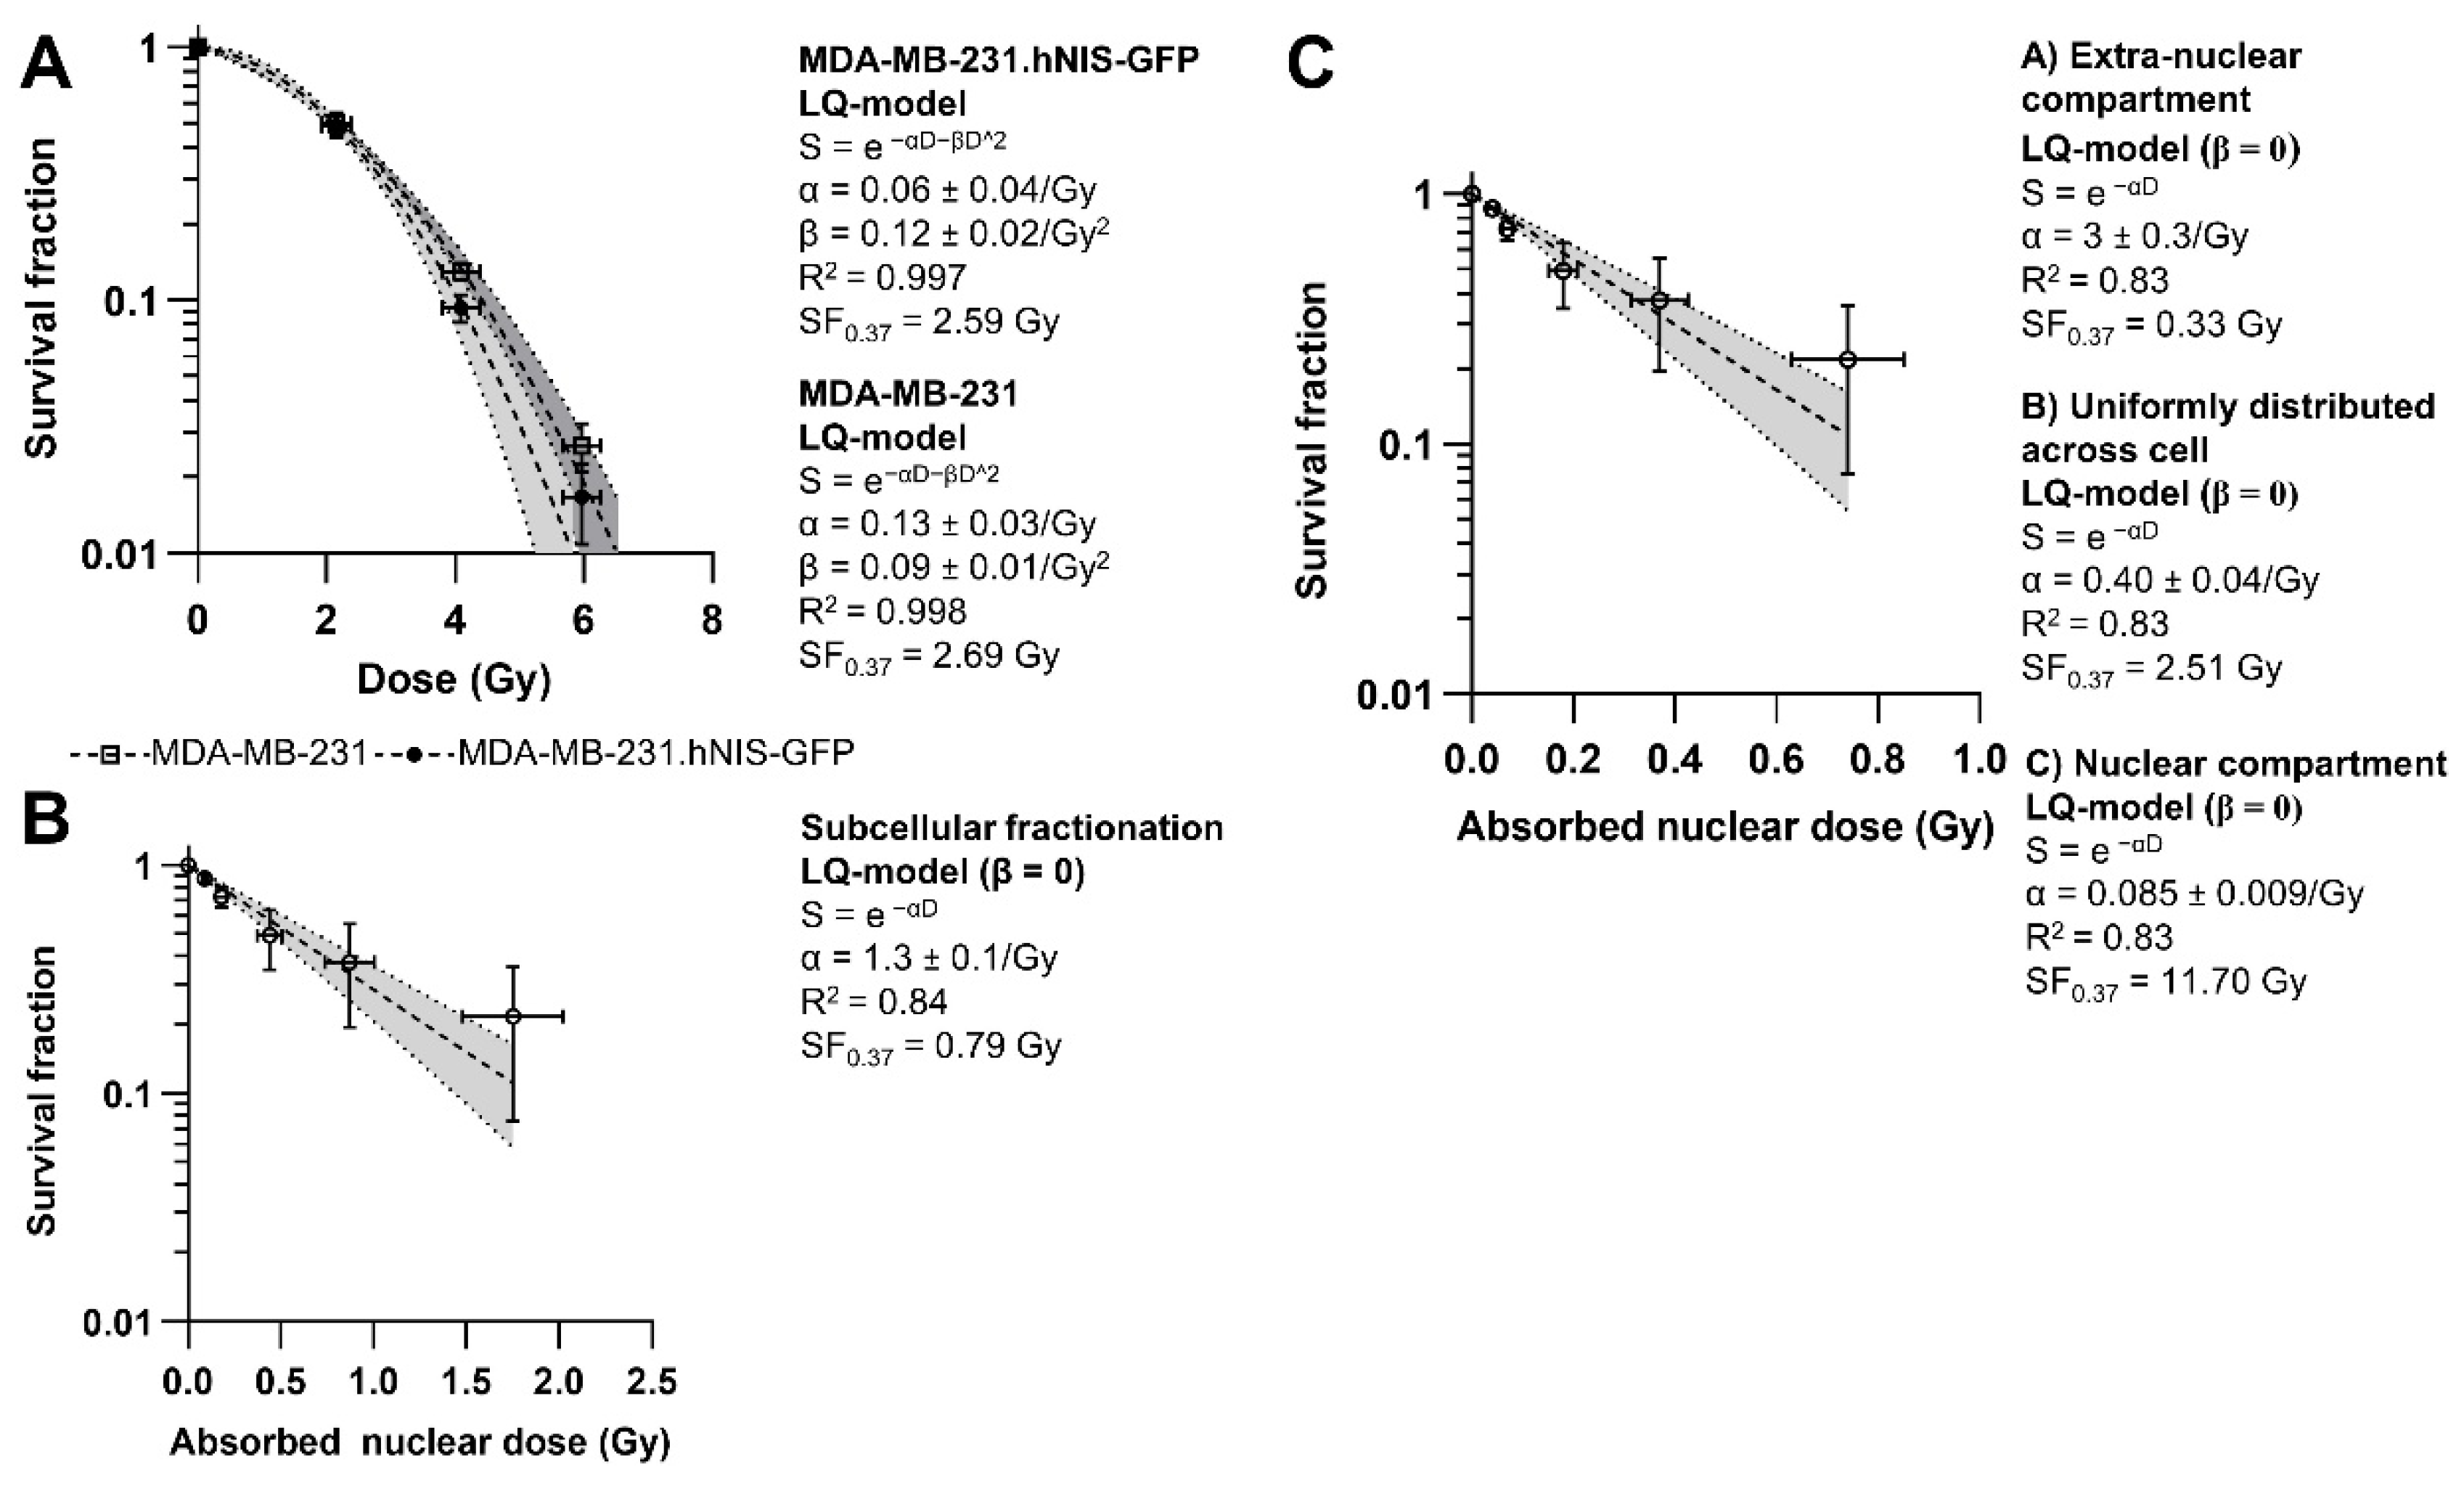
2.4. Dosimetry
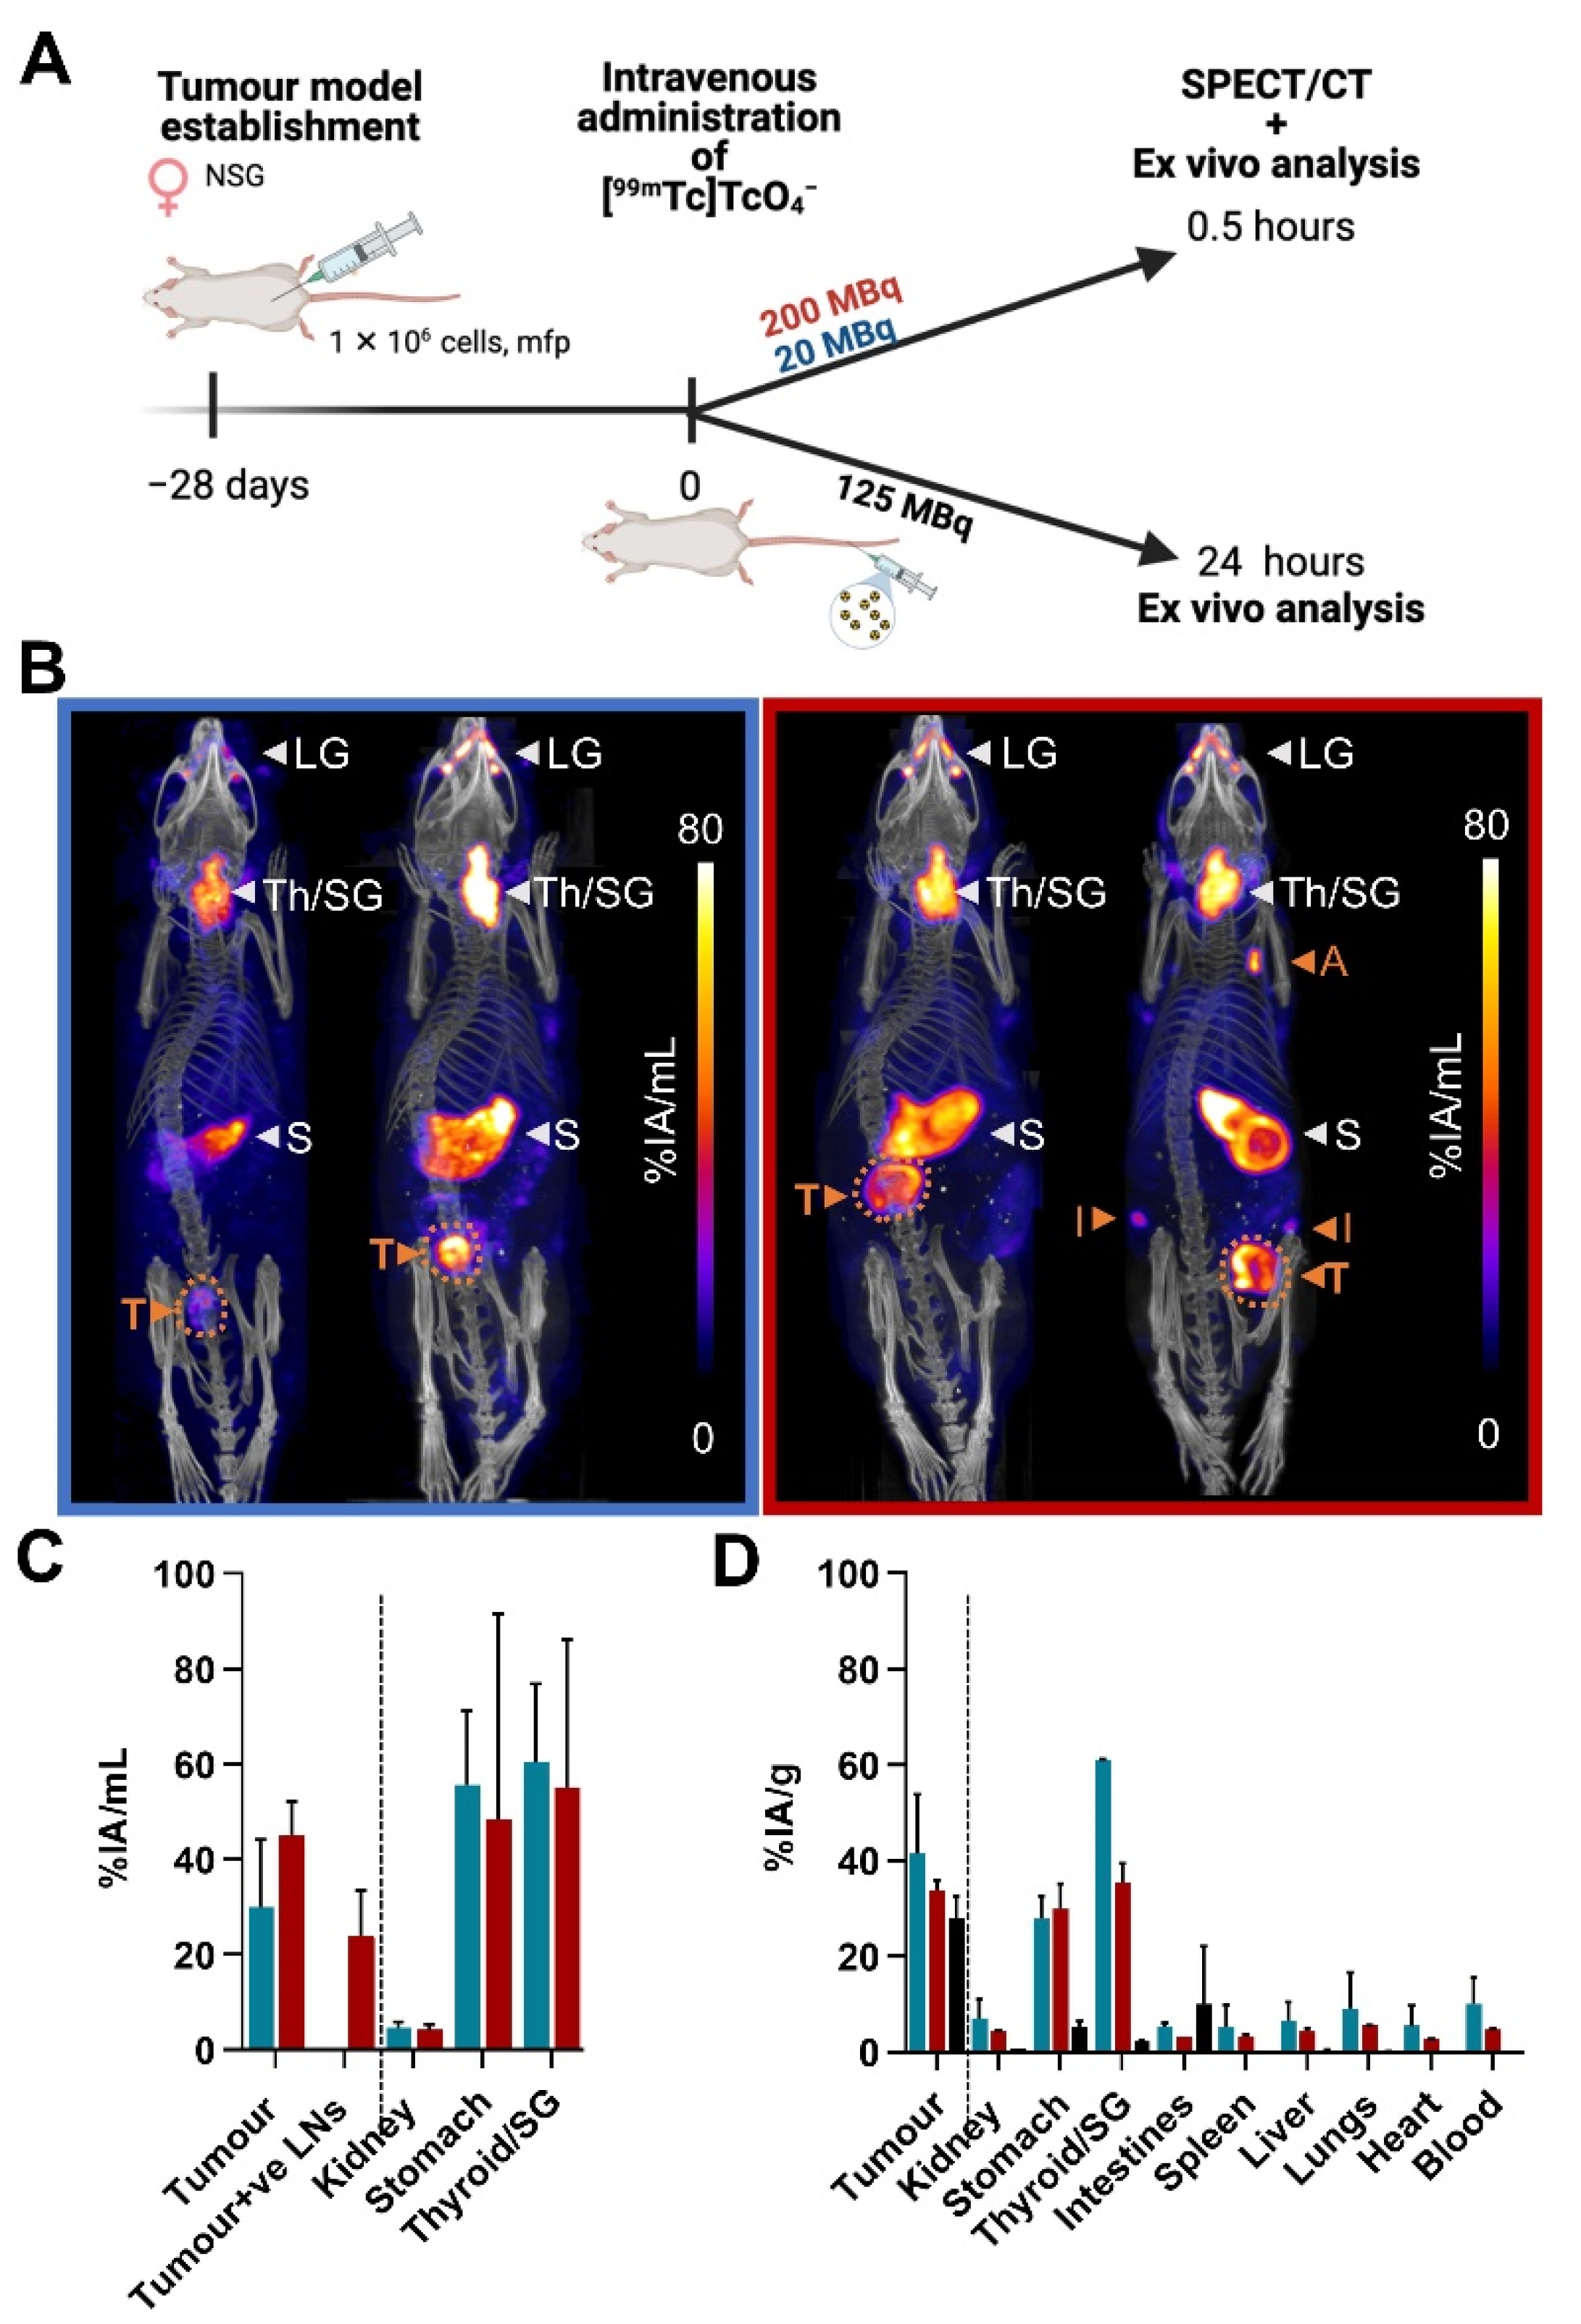
2.5. In Vivo Imaging and Tissue Distribution
3. Discussion
4. Materials and Methods
4.1. Cells
4.2. Radionuclides and EBRT
4.3. Cellular [99mTc]TcO4− Uptake and Efflux
4.4. Estimation of Subcellular [99mTc]TcO4− Distribution
4.5. Cytotoxicity Assays
4.6. Assessment of DNA Damage
4.7. Dosimetry
4.8. Animal Tumour Model
4.9. SPECT/CT Imaging
4.10. Ex Vivo Analysis of Tissue Radioactivity
4.11. Statistics
5. Conclusions
Supplementary Materials
Author Contributions
Funding
Institutional Review Board Statement
Informed Consent Statement
Data Availability Statement
Acknowledgments
Conflicts of Interest
References
- Ku, A.; Facca, V.J.; Cai, Z.; Reilly, R.M. Auger electrons for Cancer Therapy—A Review. EJNMMI Radiopharm. Chem. 2019, 4, 27. [Google Scholar] [CrossRef] [Green Version]
- Idrissou, M.B.; Pichard, A.; Tee, B.; Kibedi, T.; Poty, S.; Pouget, J.-P. Targeted Radionuclide Therapy Using Auger Electron Emitters: The Quest for the Right Vector and the Right Radionuclide. Pharmaceutics 2021, 13, 980. [Google Scholar] [CrossRef]
- Pirovano, G.; Jannetti, S.A.; Carter, L.M.; Sadique, A.; Kossatz, S.; Guru, N.; de Souza Franca, P.; Maeda, M.; Zeglis, B.M.; Lewis, J.S.; et al. Targeted brain tumor radiotherapy using an auger emitter. Clin. Cancer Res. 2020, 26, 2871–2881. [Google Scholar] [CrossRef] [PubMed] [Green Version]
- Tavares, A.A.S.; Tavares, J.M.R.S. 99mTc Auger electrons for targeted tumour therapy: A review. Int. J. Radiat. Biol. 2010, 86, 261–270. [Google Scholar] [CrossRef]
- Schipper, M.L.; Riese, C.G.U.; Seitz, S.; Weber, A.; Béhé, M.; Schurrat, T.; Schramm, N.; Keil, B.; Alfke, H.; Behr, T.M. Efficacy of 99mTc pertechnetate and 131I radioisotope therapy in sodium/iodide symporter (NIS)-expressing neuroendocrine tumors in vivo. Eur. J. Nucl. Med. Mol. Imaging 2007, 34, 638–650. [Google Scholar] [CrossRef]
- Maucksch, U.; Runge, R.; Wunderlich, G.; Freudenberg, R.; Naumann, A.; Kotzerke, J. Comparison of the radiotoxicity of the 99mTc-labeled compounds 99mTc-pertechnetate, 99mTc-HMPAO and 99mTc-MIBI. Int. J. Radiat. Biol. 2016, 92, 698–706. [Google Scholar] [CrossRef] [PubMed]
- Narmani, A.; Arani, M.A.A.; Mohammadnejad, J.; Vaziri, A.Z.; Solymani, S.; Yavari, K.; Talebi, F.; Darzi, S.J. Breast Tumor Targeting with PAMAM-PEG-5FU- 99mTc As a New Therapeutic Nanocomplex: In In-vitro and In-vivo studies. Biomed. Microdevices 2020, 22, 31. [Google Scholar] [CrossRef] [PubMed]
- Portulano, C.; Paroder-Belenitsky, M.; Carrasco, N. The Na+/I− Symporter (NIS): Mechanism and Medical Impact. Endocr. Rev. 2014, 35, 106–149. [Google Scholar] [CrossRef] [Green Version]
- Volpe, A.; Man, F.; Lim, L.; Khoshnevisan, A.; Blower, J.; Blower, P.J.; Fruhwirth, G.O. Radionuclide-fluorescence reporter gene imaging to track tumor progression in rodent tumor models. J. Vis. Exp. 2018, 57088. [Google Scholar] [CrossRef] [Green Version]
- Kotzerke, J.; Wendisch, M.; Freudenberg, R.; Runge, R.; Oehme, L.; Meyer, G.J.; Kunz-Schunghart, L.A.; Wunderlich, G. Sodium-iodide symporter positive cells after intracellular uptake of (99m)Tc versus α-emitter 211At. Reduction of clonogenic survival and characterization of DNA damage. Nuklearmedizin 2012, 51, 170–178. [Google Scholar] [CrossRef]
- Freudenberg, R.; Runge, R.; Maucksch, U.; Berger, V.; Kotzerke, J. On the dose calculation at the cellular level and its implications for the RBE of 99mTc and 123I. Med. Phys. 2014, 41, 062503. [Google Scholar] [CrossRef] [PubMed]
- Aerts, A.; Eberlein, U.; Holm, S.; Hustinx, R.; Konijnenberg, M.; Strigari, L.; van Leeuwen, F.W.B.; Glatting, G.; Lassmann, M. EANM position paper on the role of radiobiology in nuclear medicine. Eur. J. Nucl. Med. Mol. Imaging 2021, 48, 1–13. [Google Scholar] [CrossRef]
- Costa, I.M.; Cheng, J.; Osytek, K.M.; Imberti, C.; Terry, S.Y.A. Methods and techniques for in vitro subcellular localization of radiopharmaceuticals and radionuclides. Nucl. Med. Biol. 2021, 98–99, 18–29. [Google Scholar] [CrossRef]
- Jacob, J.; Nadkarni, S.; Volpe, A.; Peng, Q.; Tung, S.L.; Hannen, R.F.; Mohseni, Y.R.; Scotta, C.; Marelli-Berg, F.M.; Lechler, R.I.; et al. Spatiotemporal in vivo tracking of polyclonal human regulatory T cells (Tregs) reveals a role for innate immune cells in Treg transplant recruitment. Mol. Ther. Methods Clin. Dev. 2021, 20, 324–336. [Google Scholar] [CrossRef]
- Belchior, A.; Salvatorre, D.M.; Fernandes, C.; Vaz, P.; Paulo, A.; Raposinho, P. Radiobiological and dosimetric assessment of DNA-intercalated 99mTc-complexes bearing acridine orange derivatives. EJNMMI Res. 2020, 10, 79. [Google Scholar] [CrossRef]
- Kriehuber, R.; Kadenbach, K.; Schultz, F.; Weiss, D.G. Study on cell survival, induction of apoptosis and micronucleus formation in SCL-II cells after exposure to the auger electron emitter 99mTc. Int. J. Radiat. Biol. 2004, 80, 875–880. [Google Scholar] [CrossRef]
- Freudenberg, R.; Wendisch, M.; Runge, R.; Wunderlich, G.; Kotzerke, J. Reduction in clonogenic survival of sodium-iodide symporter (NIS)-positive cells following intracellular uptake of 99mTc versus 188Re. Int. J. Radiat. Biol. 2012, 88, 991–997. [Google Scholar] [CrossRef] [PubMed]
- Wendisch, M.; Freudenberg, R.; Drechsel, J.; Runge, R.; Wunderlich, G.; Kotzerke, J. 99mTc reduces clonogenic survival after intracellular uptake in NIS-positive cells in vitro more than 131I. Nuklearmedizin 2010, 49, 154–160. [Google Scholar] [CrossRef] [PubMed]
- Figueiredo, D.; Fernandes, C.; Silva, F.; Palma, E.; Raposinho, P.; Belchior, A.; Vaz, P.; Paulo, A. Synthesis and Biological Evaluation of 99mTc(I) Tricarbonyl Complexes Dual-Targeted at Tumoral Mitochondria. Molecules 2021, 26, 441. [Google Scholar] [CrossRef]
- Othman, M.F.B.; Mitry, N.R.; Lewington, V.J.; Blower, P.J.; Terry, S.Y.A. Re-assessing gallium-67 as a therapeutic radionuclide. Nucl. Med. Biol. 2017, 46, 12–18. [Google Scholar] [CrossRef] [Green Version]
- Osytek, K.M.; Blower, P.J.; Costa, I.M.; Smith, G.E.; Abbate, V.A.; Terry, S.Y.A. In vitro proof of concept studies of radiotoxicity from Auger electron-emitter thallium-201. EJNMMI Res. 2021, 11, 63. [Google Scholar] [CrossRef] [PubMed]
- Uusijärvi, H.; Bernhardt, P.; Ericsson, T.; Forssell-Aronsson, E. Dosimetric characterization of radionuclides for systemic tumor therapy: Influence of particle range, photon emission, and subcellular distribution. Med. Phys. 2006, 33, 3260–3269. [Google Scholar] [CrossRef]
- Filosofov, D.; Kurakina, E.; Radchenko, V. Potent candidates for Targeted Auger Therapy: Production and radiochemical considerations. Nucl. Med. Biol. 2021, 94–95, 1–19. [Google Scholar] [CrossRef]
- Pouget, J.-P.; Lozza, C.; Deshayes, E.; Boudousq, V.; Navarro-Teulon, I. Introduction to radiobiology of targeted radionuclide therapy. Front. Med. 2015, 2, 12. [Google Scholar] [CrossRef] [Green Version]
- Volpe, A.; Lang, C.; Lim, L.; Man, F.; Kurtys, E.; Ashmore-Harris, C.; Johnson, P.; Skourti, E.; de Rosales, R.T.M.; Fruhwirth, G.O. Spatiotemporal PET Imaging Reveals Differences in CAR-T Tumor Retention in Triple-Negative Breast Cancer Models. Mol. Ther. 2020, 28, 2271–2285. [Google Scholar] [CrossRef] [PubMed]
- Vaziri, B.; Wu, H.; Dhawan, A.P.; Du, P.; Howell, R.W. SNMMI MIRD CommitteeMIRD pamphlet No. 25: MIRDcell V2.0 software tool for dosimetric analysis of biologic response of multicellular populations. J. Nucl. Med. 2014, 55, 1557–1564. [Google Scholar] [CrossRef] [PubMed] [Green Version]


Publisher’s Note: MDPI stays neutral with regard to jurisdictional claims in published maps and institutional affiliations. |
© 2021 by the authors. Licensee MDPI, Basel, Switzerland. This article is an open access article distributed under the terms and conditions of the Creative Commons Attribution (CC BY) license (https://creativecommons.org/licenses/by/4.0/).
Share and Cite
Costa, I.M.; Siksek, N.; Volpe, A.; Man, F.; Osytek, K.M.; Verger, E.; Schettino, G.; Fruhwirth, G.O.; Terry, S.Y.A. Relationship of In Vitro Toxicity of Technetium-99m to Subcellular Localisation and Absorbed Dose. Int. J. Mol. Sci. 2021, 22, 13466. https://doi.org/10.3390/ijms222413466
Costa IM, Siksek N, Volpe A, Man F, Osytek KM, Verger E, Schettino G, Fruhwirth GO, Terry SYA. Relationship of In Vitro Toxicity of Technetium-99m to Subcellular Localisation and Absorbed Dose. International Journal of Molecular Sciences. 2021; 22(24):13466. https://doi.org/10.3390/ijms222413466
Chicago/Turabian StyleCosta, Ines M., Noor Siksek, Alessia Volpe, Francis Man, Katarzyna M. Osytek, Elise Verger, Giuseppe Schettino, Gilbert O. Fruhwirth, and Samantha Y. A. Terry. 2021. "Relationship of In Vitro Toxicity of Technetium-99m to Subcellular Localisation and Absorbed Dose" International Journal of Molecular Sciences 22, no. 24: 13466. https://doi.org/10.3390/ijms222413466
APA StyleCosta, I. M., Siksek, N., Volpe, A., Man, F., Osytek, K. M., Verger, E., Schettino, G., Fruhwirth, G. O., & Terry, S. Y. A. (2021). Relationship of In Vitro Toxicity of Technetium-99m to Subcellular Localisation and Absorbed Dose. International Journal of Molecular Sciences, 22(24), 13466. https://doi.org/10.3390/ijms222413466