
Towards Understanding Excited-State Properties of Organic Molecules Using Time-Resolved Soft X-ray Absorption Spectroscopy


Abstract
:1. Introduction
2. Results and Discussion
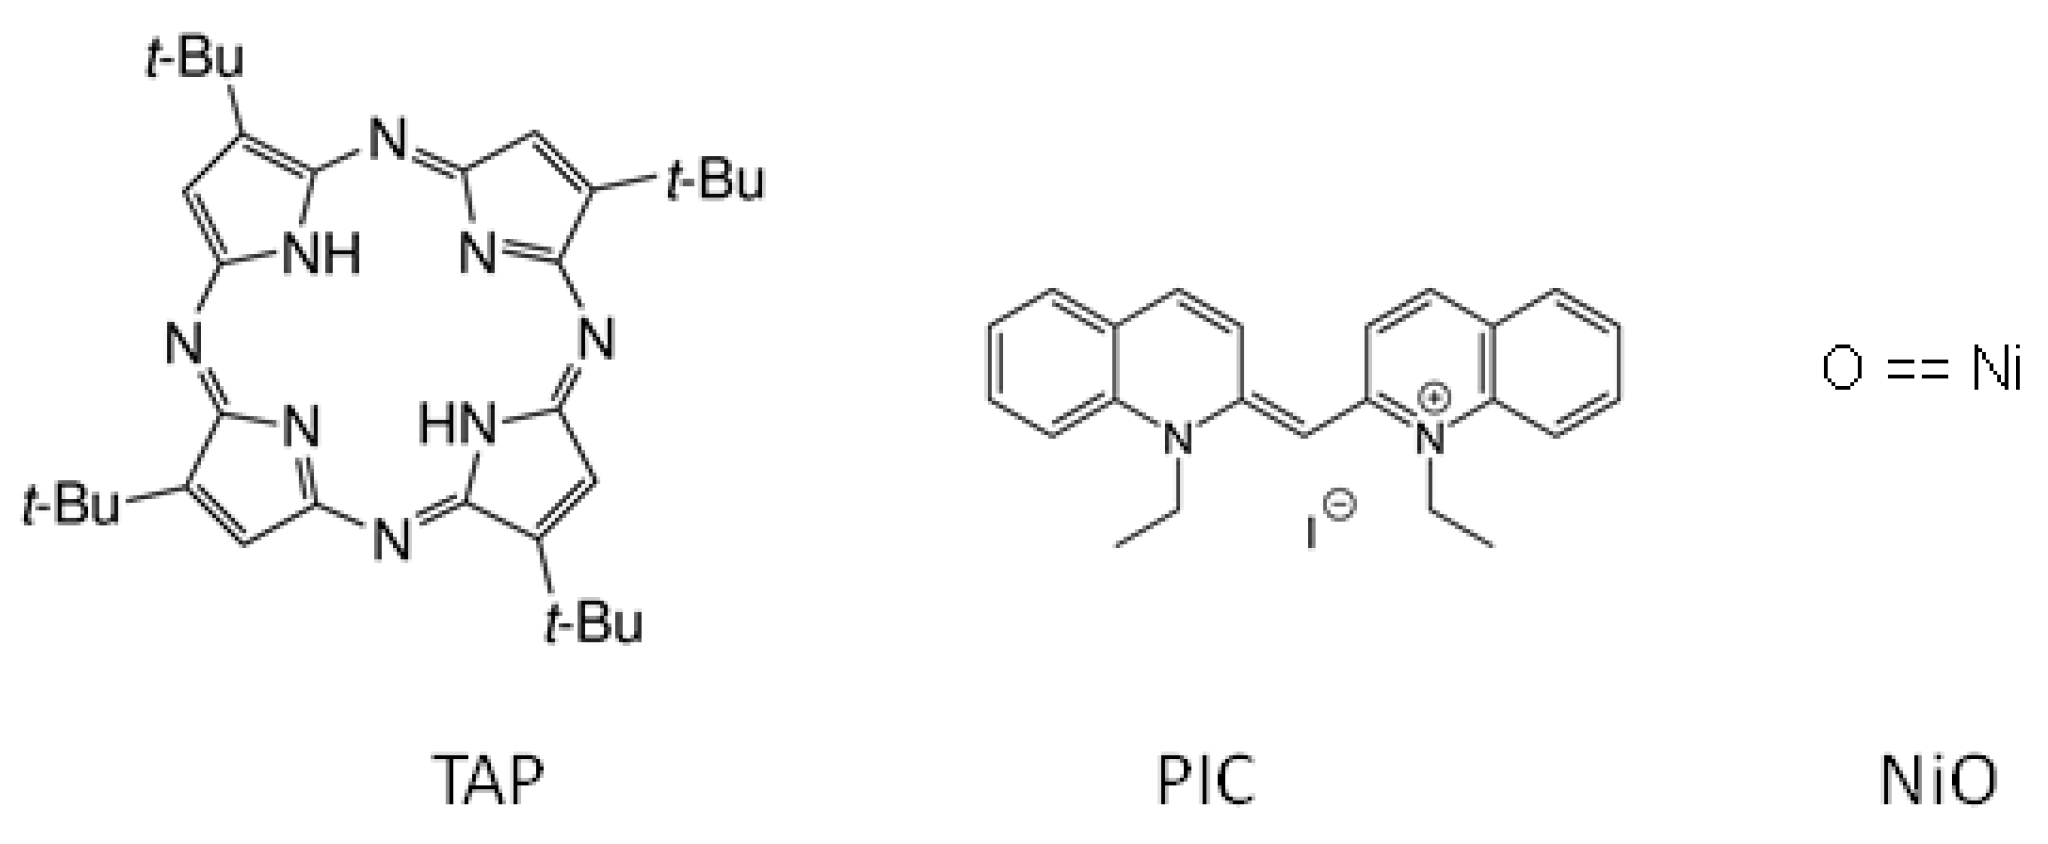
2.1. TAP
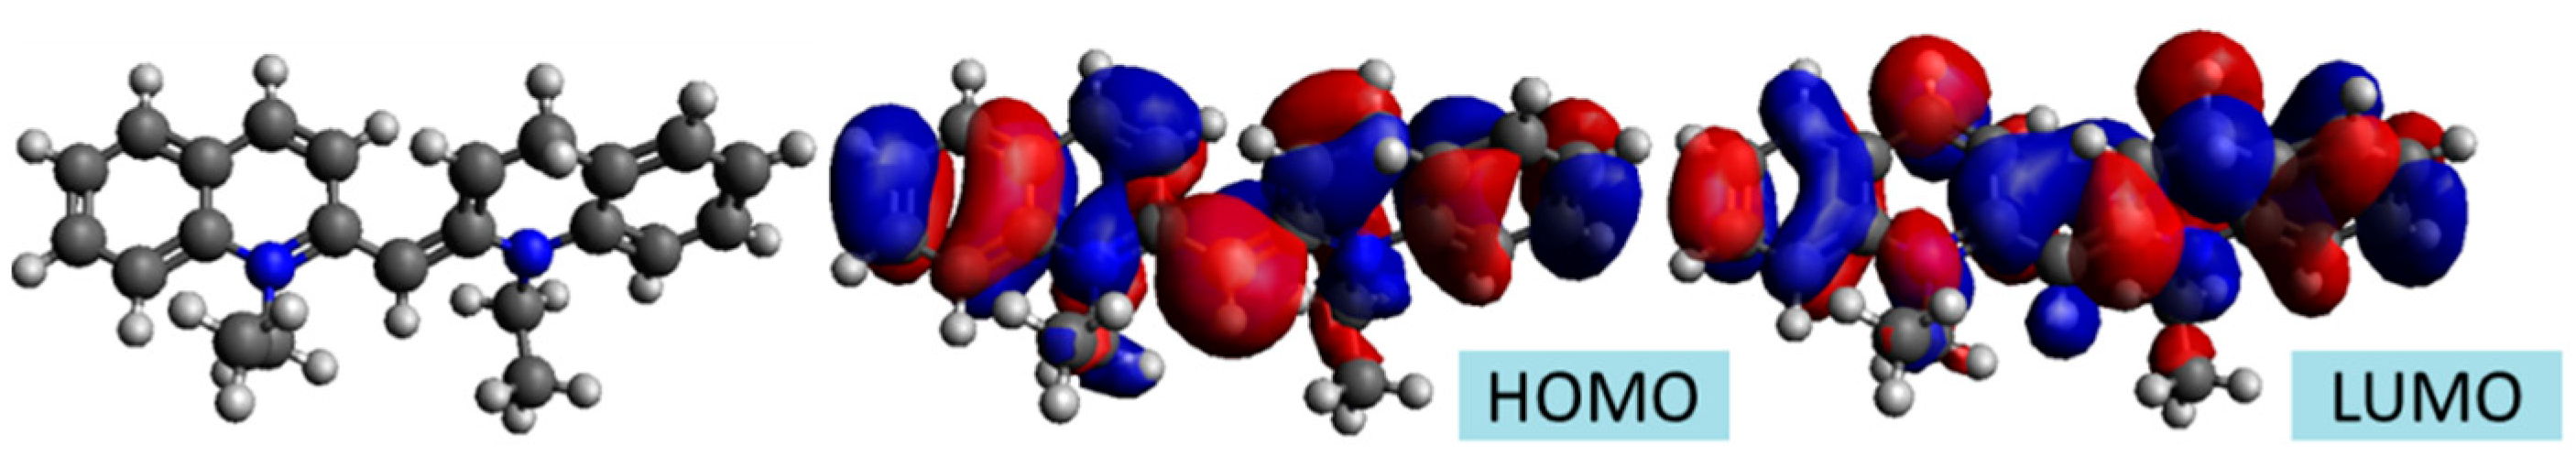
2.2. PIC
2.3. NiO
3. Materials and Methods
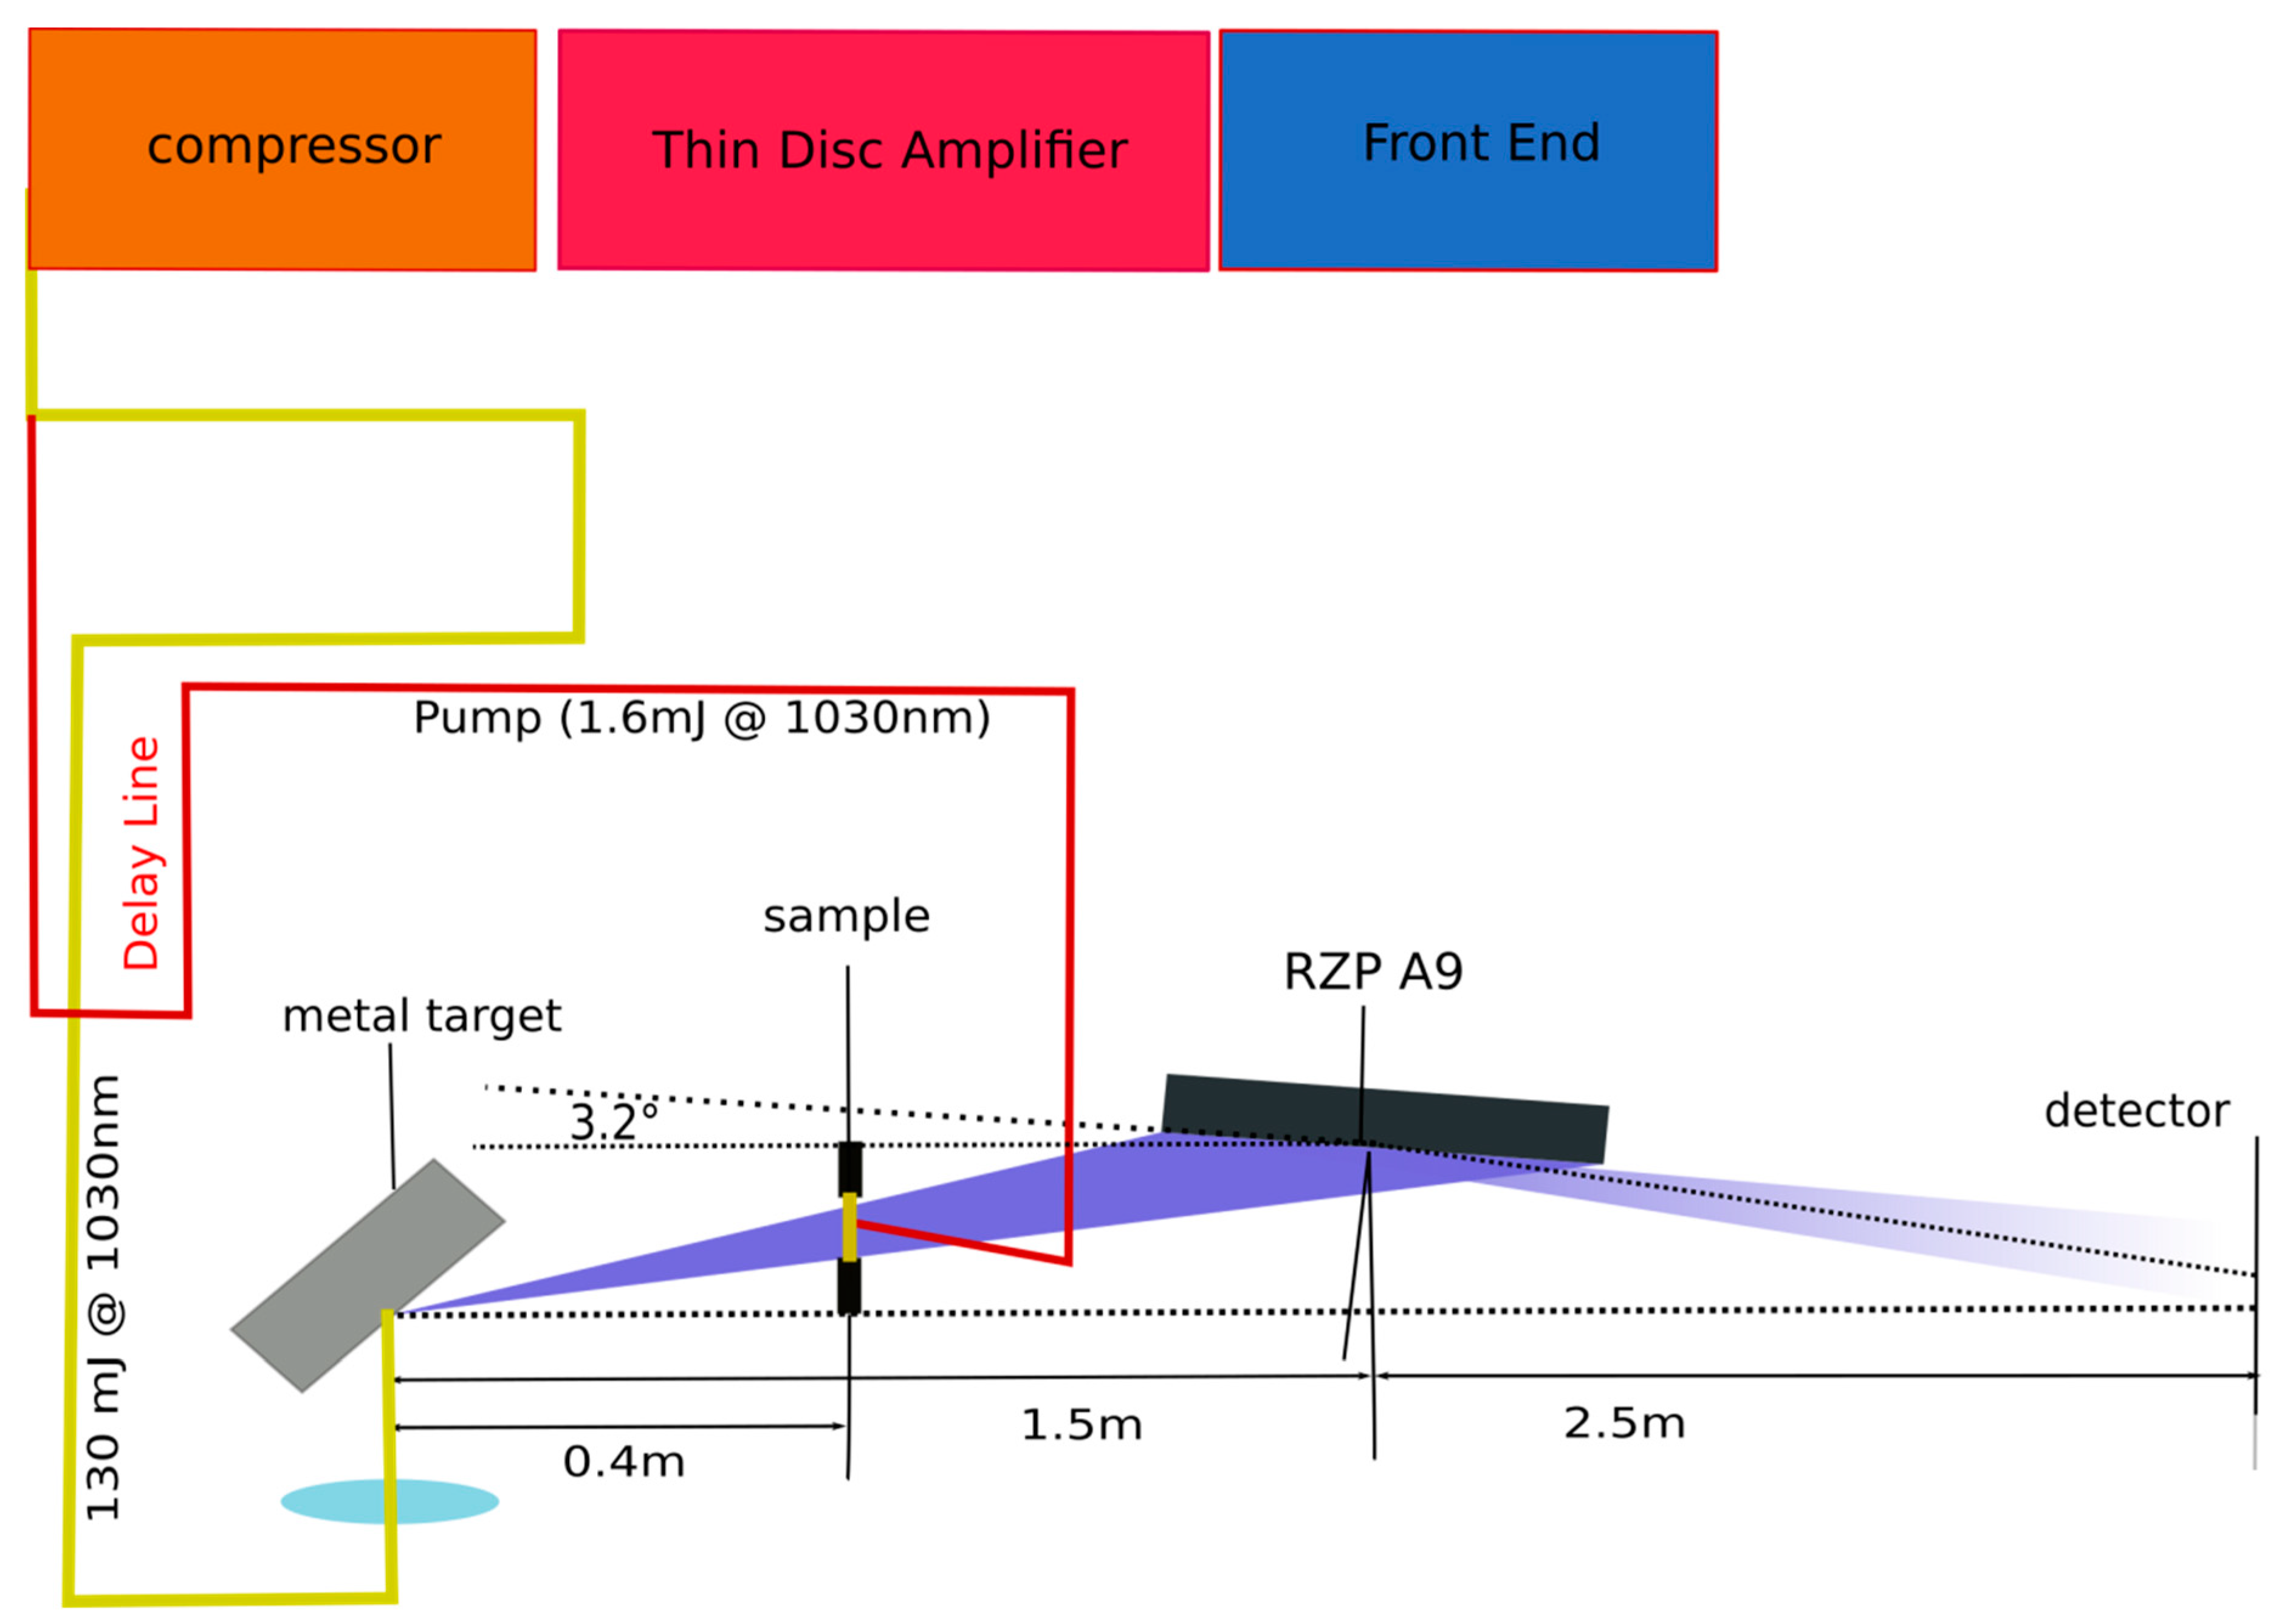
3.1. Experimental
3.1.1. Laser Produced Plasma Sources
3.1.2. Reflection Zone Plate Optics
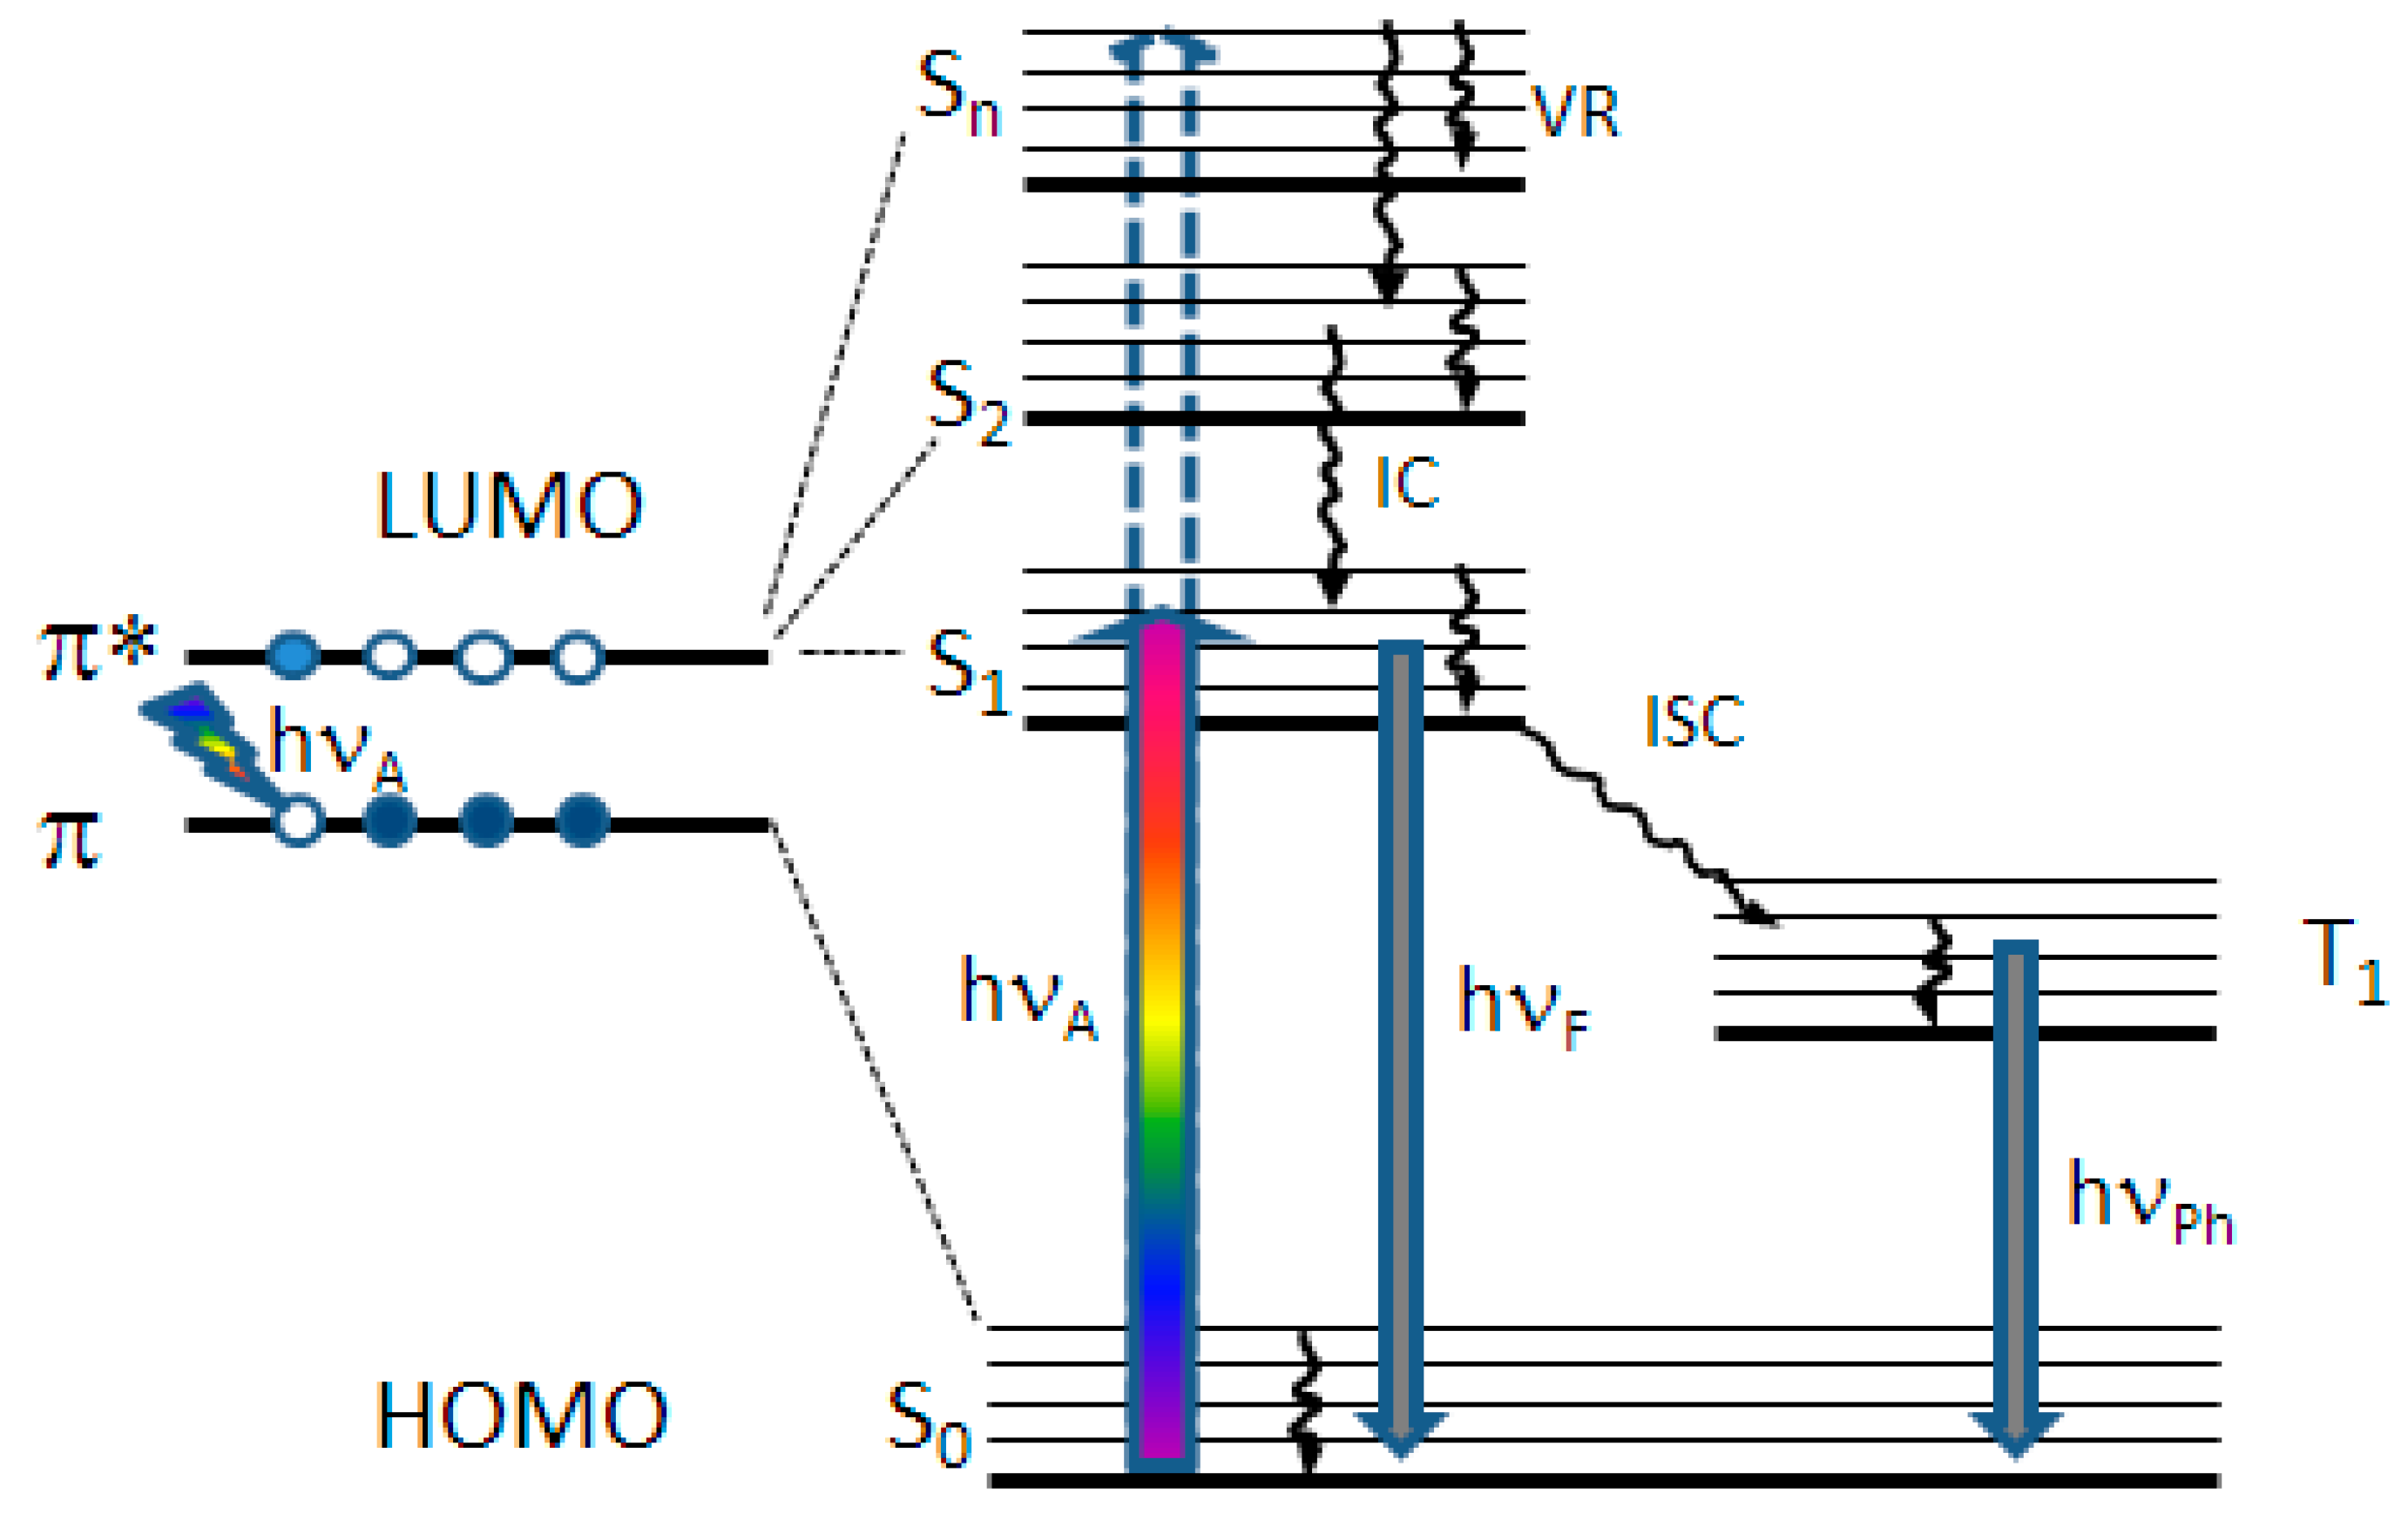
3.1.3. General Considerations for Optical Pump X-ray Probe Experiments on Organic Molecules
3.2. Materials
3.3. NiO
3.4. TAP
3.5. PIC
3.6. DFT Simulations
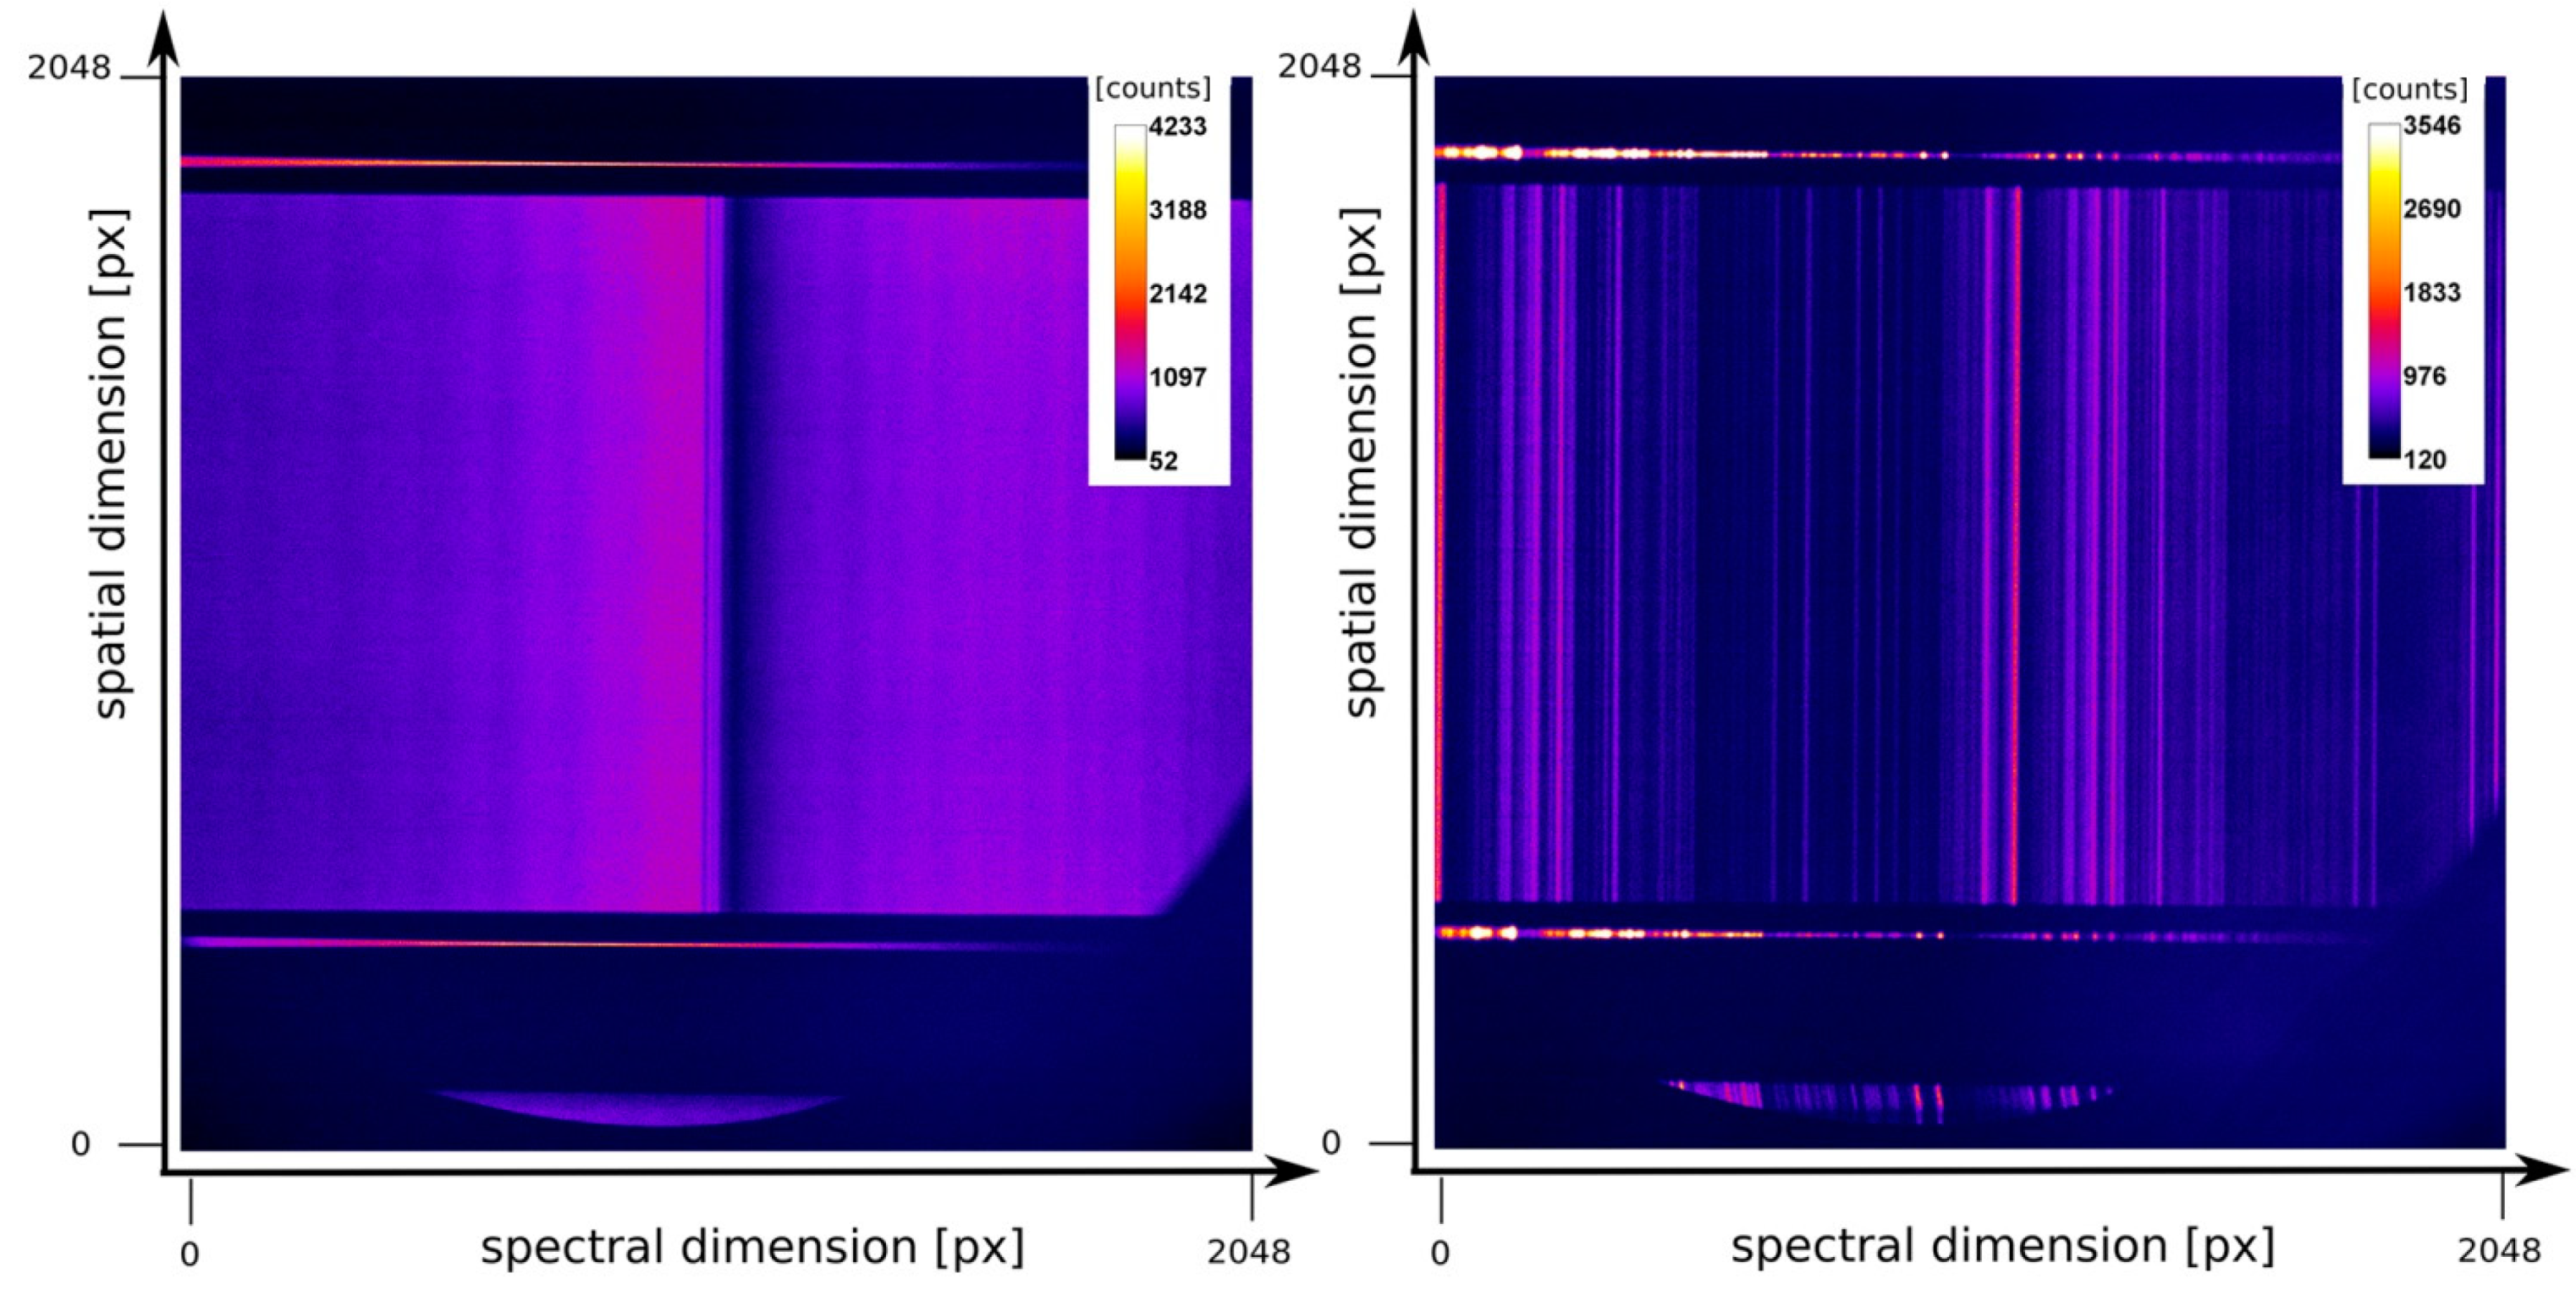
3.7. Detectors and Data Acquisition
4. Conclusions and Outlook
Supplementary Materials
Author Contributions
Funding
Institutional Review Board Statement
Informed Consent Statement
Data Availability Statement
Acknowledgments
Conflicts of Interest
References
- Porter, G. Flash Photolysis and Some of Its Applications, Nobel Lecture. 11 December 1967. Available online: https://www.nobelprize.org/prizes/chemistry/1967/porter/lecture/ (accessed on 12 October 2021).
- Porter, G.; Topp, M.R. Nanosecond flash photolysis and absorption spectra of excited singlet states. Nature 1968, 220, 1228–1229. [Google Scholar] [CrossRef]
- Zewail, A.H. Femtochemistry: Atomic-scale dynamics of the chemical bond. J. Phys. Chem. A 2000, 104, 5660–5694. [Google Scholar] [CrossRef]
- Maiuri, M.; Garavelli, M.; Cerullo, G. Ultrafast Spectroscopy: State of the Art and Open Challenges. J. Am. Chem. Soc. 2020, 142, 3–15. [Google Scholar] [CrossRef]
- Meyer, Y.H.; Pittman, M.; Plaza, P. Transient absorption of symmetrical carbocyanines. J. Photochem. Photobiol. A Chem. 1998, 114, 1–21. [Google Scholar] [CrossRef]
- Ma, F.; Yartsev, A. Ultrafast photoisomerization of pinacyanol: Watching an excited state reaction transiting from barrier to barrierless forms. RSC Adv. 2016, 6, 45210–45218. [Google Scholar] [CrossRef]
- Bruggemann, B.; May, V. Exciton exciton annihilation dynamics in chromophore complexes. II. Intensity dependent transient absorption of the LH2 antenna system. J. Chem. Phys. 2004, 120, 2325–2336. [Google Scholar] [CrossRef]
- Ma, F. Dynamics and Coherent Control of Exciton-Exciton Annihilation in Aqueous J-Aggregate. J. Phys. Chem. B 2018, 122, 10746–10753. [Google Scholar] [CrossRef]
- Stiel, H.; Volkmer, A.; Ruckmann, I.; Zeug, A.; Ehrenberg, B.; Röder, B. Non-linear and transient absorption spectroscopy of magnesium(II)-tetrabenzoporphyrin in solution. Opt. Commun. 1998, 155, 135–143. [Google Scholar] [CrossRef]
- Gobeze, H.B.; Das, S.K.; D’Souza, F. Femtosecond Transient Absorption Study of Supramolecularly Assembled Metal Tetrapyrrole-TiO2 Thin Films. J. Phys. Chem. C 2014, 118, 16660–16671. [Google Scholar] [CrossRef]
- Ha-Thi, M.H.; Pham, V.T.; Pino, T.; Maslova, V.; Quaranta, A.; Lefumeux, C.; Leibl, W.; Aukauloo, A. Photoinduced electron transfer in a molecular dyad by nanosecond pump-pump-probe spectroscopy. Photochem. Photobiol. Sci. 2018, 17, 903–909. [Google Scholar] [CrossRef]
- Kim, D.; Kirmaier, C.; Holten, D. Nickel porphyrin photophysics and photochemistry. A picosecond investigation of ligand binding and release in the excited state. Chem. Phys. 1983, 75, 305–322. [Google Scholar] [CrossRef]
- Zamyatin, A.V.; Gusev, A.V.; Rodgers, M.A.J. Two-pump-one-probe femtosecond studies of Ni(II) porphyrins excited states. J. Am. Chem. Soc. 2004, 126, 15934–15935. [Google Scholar] [CrossRef] [PubMed]
- Shelby, M.L.; Lestrange, P.J.; Jackson, N.E.; Haldrup, K.; Mara, M.W.; Stickrath, A.B.; Zhu, D.; Lemke, H.T.; Chollet, M.; Hoffman, B.M.; et al. Ultrafast Excited State Relaxation of a Metalloporphyrin Revealed by Femtosecond X-ray Absorption Spectroscopy. J. Am. Chem. Soc. 2016, 138, 8752–8764. [Google Scholar] [CrossRef] [Green Version]
- Larsen, D.S.; Papagiannakis, E.; van Stokkum, I.H.M.; Vengris, M.; Kennis, J.T.M.; van Grondelle, R. Excited state dynamics of b-carotene explored with dispersed multi-pulse transient absorption. Chem. Phys. Lett. 2003, 381, 733–742. [Google Scholar] [CrossRef]
- Vdovic, S.; Wang, Y.Y.; Li, B.X.; Qiu, M.; Wang, X.F.; Guo, Q.J.; Xia, A.D. Excited state dynamics of beta-carotene studied by means of transient absorption spectroscopy and multivariate curve resolution alternating least-squares analysis. Phys. Chem. Chem. Phys. 2013, 15, 20026–20036. [Google Scholar] [CrossRef]
- Antognazza, M.R.; Luer, L.; Polli, D.; Christensen, R.L.; Schrock, R.R.; Lanzani, G.; Cerullo, G. Ultrafast excited state relaxation in long-chain polyenes. Chem. Phys. 2010, 373, 115–121. [Google Scholar] [CrossRef]
- Polivka, T.; Sundström, V. Ultrafast dynamics of carotenoid excited states-from solution to natural and artificial systems. Chem. Rev. 2004, 104, 2021–2071. [Google Scholar] [CrossRef]
- Kosumi, D.; Maruta, S.; Horibe, T.; Fujii, R.; Sugisaki, M.; Cogdell, R.J.; Hashimoto, H. Ultrafast Energy-Transfer Pathway in a Purple-Bacterial Photosynthetic Core Antenna, as Revealed by Femtosecond Time-Resolved Spectroscopy. Angew. Chem. Int. Ed. 2011, 50, 1097–1100. [Google Scholar] [CrossRef]
- Zinth, W.; Wachtveitl, J. The first picoseconds in bacterial photosynthesis—Ultrafast electron transfer for the efficient conversion of light energy. Chemphyschem 2005, 6, 871–880. [Google Scholar] [CrossRef]
- Finkele, U.; Lauterwasser, C.; Struck, A.; Scheer, H.; Zinth, W. Primary electron transfer kinetics in bacterial reaction centers with modified bacteriochlorophylls at the monomeric sites BA,B. Proc. Natl. Acad. Sci. USA 1992, 89, 9514–9518. [Google Scholar] [CrossRef] [PubMed] [Green Version]
- Yukihira, N.; Sugai, Y.; Fujiwara, M.; Kosumi, D.; Iha, M.; Sakaguchi, K.; Katsumura, S.; Gardiner, A.T.; Cogdell, R.J.; Hashimoto, H. Strategies to enhance the excitation energy-transfer efficiency in a light-harvesting system using the intramolecular charge transfer character of carotenoids. Faraday Discuss. 2017, 198, 59–71. [Google Scholar] [CrossRef] [Green Version]
- Klug, D.R.; Rech, T.; Joseph, D.M.; Barber, J.; Durrant, J.R.; Porter, G. Primary processes in isolated photosystem-II reaction centers probed by magic-angle transient absorption spectroscopy. Chem. Phys. 1995, 194, 433–442. [Google Scholar] [CrossRef]
- Croce, R.; van Amerongen, H. Light harvesting in oxygenic photosynthesis: Structural biology meets spectroscopy. Science 2020, 369, eaay2058. [Google Scholar] [CrossRef] [PubMed]
- Lambrev, P.H.; Akhtar, P.; Tan, H.S. Insights into the mechanisms and dynamics of energy transfer in plant light-harvesting complexes from two-dimensional electronic spectroscopy. BBA-Bioenergetics 2020, 1861, 148050. [Google Scholar] [CrossRef] [PubMed]
- Holleboom, C.P.; Walla, P.J. The back and forth of energy transfer between carotenoids and chlorophylls and its role in the regulation of light harvesting. Photosynth. Res 2014, 119, 215–221. [Google Scholar] [CrossRef]
- Ross, M.; Andersen, A.; Fox, Z.W.; Zhang, Y.; Hong, K.; Lee, J.-H.; Cordones, A.; March, A.M.; Doumy, G.; Southworth, S.H.; et al. Comprehensive Experimental and Computational Spectroscopic Study of Hexacyanoferrate Complexes in Water: From Infrared to X-ray Wavelengths. J. Phys. Chem. B 2018, 122, 5075–5086. [Google Scholar] [CrossRef] [PubMed]
- Segatta, F.; Nenov, A.; Orlandi, S.; Arcioni, A.; Mukamel, S.; Garavelli, M. Exploring the capabilities of optical pump X-ray probe NEXAFS spectroscopy to track photo-induced dynamics mediated by conical intersections. Faraday Discuss. 2020, 221, 245–264. [Google Scholar] [CrossRef]
- Pandey, R.K.; Mukamel, S. Simulation of X-ray absorption near edge spectra of organometallic compounds in the ground and optically excited states. J. Phys. Chem. A 2007, 111, 805–816. [Google Scholar] [CrossRef]
- Kowalewski, M.; Fingerhut, B.P.; Dorfman, K.E.; Bennett, K.; Mukamel, S. Simulating Coherent Multidimensional Spectroscopy of Nonadiabatic Molecular Processes: From the Infrared to the X-ray Regime. Chem. Rev. 2017, 117, 12165–12226. [Google Scholar] [CrossRef]
- Stiel, H.; Leupold, D.; Beck, M.; Will, I.; Lokstein, H.; Sandner, W. Towards time resolved, coupled structure-function information on carotenoid excited state processes: X-ray and optical short pulse double resonance spectroscopy. J. Biomed. Biophys. Methods 2001, 48, 239–246. [Google Scholar] [CrossRef]
- Wolf, T.J.A.; Myhre, R.H.; Cryan, J.P.; Coriani, S.; Squibb, R.J.; Battistoni, A.; Berrah, N.; Bostedt, C.; Bucksbaum, P.; Coslovich, G.; et al. Probing ultrafast ππ*/nπ* internal conversion in organic chromophores via K-edge resonant absorption. Nat. Commun. 2017, 8, 29. [Google Scholar] [CrossRef] [Green Version]
- Hua, W.; Mukamel, S.; Luo, Y. Transient X-ray Absorption Spectral Fingerprints of the S1 Dark State in Uracil. J. Phys. Chem. Lett. 2019, 10, 7172–7178. [Google Scholar] [CrossRef]
- Jonas, A.; Dammer, K.; Stiel, H.; Kanngiesser, B.; Sánchez-de-Armas, R.; Mantouvalou, I. Transient Sub-nanosecond Soft X-ray NEXAFS Spectroscopy on Organic Thin Films. Anal. Chem. 2020, 92, 15611–15615. [Google Scholar] [CrossRef]
- Moulet, A.; Bertrand, J.B.; Klostermann, T.; Guggenmos, A.; Karpowicz, N.; Goulielmakis, E. Soft x-ray excitonics. Science 2017, 357, 1134–1137. [Google Scholar] [CrossRef] [PubMed] [Green Version]
- Scholz, M.; Holch, F.; Sauer, C.; Wiessner, M.; Scholl, A.; Reinert, F. Core Hole-Electron Correlation in Coherently Coupled Molecules. Phys. Rev. Lett. 2013, 111, 048102. [Google Scholar] [CrossRef]
- Ryland, E.S.; Lin, M.-F.; Verkamp, M.A.; Zhang, K.; Benke, K.; Carlson, M.; Vura-Weis, J. Tabletop Femtosecond M-edge X-ray Absorption Near-Edge Structure of FeTPPCl: Metalloporphyrin Photophysics from the Perspective of the Metal. J. Am. Chem. Soc. 2018, 140, 4691–4696. [Google Scholar] [CrossRef]
- Kern, J.; Alonso-Mori, R.; Tran, R.; Hattne, J.; Gildea, R.J.; Echols, N.; Glöckner, C.; Hellmich, J.; Laksmono, H.; Sierra, R.G.; et al. Simultaneous Femtosecond X-ray Spectroscopy and Diffraction of Photosystem II at Room Temperature. Science 2013, 340, 491–495. [Google Scholar] [CrossRef] [Green Version]
- Van Kuiken, B.E.; Huse, N.; Cho, H.; Strader, M.L.; Lynch, M.S.; Schoenlein, R.W.; Khalil, M. Probing the Electronic Structure of a Photoexcited Solar Cell Dye with Transient X-ray Absorption Spectroscopy. J. Phys. Chem. Lett. 2012, 3, 1695–1700. [Google Scholar] [CrossRef] [PubMed]
- Hillyard, P.W.; Kuchibhatla, S.; Glover, T.E.; Hertlein, M.P.; Huse, N.; Nachimuthu, P.; Saraf, L.V.; Thevuthasan, S.; Gaffney, K.J. Atomic resolution mapping of the excited-state electronic structure of Cu2O with time-resolved x-ray absorption spectroscopy. Phys. Rev. B 2009, 80, 125210. [Google Scholar] [CrossRef]
- Kim, J.; Kim, K.H.; Oang, K.Y.; Lee, J.H.; Hong, K.; Cho, H.; Huse, N.; Schoenlein, R.W.; Kim, T.K.; Ihee, H. Tracking reaction dynamics in solution by pump-probe X-ray absorption spectroscopy and X-ray liquidography (solution scattering). Chem. Commun. 2016, 52, 3734–3749. [Google Scholar] [CrossRef] [PubMed] [Green Version]
- Kleine, C.; Ekimova, M.; Goldsztejn, G.; Raabe, S.; Strüber, C.; Ludwig, J.; Yarlagadda, S.; Eisebitt, S.; Vrakking, M.J.J.; Elsaesser, T.; et al. Soft X-ray Absorption Spectroscopy of Aqueous Solutions Using a Table-Top Femtosecond Soft X-ray Source. J. Phys. Chem. Lett. 2019, 10, 52–58. [Google Scholar] [CrossRef]
- Buades, B.; Picon, A.; Berger, E.; Leon, I.; Di Palo, N.; Cousin, S.L.; Cocchi, C.; Pellegrin, E.; Martin, J.H.; Manas-Valero, S.; et al. Attosecond state-resolved carrier motion in quantum materials probed by soft x-ray XANES. Appl. Phys. Rev. 2021, 8, 011408. [Google Scholar] [CrossRef]
- Jonas, A.; Staeck, S.; Kanngießer, B.; Stiel, H.; Mantouvalou, I. Laboratory quick near edge x-ray absorption fine structure spectroscopy in the soft x-ray range with 100 Hz frame rate using CMOS technology. Rev. Sci. Instrum. 2021, 92, 023102. [Google Scholar] [CrossRef]
- Jonas, A.; Stiel, H.; Glöggler, L.; Dahm, D.; Dammer, K.; Kanngießer, B.; Mantouvalou, I. Towards Poisson noise limited optical pump soft X-ray probe NEXAFS spectroscopy using a laser-produced plasma source. Opt. Express 2019, 27, 36524–36537. [Google Scholar] [CrossRef] [PubMed]
- Cordones, A.A.; Pemmaraju, C.D.; Lee, J.H.; Zegkinoglou, I.; Ragoussi, M.-E.; Himpsel, F.J.; de la Torre, G.; Schoenlein, R.W. Excited-State Charge Distribution of a Donor−π–Acceptor Zn Porphyrin Probed by N K-Edge Transient Absorption Spectroscopy. J. Phys. Chem. Lett. 2021, 12, 1182–1188. [Google Scholar] [CrossRef]
- Urquhart, S.G.; Martinson, M.; Eger, S.; Murcia, V.; Ade, H.; Collins, B.A. Connecting Molecular Conformation to Aggregation in P3HT Using Near Edge X-ray Absorption Fine Structure Spectroscopy. J. Phys. Chem. C 2017, 121, 21720–21728. [Google Scholar] [CrossRef]
- Davoli, I.; Marcelli, A.; Bianconi, A.; Tomellini, M.; Fanfoni, M. Multielectron configurations in the x-ray-absorption near-edge structure of NiO at the oxygen K threshold. Phys. Rev. B 1986, 33, 2979–2982. [Google Scholar] [CrossRef] [PubMed]
- Ikeno, H.; Tanaka, I.; Koyama, Y.; Mizoguchi, T.; Ogasawara, K. First-principles multielectron calculations of Ni L2,3 NEXAFS and ELNES for LiNiO2 and related compounds. Phys. Rev. B 2005, 72, 075123. [Google Scholar] [CrossRef]
- Jonas, A.; Meurer, T.; Kanngießer, B.; Mantouvalou, I. Note: Reflection zone plates as highly resolving broadband optics for soft X-ray laboratory spectrometers. Rev. Sci. Instrum. 2018, 89, 026108. [Google Scholar] [CrossRef]
- Finazzi, M.; Brookes, N.; De Groot, F. 2p3s3p, 2p3p3p, and 2p3s3s resonant Auger spectroscopy from NiO. Phys. Rev. B 1999, 59, 9933–9942. [Google Scholar] [CrossRef] [Green Version]
- Stiel, H.; Braenzel, J.; Tuemmler, J.; Jonas, A.; Mantouvalou, I.; Erko, A.; Heilmann, A.; Moerbeck-Bock, M.; Schnuerer, M. Ultrafast NEXAFS Spectroscopy in the Lab Using Laser-Based Sources and Advanced X-Ray Optics; SPIE: Bellingham, WA, USA, 2021; Volume 11886. [Google Scholar]
- Schick, D.; Borchert, M.; Braenzel, J.; Stiel, H.; Tümmler, J.; Bürgler, D.E.; Firsov, A.; von Korff Schmising, C.; Pfau, B.; Eisebitt, S. Laser-driven resonant magnetic soft-x-ray scattering for probing ultrafast antiferromagnetic and structural dynamics. Optica 2021, 8, 1237–1242. [Google Scholar] [CrossRef]
- Mantouvalou, I.; Witte, K.; Grötzsch, D.; Neitzel, M.; Günther, S.; Baumann, J.; Jung, R.; Stiel, H.; Kanngießer, B.; Sandner, W. High average power, highly brilliant laser-produced plasma source for soft X-ray spectroscopy. Rev. Sci. Instrum. 2015, 86, 035116. [Google Scholar] [CrossRef]
- Mantouvalou, I.; Jung, R.; Tuemmler, J.; Legall, H.; Bidu, T.; Stiel, H.; Malzer, W.; Kanngießer, B.; Sandner, W. Note: Study of extreme ultraviolet and soft x-ray emission of metal targets produced by laser-plasma-interaction. Rev. Sci. Instrum. 2011, 82, 066103. [Google Scholar] [CrossRef] [Green Version]
- Mantouvalou, I.; Witte, K.; Martyanov, W.; Jonas, A.; Grötzsch, D.; Streeck, C.; Löchel, H.; Rudolph, I.; Erko, A.; Stiel, H.; et al. Single shot near edge x-ray absorption fine structure spectroscopy in the laboratory. Appl. Phys. Lett. 2016, 108, 201106. [Google Scholar] [CrossRef]
- Vogt, U.; Wilhein, T.; Stiel, H.; Legall, H. High resolution x-ray absorption spectroscopy using a laser plasma radiation source. Rev. Sci. Instrum. 2004, 75, 4606–4609. [Google Scholar] [CrossRef]
- Probst, J.; Braig, C.; Erko, A. Flat Field Soft X-ray Spectrometry with Reflection Zone Plates on a Curved Substrate. Appl. Sci. 2020, 10, 7210. [Google Scholar] [CrossRef]
- Hakkoum, H.; Tibermacine, T.; Sengouga, N.; Belahssen, O.; Ghougali, M.; Benhaya, A.; Moumen, A.; Comini, E. Effect of the source solution quantity on optical characteristics of ZnO and NiO thin films grown by spray pyrolysis for the design NiO/ZnO photodetectors. Opt. Mater. 2020, 108, 110434. [Google Scholar] [CrossRef]
- Gouterman, M.; Wagniere, G.H. Spectra of porphyrins Part II: Four orbital model. J. Mol. Spectr. 1963, 11, 108–127. [Google Scholar] [CrossRef]
- Braenzel, J.; Pratsch, C.; Hilz, P.; Kreuzer, C.; Schnürer, M.; Stiel, H.; Sandner, W. Note: Thickness determination of freestanding ultra-thin foils using a table top laboratory extreme ultraviolet source. Rev. Sci. Instrum. 2013, 84, 3. [Google Scholar] [CrossRef]
- Vladimir, V.; Shelkovnikov, A.I.P. Optical and Resonant Non-Linear Optical Properties of J-Aggregates of Pseudoisocyanine Derivatives in Thin Solid Films, 41st ed.; InTEch: London, UK, 2013; Volume 1. [Google Scholar]
- Sosa, M.L.; Wong, C.Y. Revealing the evolving mixture of molecular aggregates during organic film formation using simulations of in situ absorbance. J. Chem. Phys. 2020, 153, 214902. [Google Scholar] [CrossRef]
- Neese, F.; Wennmohs, F.; Becker, U.; Riplinger, C. The ORCA quantum chemistry program package. J. Chem. Phys. 2020, 152, 224108. [Google Scholar] [CrossRef] [PubMed]
- Feng, T.; Heilmann, A.; Bock, M.; Ehrentraut, L.; Witting, T.; Yu, H.; Stiel, H.; Eisebitt, S.; Schnürer, M. 27 W 2.1 µm OPCPA system for coherent soft X-ray generation operating at 10 kHz. Opt. Express 2020, 28, 8724–8733. [Google Scholar] [CrossRef]
- Marberger, A.; Petrov, A.W.; Steiger, P.; Elsener, M.; Kröcher, O.; Nachtegaal, M.; Ferri, D. Time-resolved copper speciation during selective catalytic reduction of NO on Cu-SSZ-13. Nat. Catal. 2018, 1, 221–227. [Google Scholar] [CrossRef]
- Ekimova, M.; Quevedo, W.; Faubel, M.; Wernet, P.; Nibbering, E.T.J. A liquid flatjet system for solution phase soft-x-ray spectroscopy. Struct. Dyn. 2015, 2, 054301. [Google Scholar] [CrossRef] [PubMed] [Green Version]
- Grötzsch, D.; Streeck, C.; Nietzold, C.; Malzer, W.; Mantouvalou, I.; Nutsch, A.; Dietrich, P.; Unger, W.; Beckhoff, B.; Kanngießer, B. A sealable ultrathin window sample cell for the study of liquids by means of soft X-ray spectroscopy. Rev. Sci. Instrum. 2017, 88, 123112. [Google Scholar] [CrossRef] [PubMed]


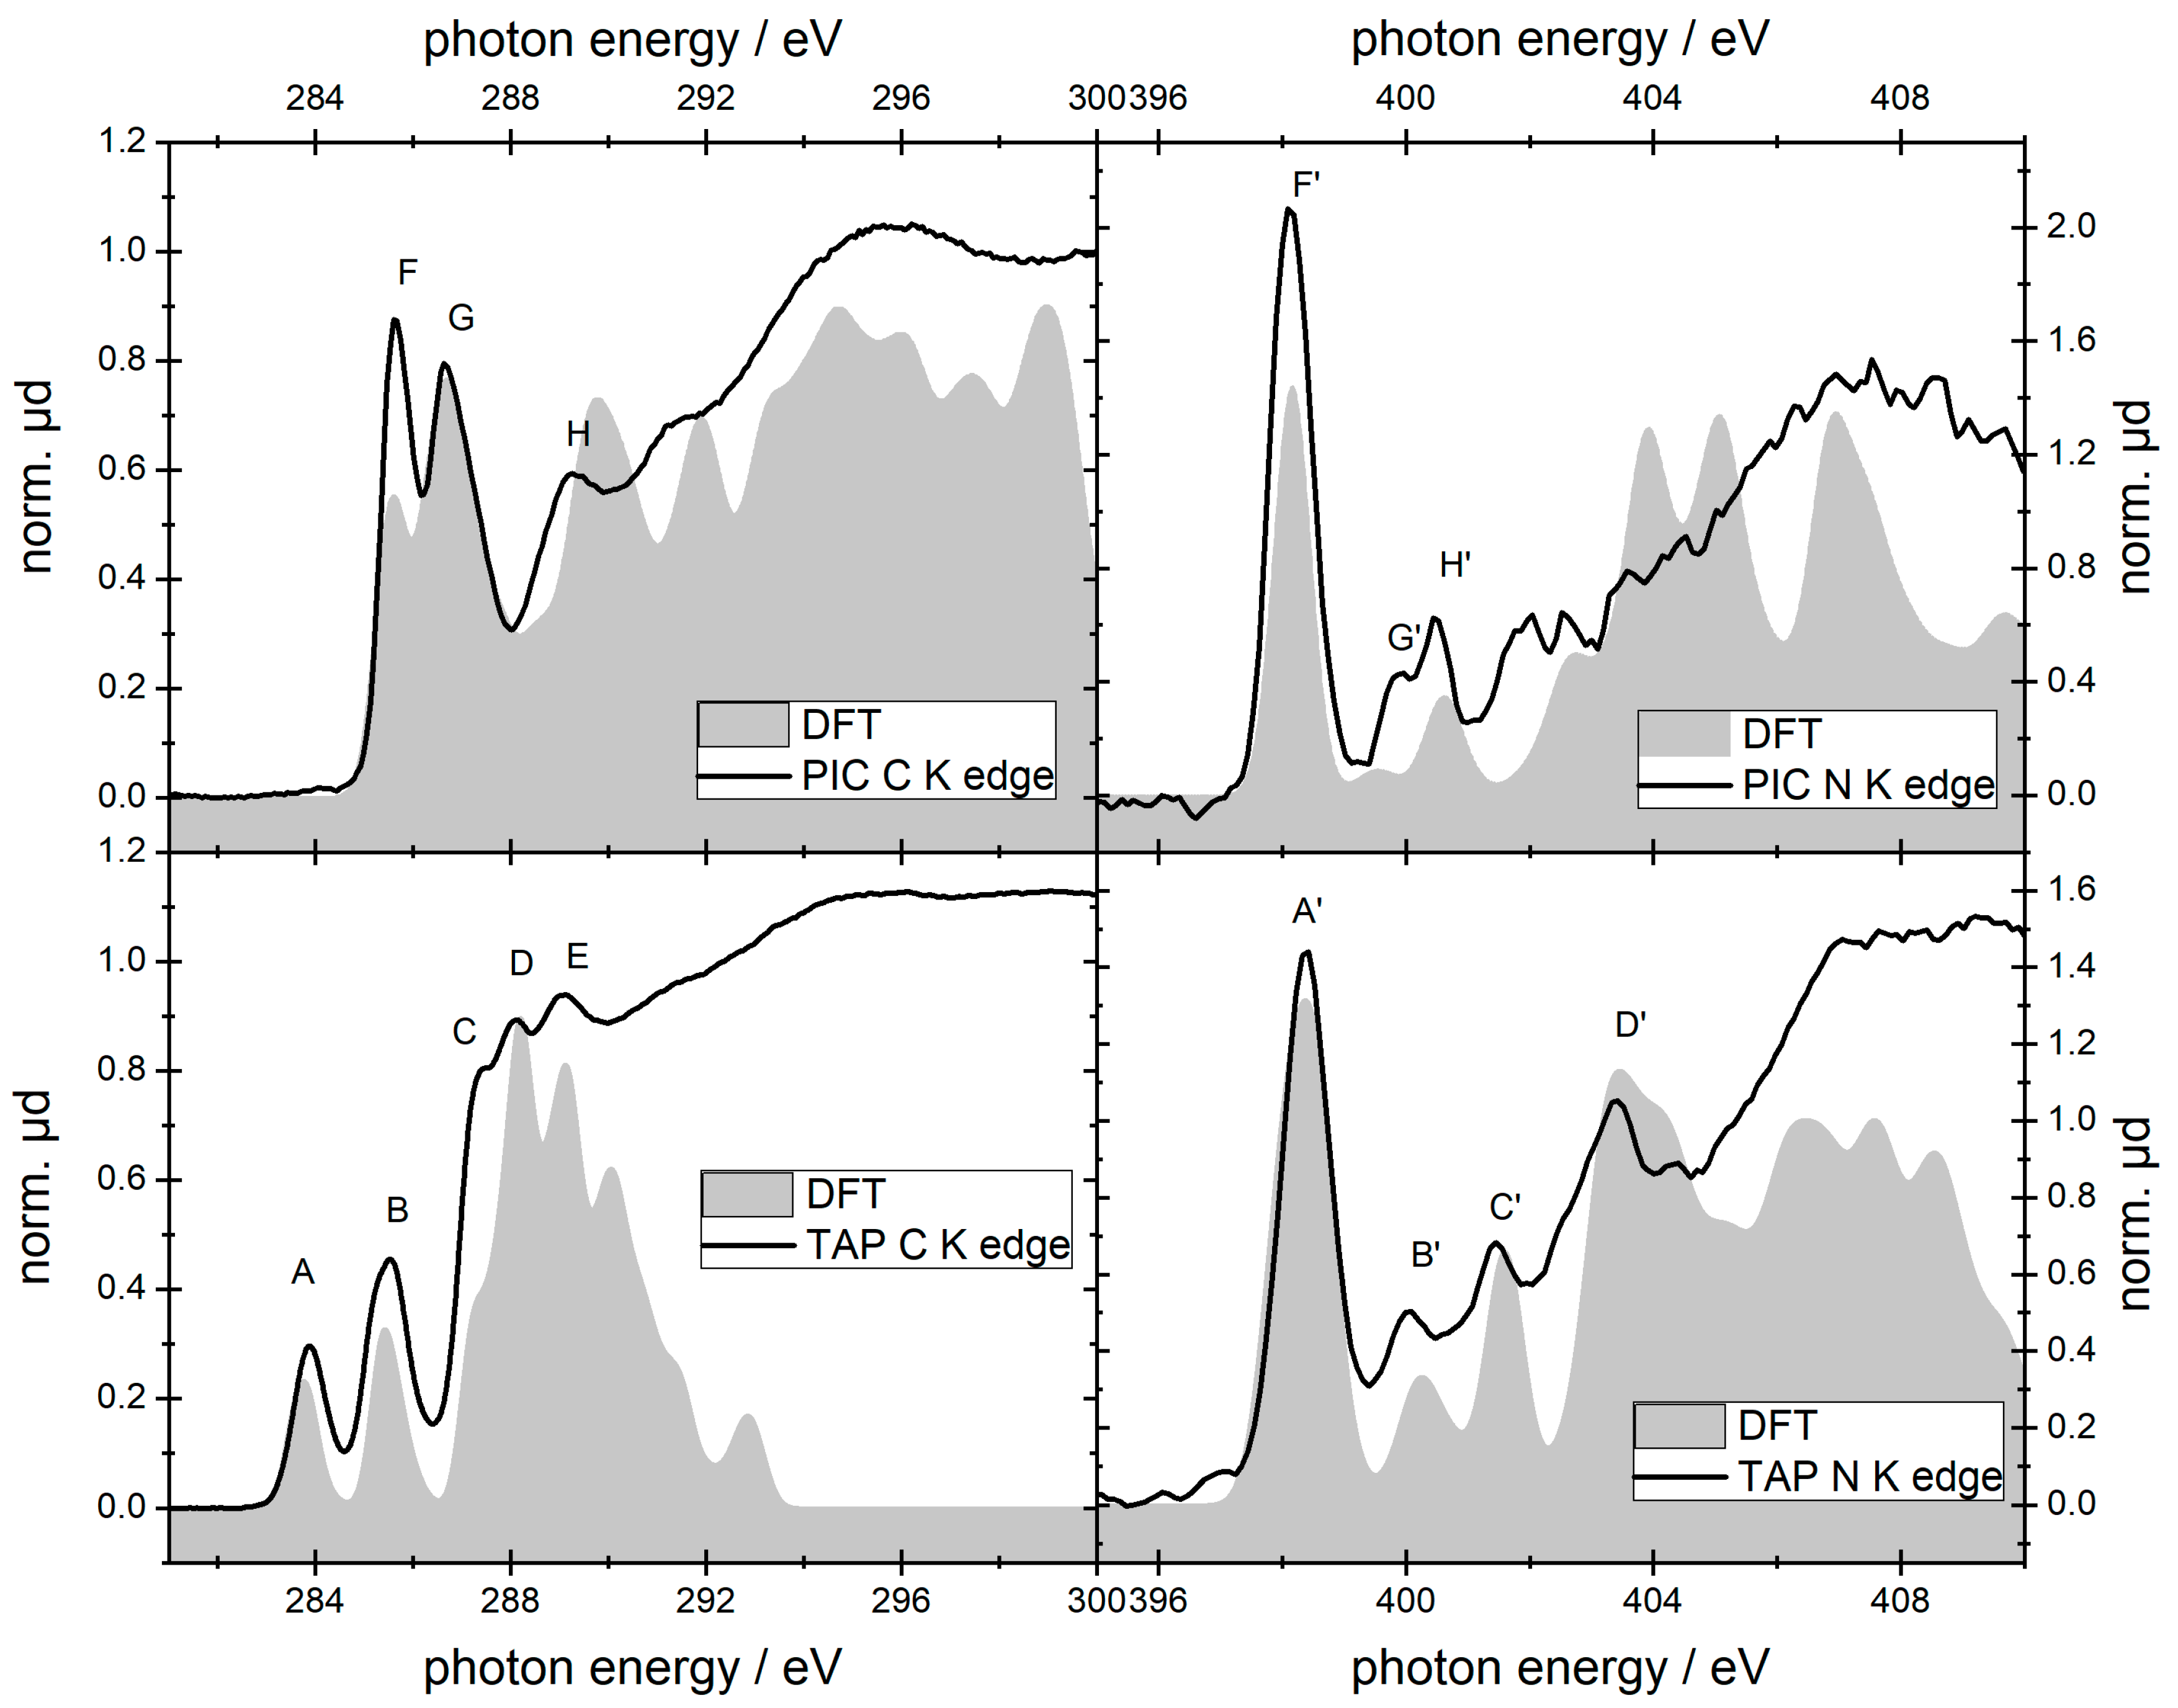
| Carbon K-Edge | Nitrogen K-Edge | |||||
|---|---|---|---|---|---|---|
| Feature | Measured (eV) | Assignment | Feature | MEASURED (eV) | Assignment | |
| TAP | A | 283.9 ± 0.2 | C bound to C (pyrrole) | A′ | 398.4 ± 0.2 | N 1s -> π* LUMO |
| B | 285.4 ± 0.2 | C bound to N (pyrrole) | B′ | 400.1 ± 0.2 | N 1s -> π* LUMO+1 | |
| C | 287.4 ± 0.2 | C bound to C (pyrrole) | C′ | 401.5 ± 0.2 | N bound to H (pyrrole) | |
| D | 288.2 ± 0.2 | C bound to C (butyl) | D′ | 403.4 ± 0.2 | ||
| E | 289.0 ± 0.2 | C bound to N (pyrrole) | ||||
| PIC | F | 285.7 ± 0.2 | C bound to C (ring) | F′ | 398.1 ± 0.2 | N 1s -> π* (LUMO) |
| G | 286.7 ± 0.2 | C bound to N | G′ | 399.8 ± 0.2 | N 1s -> LUMO +1 | |
| H | 289.3 ± 0.2 | C (ethyl) | H′ | 400.5 ± 0.2 | N 1s -> LUMO +3 | |
| Oxygen K-Edge | Nickel L-Edge | ||||
|---|---|---|---|---|---|
| Feature | Measured (eV) | Assignment | Feature | Measured (eV) | Assignment |
| A | 531.6 ± 0.2 | Ni 3d—O 2p mixing | A′ | 852.6 ± 0.2 | 2p3/2—3d |
| B | 537.1 ± 0.2 | Ni 4sp | B′ | 854.3 ± 0.2 | 2p3/2—3d |
| C | 540.0 ± 0.2 | Ni 4sp | C′ | 865.9 ± 0.2 | 2p–4sp [51] |
| D | 546.0 ± 0.2 | Multiple scattering | D′ | 869.8 ± 0.2 870.6 ± 0.2 | 2p1/2-3d (f2g eg) Multiplet splitting |
| E | 555.4 ± 0.2 | Multiple scattering | E′ | 885.4 ± 0.2 | Multiple scattering |
| F | 561.2 ± 0.2 | Multiple scattering | F′ | 902.4± 0.2 | Multiple scattering |
Publisher’s Note: MDPI stays neutral with regard to jurisdictional claims in published maps and institutional affiliations. |
© 2021 by the authors. Licensee MDPI, Basel, Switzerland. This article is an open access article distributed under the terms and conditions of the Creative Commons Attribution (CC BY) license (https://creativecommons.org/licenses/by/4.0/).
Share and Cite
Stiel, H.; Braenzel, J.; Jonas, A.; Gnewkow, R.; Glöggler, L.T.; Sommer, D.; Krist, T.; Erko, A.; Tümmler, J.; Mantouvalou, I. Towards Understanding Excited-State Properties of Organic Molecules Using Time-Resolved Soft X-ray Absorption Spectroscopy. Int. J. Mol. Sci. 2021, 22, 13463. https://doi.org/10.3390/ijms222413463
Stiel H, Braenzel J, Jonas A, Gnewkow R, Glöggler LT, Sommer D, Krist T, Erko A, Tümmler J, Mantouvalou I. Towards Understanding Excited-State Properties of Organic Molecules Using Time-Resolved Soft X-ray Absorption Spectroscopy. International Journal of Molecular Sciences. 2021; 22(24):13463. https://doi.org/10.3390/ijms222413463
Chicago/Turabian StyleStiel, Holger, Julia Braenzel, Adrian Jonas, Richard Gnewkow, Lisa Theresa Glöggler, Denny Sommer, Thomas Krist, Alexei Erko, Johannes Tümmler, and Ioanna Mantouvalou. 2021. "Towards Understanding Excited-State Properties of Organic Molecules Using Time-Resolved Soft X-ray Absorption Spectroscopy" International Journal of Molecular Sciences 22, no. 24: 13463. https://doi.org/10.3390/ijms222413463
APA StyleStiel, H., Braenzel, J., Jonas, A., Gnewkow, R., Glöggler, L. T., Sommer, D., Krist, T., Erko, A., Tümmler, J., & Mantouvalou, I. (2021). Towards Understanding Excited-State Properties of Organic Molecules Using Time-Resolved Soft X-ray Absorption Spectroscopy. International Journal of Molecular Sciences, 22(24), 13463. https://doi.org/10.3390/ijms222413463