
Ultrafast Photoconversion Dynamics of the Knotless Phytochrome SynCph2

 , , , and
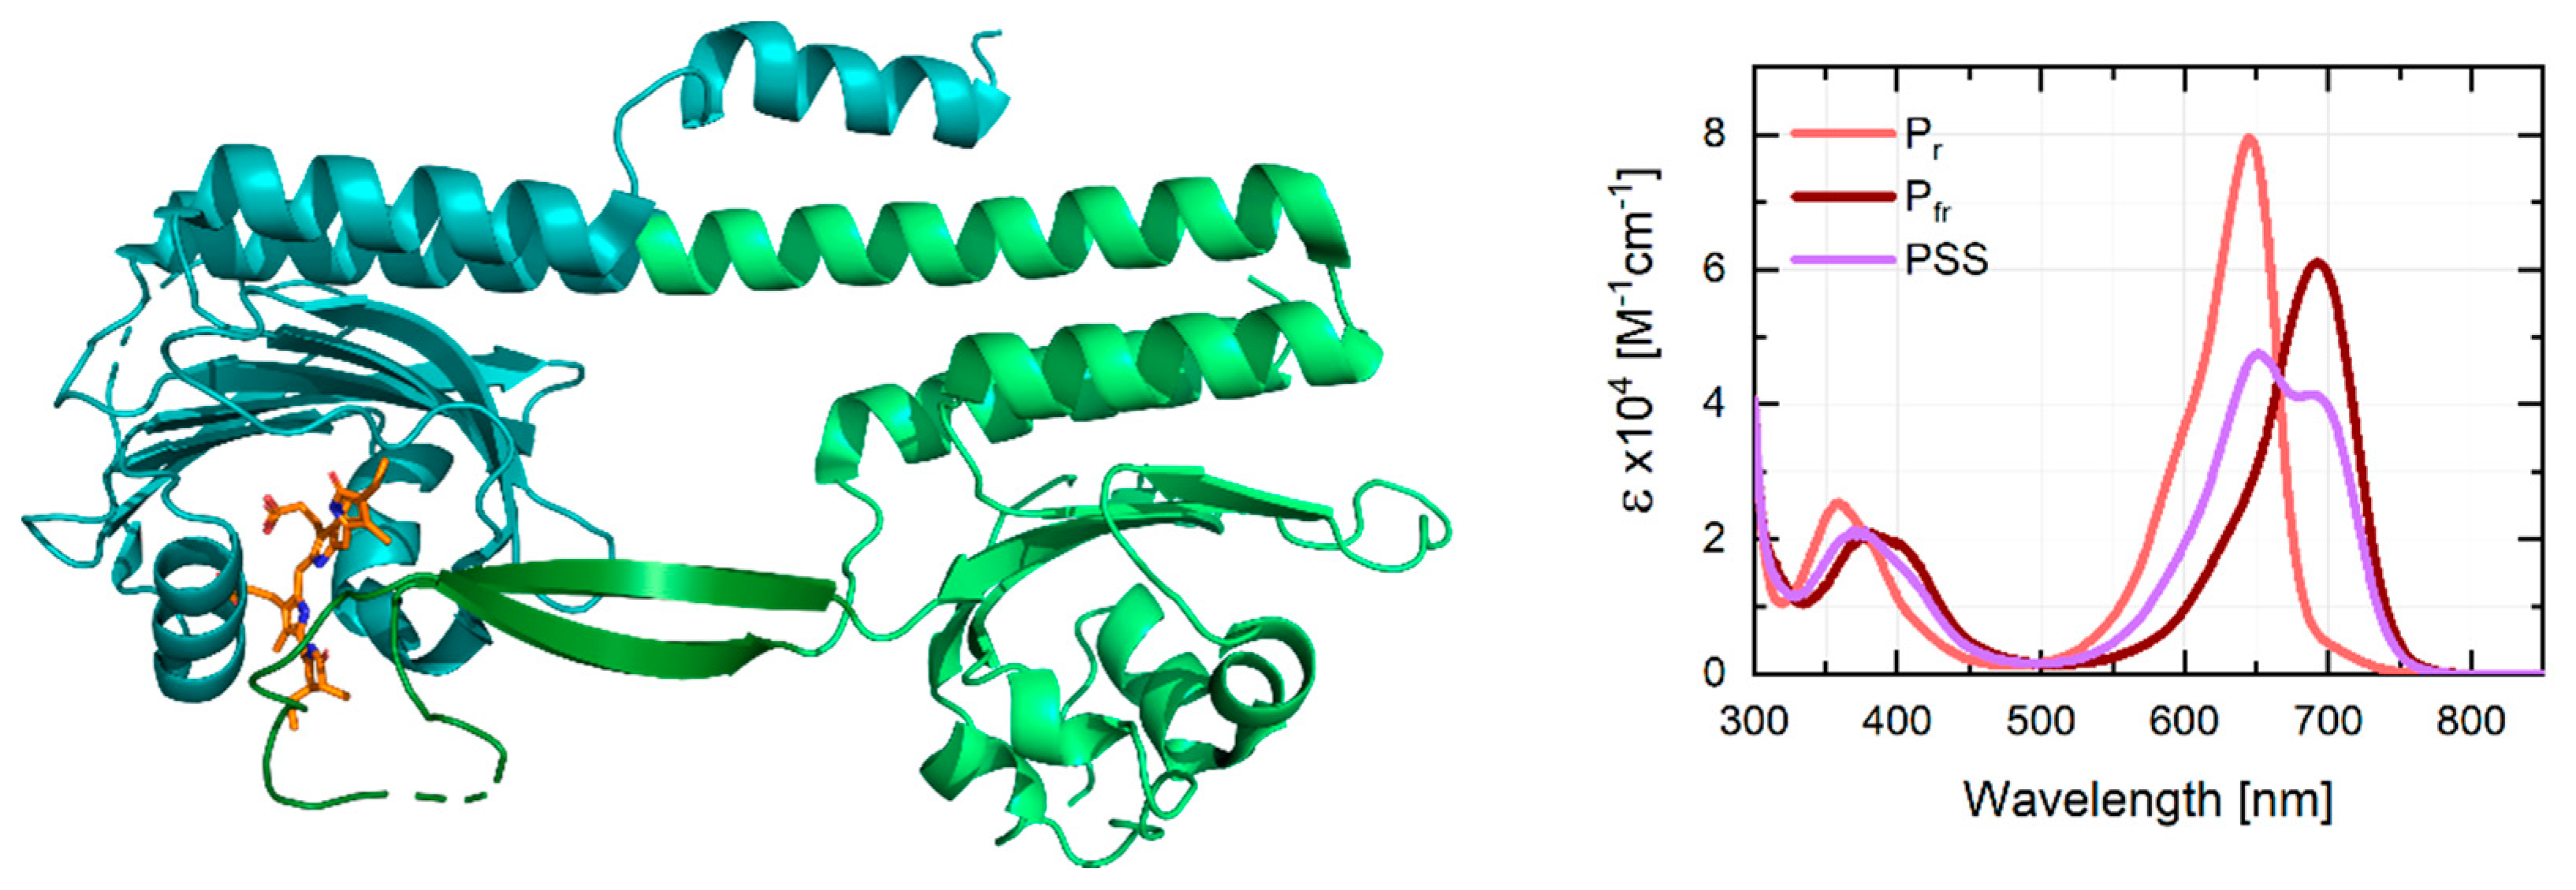
Abstract
1. Introduction
2. Results and Discussion
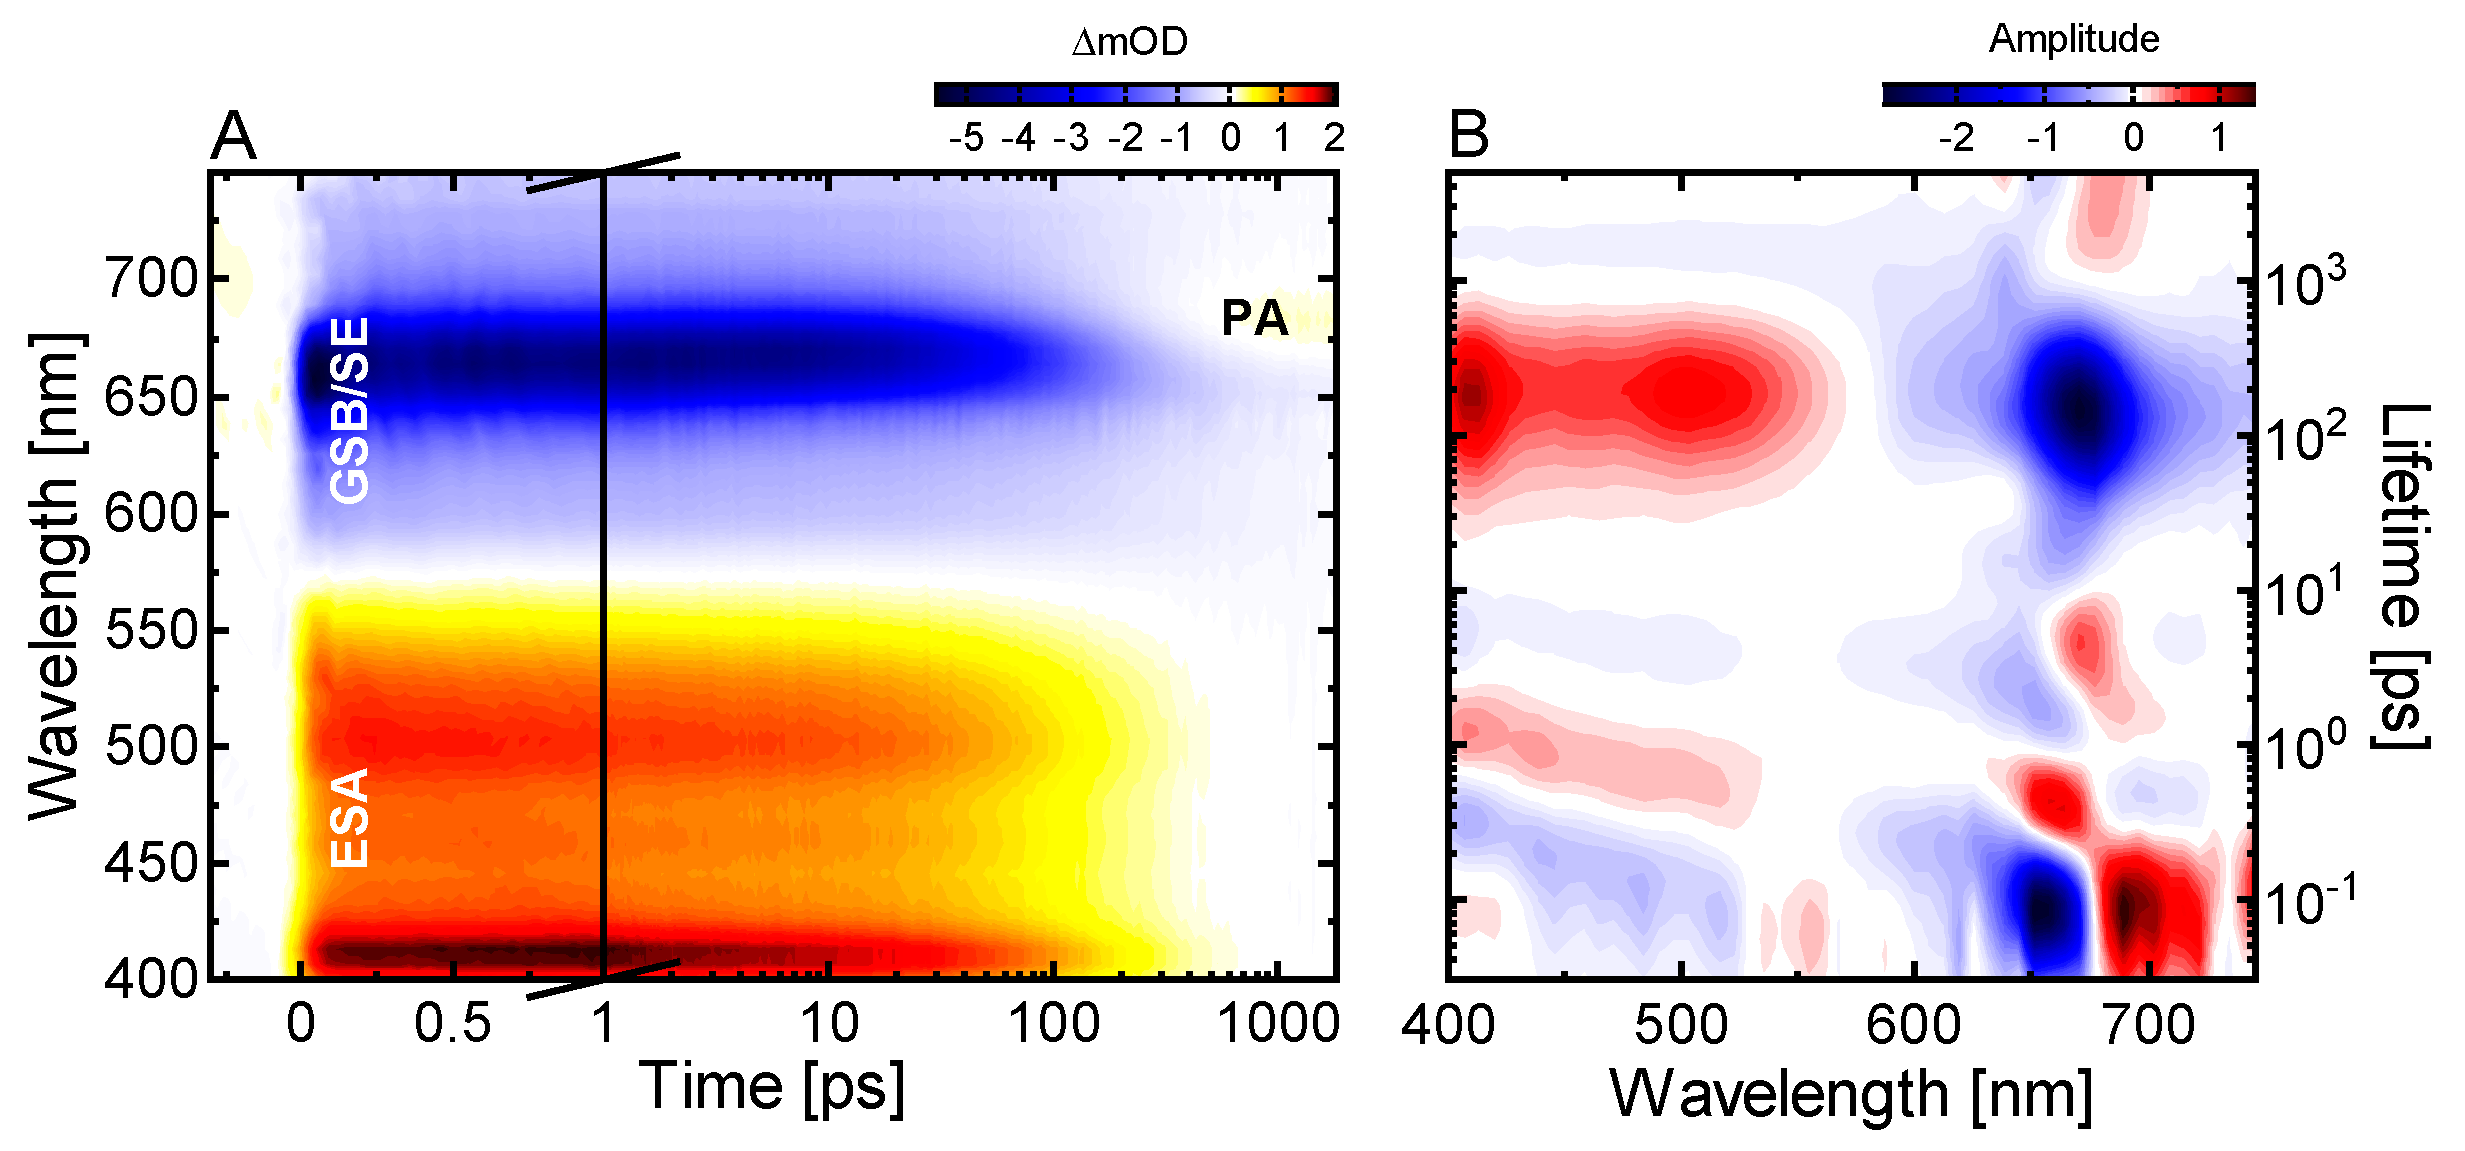
2.1. Ultrafast Pr* Dynamics and Lumi-R Formation
2.2. Conserved Pr Kinetics
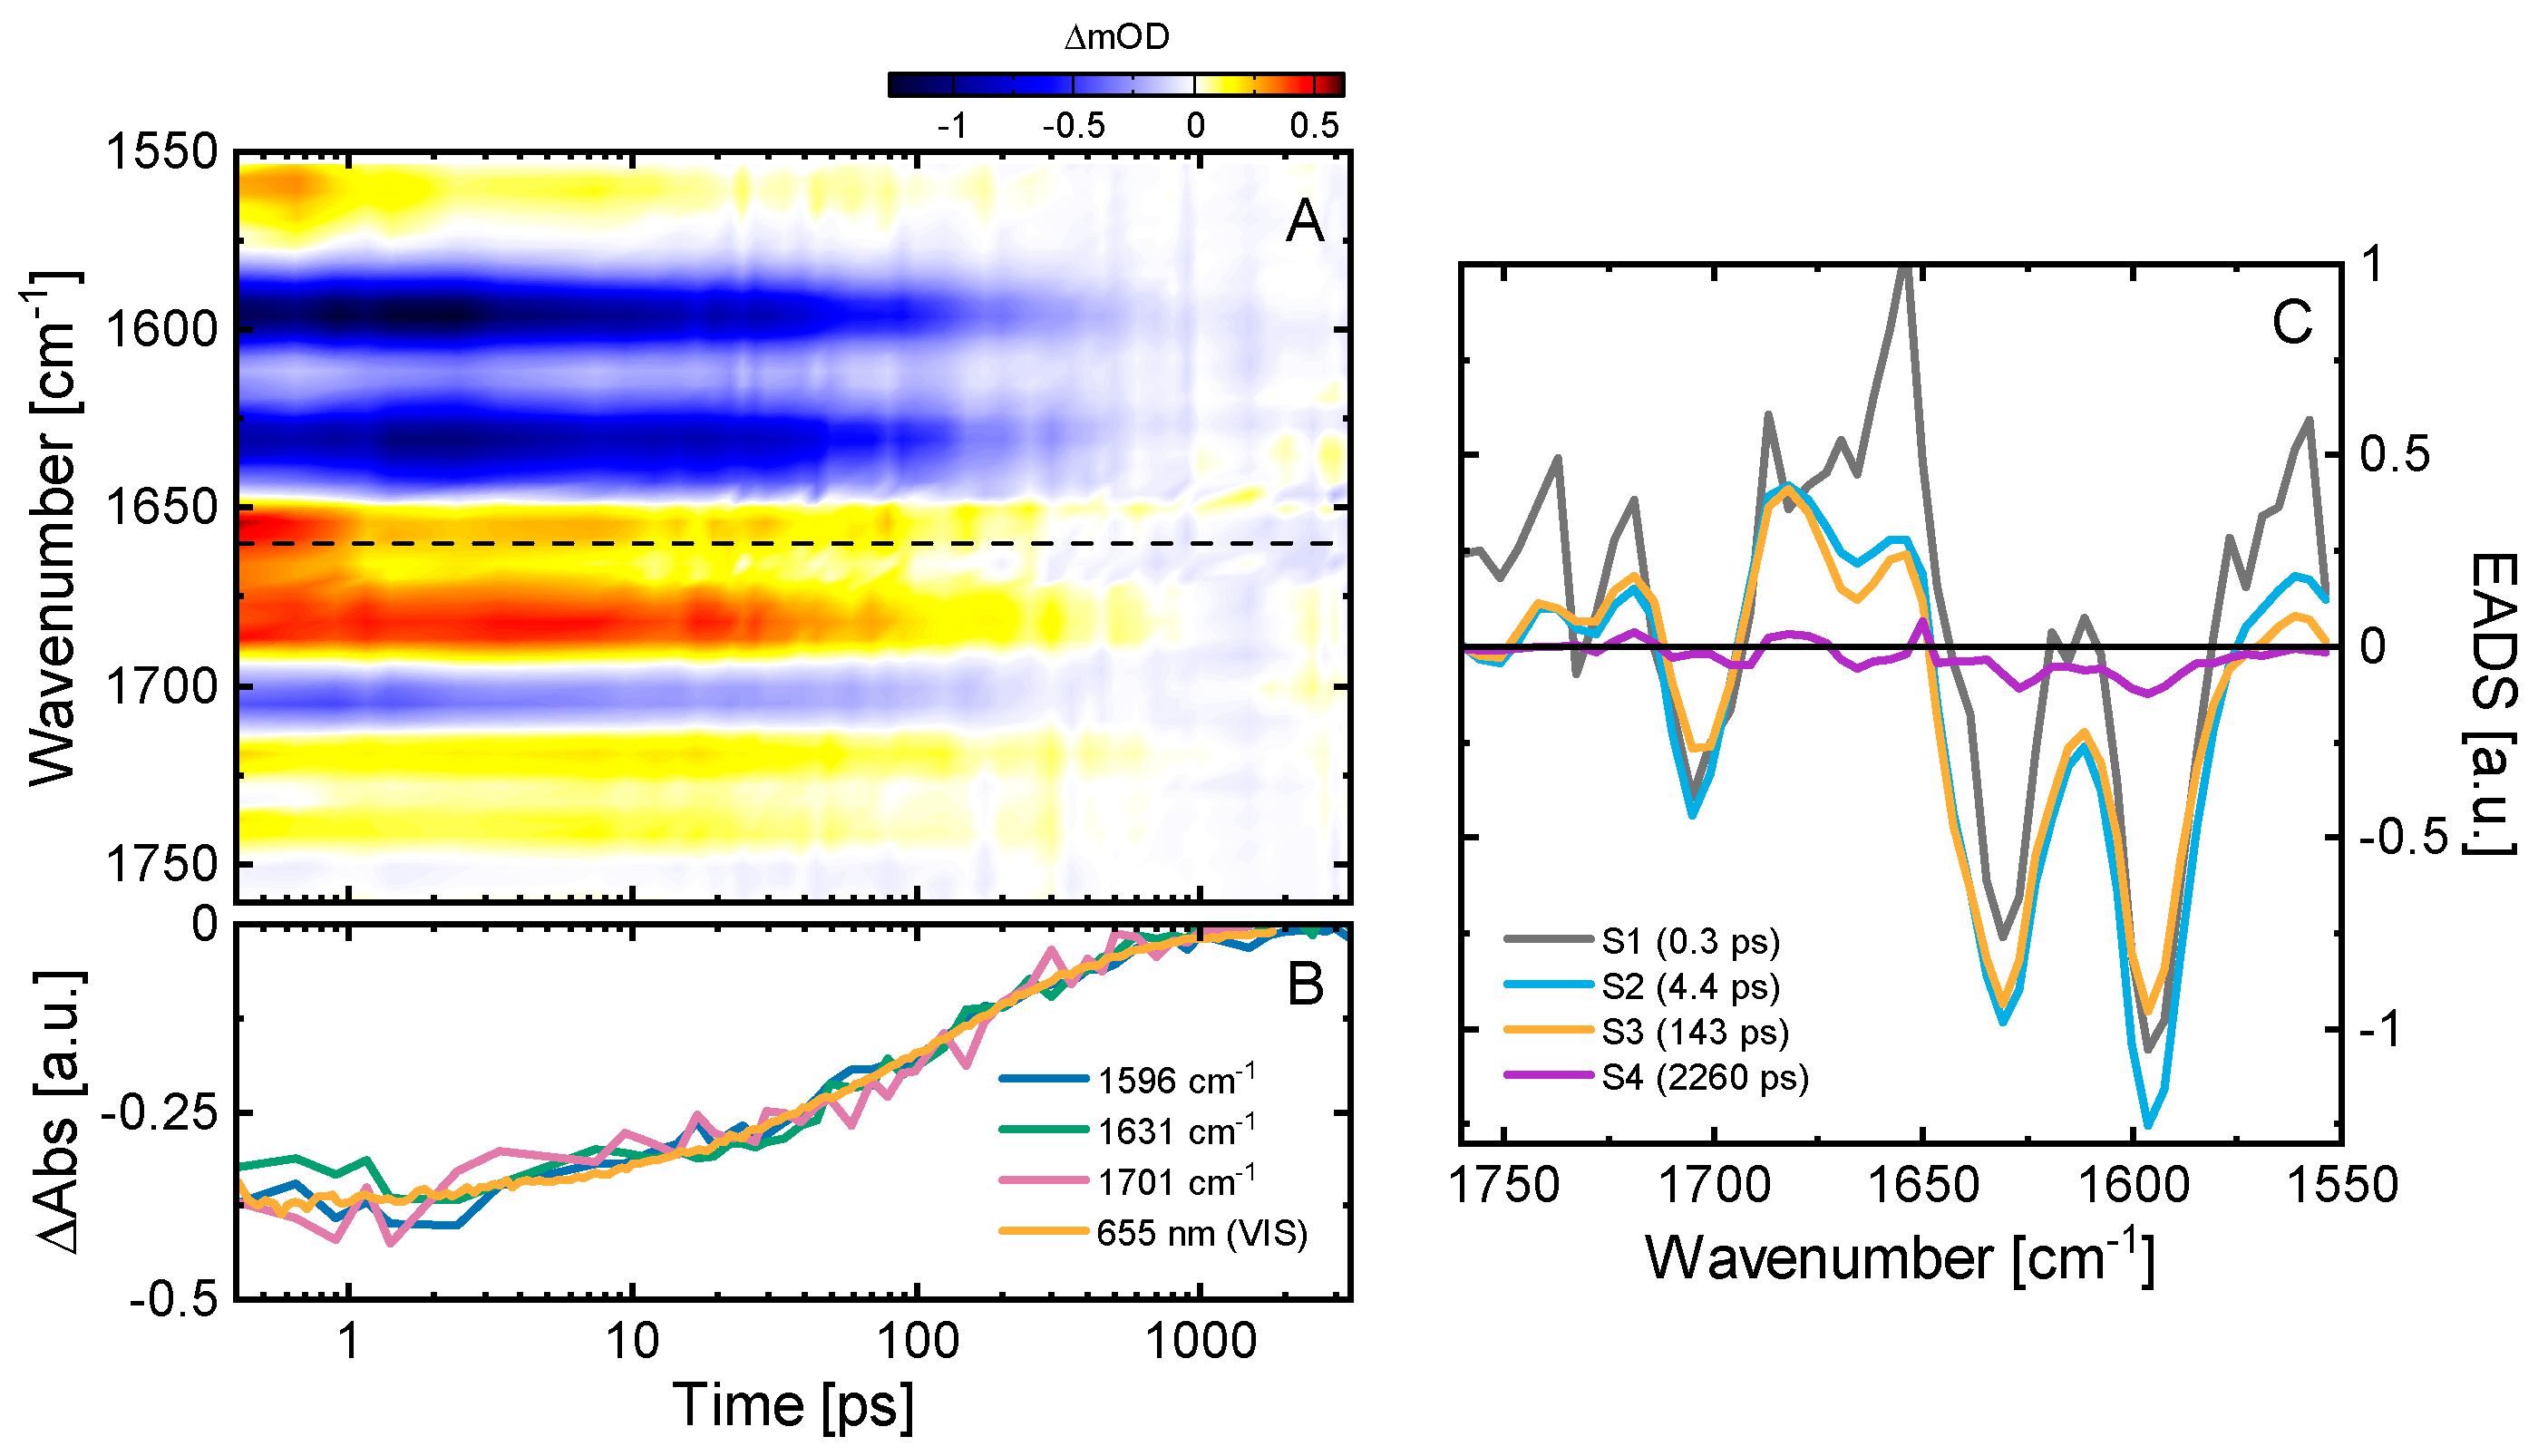
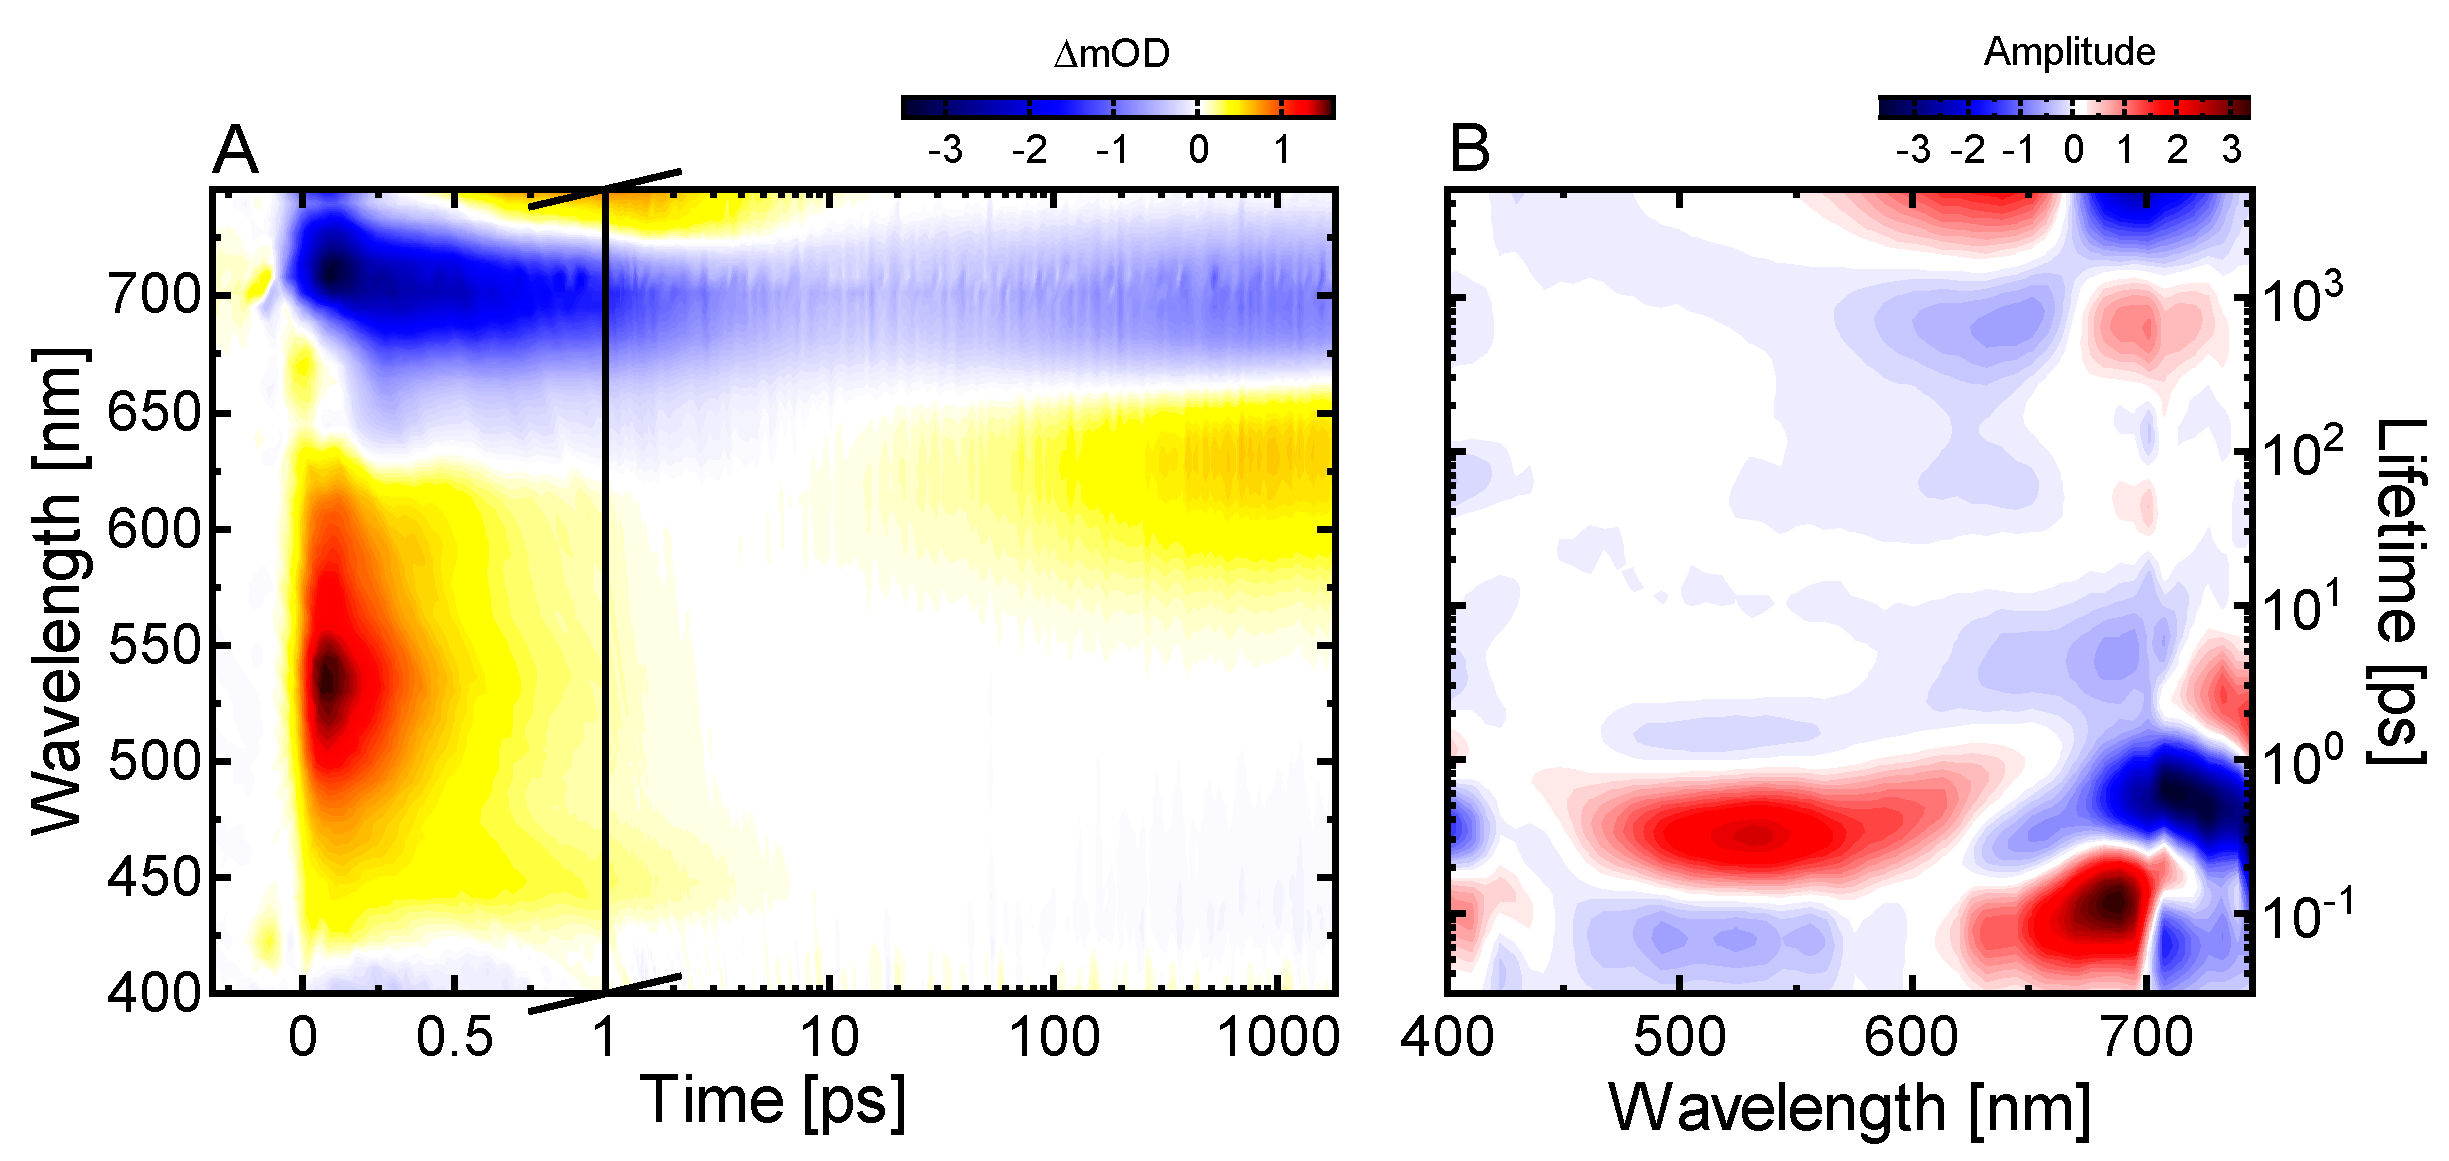
2.3. Ultrafast Dynamics of Pfr*
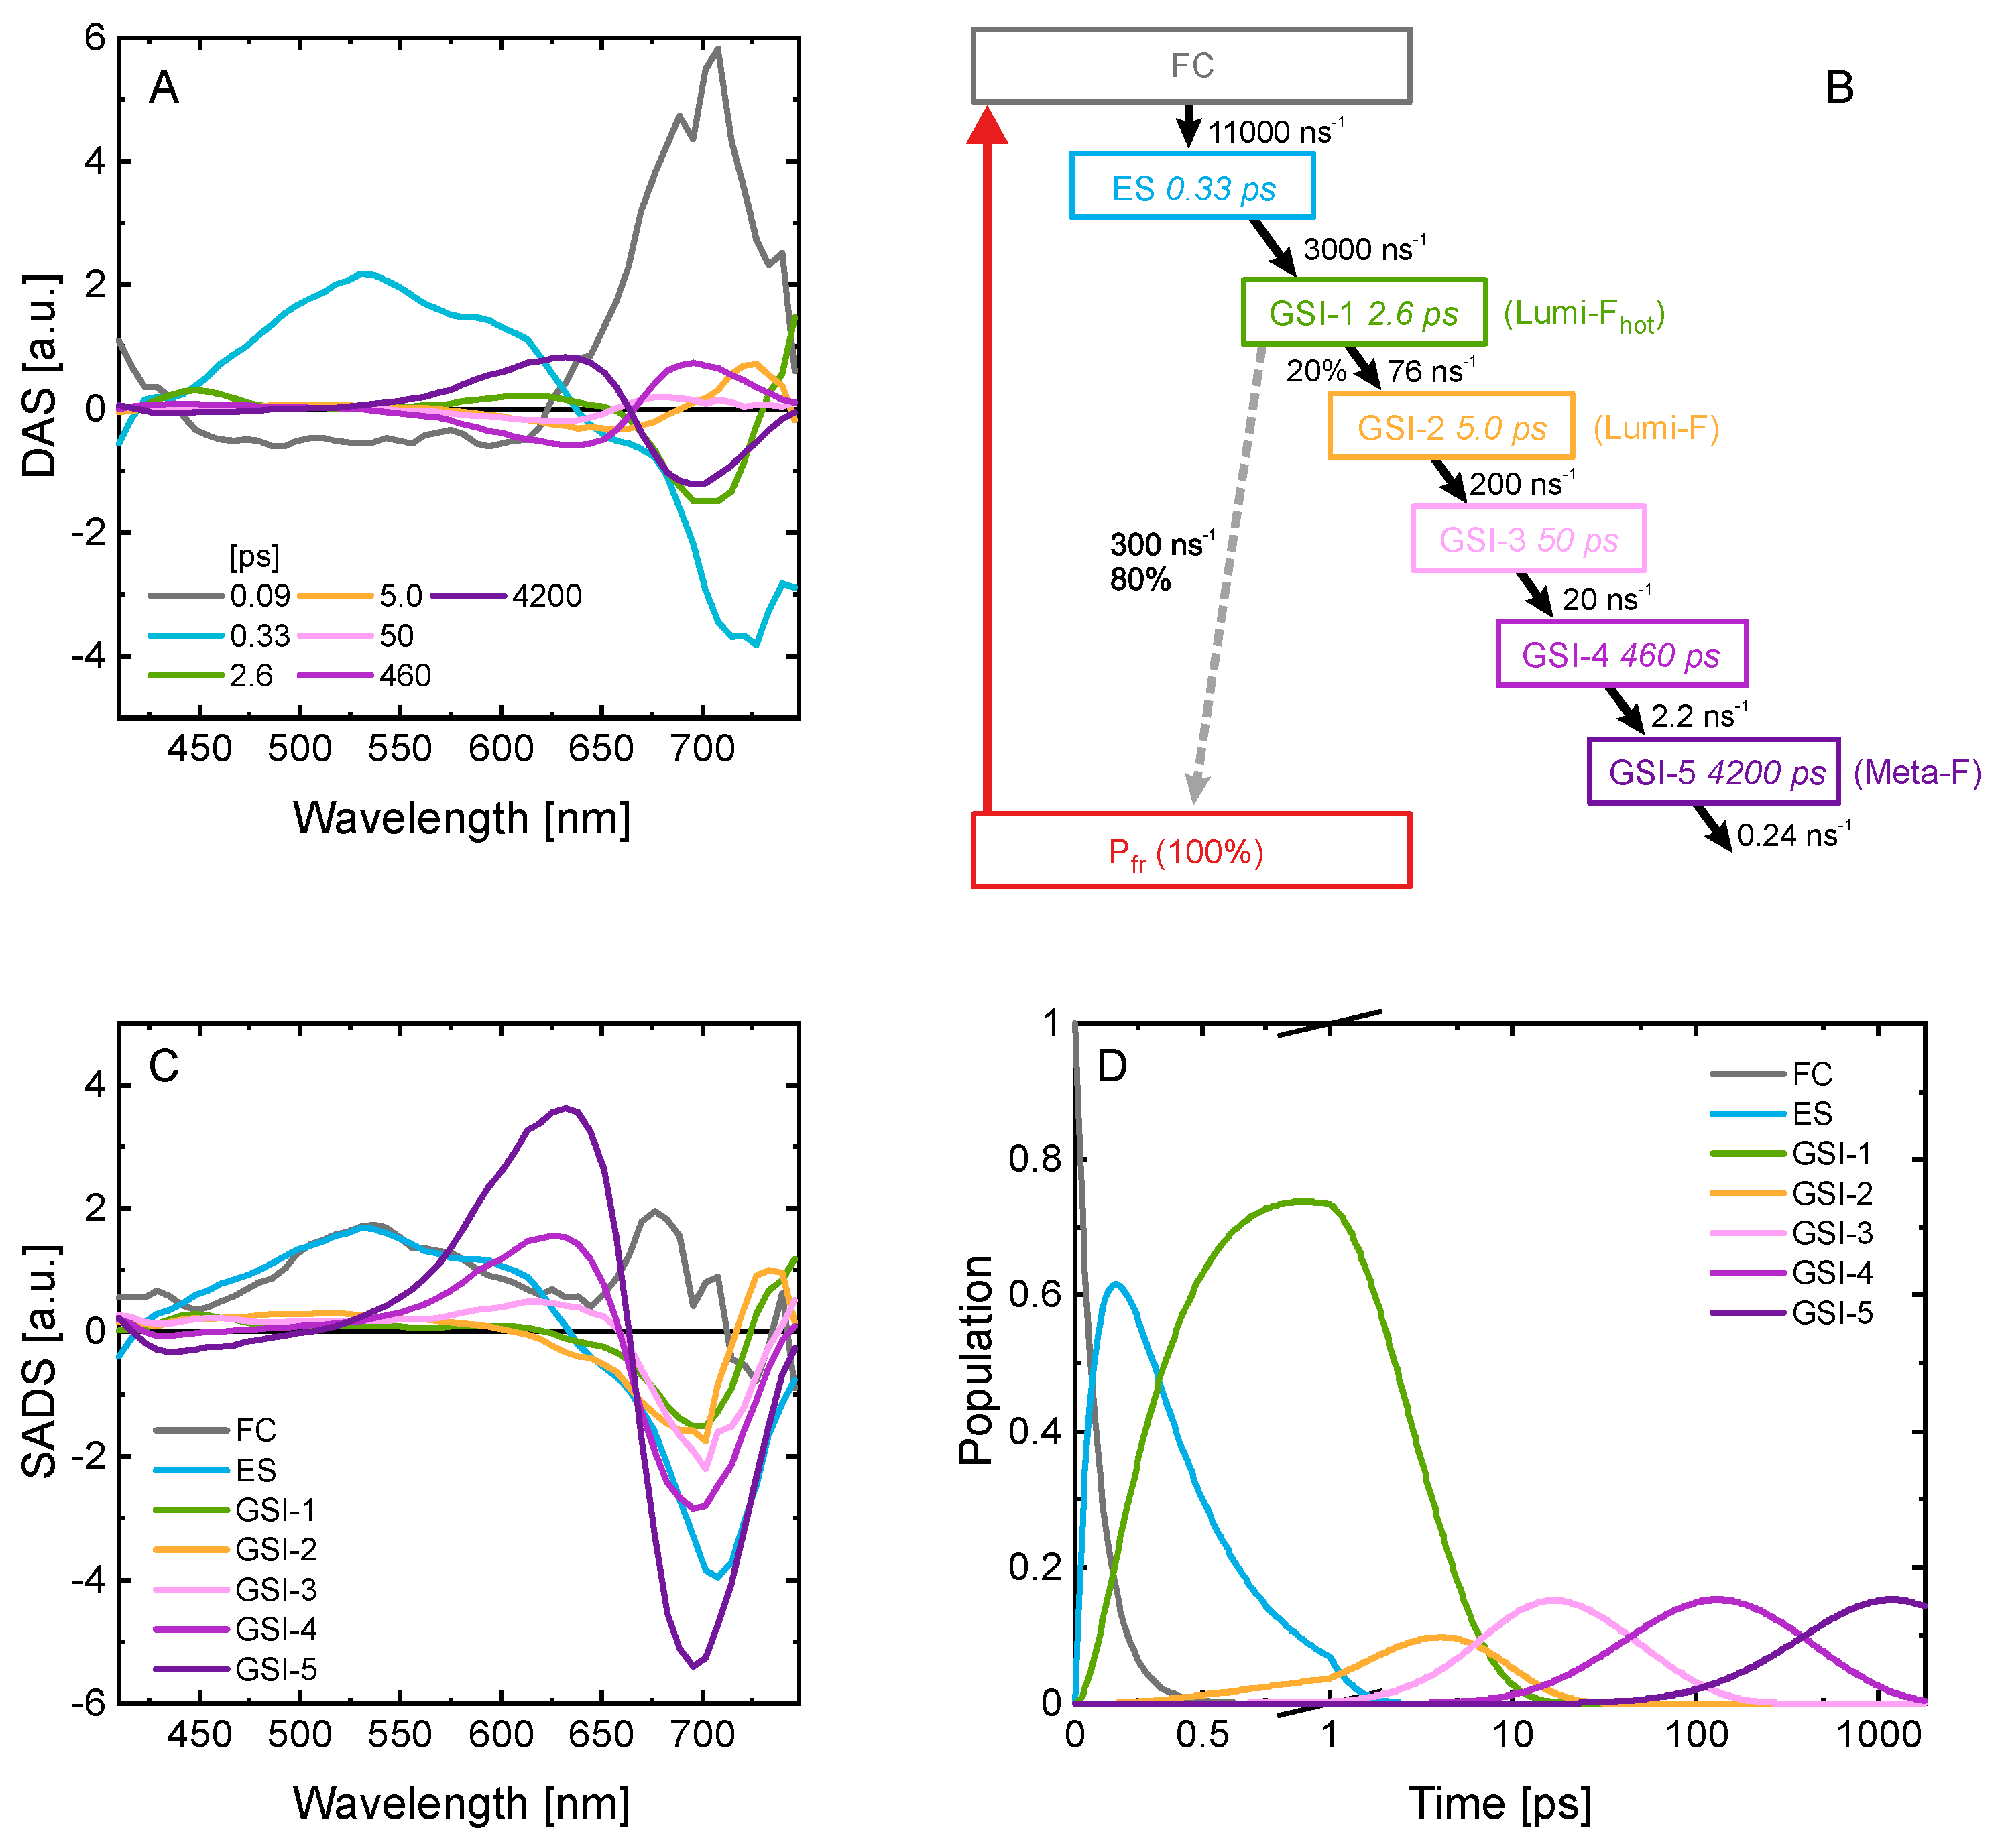
2.4. Kinetic Model of the Primary Pfr Kinetics
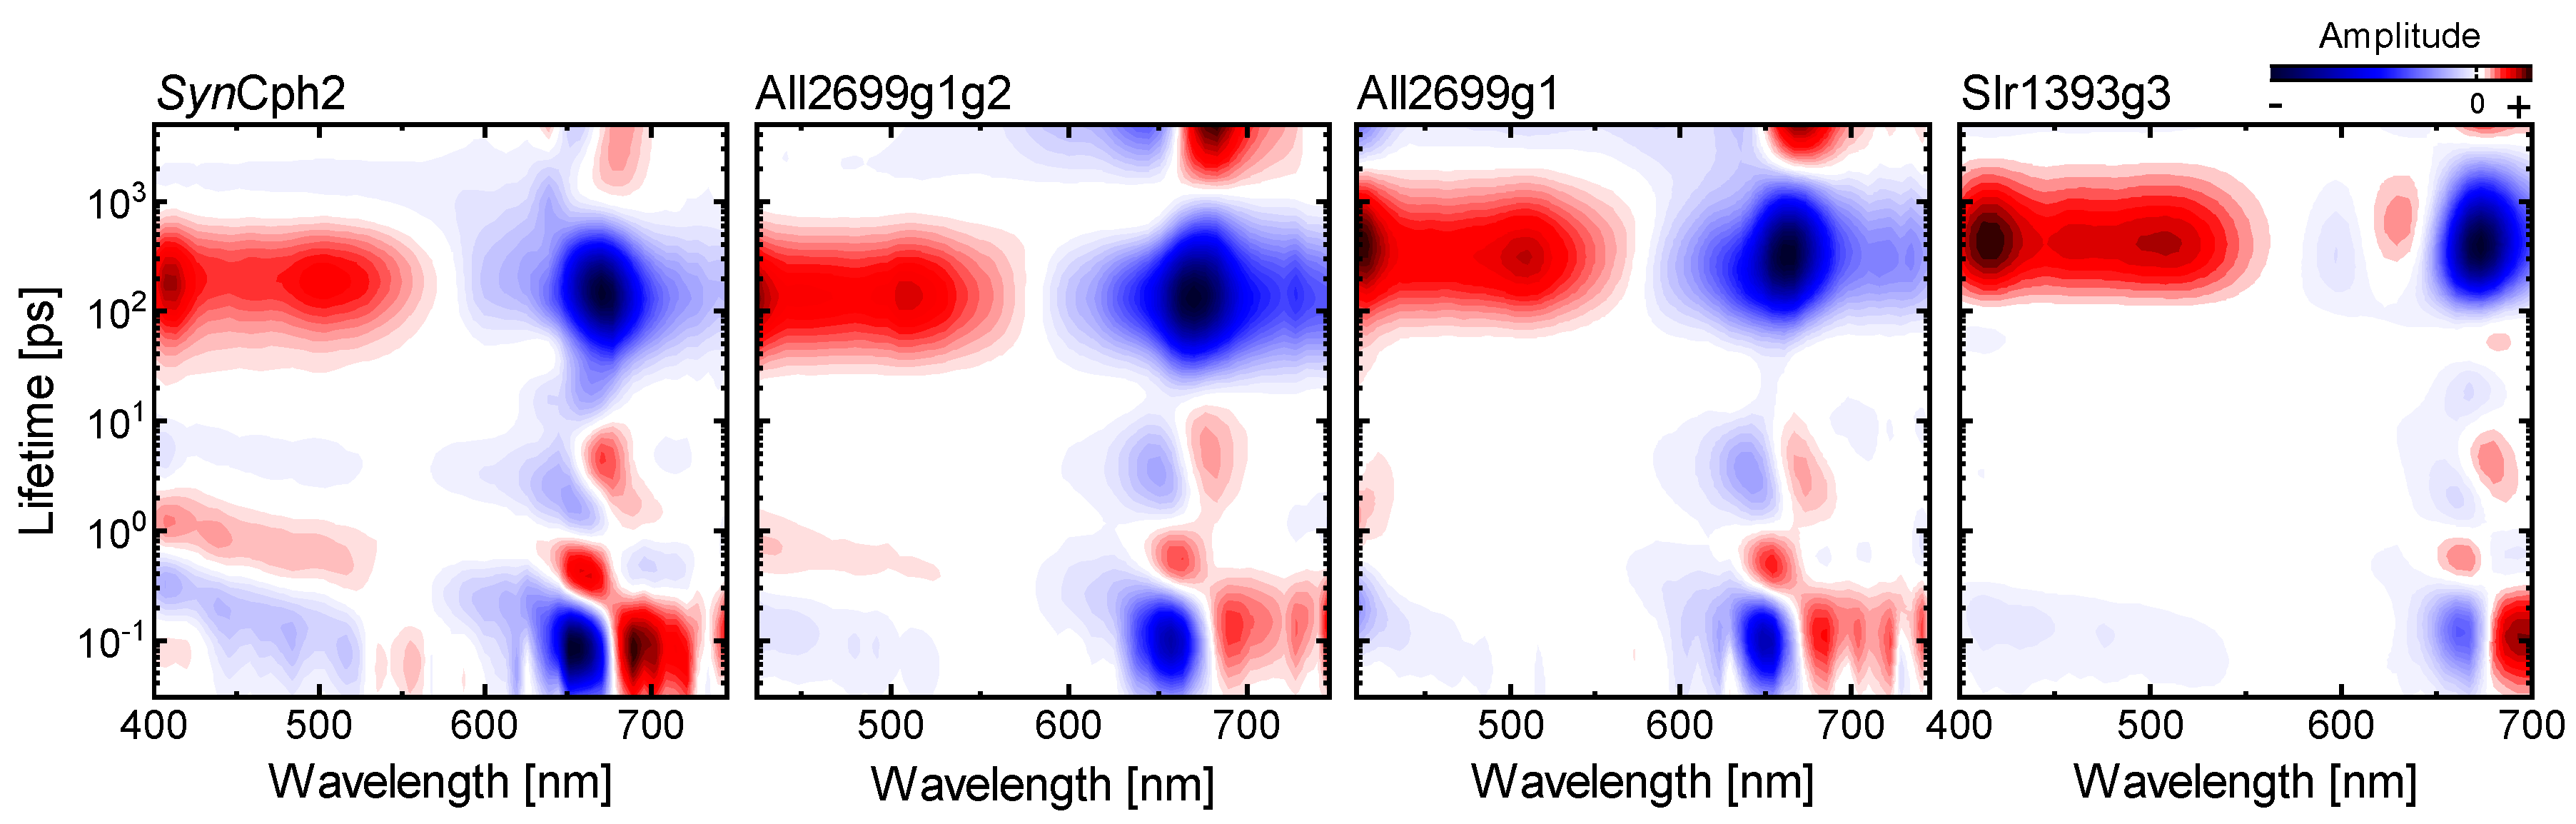
2.5. Comparison to Other Phytochromes
3. Materials and Methods
3.1. Protein Preparation
3.2. Stationary Characterization
3.3. Vis Pump-Probe Transient Absorption Experiments
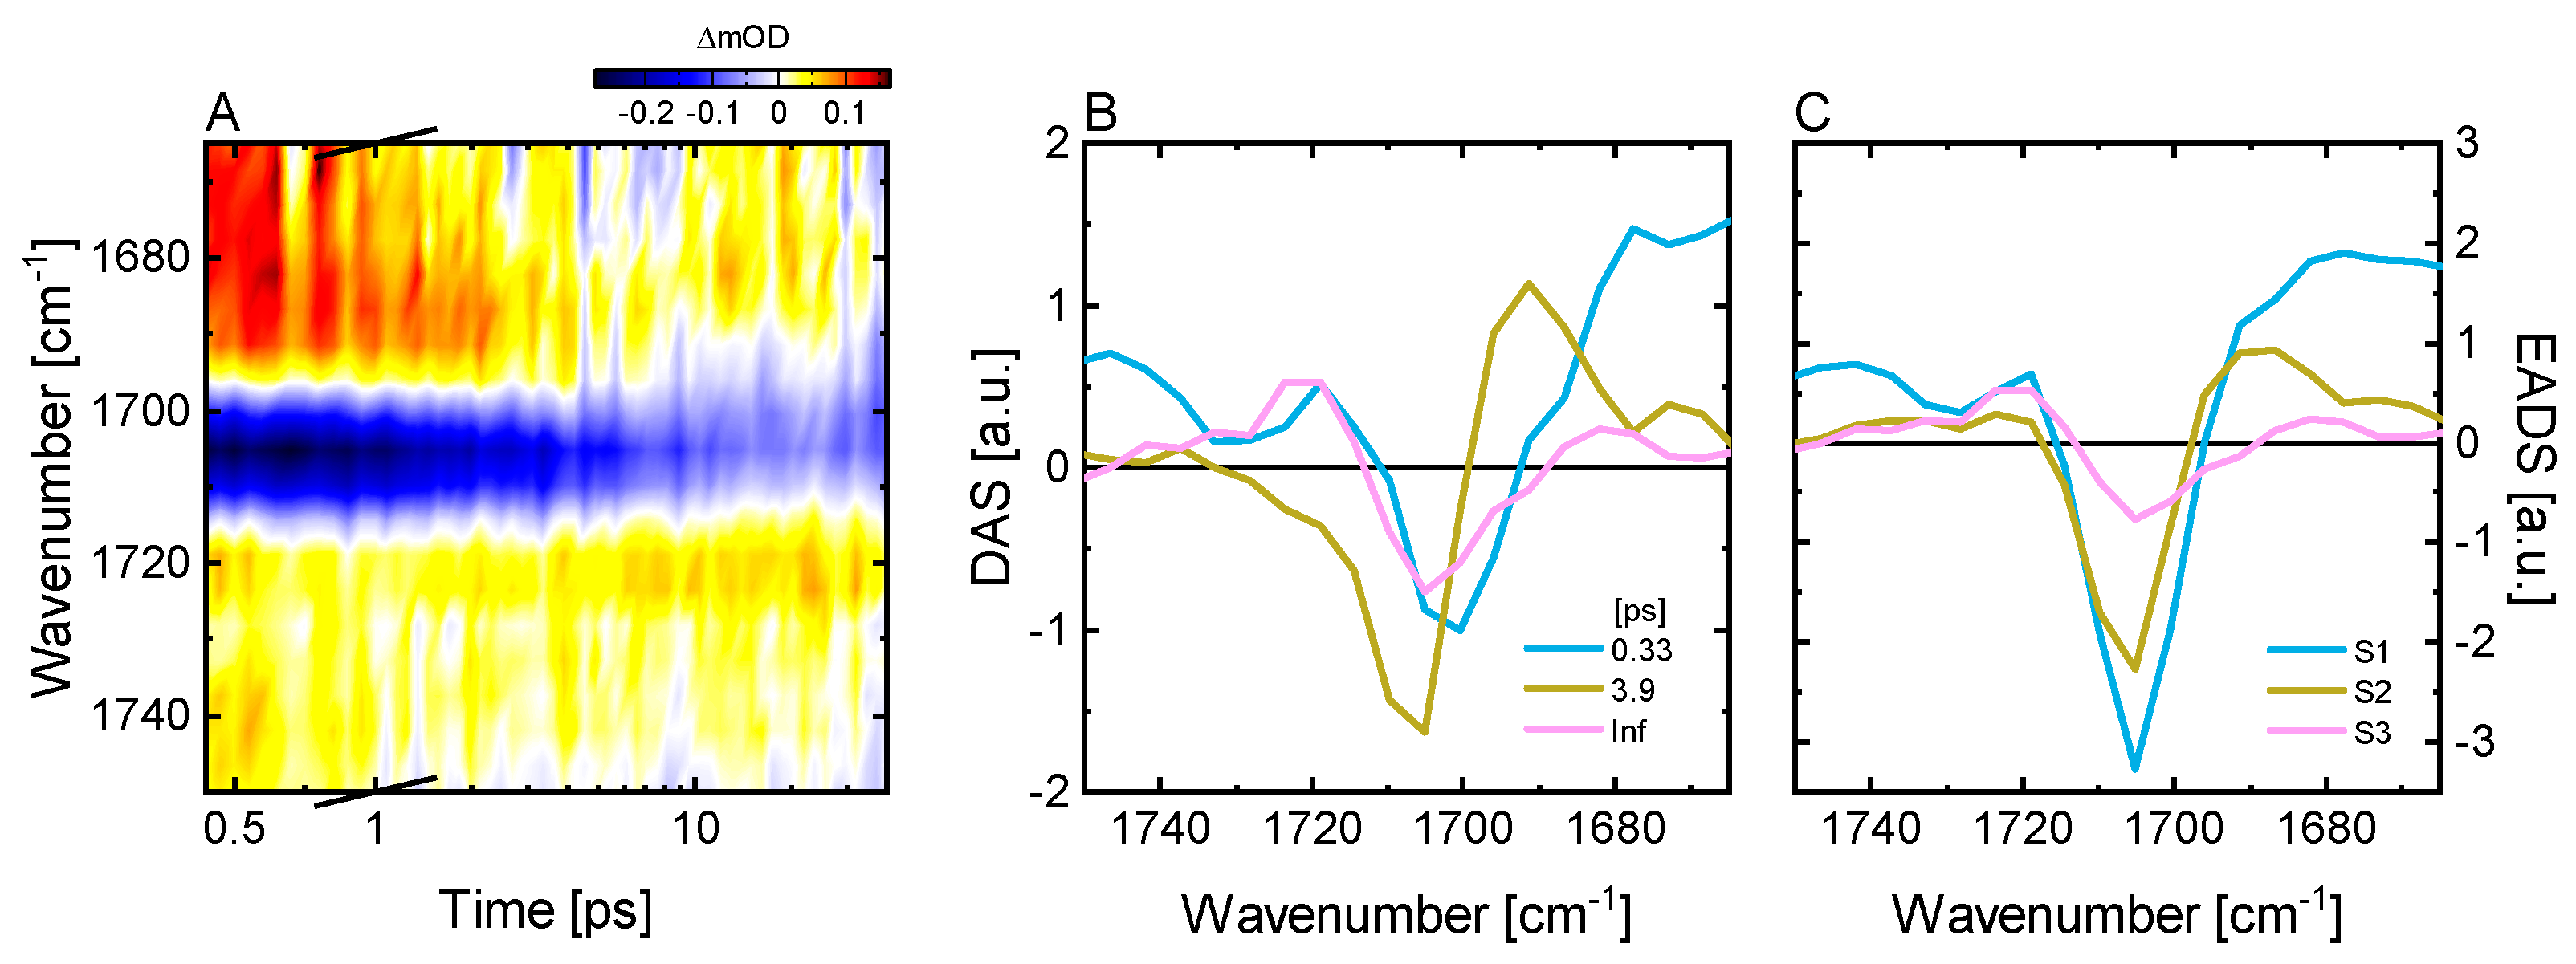
3.4. Vis Pump-IR Probe Transient Absorption Experiments
3.5. Data Analysis
4. Conclusions
Supplementary Materials
Author Contributions
Funding
Institutional Review Board Statement
Informed Consent Statement
Data Availability Statement
Acknowledgments
Conflicts of Interest
References
- Anders, K.; Essen, L.O. The family of phytochrome-like photoreceptors: Diverse, complex and multi-colored, but very useful. Curr. Opin. Struct. Biol. 2015, 35, 7–16. [Google Scholar] [CrossRef]
- Rockwell, N.C.; Lagarias, J.C. Phytochrome diversification in cyanobacteria and eukaryotic algae. Curr. Opin. Plant Biol. 2017, 37, 87–93. [Google Scholar] [CrossRef] [PubMed]
- Piatkevich, K.D.; Subach, F.V.; Verkhusha, V.V. Engineering of bacterial phytochromes for near-infrared imaging, sensing, and light-control in mammals. Chem. Soc. Rev. 2013, 42, 3441–3452. [Google Scholar] [CrossRef] [PubMed]
- Redchuk, T.A.; Omelina, E.S.; Chernov, K.G.; Verkhusha, V.V. Near-infrared optogenetic pair for protein regulation and spectral multiplexing. Nat. Chem. Biol. 2017, 13, 633–639. [Google Scholar] [CrossRef] [PubMed]
- Shcherbakova, D.M.; Stepanenko, O.V.; Turoverov, K.K.; Verkhusha, V.V. Near-Infrared Fluorescent Proteins: Multiplexing and Optogenetics across Scales. Trends Biotechnol. 2018, 36, 1230–1243. [Google Scholar] [CrossRef] [PubMed]
- Hörner, M.; Raute, K.; Hummel, B.; Madl, J.; Creusen, G.; Thomas, O.S.; Christen, E.H.; Hotz, N.; Gübeli, R.J.; Engesser, R.; et al. Phytochrome-Based Extracellular Matrix with Reversibly Tunable Mechanical Properties. Adv. Mater. 2019, 31, e1806727. [Google Scholar] [CrossRef] [PubMed]
- Rockwell, N.C.; Lagarias, J.C. The structure of phytochrome: A picture is worth a thousand spectra. Plant Cell 2006, 18, 4–14. [Google Scholar] [CrossRef]
- Rockwell, N.C.; Su, Y.-S.; Lagarias, J.C. Phytochrome Structure and Signaling Mechanisms. Annu. Rev. Plant Biol. 2006, 57, 837–858. [Google Scholar] [CrossRef]
- Möglich, A.; Yang, X.; Ayers, R.A.; Moffat, K. Structure and Function of Plant Photoreceptors. Annu. Rev. Plant Biol. 2010, 61, 21–47. [Google Scholar] [CrossRef]
- Yang, X.; Kuk, J.; Moffat, K. Crystal structure of Pseudomonas aeruginosa bacteriophytochrome: Photoconversion and signal transduction. Proc. Natl. Acad. Sci. USA 2008, 105, 14715–14720. [Google Scholar] [CrossRef]
- Essen, L.O.; Mailliet, J.; Hughes, J. The structure of a complete phytochrome sensory module in the Pr ground state. Proc. Natl. Acad. Sci. USA 2008, 105, 14709–14714. [Google Scholar] [CrossRef]
- Montgomery, B.L.; Lagarias, J.C.C. Phytochrome ancestry: Sensors of bilins and light. Trends Plant. Sci. 2002, 7, 357–366. [Google Scholar] [CrossRef]
- Anders, K.; Von Stetten, D.; Mailliet, J.; Kiontke, S.; Sineshchekov, V.A.; Hildebrandt, P.; Hughes, J.; Essen, L.O. Spectroscopic and photochemical characterization of the red-light sensitive photosensory module of Cph2 from synechocystis PCC 6803. Photochem. Photobiol. 2011, 87, 160–173. [Google Scholar] [CrossRef] [PubMed]
- Ikeuchi, M.; Ishizuka, T. Cyanobacteriochromes: A new superfamily of tetrapyrrole-binding photoreceptors in cyanobacteria. Photochem. Photobiol. Sci. 2008, 7, 1159. [Google Scholar] [CrossRef] [PubMed]
- Lamparter, T.; Mittmann, F.; Gartner, W.; Borner, T.; Hartmann, E.; Hughes, J. Characterization of recombinant phytochrome from the cyanobacterium Synechocystis. Proc. Natl. Acad. Sci. USA 1997, 94, 11792–11797. [Google Scholar] [CrossRef] [PubMed]
- Lamparter, T.; Michael, N.; Mittmann, F.; Esteban, B. Phytochrome from Agrobacterium tumefaciens has unusual spectral properties and reveals an N-terminal chromophore attachment site. Proc. Natl. Acad. Sci. USA 2002, 99, 11628–11633. [Google Scholar] [CrossRef] [PubMed]
- Chai, Y.G.; Singh, B.R.; Song, P.S.; Lee, J.; Robinson, G.W. Purification and spectroscopic properties of 124-kDa oat phytochrome. Anal. Biochem. 1987, 163, 322–330. [Google Scholar] [CrossRef]
- Hirose, Y.; Shimada, T.; Narikawa, R.; Katayama, M.; Ikeuchi, M. Cyanobacteriochrome CcaS is the green light receptor that induces the expression of phycobilisome linker protein. Proc. Natl. Acad. Sci. USA 2008, 105, 9528–9533. [Google Scholar] [CrossRef]
- Rockwell, N.C.; Martin, S.S.; Gulevich, A.G.; Lagarias, J.C. Phycoviolobilin formation and spectral tuning in the DXCF cyanobacteriochrome subfamily. Biochemistry 2012, 51, 1449–1463. [Google Scholar] [CrossRef] [PubMed]
- Rockwell, N.C.; Martin, S.S.; Feoktistova, K.; Lagarias, J.C. Diverse two-cysteine photocycles in phytochromes and cyanobacteriochromes. Proc. Natl. Acad. Sci. USA 2011, 108, 11854–11859. [Google Scholar] [CrossRef]
- Rockwell, N.C.; Martin, S.S.; Lagarias, J.C. Identification of Cyanobacteriochromes Detecting Far-Red Light. Biochemistry 2016, 55, 3907–3919. [Google Scholar] [CrossRef]
- Fushimi, K.; Ikeuchi, M.; Narikawa, R. The Expanded Red/Green Cyanobacteriochrome Lineage: An Evolutionary Hot Spot. Photochem. Photobiol. 2017, 93, 903–906. [Google Scholar] [CrossRef] [PubMed]
- Yang, Y.; Linke, M.; von Haimberger, T.; Matute, R.; González, L.; Schmieder, P.; Heyne, K.; von Haimberger, T.; Matute, R.; González, L.; et al. Active and silent chromophore isoforms for phytochrome Pr photoisomerization: An alternative evolutionary strategy to optimize photoreaction quantum yields. Struct. Dyn. 2014, 1, 014701. [Google Scholar] [CrossRef]
- Linke, M.; Yang, Y.; Zienicke, B.; Hammam, M.A.S.; Von Haimberger, T.; Zacarias, A.; Inomata, K.; Lamparter, T.; Heyne, K. Electronic transitions and heterogeneity of the bacteriophytochrome Pr absorption band: An angle balanced polarization resolved femtosecond VIS pump-IR probe study. Biophys. J. 2013, 105, 1756–1766. [Google Scholar] [CrossRef] [PubMed]
- Yang, Y.; Linke, M.; von Haimberger, T.; Hahn, J.; Matute, R.; González, L.; Schmieder, P.; Heyne, K. Real-Time Tracking of Phytochrome’s Orientational Changes During Pr Photoisomerization. J. Am. Chem. Soc. 2012, 134, 1408–1411. [Google Scholar] [CrossRef] [PubMed]
- Dasgupta, J.; Frontiera, R.R.; Taylor, K.C.; Lagarias, J.C.; Mathies, R.A. Ultrafast excited-state isomerization in phytochrome revealed by femtosecond stimulated Raman spectroscopy. Proc. Natl. Acad. Sci. USA 2009, 106, 1784–1789. [Google Scholar] [CrossRef] [PubMed]
- Müller, M.G.; Lindner, I.; Martin, I.; Gärtner, W.; Holzwarth, A.R. Femtosecond kinetics of photoconversion of the higher plant photoreceptor phytochrome carrying native and modified chromophores. Biophys. J. 2008, 94, 4370–4382. [Google Scholar] [CrossRef]
- Bischoff, M.; Hermann, G.; Rentsch, S.; Strehlow, D. First steps in the phytochrome phototransformation: A comparative femtosecond study on the forward (Pr→Pfr) and back reaction (Pfr→Pr). Biochemistry 2001, 40, 181–186. [Google Scholar] [CrossRef] [PubMed]
- Schumann, C.; Groß, R.; Michael, N.; Lamparter, T.; Diller, R. Sub-picosecond mid-infrared spectroscopy of phytochrome Agp1 from Agrobacterium tumefaciens. ChemPhysChem 2007, 8, 1657–1663. [Google Scholar] [CrossRef]
- Song, C.; Psakis, G.; Lang, C.; Mailliet, J.J.; Gartner, W.; Hughes, J.; Matysik, J.; Gärtner, W.; Hughes, J.; Matysik, J.; et al. Two ground state isoforms and a chromophore D-ring photoflip triggering extensive intramolecular changes in a canonical phytochrome. Proc. Natl. Acad. Sci. USA 2011, 108, 3842–3847. [Google Scholar] [CrossRef]
- Kim, P.W.; Rockwell, N.C.; Martin, S.S.; Lagarias, J.C.; Larsen, D.S. Dynamic Inhomogeneity in the Photodynamics of Cyanobacterial Phytochrome Cph1. Biochemistry 2014, 53, 2818–2826. [Google Scholar] [CrossRef] [PubMed]
- Toh, K.C.; Stojković, E.A.; van Stokkum, I.H.M.M.; Moffat, K.; Kennis, J.T.M.M.; Stojkovic, E.A.; van Stokkum, I.H.M.M.; Moffat, K.; Kennis, J.T.M.M.; Stojković, E.A.; et al. Proton-transfer and hydrogen-bond interactions determine fluorescence quantum yield and photochemical efficiency of bacteriophytochrome. Proc. Natl. Acad. Sci. USA 2010, 107, 9170–9175. [Google Scholar] [CrossRef] [PubMed]
- Lehtivuori, H.; Rissanen, I.; Takala, H.; Bamford, J.; Tkachenko, N.V.; Ihalainen, J.A. Fluorescence Properties of the Chromophore-Binding Domain of Bacteriophytochrome from Deinococcus radiodurans. J. Phys. Chem. B 2013, 117, 11049–11057. [Google Scholar] [CrossRef] [PubMed]
- Mathes, T.; Ravensbergen, J.; Kloz, M.; Gleichmann, T.; Gallagher, K.D.; Woitowich, N.C.; Peter, R.S.; Kovaleva, S.E.; Stojković, E.A.; Kennis, J.T.M.M. Femto- to Microsecond Photodynamics of an Unusual Bacteriophytochrome. J. Phys. Chem. Lett. 2015, 6, 239–243. [Google Scholar] [CrossRef]
- Singer, P.; Wörner, S.; Lamparter, T.; Diller, R. Spectroscopic Investigation on the Primary Photoreaction of Bathy Phytochrome Agp2-Pr of Agrobacterium fabrum: Isomerization in a pH-dependent H-bond Network. ChemPhysChem 2016, 17, 1288–1297. [Google Scholar] [CrossRef]
- Wang, D.; Qin, Y.; Zhang, M.; Li, X.; Wang, L.; Yang, X.; Zhong, D. The Origin of Ultrafast Multiphasic Dynamics in Photoisomerization of Bacteriophytochrome. J. Phys. Chem. Lett. 2020, 11, 5913–5919. [Google Scholar] [CrossRef]
- Wang, C.; Flanagan, M.L.; McGillicuddy, R.D.; Zheng, H.; Ginzburg, A.R.; Yang, X.; Moffat, K.; Engel, G.S. Bacteriophytochrome Photoisomerization Proceeds Homogeneously Despite Heterogeneity in Ground State. Biophys. J. 2016, 111, 2125–2134. [Google Scholar] [CrossRef]
- Kim, P.W.; Freer, L.H.; Rockwell, N.C.; Martin, S.S.; Lagarias, J.C.; Larsen, D.S. Femtosecond photodynamics of the red/green cyanobacteriochrome NpR6012g4 from Nostoc punctiforme. 1. Forward dynamics. Biochemistry 2012, 51, 608–618. [Google Scholar] [CrossRef]
- Chang, C.-W.W.; Gottlieb, S.M.; Kim, P.W.; Rockwell, N.C.; Lagarias, J.C.; Larsen, D.S. Reactive ground-state pathways are not ubiquitous in red/green cyanobacteriochromes. J. Phys. Chem. B 2013, 117, 11229–11238. [Google Scholar] [CrossRef]
- Gottlieb, S.M.; Kim, P.W.; Chang, C.W.; Hanke, S.J.; Hayer, R.J.; Rockwell, N.C.; Martin, S.S.; Lagarias, J.C.; Larsen, D.S. Conservation and diversity in the primary forward photodynamics of red/green cyanobacteriochromes. Biochemistry 2015, 54, 1028–1042. [Google Scholar] [CrossRef]
- Slavov, C.; Xu, X.; Zhao, K.H.; Gärtner, W.; Wachtveitl, J. Detailed insight into the ultrafast photoconversion of the cyanobacteriochrome Slr1393 from Synechocystis sp. Biochim. Biophys. Acta-Bioenerg. 2015, 1847, 1335–1344. [Google Scholar] [CrossRef]
- Wang, D.; Li, X.; Wang, L.; Yang, X.; Zhong, D. Elucidating Ultrafast Multiphasic Dynamics in the Photoisomerization of Cyanobacteriochrome. J. Phys. Chem. Lett. 2020, 11, 8819–8824. [Google Scholar] [CrossRef]
- Tachibana, S.R.; Tang, L.; Chen, C.; Zhu, L.; Takeda, Y.; Fushimi, K.; Seevers, T.K.; Narikawa, R.; Sato, M.; Fang, C. Transient electronic and vibrational signatures during reversible photoswitching of a cyanobacteriochrome photoreceptor. Spectrochim. Acta-Part. A Mol. Biomol. Spectrosc. 2021, 250, 119379. [Google Scholar] [CrossRef]
- Heyne, K.; Herbst, J.; Stehlik, D.; Esteban, B.; Lamparter, T.; Hughes, J.; Diller, R. Ultrafast dynamics of phytochrome from the cyanobacterium Synechocystis, reconstituted with phycocyanobilin and phycoerythrobilin. Biophys. J. 2002, 82, 1004–1016. [Google Scholar] [CrossRef][Green Version]
- Stensitzki, T.; Yang, Y.; Wölke, A.L.; Knapp, E.W.; Hughes, J.; Mroginski, M.A.; Heyne, K. Influence of Heterogeneity on the Ultrafast Photoisomerization Dynamics of Pfr in Cph1 Phytochrome. Photochem. Photobiol. 2017, 93, 703–712. [Google Scholar] [CrossRef] [PubMed]
- Yang, Y.; Heyne, K.; Mathies, R.A.; Dasgupta, J. Non-Bonded Interactions Drive the Sub-Picosecond Bilin Photoisomerization in the Pfr State of Phytochrome Cph1. ChemPhysChem 2016, 17, 369–374. [Google Scholar] [CrossRef] [PubMed]
- Kim, P.W.; Rockwell, N.C.; Martin, S.S.; Lagarias, J.C.; Larsen, D.S. Heterogeneous photodynamics of the Pfr state in the cyanobacterial phytochrome Cph1. Biochemistry 2014, 53, 4601–4611. [Google Scholar] [CrossRef]
- Schumann, C.; Groß, R.; Wolf, M.M.N.; Diller, R.; Michael, N.; Lamparter, T. Subpicosecond Midinfrared Spectroscopy of the Pfr Reaction of Phytochrome Agp1 from Agrobacterium tumefaciens. Biophys. J. 2008, 94, 3189–3197. [Google Scholar] [CrossRef] [PubMed][Green Version]
- Wang, D.; Qin, Y.; Zhang, S.; Wang, L.; Yang, X.; Zhong, D. Elucidating the Molecular Mechanism of Ultrafast Pfr-State Photoisomerization in Bathy Bacteriophytochrome PaBphP. J. Phys. Chem. Lett. 2019, 10, 6197–6201. [Google Scholar] [CrossRef]
- Fischer, T.; Xu, Q.; Zhao, K.H.; Gärtner, W.; Slavov, C.; Wachtveitl, J. Effect of the PHY Domain on the Photoisomerization Step of the Forward Pr→Pfr Conversion of a Knotless Phytochrome. Chem.-A Eur. J. 2020, 26, 17261–17266. [Google Scholar] [CrossRef]
- Anders, K.; Daminelli-Widany, G.; Mroginski, M.A.; Von Stetten, D.; Essen, L.O. Structure of the cyanobacterial phytochrome 2 photosensor implies a tryptophan switch for phytochrome signaling. J. Biol. Chem. 2013, 288, 35714–35725. [Google Scholar] [CrossRef]
- Slavov, C.; Hartmann, H.; Wachtveitl, J. Implementation and Evaluation of Data Analysis Strategies for Time-Resolved Optical Spectroscopy. Anal. Chem. 2015, 87, 2328–2336. [Google Scholar] [CrossRef]
- Slavov, C.; Fischer, T.; Barnoy, A.; Shin, H.; Rao, A.G.; Wiebeler, C.; Zeng, X.; Sun, Y.; Xu, Q.; Gutt, A.; et al. The interplay between chromophore and protein determines the extended excited state dynamics in a single-domain phytochrome. Proc. Natl. Acad. Sci. USA 2020, 117, 16356–16362. [Google Scholar] [CrossRef] [PubMed]
- Van Thor, J.J.; Ronayne, K.L.; Towrie, M. Formation of the early photoproduct Lumi-R of cyanobacterial phytochrome Cph1 observed by ultrafast mid-infrared spectroscopy. J. Am. Chem. Soc. 2007, 129, 126–132. [Google Scholar] [CrossRef] [PubMed]
- Escobar, F.V.; Kneip, C.; Michael, N.; Hildebrandt, T.; Tavraz, N.; Gärtner, W.; Hughes, J.; Friedrich, T.; Scheerer, P.; Mroginski, M.A.; et al. The Lumi-R Intermediates of Prototypical Phytochromes. J. Phys. Chem. B 2020, 124, 4044–4055. [Google Scholar] [CrossRef] [PubMed]
- Toh, K.C.; Stojkovicć, E.A.; Rupenyan, A.B.; van Stokkum, I.H.M.; Salumbides, M.; Groot, M.-L.; Moffat, K.; Kennis, J.T.M. Primary Reactions of Bacteriophytochrome Observed with Ultrafast Mid-Infrared Spectroscopy. J. Phys. Chem. A 2011, 115, 3778–3786. [Google Scholar] [CrossRef]
- Van Stokkum, I.H.M.M.; Larsen, D.S.; van Grondelle, R. Global and target analysis of time-resolved spectra. Biochim. Biophys. Acta-Bioenerg. 2004, 1657, 82–104. [Google Scholar] [CrossRef]
- Beckwith, J.S.; Rumble, C.A.; Vauthey, E. Data analysis in transient electronic spectroscopy–an experimentalist’s view. Int. Rev. Phys. Chem. 2020, 39, 135–216. [Google Scholar] [CrossRef]
- Buhrke, D.; Oppelt, K.T.; Heckmeier, P.J.; Fernández-Terán, R.; Hamm, P. Nanosecond protein dynamics in a red/green cyanobacteriochrome revealed by transient IR spectroscopy. J. Chem. Phys. 2020, 153, 245101. [Google Scholar] [CrossRef]
- Fischer, A.J.; Rockwell, N.C.; Jang, A.Y.; Ernst, L.A.; Waggoner, A.S.; Duan, Y.; Lei, H.; Lagarias, J.C. Multiple roles of a conserved GAF domain tyrosine residue in cyanobacterial and plant phytochromes. Biochemistry 2005, 44, 15203–15215. [Google Scholar] [CrossRef]
- Wagner, J.R.; Zhang, J.; Von Stetten, D.; Günther, M.; Murgida, D.H.; Mroginski, M.A.; Walker, J.M.; Forest, K.T.; Hildebrandt, P.; Vierstra, R.D. Mutational analysis of Deinococcus radiodurans bacteriophytochrome reveals key amino acids necessary for the photochromicity and proton exchange cycle of phytochromes. J. Biol. Chem. 2008, 283, 12212–12226. [Google Scholar] [CrossRef] [PubMed]
- Sineshchekov, V.; Mailliet, J.; Psakis, G.; Feilke, K.; Kopycki, J.; Zeidler, M.; Essen, L.; Hughes, J. Tyrosine 263 in Cyanobacterial Phytochrome Cph1 Optimizes Photochemistry at the prelumi-R→lumi-R Step. Photochem. Photobiol. 2014, 90, 786–795. [Google Scholar] [CrossRef]
- Mailliet, J.; Psakis, G.; Feilke, K.; Sineshchekov, V.; Essen, L.O.; Hughes, J. Spectroscopy and a high-resolution crystal structure of Tyr263 mutants of cyanobacterial phytochrome Cph1. J. Mol. Biol. 2011, 413, 115–127. [Google Scholar] [CrossRef]
- Kübel, J.; Chenchiliyan, M.; Ooi, S.A.; Gustavsson, E.; Isaksson, L.; Kuznetsova, V.; Ihalainen, J.A.; Westenhoff, S.; Maj, M. Transient IR spectroscopy identifies key interactions and unravels new intermediates in the photocycle of a bacterial phytochrome. Phys. Chem. Chem. Phys. 2020, 22, 9195–9203. [Google Scholar] [CrossRef]
- Kurttila, M.; Stucki-Buchli, B.; Rumfeldt, J.; Schroeder, L.; Häkkänen, H.; Liukkonen, A.; Takala, H.; Kottke, T.; Ihalainen, J.A. Site-by-site tracking of signal transduction in an azidophenylalanine-labeled bacteriophytochrome with step-scan FTIR spectroscopy. Phys. Chem. Chem. Phys. 2021, 23, 5615–5628. [Google Scholar] [CrossRef]
- Rumfeldt, J.A.; Takala, H.; Liukkonen, A.; Ihalainen, J.A. UV-Vis Spectroscopy Reveals a Correlation Between Y263 and BV Protonation States in Bacteriophytochromes. Photochem. Photobiol. 2019, 95, 969–979. [Google Scholar] [CrossRef] [PubMed]
- Escobar, F.V.; von Stetten, D.; Günther-Lütkens, M.; Keidel, A.; Michael, N.; Lamparter, T.; Essen, L.O.; Hughes, J.; Gärtner, W.; Yang, Y.; et al. Conformational heterogeneity of the Pfr chromophore in plant and cyanobacterial phytochromes. Front. Mol. Biosci. 2015, 2, 1–13. [Google Scholar] [CrossRef]
- Kim, P.W.; Pan, J.; Rockwell, N.C.; Chang, C.W.; Taylor, K.C.; Lagarias, J.C.; Larsen, D.S. Ultrafast e to Z photoisomerization dynamics of the Cph1 phytochrome. Chem. Phys. Lett. 2012, 549, 86–92. [Google Scholar] [CrossRef][Green Version]
- Slavov, C.; Bellakbil, N.; Wahl, J.; Mayer, K.; Rück-Braun, K.; Burghardt, I.; Wachtveitl, J.; Braun, M. Ultrafast coherent oscillations reveal a reactive mode in the ring-opening reaction of fulgides. Phys. Chem. Chem. Phys. 2015, 17, 14045–14053. [Google Scholar] [CrossRef] [PubMed]
- Wilhelm, T.; Piel, J.; Riedle, E. Sub-20-fs pulses tunable across the visible from a blue-pumped single-pass noncollinear parametric converter. Opt. Lett. 1997, 22, 1494. [Google Scholar] [CrossRef]
- Riedle, E.; Beutter, M.; Lochbrunner, S.; Piel, J.; Schenkl, S.; Spörlein, S.; Zinth, W. Generation of 10 to 50 fs pulses tunable through all of the visible and the NIR. Appl. Phys. B 2000, 71, 457–465. [Google Scholar] [CrossRef]
- Bredenbeck, J.; Hamm, P. Versatile small volume closed-cycle flow cell system for transient spectroscopy at high repetition rates. Rev. Sci. Instrum. 2003, 74, 3188–3189. [Google Scholar] [CrossRef]
- Croce, R.; Müller, M.G.; Bassi, R.; Holzwarth, A.R. Carotenoid-to-chlorophyll energy transfer in recombinant major light-harvesting complex (LHCII) of higher plants. I. Femtosecond transient absorption measurements. Biophys. J. 2001, 80, 901–915. [Google Scholar] [CrossRef]


Publisher’s Note: MDPI stays neutral with regard to jurisdictional claims in published maps and institutional affiliations. |
© 2021 by the authors. Licensee MDPI, Basel, Switzerland. This article is an open access article distributed under the terms and conditions of the Creative Commons Attribution (CC BY) license (https://creativecommons.org/licenses/by/4.0/).
Share and Cite
Fischer, T.; van Wilderen, L.J.G.W.; Gnau, P.; Bredenbeck, J.; Essen, L.-O.; Wachtveitl, J.; Slavov, C. Ultrafast Photoconversion Dynamics of the Knotless Phytochrome SynCph2. Int. J. Mol. Sci. 2021, 22, 10690. https://doi.org/10.3390/ijms221910690
Fischer T, van Wilderen LJGW, Gnau P, Bredenbeck J, Essen L-O, Wachtveitl J, Slavov C. Ultrafast Photoconversion Dynamics of the Knotless Phytochrome SynCph2. International Journal of Molecular Sciences. 2021; 22(19):10690. https://doi.org/10.3390/ijms221910690
Chicago/Turabian StyleFischer, Tobias, Luuk J. G. W. van Wilderen, Petra Gnau, Jens Bredenbeck, Lars-Oliver Essen, Josef Wachtveitl, and Chavdar Slavov. 2021. "Ultrafast Photoconversion Dynamics of the Knotless Phytochrome SynCph2" International Journal of Molecular Sciences 22, no. 19: 10690. https://doi.org/10.3390/ijms221910690
APA StyleFischer, T., van Wilderen, L. J. G. W., Gnau, P., Bredenbeck, J., Essen, L.-O., Wachtveitl, J., & Slavov, C. (2021). Ultrafast Photoconversion Dynamics of the Knotless Phytochrome SynCph2. International Journal of Molecular Sciences, 22(19), 10690. https://doi.org/10.3390/ijms221910690