1. Introduction
The main medium along the metabolic pathways, pharmaceutical and biological processes is water. The characteristic structure of water in condensed, solid and liquid, phases is determined by the existing hydrogen bond system between water molecules. Water is a protic solvent, and therefore plays an extraordinarily important role in life. In aqueous solutions there is a competition between weak interactions of individual water molecules and interactions between water molecules and solutes [
1,
2,
3]. Differently sized and structured liquid phase water clusters are in competitive equilibrium with each other because of the few ten kJ/mol bonding strength of hydrogen bonds. Due to the weak behavior of both the water-water and the water-solute interactions, temperature and dissolved solutes can fundamentally affect the structure of water in a liquid phase.
Solutes are characterized as kosmotropic or chaotropic when they improve or destroy the order of water structure by stabilizing or disrupting water-water interactions. Small size and high charge density accompany kosmotropic ions and large sizes with low charge density chaotropes [
4].
Particular interest surrounds the weak interactions of water molecules and biomolecules, even though the structure of water itself is a very interesting topic in its own right. Our research group conducted several investigations through the last 20 years on the field of weak interactions between biologically important molecules in aqueous media with a focus on how water molecules reorganize themselves after leaving the hydration shell of the molecules interacted [
5,
6]. Besides the structure of pure water, the weak interactions of water and bioactive molecules attract distinct attention in the fields of pharmacy, life, and medical sciences also through quantum chemical topology [
7,
8] because the equilibrium of complex formation is fundamentally dependent on the variation of entropy.
It is well-known, that the wide band around 3200 cm
−1 and 3400 cm
−1 in the Raman spectra of water is associated with molecular vibrations coming from the stretching of O-H···O bonds and a Raman spectroscopy commonly used to investigate water structure. There is still no consensus on how to deconvolute the aforementioned wide band [
9,
10], it is a challenge to identify the particular characteristic vibrations: the same enveloping curve can be made of differently weighted and different number of peaks; therefore, different research groups have quite different results. Plenty of experimental and theoretical work is carried out to describe the structure of bulk [
11], liquid [
12,
13,
14,
15,
16], supercritical [
13] water molecules confined in different media [
17,
18], on different surfaces [
19,
20] and even in the effect of different isotopes [
21]. Several models were built to describe linear or cyclic (H
2O)
n clusters of different sizes (n = 2, 3, 4, …, 60) and spatial clusters either fullerene-like macro (n = 100, 280, 320) structures [
22,
23] or formed of those cyclic clusters. Previously performed experimental and modelling works showed the temperature dependence of the size and distribution of water clusters and clusters of primary alcohols [
24,
25,
26,
27].
This study focuses on the change of water structure in lieu of the ionic solutes of chaotropic sodium and potassium perchlorate and the kosmotropic sodium and potassium sulphate. The samples were excited by non-coherent radiation of Xe-lamp and the temperature-dependent Raman spectra were recorded.
2. Results
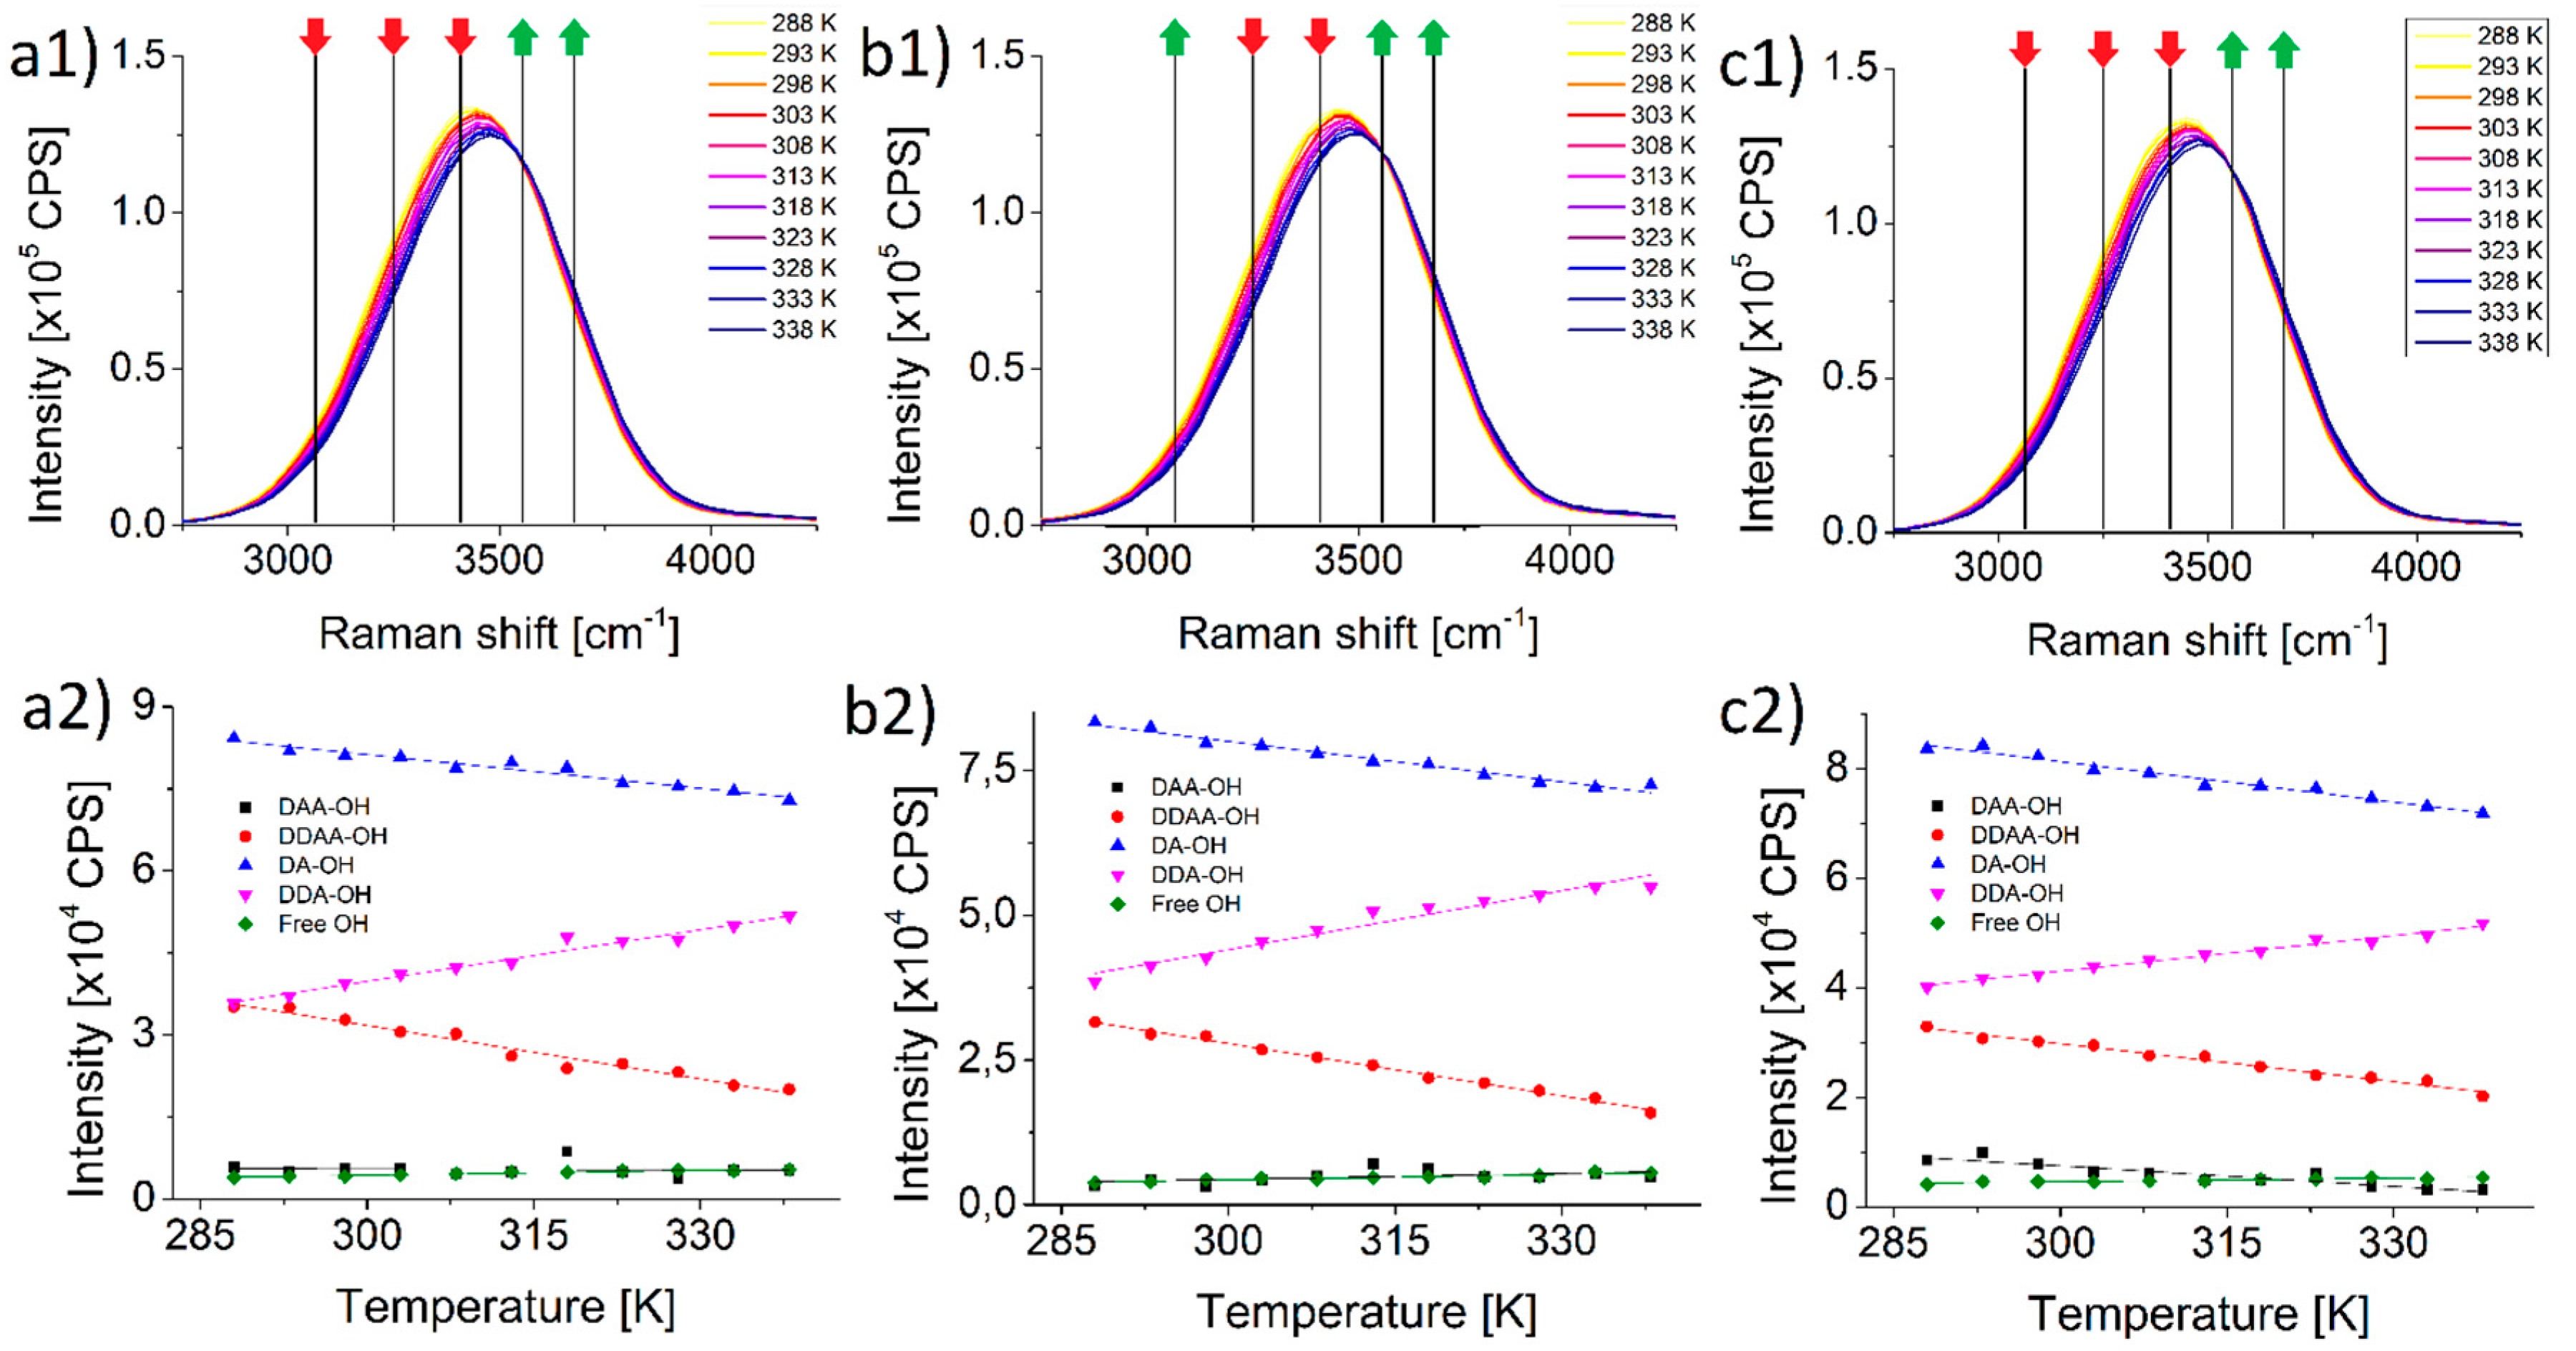
Figure 1(a1–c1) shows the Raman spectra of pure water, potassium and sodium perchlorate solutions, respectively. The three series are nearly identical, no considerable difference can be observed.
Figure 1(a2–c2) insets show a more refined picture. Even though the amplitude changes look similar after deconvolution,
Table 1 details how differently the two salts behave. In the case of peaks DDAA-OH and DA-OH the change is clearly growing with the cation compared with pure water. On the other hand, with the three other species (DAA-OH, DDAA-OH and free OH) the two salts behave quite differently, opposing each other. The number of water molecules engaged in the DAA-OH bond grow significantly in the presence of potassium perchlorate, and drops rapidly in the presence of sodium perchlorate compared with pure water. In the case of DDA-bonded and free water molecules the changes are more pronounced and stronger in the potassium perchlorate solution, while in the sodium perchlorate solution they are milder than in pure water.
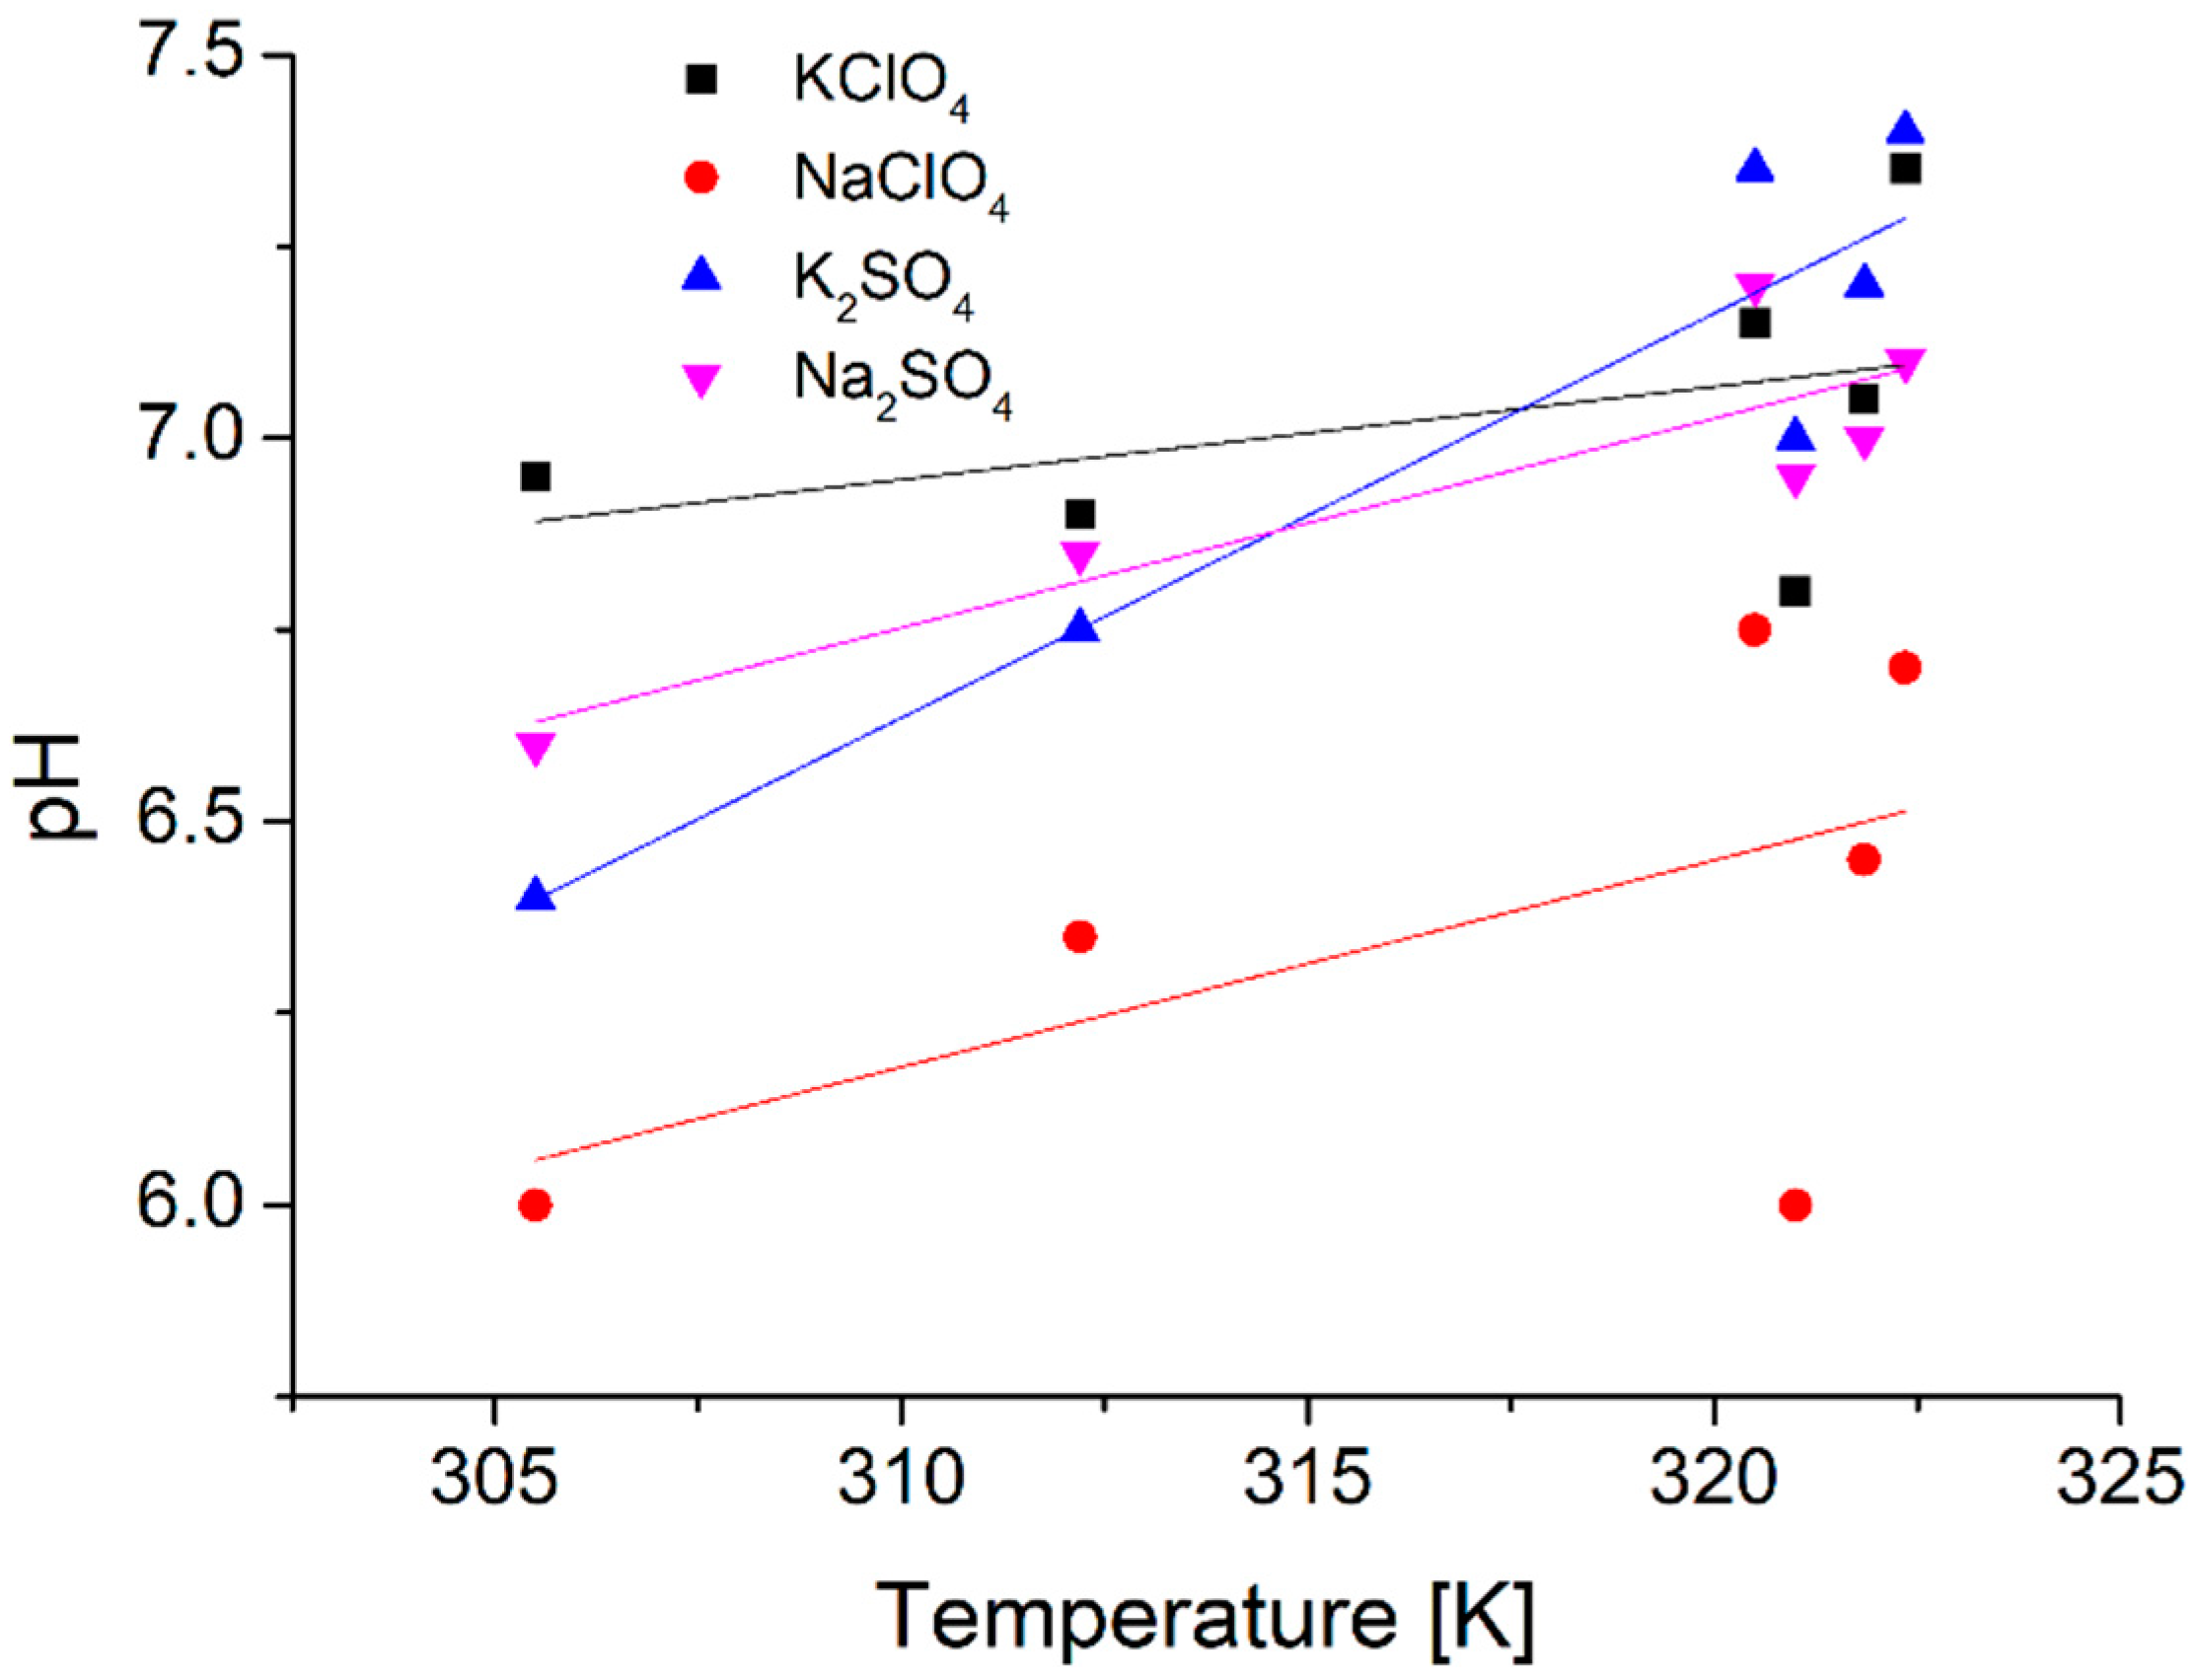
Measurements also showed another difference between pure water and aqueous perchlorate solutions, the pH of water dropped (−0.64), while those of the salt solutions rose (+0.89 for potassium and +1.43 for sodium perchlorate) to a 50 K change in temperature (
Figure 2).
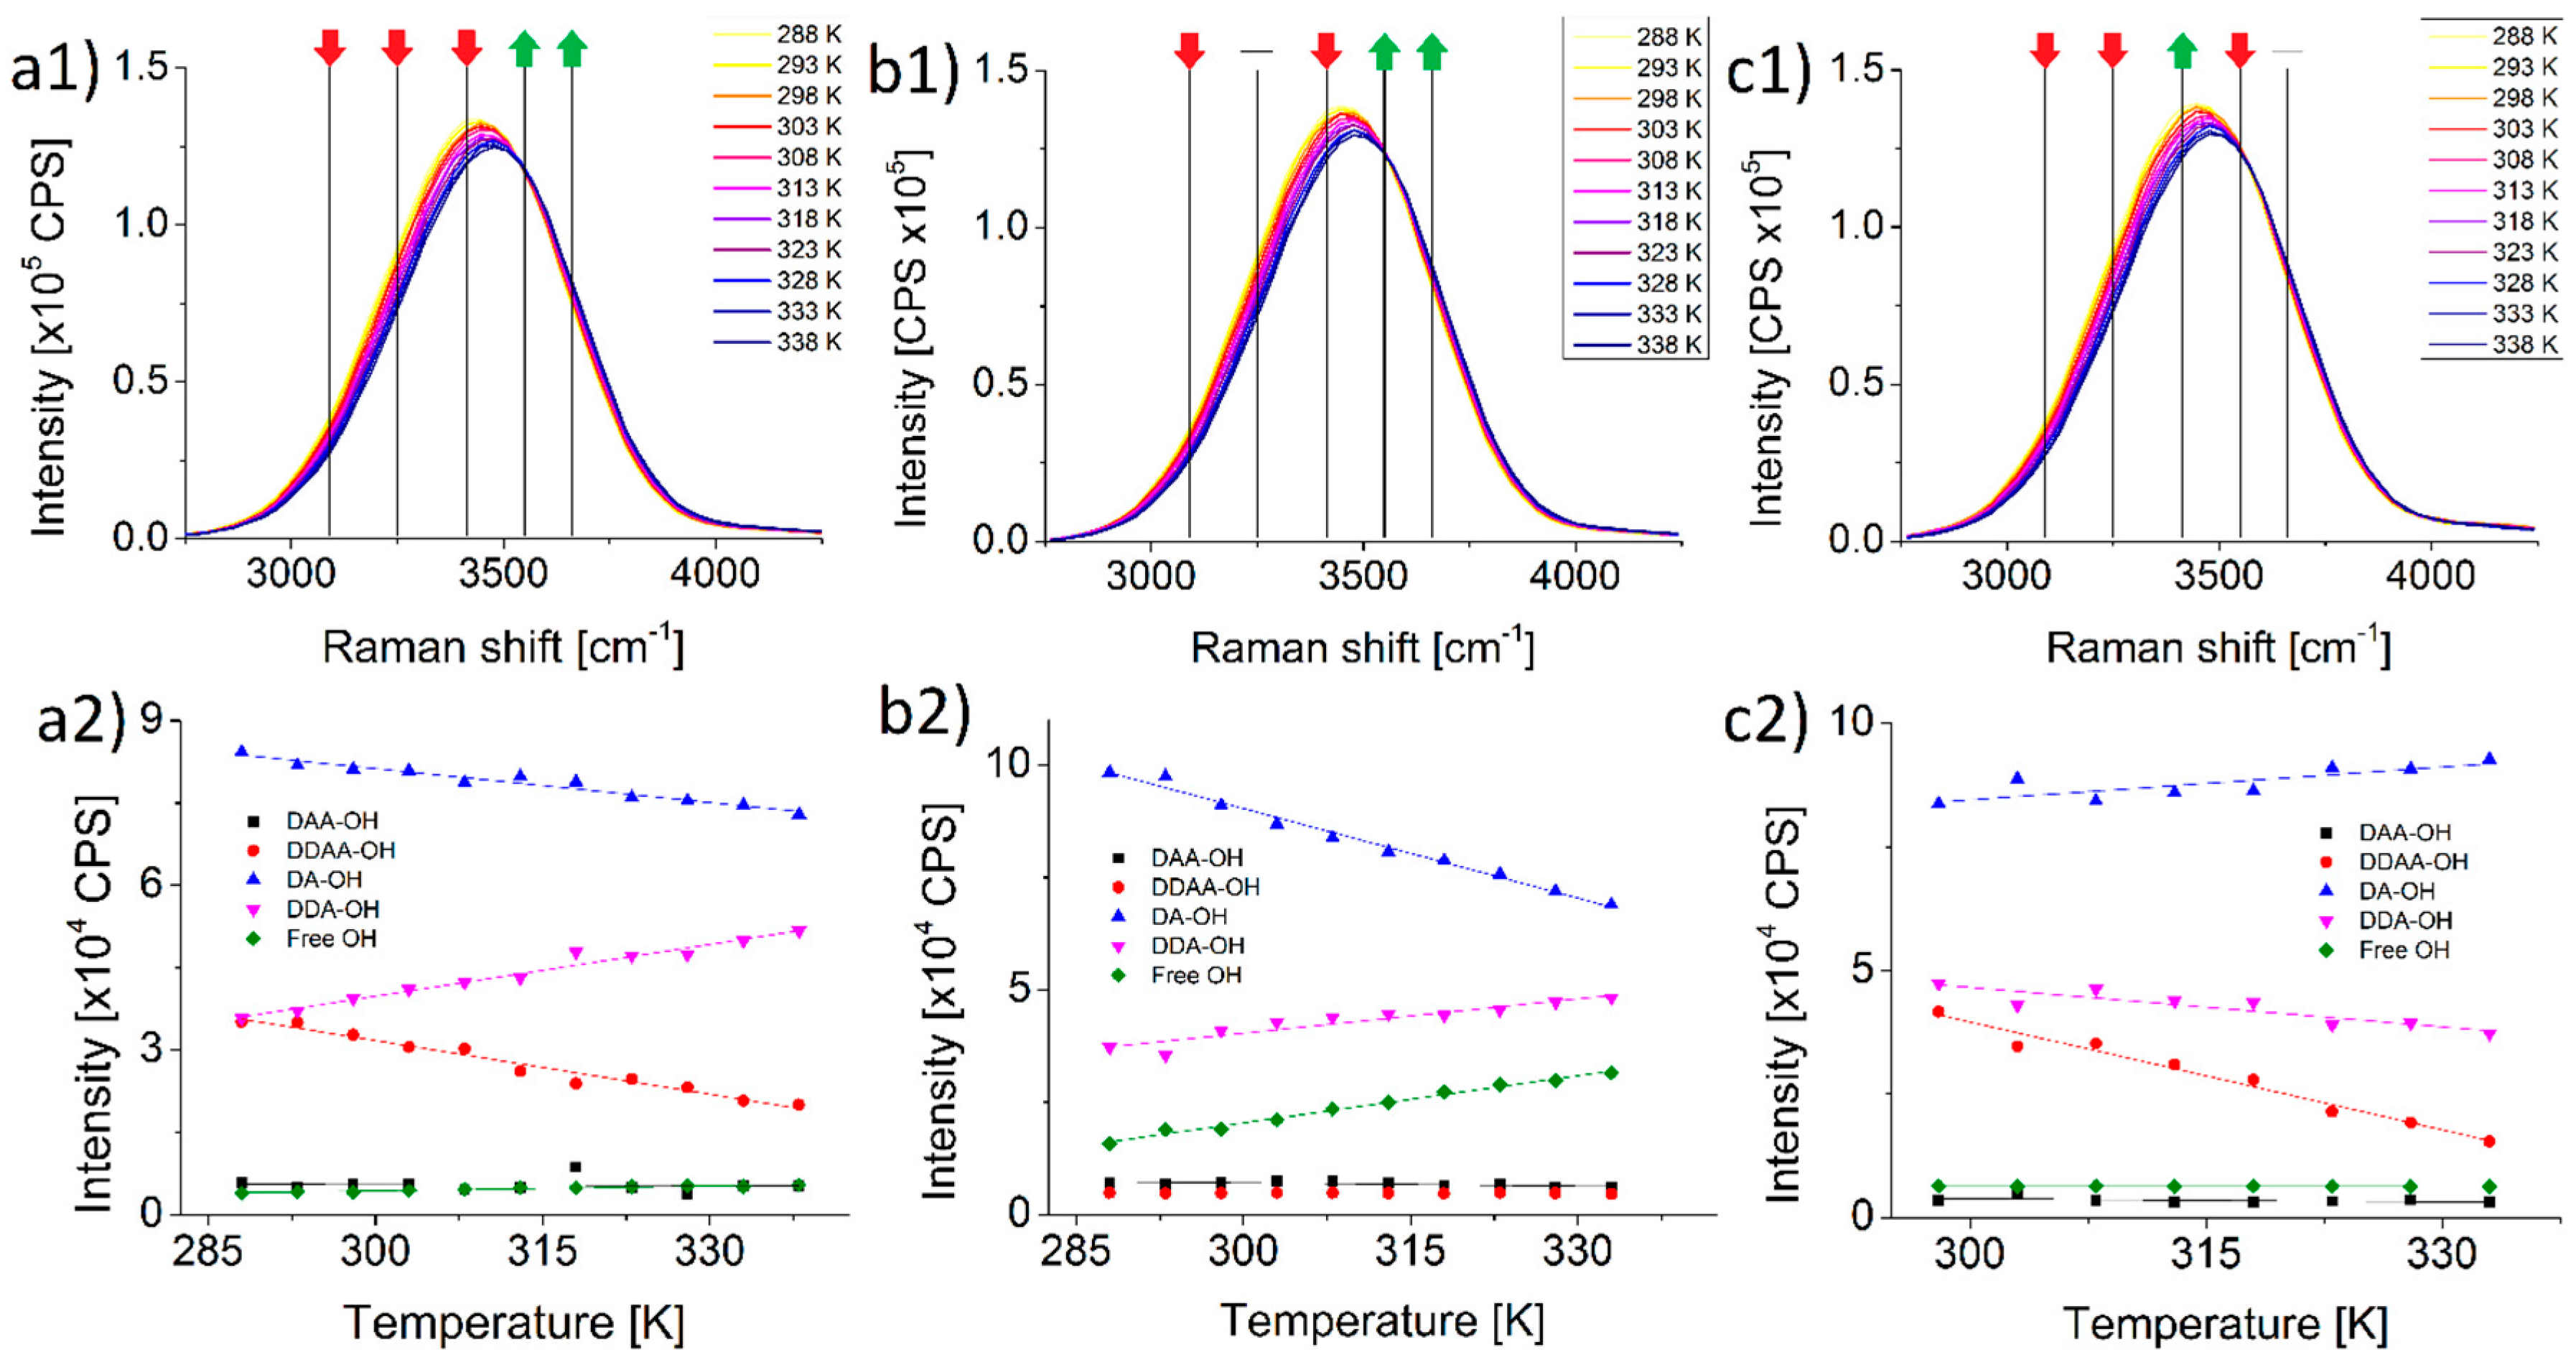
On
Figure 3(a1–c1) insets it is shown how the Raman spectra of 100 mM aqueous K
2SO
4 and Na
2SO
4 solutions differ from that of ultrapure water. The three spectra are virtually identical.
On
Figure 3(a2–c2) insets it is shown how the course of both of DA-OH and DDA-OH peaks are the complete opposite of each other in the case of these two salts. The number of DA-bonded water molecules in pure water drops with rising temperature (even more pronounced in K
2SO
4 solution) rises in Na
2SO
4. The same plays out with DDA-bonded water molecules, in pure water and in K
2SO
4 solution the peak rises, while in Na
2SO
4 solution it drops significantly. The number of DDAA-bonded water molecules interestingly stays the same in the K
2SO
4 solution but drops in Na
2SO
4 solution, the opposite is true for the number of free water molecules.
Measurements showed an even greater rise of pH for the sulfate solutions: +2.84 for the potassium and +1.31 for the sodium sulfate solvents for the 50 K temperature change.
It was recently confirmed that the lifetime of water clusters in liquid water is extremely short, it is less than a few picoseconds [
28]. Within this timeframe the hydrogen bonds continuously form and disappear emphasizing the weak interactions between water molecules. It is a daunting challenge to design an appropriate model based on such weak interactions, especially if we consider that the molecular environment itself has a deep impact on these interactions. Although there are several solvent models to take the environment into account in this particular case, the cluster is surrounded by other clusters, whose structure is also unknown. To take at least a small step towards the true picture of reality we decided to calculate the stability of (H
2O)
3 clusters as a function of temperature in the absence and presence of potassium and sodium ions.
Table 2 summarizes these results.
Compared with our previous study of (H
2O)
3 clusters in a vacuum [
29] a lower stability is obtained after the introduction of an aqueous environment through the PCM method. The stability of clusters decreases at higher temperatures. Even though the presence of potassium and sodium ions slightly weakens the cluster stability, they have an opposite temperature dependent effect, the presence of potassium ions decreases, and the presence of sodium ions increases the cluster stability. This result is in agreement with our experiments. It can be clearly seen that the formation of (H
2O)
3 clusters is enthalpy-driven in the case of pure water and entropy-driven in the presence of sodium ions. In the case of potassium ions, the entropy change is also negative, but it is a much smaller number than it is observed for pure water. It must be noted however that even though this model justifies our experimental results there can also be other underlying processes in the works in the solution supplying a congruent effect. Further examinations are necessary to clarify the processes at the molecular level.
3. Discussion
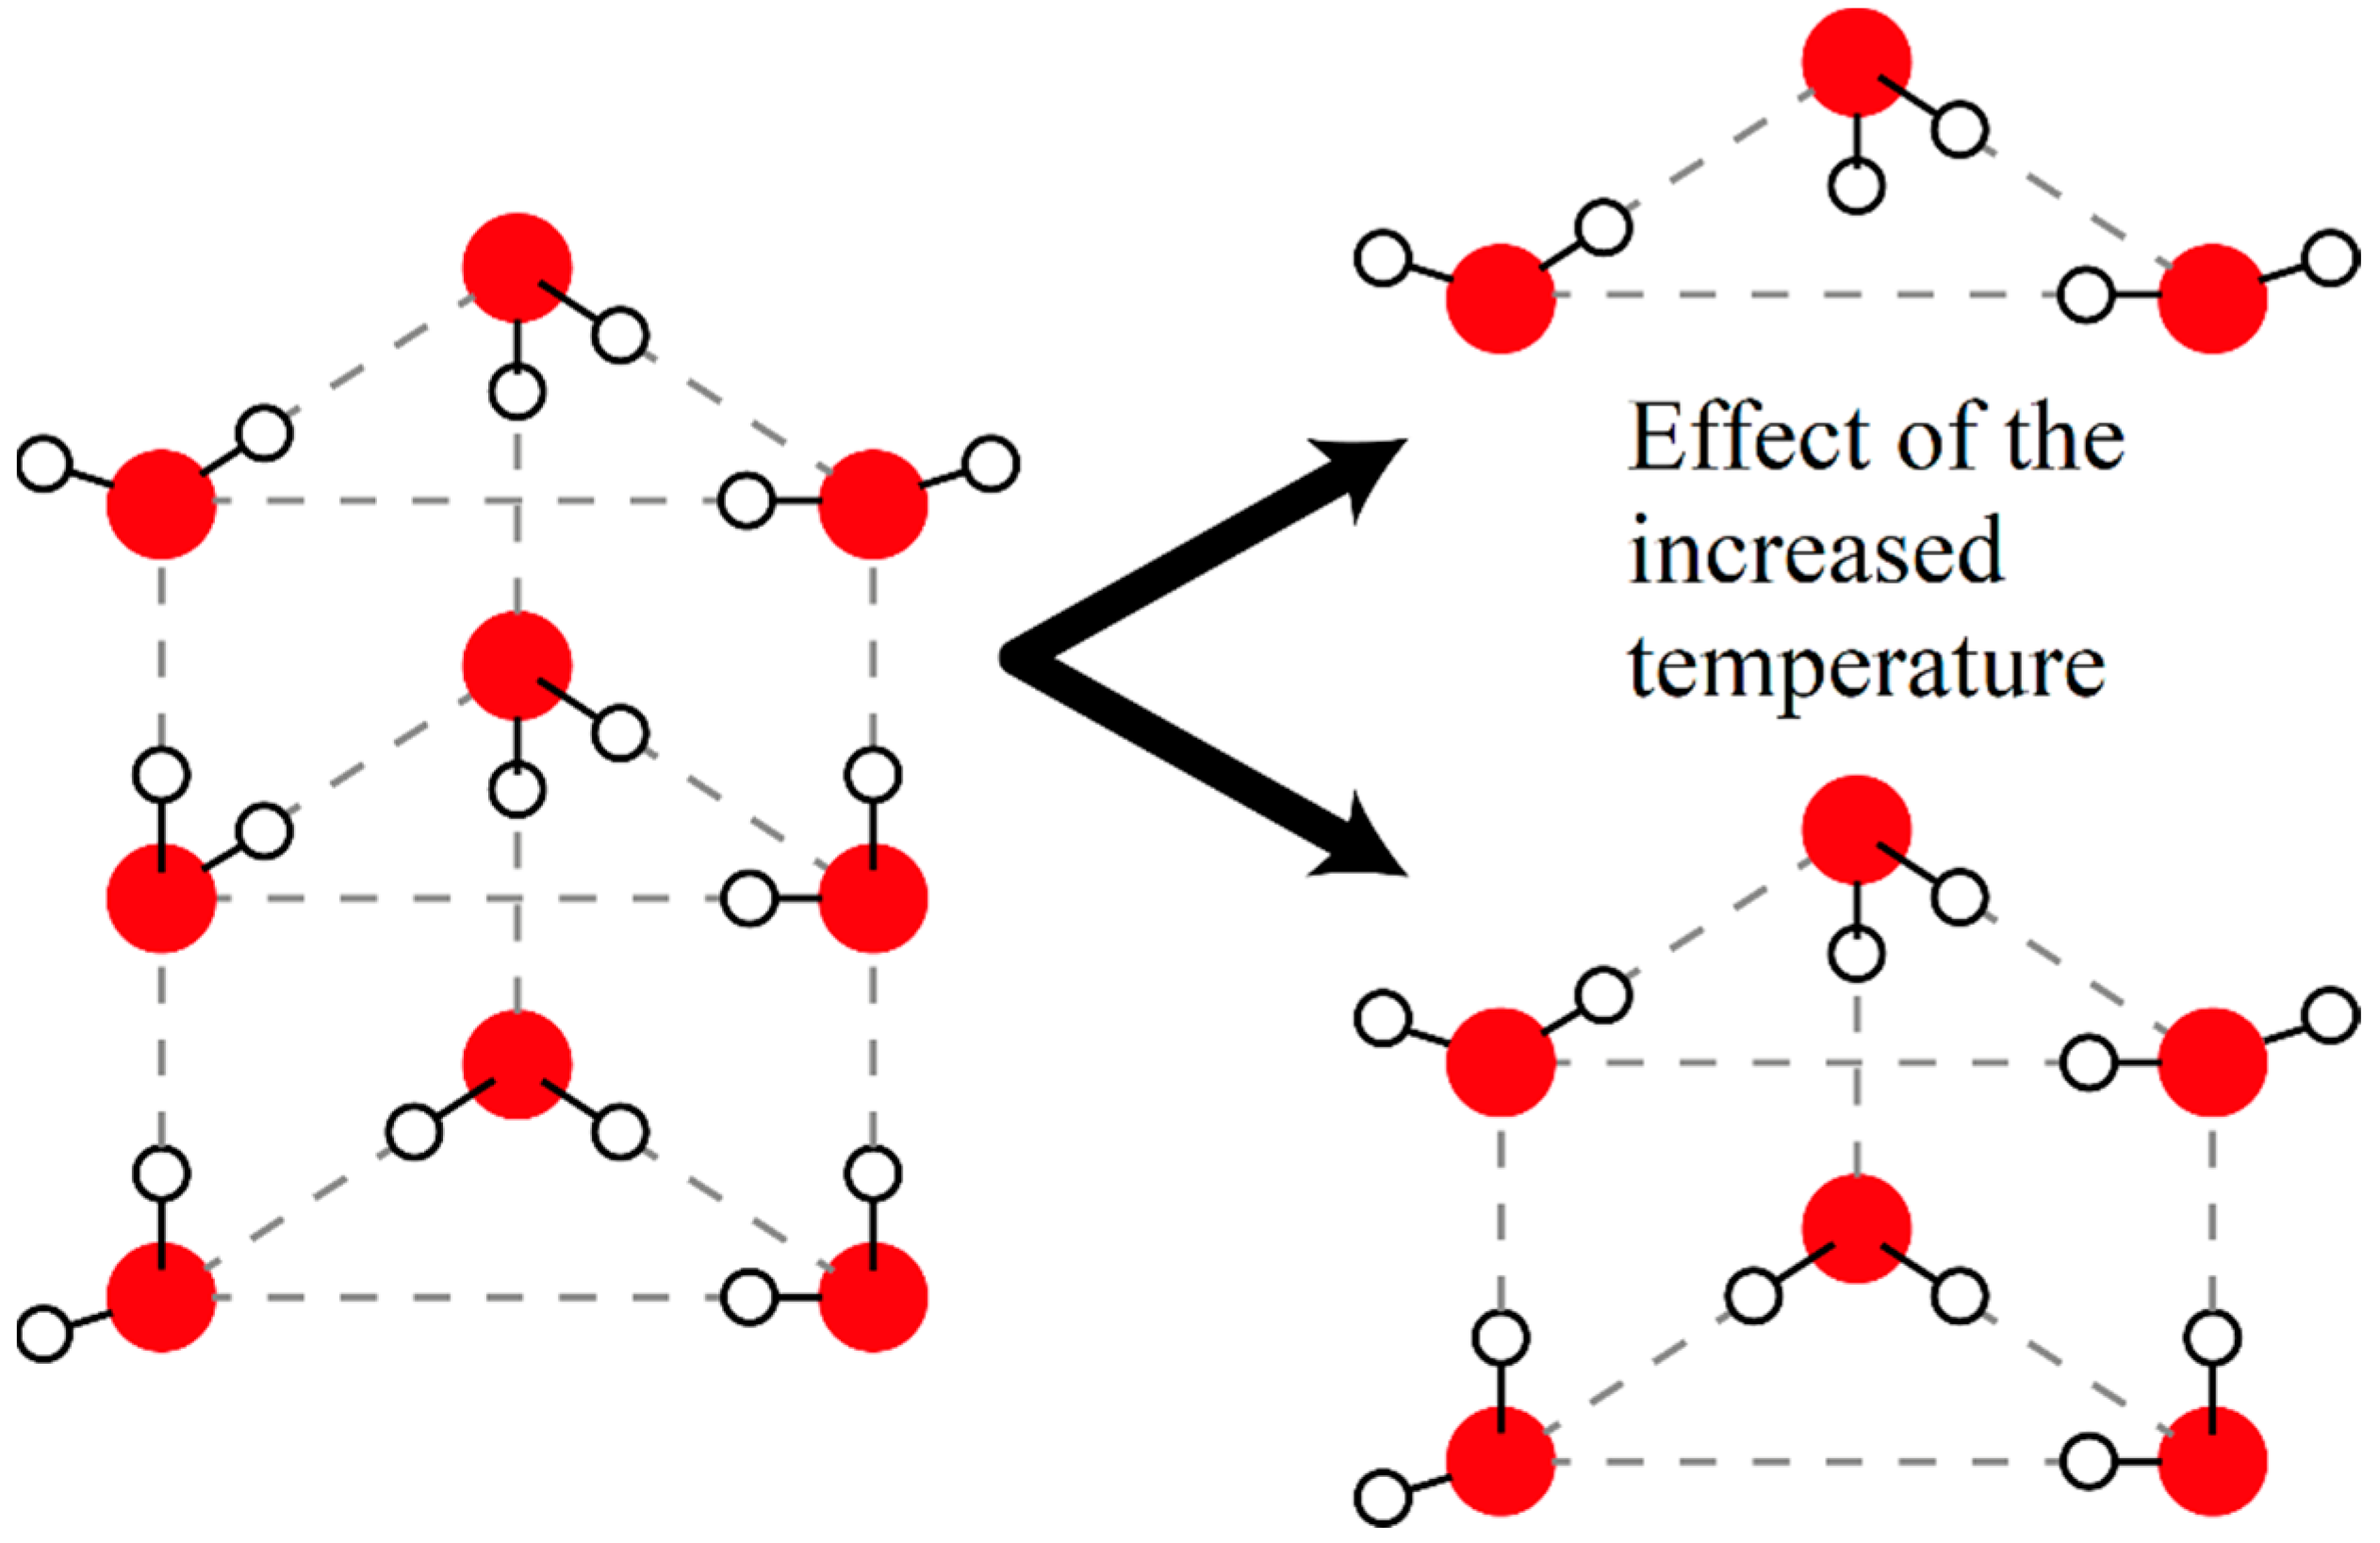
In the aqueous KClO
4 solution it was observed that the number of DAA- and DDA-bonded water molecules rises and the number of DDAA-bonded water molecules drops with increasing temperature. This phenomenon may be caused by the breaking of multi-ring clusters into smaller pieces (see
Figure 4). The water molecules sitting in the middle ring are DDAA-bonded until the moment the top ring breaks off this cluster, when this happens those water molecules will be bonded only with three other water molecules and so their state becomes DAA- or DDA-bonded instead of the previous state. The water molecules constituting the top ring are DAA- and DDA-bonded up until the break off, then they become bonded only by themselves forming a ring with DA-bonds. The measurable increase in the pH is probably caused by the reversal of the usual temperature-induced dissociation of water molecules.
In the aqueous K2SO4 solution, the number of DDAA-bonded water molecules (and so multi-ring clusters) is practically preserved meanwhile the DA-bonded peak loses and the free water peak gains significance dramatically. This may mean that in the K2SO4 solution, the primary source of free water molecules in temperature-induced breakdowns, are DA-bonded water molecules or water rings. At the same time the multi-ring clusters seem to be preserved from the same breaking up. The pH change was by far the most pronounced of all the samples in the presence of K2SO4, which concurs with the most significant rise in the number of free water molecules. This is possibly due to the association of hydrogen and oxonium ions.
In the aqueous Na2SO4 solution the opposite seems to happen, the number of DAA-, DDAA- and DDA-bonded water molecules drop (the DDAA-OH dramatically) while the number of DA-bonded molecules rises significantly, and the free ones stay the same. This suggests that multi-ring clusters break off into single rings, but those rings become more and more stable and their presence pronounced. It is interesting that the number of free water molecules is constant even if the pH rises. It is a fairly obvious assumption that the previously dissociated water molecules recombine at the same rate as previously free water molecules form up into rings, all the while the temperature increases.
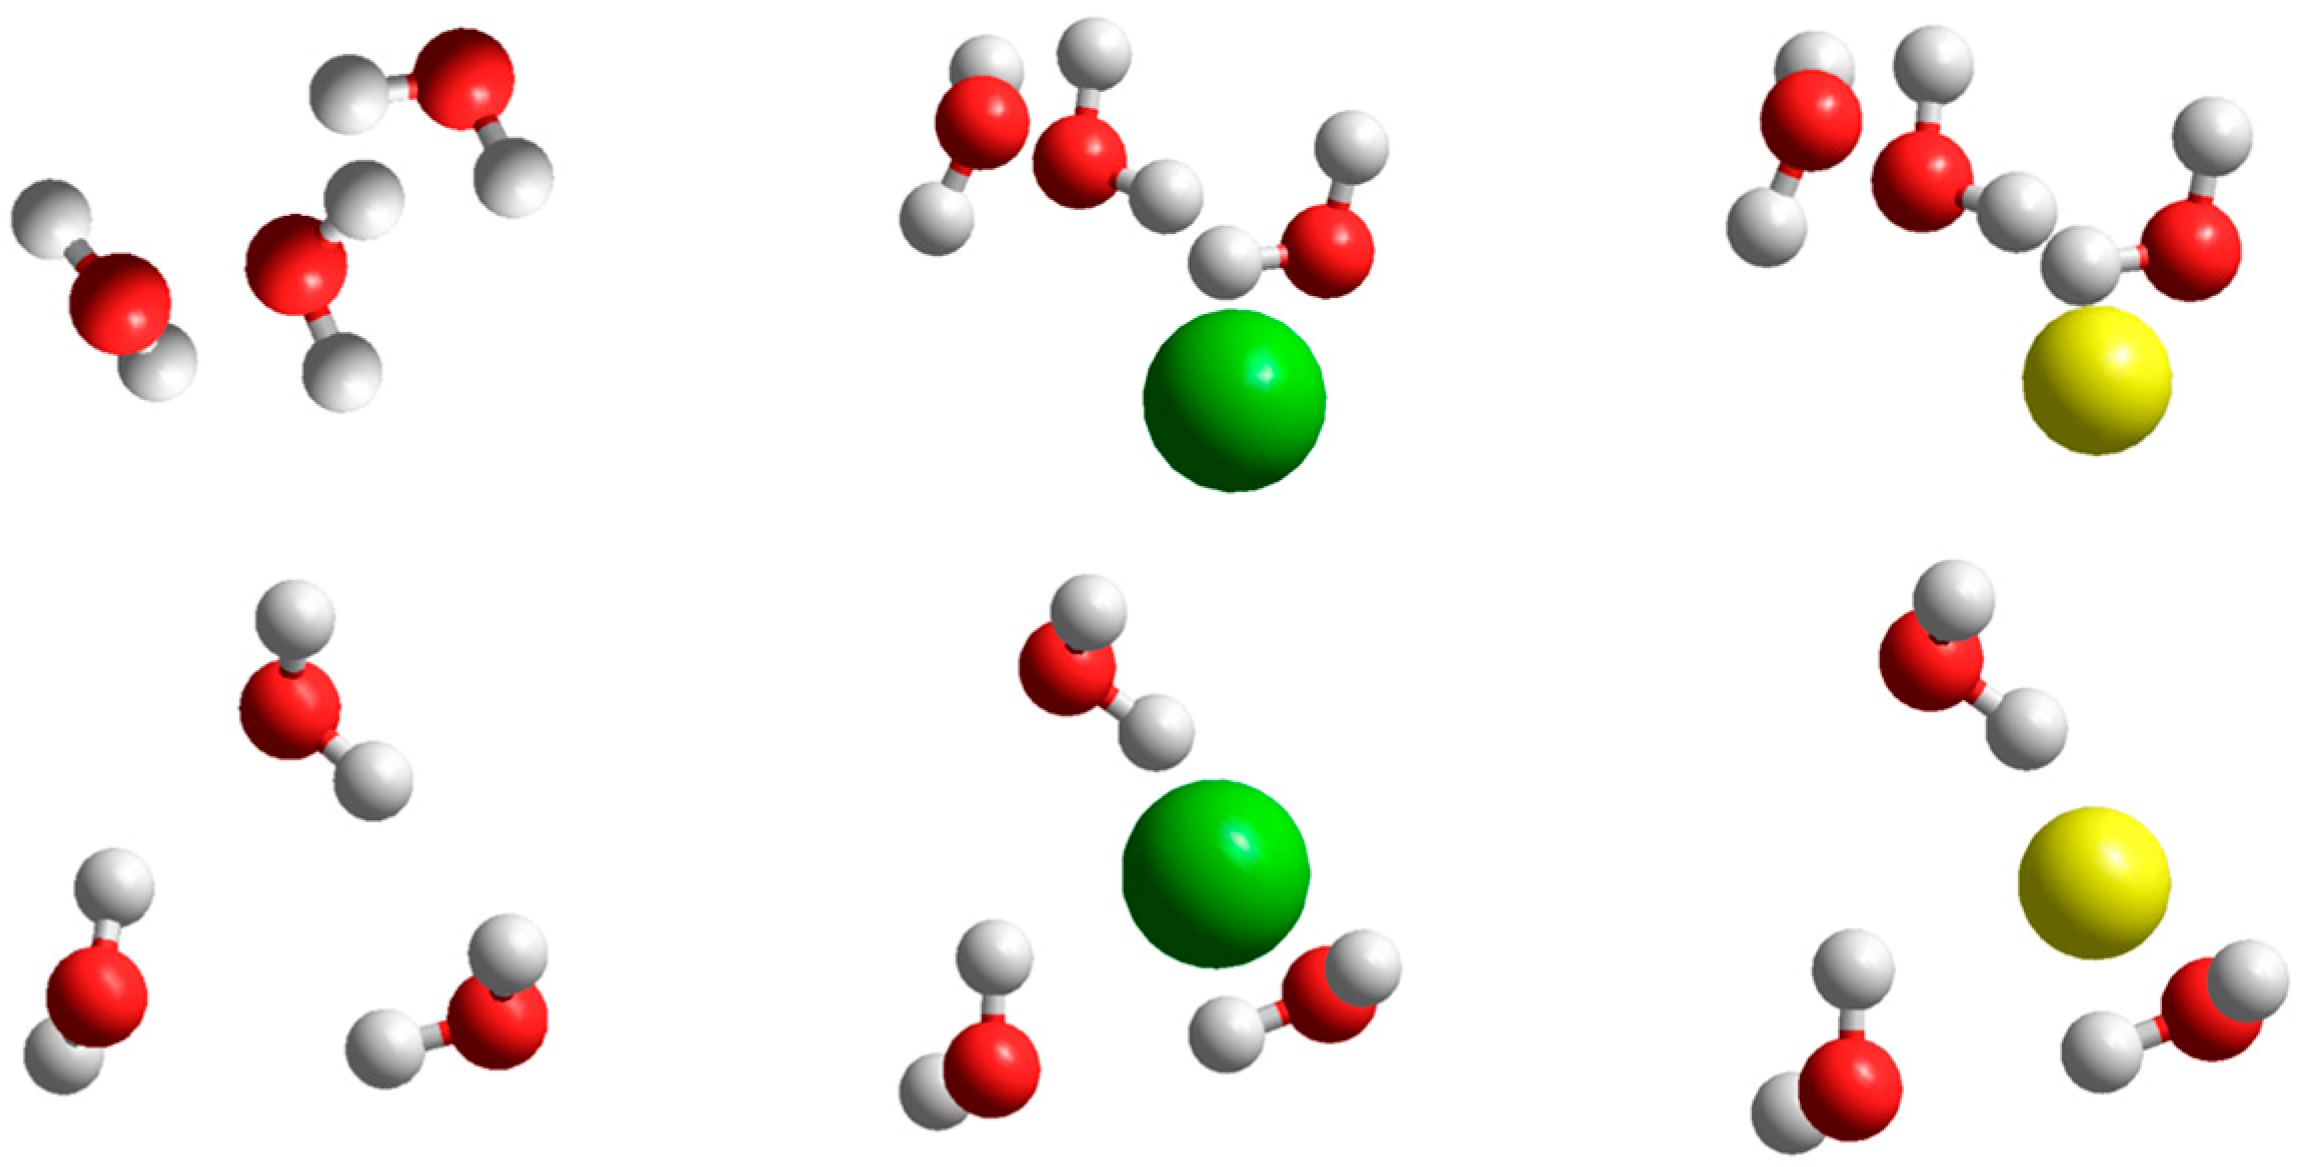
A quantum-chemical investigation confirms the presence of stable (H
2O)
9 clusters. Optimized structures in the absence or in the presence of potassium and sodium ions are shown in
Figure 5. The structure of (H
2O)
9 clusters are very similar to those proposed by Tachikawa [
31], and the presence of potassium or sodium ions does not change the structure significantly.
4. Materials and Methods
4.1. Chemicals
A Merck Elix Essential water purification system combined with a Progard TS2 Pretreatment Pack and a Type 2 Water vent filter was utilized to produce ultrapure water. The conductivity (less than 0.1 µS/cm) check made sure that the expected water quality is achieved. Spectroscopic grade sodium perchlorate, and potassium perchlorate, and sodium and potassium sulfate were obtained from Reanal Budapest and was used as received. A concentration of 100 mM aqueous solutions of NaClO4, KClO4, Na2SO4, and K2SO4 were prepared using pure water as a solvent.
The two-point calibration of the pH meter was performed using the Scharlau buffer solutions as received. The Scharlau potassium hydrogen phthalate buffer solution acted as a pH 4 and the Scharlau sodium carbonate/sodium hydrogen carbonate buffer acted as pH 10 calibration solution.
4.2. Instruments and Experimental Setup
For measurements, a Jobin Yvon—Spex Fluorolog tau 3 spectrofluorimeter with a Xenon light source was used. The Raman scattering of water was recorded within the 365 nm–450 nm spectral range by 0.5 nm steps using 0.5 s integration time. Both for the excitation and emission sides a bandwidth of 3 nm was used. Each spectrum was constructed by averaging 50 Raman spectra measured from 288 K to 338 K in 5 K increments. For data evaluation OriginPro 8.5.1 was used.
For pH-measurements a two-point calibrated Adwa AD2000 pH and temperature meter was used.
4.3. Theoretical Calculations
The water cluster structures were optimized using the B3LYP density functional [
32,
33] augmented with the D3 dispersion correction [
34] of Grimme et al. The geometry optimizations and the vibrational analysis were performed using the TZVP basis set [
35]. The intra-cluster interaction energies (
Eint) were determined according to Equation (1) using the QZVP basis set [
36]. Energies are corrected for the basis set superposition error (BSSE) [
37]:
where
E is the total energy of the species interacted. Gibbs free energies of interaction Δ
Gint were obtained from the BSSE-corrected B3LYP-D3/QZP interaction energies combined with non-thermal (ZPE) and thermal corrections
dGcorr resulting from the TZVP frequency analysis at
T = 298.15 K and
p = 1 atm. The temperature-dependence of the entropy is considered through the following equation:
where
νi is the frequency of vibration and
T is the temperature.
For the rotational partition function no symmetry is considered; therefore, the appropriate symmetry number
s = 1 is chosen. Gibbs free energy changes are calculated as follows:
All calculations were performed with a very tight SCF cutoff and integration grid size of 5, together with tight geometry optimization criteria. In addition to B3LYP-D3 the M06-2X density functional [
38,
39] as implemented in the Gaussian 09 program [
40] with the aug-cc pVTZ basis set [
41] was also used. The PCM solvent model implemented in the Gaussian code is applied to consider the high permittivity of water [
42].
4.4. Data Processing
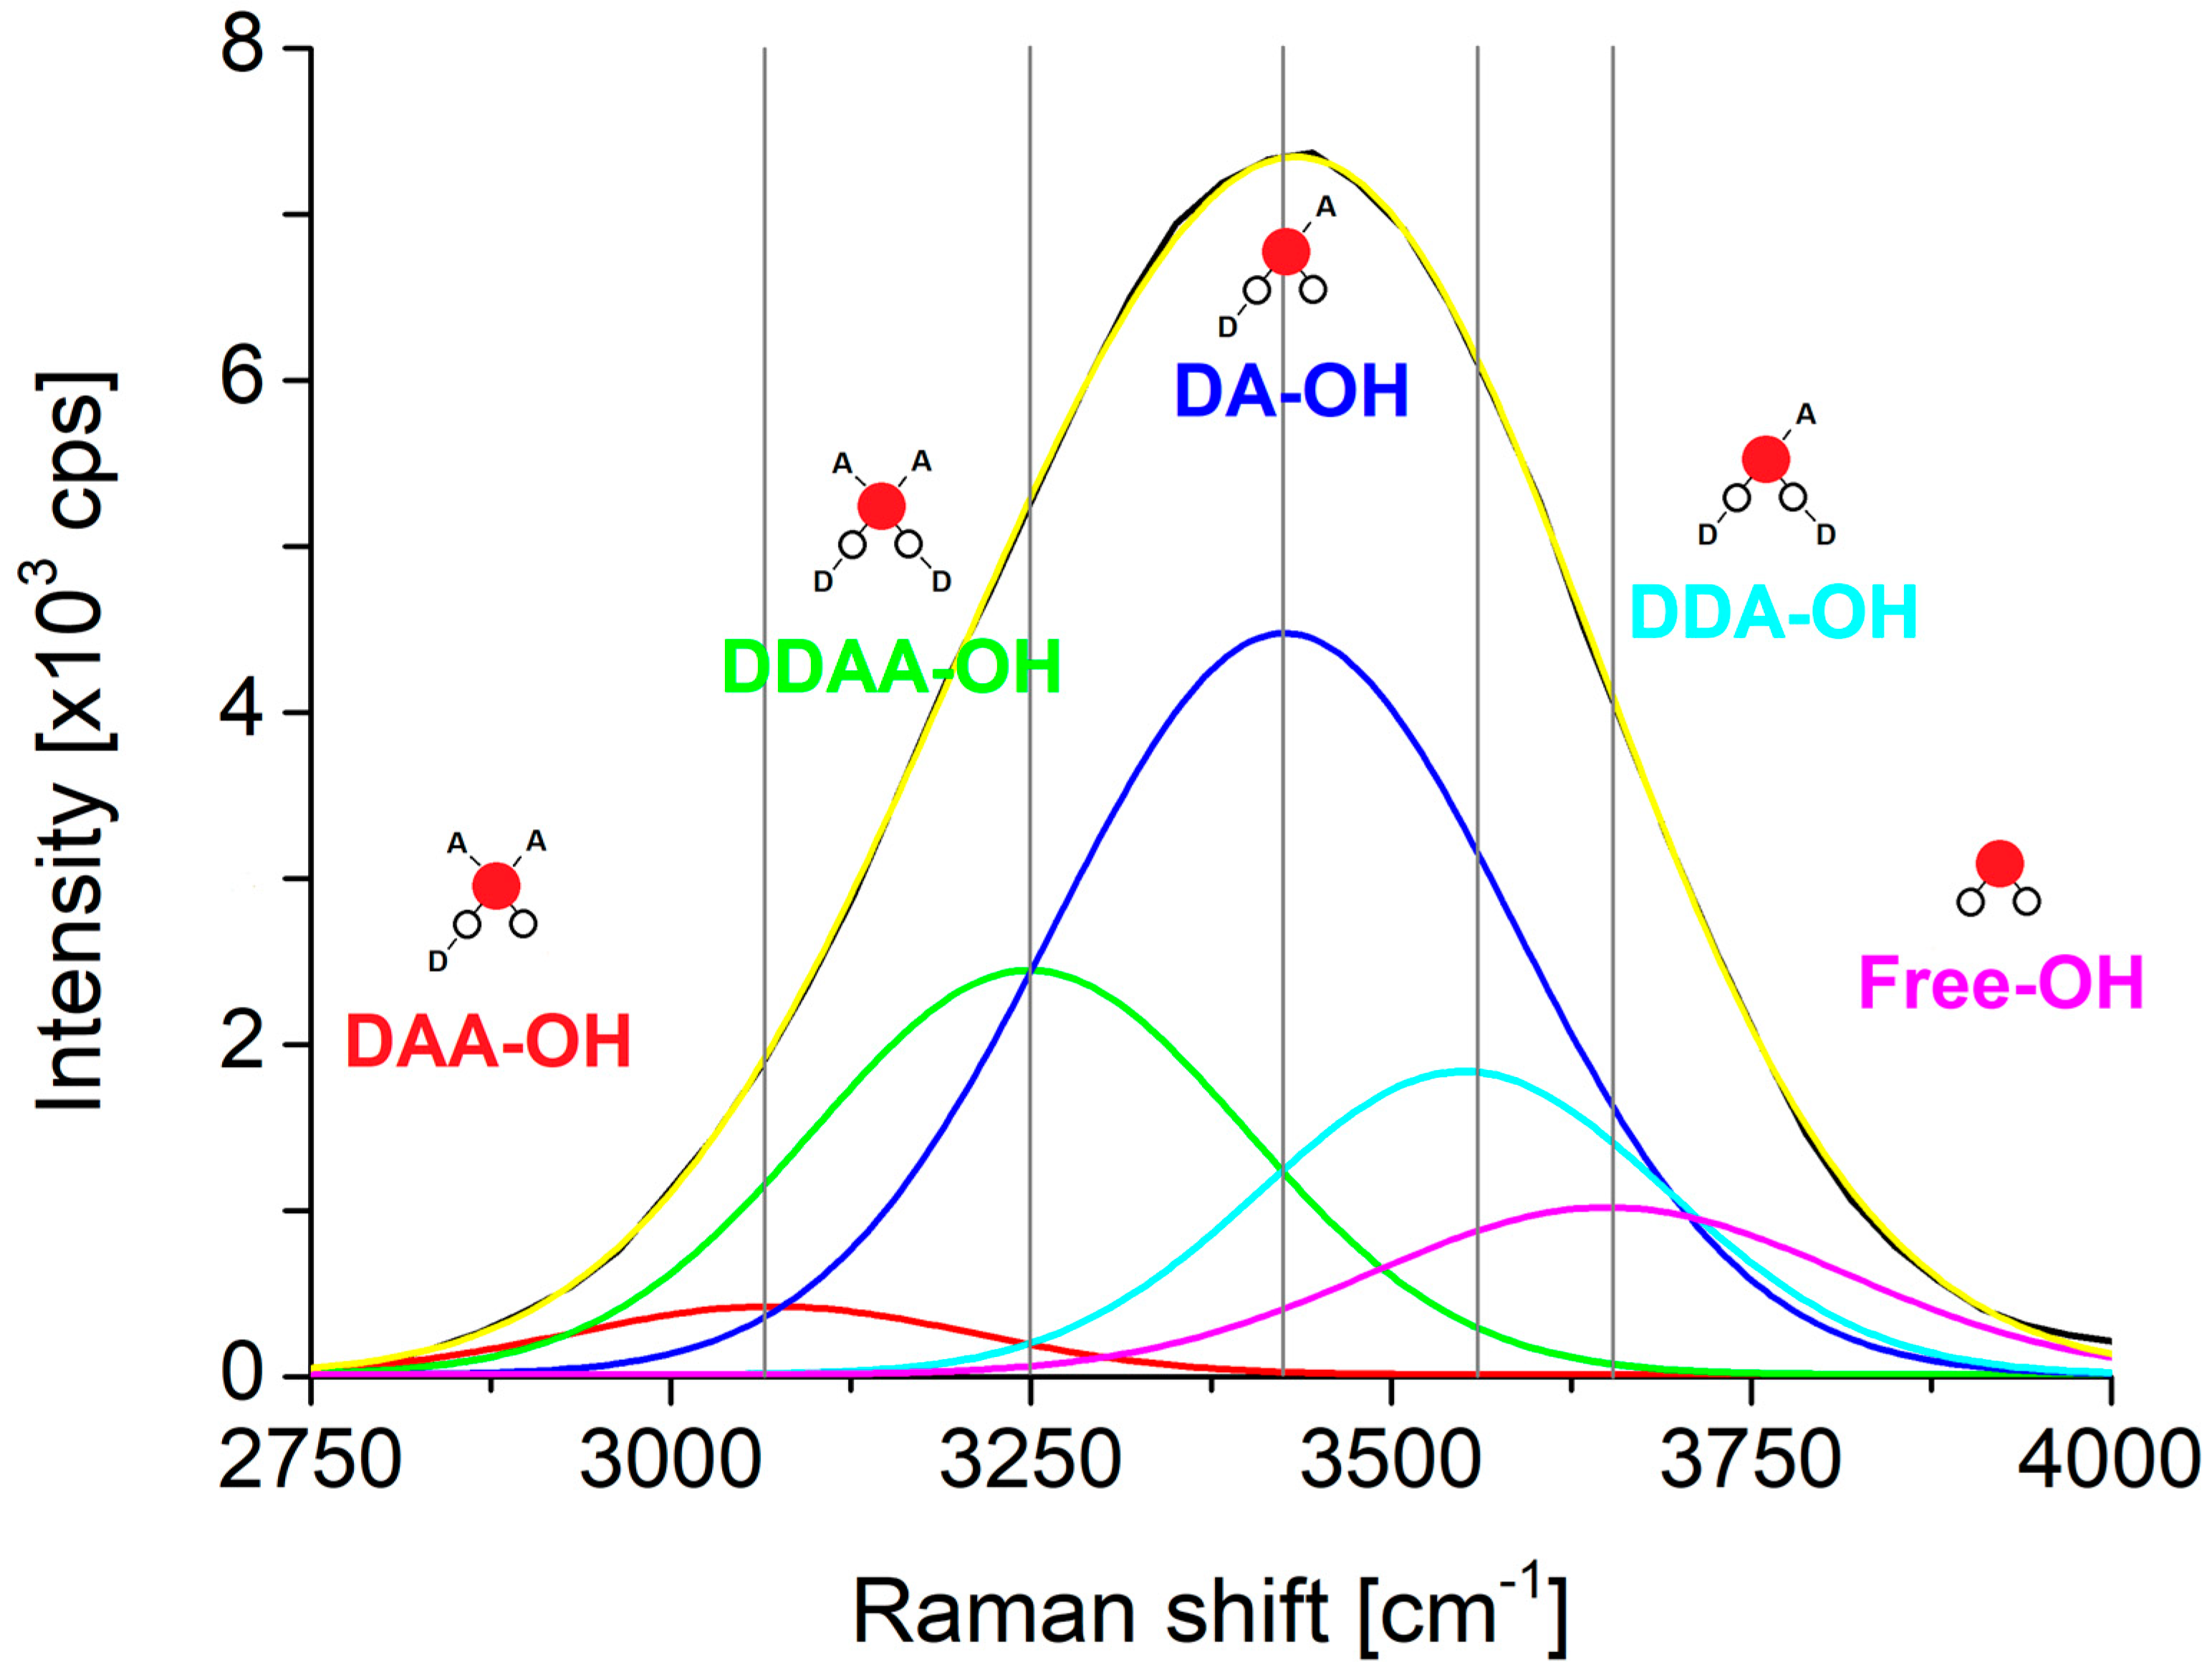
The OriginPro 8.5.1 custom fitting function was used to deconvolute the respective Raman signals of the fluorimeter (
Figure 6), which is the sum of five Gaussian peaks:
The software took a global search for the shared values of the five Gaussians’ peak position throughout the measured spectra. The base, amplitudes and widths were chosen as variable parameters for fitting.
Due to the fact that the area of the peaks does not specify the exact quantity of the respective species the deconvolution itself is not a definite method. The same cumulative curve can be the result of many different sets and variations of the Gaussians with the same exact location. One accepted solution came from the identification of a different bonding scheme of water molecules, depending on the role of a given water molecule as proton donor or proton acceptor in the formation of hydrogen bonds the associated vibrations can be used to design an appropriate set of Gaussians. A water molecule theoretically can form DDAA, DDA, DAA, DA, DD, AA, D, or A types of local hydrogen bonding [
43]. DD and AA structures are disfavored, having slightly repulsive two-body components, D and A can be reasonably ignored at ambient pressure according to the Boltzmann distribution [
43]. Therefore, at ambient temperature the main local hydrogen bonding can be expected to be DDAA, DDA, DAA and DA [
43]. The fifth Gaussian comes from the OH-vibration of free water molecules. If the resulting Gaussians are proportional to those species that are linked to them, is not known. The change of the area of these deconvoluted Gaussians is proportional to the change of the amount of the respective species can be stated.
Ph measurements took place between 303 K and 323 K, the values for the whole 50 K range were linearly extrapolated.
5. Conclusions
In this study a deconvolution of temperature-dependent Raman spectra was performed in order to gain some insight about the structure of water via the change of differently bonded water molecule species. Ultrapure water and aqueous solutions of KClO4, NaClO4, K2SO4, and Na2SO4 were investigated to determine the chosmotropic and kaotropic effect of the different ions in this particular view.
In the KClO4 solution the multi ring water clusters formed of three (or more) rings seem to break up into smaller double and single-ring clusters. In the aqueous K2SO4 solution single water rings seem to break up into free water molecules. Meanwhile the more complex three (or more)-ring clusters seem to be stabilized and preserved in numbers. Interestingly in the Na2SO4 solution the same complex water clusters break up into single rings but in turn these rings seem to be stabilized and preserved in number.
The topological surface area and electric charge difference explains why sulfate ions have a much stronger effect on neighboring water clusters than perchlorate ions. In the latter case water rings are much more easily broken up into free water molecules with the increasing temperature.
Sodium and potassium ions are neighbors in the Hofmeister series, and it is generally accepted that usually they do not contribute much to the structure of water. A potassium ion has a roughly 1,5-fold larger surface area than a sodium ion, which causes the electronegativity of sodium to be higher that of potassium. This higher electronegativity can potentially attract and turn the lone pairs of oxygen in water to themselves bringing about the water rings into a spherical shell. Larger, multi-ring clusters obviously do not fit well into a thin shell such as this, while single water rings oriented tangential to each other can easily constitute another layer leading to a buildup of a larger, more complex system in a layered fashion. It is known that the different bonding state of a water molecule affects the charge transfer, bond length, and strength not only all of its own bonds, but all the bonds of the water molecules bonded to that single water molecule [
44,
45,
46,
47]. This cooperative strengthening/weakening effect of the water cluster system ripples through at least the nearby vicinity changing the already existing clusters into energetically favorable compositions. The same can happen around potassium ions forming thicker layers, consisting multi-ring clusters.
Another interesting aspect of these salt solutions was the observed rise in the pH by temperature. This phenomenon is likely the result of the association of hydrogen and oxonium ions into the otherwise dissociated water molecules. The presence of chaotropic perchlorate ions shows this to a lesser degree (+0.89 and +1.43), meanwhile the presence of kosmotropic sulfate ions shows this to a larger extent (+2.84 and +1.31). The presence of potassium cations was more extreme (+0.89 and +2.84), and the presence of sodium cations showed a more uniform (+1.43 and +1.31) change, even though the respective ionic strengths are different in the perchlorate and sulfate solutions.
Although the modelling results are in agreement with the experimental results, further investigation is necessary to accurately describe the system at the molecular level since the PCM method cannot take the clustered environment into account. Considering the cluster formation around the clusters investigated in this study the relative permittivity of the solution around the selected clusters likely differs from the relative permittivity of the bulk.
Author Contributions
Conceptualization, F.K. and S.K.-M.; Data curation, F.K.; H.Y. and H.L.; Formal analysis, H.Y., H.L. and S.K.-M.; Funding acquisition, S.K.-M.; Investigation, F.K., Methodology, F.K., H.Y., H.L. and S.K.-M.; Re-sources, S.K.-M. Writing—original draft, F.K., S.K.-M.; Supervision, discussion H.Y. and H.L.; Writing—review and editing, F.K. and S.K.-M. All authors have read and agreed to the published version of the manuscript.
Funding
This work was supported by the Hungarian National Research Development and Innovation Office (NKFI) NKFI-137793, 2019-2.1.11-TÉT-2019-00042, and by the European Union, co-financed by the European Social Fund EFOP-3.6.1.-16-2016-00004. New National Excellence Program of the Ministry for Innovation and Technology. Project no. TKP2020-IKA-08 has been implemented with the support provided from the NKFI, financed under the 2020-4.1.1-TKP2020 funding scheme.
Institutional Review Board Statement
Not applicable.
Informed Consent Statement
Not applicable.
Data Availability Statement
The data presented in this study are available on request from the corresponding author.
Conflicts of Interest
The authors declare no conflict of interest.
References
- Artlett, C.P.; Pask, H.M. Optical remote sensing of water temperature using Raman spectroscopy. Opt. Express 2015, 23, 31844–31856. [Google Scholar] [CrossRef]
- Artlett, C.P.; Pask, H. New approach to remote sensing of temperature and salinity in natural water samples. Opt. Express 2017, 25, 2840–2851. [Google Scholar] [CrossRef] [PubMed]
- Wang, B.; Jiang, W.; Gao, Y.; Teo, B.K.; Wang, Z. Chirality recognition in concerted proton transfer process for prismatic water clusters. Nano Res. 2016, 9, 2782–2795. [Google Scholar] [CrossRef]
- Marcus, Y. Effect of Ions on the Structure of Water: Structure Making and Breaking. Chem. Rev. 2009, 109, 1346–1370. [Google Scholar] [CrossRef]
- Kunsági-Máté, S.; Nagy, G.; Jurecka, P.; Kollár, L. Complex formation between 1-chloro-4-(trifluoromethyl)benzene (guest) and 4-tert-butylcalix[4]arenes (host) distally substituted with phosphonic acid or phosphonic ester groups at the lower rim. Tetrahedron 2002, 58, 5119–5124. [Google Scholar] [CrossRef]
- Ameen, H.M.; Kunsági-Máté, S.; Bognár, B.; Szente, L.; Poór, M.; Lemli, B. Thermodynamic Characterization of the Interaction between the Antimicrobial Drug Sulfamethazine and Two Selected Cyclodextrins. Molecules 2019, 24, 4565. [Google Scholar] [CrossRef] [PubMed] [Green Version]
- Tantardini, C. When does a hydrogen bond become a van der Waals interaction? A topological answer. J. Comput. Chem. 2019, 40, 937–943. [Google Scholar] [CrossRef] [PubMed]
- Tantardini, C.; Michalchuk, A.A.L.; Samtsevich, A.; Rota, C.; Kvashnin, A.G. The volumetric source function: Looking inside van der Waals Interactions. Sci. Rep. 2020, 10, 7816. [Google Scholar] [CrossRef]
- Ratajska-Gadomska, B.; Gadomski, W. Water structure in nanopores of agarose gel by Raman spectroscopy. J. Chem. Phys. 2004, 121, 12583–12588. [Google Scholar] [CrossRef]
- Hu, Q.; Lü, X.; Lu, W.; Chen, Y.; Liu, H. An extensive study on Raman spectra of water from 253 to 753K at 30MPa: A new insight into structure of water. J. Mol. Spectrosc. 2013, 292, 23–27. [Google Scholar] [CrossRef]
- Aliotta, F.; Pochylski, M.; Ponterio, R.C.; Saija, F.; Salvato, G.; Vasi, C.S. Structure of bulk water from Raman measurements of supercooled pure liquid and LiCl solutions. Phys. Rev. B 2012, 86, 134301. [Google Scholar] [CrossRef]
- Allison, S.K.; Fox, J.P.; Hargreaves, R.; Bates, S.P. Clustering and microimmiscibility in alcohol-water mixtures: Evidence from molecular-dynamics simulations. Phys. Rev. B 2005, 71, 024201. [Google Scholar] [CrossRef] [Green Version]
- Ishiyama, T.; Takahashi, H.; Morita, A. Molecular dynamics simulations of surface-specific bonding of the hydrogen network of water: A solution to the low sum-frequency spectra. Phys. Rev. B 2012, 86, 035408. [Google Scholar] [CrossRef]
- Kolb, B.; Thonhauser, T. van der Waals density functional study of energetic, structural, and vibrational properties of small water clusters and iceIh. Phys. Rev. B 2011, 84, 045116. [Google Scholar] [CrossRef] [Green Version]
- Liang, L.; Rulis, P.; Ouyang, L.; Ching, W.Y. Ab initioinvestigation of hydrogen bonding and network structure in a supercooled model of water. Phys. Rev. B 2011, 83, 024201. [Google Scholar] [CrossRef] [Green Version]
- Xu, J.; Chen, M.; Zhang, C.; Wu, X. First-principles study of the infrared spectrum in liquid water from a systematically improved description of H-bond network. Phys. Rev. B 2019, 99, 205123. [Google Scholar] [CrossRef] [Green Version]
- He, Y.; Nomura, K.-I.; Kalia, R.K.; Nakano, A.; Vashishta, P. Structure and dynamics of water confined in nanoporous carbon. Phys. Rev. Mater. 2018, 2, 115605. [Google Scholar] [CrossRef]
- Tahat, A.; Martí, J. Proton transfer in liquid water confined inside graphene slabs. Phys. Rev. E 2015, 92, 032402. [Google Scholar] [CrossRef] [PubMed] [Green Version]
- Tu, Y.-B.; Tao, M.-L.; Sun, K.; Wang, Z.-L.; Yang, D.-X.; Wang, J.-Z. Monodisperse water clusters grown on the semimetallic Bi(111) surface. Phys. Rev. B 2018, 98, 165409. [Google Scholar] [CrossRef]
- Zhang, K.-W.; Ding, D.; Yang, C.-L.; Gan, Y.; Li, S.; Huang, W.-K.; Song, Y.-H.; Jia, Z.-Y.; Li, X.-B.; Zhu, Z.; et al. Real-space characterization of reactivity towards water at theBi2Te3(111) surface. Phys. Rev. B 2016, 93, 235445. [Google Scholar] [CrossRef] [Green Version]
- Bergmann, U.; Nordlund, D.; Wernet, P.; Odelius, M.; Pettersson, L.G.M.; Nilsson, A. Isotope effects in liquid water probed by x-ray Raman spectroscopy. Phys. Rev. B 2007, 76, 024202. [Google Scholar] [CrossRef]
- Tokmachev, A.M.; Tchougréeff, A.L.; Dronskowski, R. Hydrogen-Bond Networks in Water Clusters (H2O)20: An Exhaustive Quantum-Chemical Analysis. ChemPhysChem 2010, 11, 384–388. [Google Scholar] [CrossRef] [PubMed]
- Sykes, M.T.; Levitt, M. Simulations of RNA base pairs in a nanodroplet reveal solvation-dependent stability. Proc. Natl. Acad. Sci. USA 2007, 104, 12336–12340. [Google Scholar] [CrossRef] [PubMed] [Green Version]
- Matisz, G.; Fabian, W.M.; Kelterer, A.-M.; Kunsági-Máté, S. Weinhold’s QCE model—A modified parameter fit. Model study of liquid methanol based on MP2 cluster geometries. J. Mol. Struct. Theochem 2010, 956, 103–109. [Google Scholar] [CrossRef]
- Matisz, G.; Kelterer, A.-M.; Fabian, W.M.F.; Kunsagi-Mate, S. Application of the Quantum Cluster Equilibrium (QCE) Model for the Liquid Phase of Primary Alcohols Using B3LYP and B3LYP-D DFT Methods. J. Phys. Chem. B 2011, 115, 3936–3941. [Google Scholar] [CrossRef] [PubMed]
- Kovács, F.; Kunsági-Máté, S. Change of liquid water structure under the presence of phosphate anion during changing its kosmotropic character to chaotropic along its deprotonation route. Chem. Phys. Lett. 2020, 756, 137827. [Google Scholar] [CrossRef]
- Matisz, G.; Kelterer, A.-M.; Fabian, W.M.F.; Kunsági-Máté, S. Coordination of Methanol Clusters to Benzene: A Computational Study. J. Phys. Chem. A 2011, 115, 10556–10564. [Google Scholar] [CrossRef]
- Clary, D.C. Quantum dynamics in the smallest water droplet. Science 2016, 351, 1267–1268. [Google Scholar] [CrossRef]
- Matisz, G.; Kelterer, A.-M.; Fabian, W.M.F.; Kunsági-Máté, S. Structural properties of methanol–water binary mixtures within the quantum cluster equilibrium model. Phys. Chem. Chem. Phys. 2015, 17, 8467–8479. [Google Scholar] [CrossRef] [Green Version]
- Krishnan, P.; Jensen, J.O.; Burke, L.A. Theoretical study of water clusters. II. Hexamer. Chem. Phys. Lett. 1994, 217, 311–318. [Google Scholar] [CrossRef]
- Tachikawa, H. Electron hydration dynamics in water clusters: A direct ab initio molecular dynamics approach. J. Chem. Phys. 2006, 125, 144307. [Google Scholar] [CrossRef] [Green Version]
- Becke, A.D. Density-functional thermochemistry. III. The role of exact exchange. J. Chem. Phys. 1993, 98, 5648–5652. [Google Scholar] [CrossRef] [Green Version]
- Stephens, P.J.; Devlin, F.J.; Chabalowski, C.F.; Frisch, M.J. Ab Initio Calculation of Vibrational Absorption and Circular Dichroism Spectra Using Density Functional Force Fields. J. Phys. Chem. 1994, 98, 11623–11627. [Google Scholar] [CrossRef]
- Grimme, S.; Antony, J.; Ehrlich, S.; Krieg, H. A consistent and accurate ab initio parametrization of density functional dispersion correction (DFT-D) for the 94 elements H-Pu. J. Chem. Phys. 2010, 132, 154104. [Google Scholar] [CrossRef] [PubMed] [Green Version]
- Schäfer, A.; Horn, H.; Ahlrichs, R. Fully optimized contracted Gaussian basis sets for atoms Li to Kr. J. Chem. Phys. 1992, 97, 2571–2577. [Google Scholar] [CrossRef]
- Weigend, F.; Ahlrichs, R. Balanced basis sets of split valence, triple zeta valence and quadruple zeta valence quality for H to Rn: Design and assessment of accuracy. Phys. Chem. Chem. Phys. 2005, 7, 3297–3305. [Google Scholar] [CrossRef]
- Boys, S.F.; Bernardi, F. The calculation of small molecular interactions by the differences of separate total energies. Some procedures with reduced errors. Mol. Phys. 2002, 100, 65–73. [Google Scholar] [CrossRef]
- Zhao, Y.; Truhlar, D. Exploring the Limit of Accuracy of the Global Hybrid Meta Density Functional for Main-Group Thermochemistry, Kinetics, and Noncovalent Interactions. J. Chem. Theory Comput. 2008, 4, 1849–1868. [Google Scholar] [CrossRef]
- Zhao, Y.; Truhlar, D.G. The M06 suite of density functionals for main group thermochemistry, thermochemical kinetics, noncovalent interactions, excited states, and transition elements: Two new functionals and systematic testing of four M06-class functionals and 12 other functionals. Theor. Chem. Acc. 2008, 120, 215–241. [Google Scholar] [CrossRef] [Green Version]
- Frisch, M.J.; Trucks, G.W.; Schlegel, H.B.; Scuseria, G.E.; Robb, M.A.; Cheeseman, J.R.; Scalmani, G.; Barone, V.; Mennucci, B.; Petersson, G.A.; et al. Gaussian 09, Revision C.01; Gaussian, Inc.: Wallingford, CT, USA, 2009; Volume 121, pp. 150–166. [Google Scholar]
- Dunning, T.H., Jr. Gaussian basis sets for use in correlated molecular calculations. I. The atoms boron through neon and hydrogen. J. Chem. Phys. 1989, 90, 1007–1023. [Google Scholar] [CrossRef]
- Mennucci, A.B.; Tomasi, J.; Cammi, R.; Cheeseman, A.J.R.; Frisch, M.J.; Devlin, F.J.; Gabriel, A.S.; Stephens, P.J. Polarizable Continuum Model (PCM) Calculations of Solvent Effects on Optical Rotations of Chiral Molecules. J. Phys. Chem. A 2002, 106, 6102–6113. [Google Scholar] [CrossRef]
- Sun, Q. The Raman OH stretching bands of liquid water. Vib. Spectrosc. 2009, 51, 213–217. [Google Scholar] [CrossRef]
- Ohno, K.; Okimura, M.; Akai, N.; Katsumoto, Y. The effect of cooperative hydrogen bonding on the OH stretching-band shift for water clusters studied by matrix-isolation infrared spectroscopy and density functional theory. Phys. Chem. Chem. Phys. 2005, 7, 3005–3014. [Google Scholar] [CrossRef] [PubMed]
- Ojha, D.; Karhan, K.; Kühne, T.D. On the Hydrogen Bond Strength and Vibrational Spectroscopy of Liquid Water. Sci. Rep. 2018, 8, 16888. [Google Scholar] [CrossRef] [PubMed]
- Galkina, Y.A.; Kryuchkova, N.; Vershinin, M.A.; Kolesov, B.A. Features of strong O–H⋯O and N–H⋯O hydrogen bond manifestation in vibrational spectra. J. Struct. Chem. 2017, 58, 911–918. [Google Scholar] [CrossRef]
- Ronca, E.; Belpassi, L.; Tarantelli, F. A Quantitative View of Charge Transfer in the Hydrogen Bond: The Water Dimer Case. ChemPhysChem 2014, 15, 2682–2687. [Google Scholar] [CrossRef]
| Publisher’s Note: MDPI stays neutral with regard to jurisdictional claims in published maps and institutional affiliations. |
© 2021 by the authors. Licensee MDPI, Basel, Switzerland. This article is an open access article distributed under the terms and conditions of the Creative Commons Attribution (CC BY) license (https://creativecommons.org/licenses/by/4.0/).


