
Leptin Protein Expression and Promoter Methylation in Ovarian Cancer: A Strong Prognostic Value with Theranostic Promises

 , , , , and
Abstract
1. Introduction
2. Results
2.1. Patients Overview
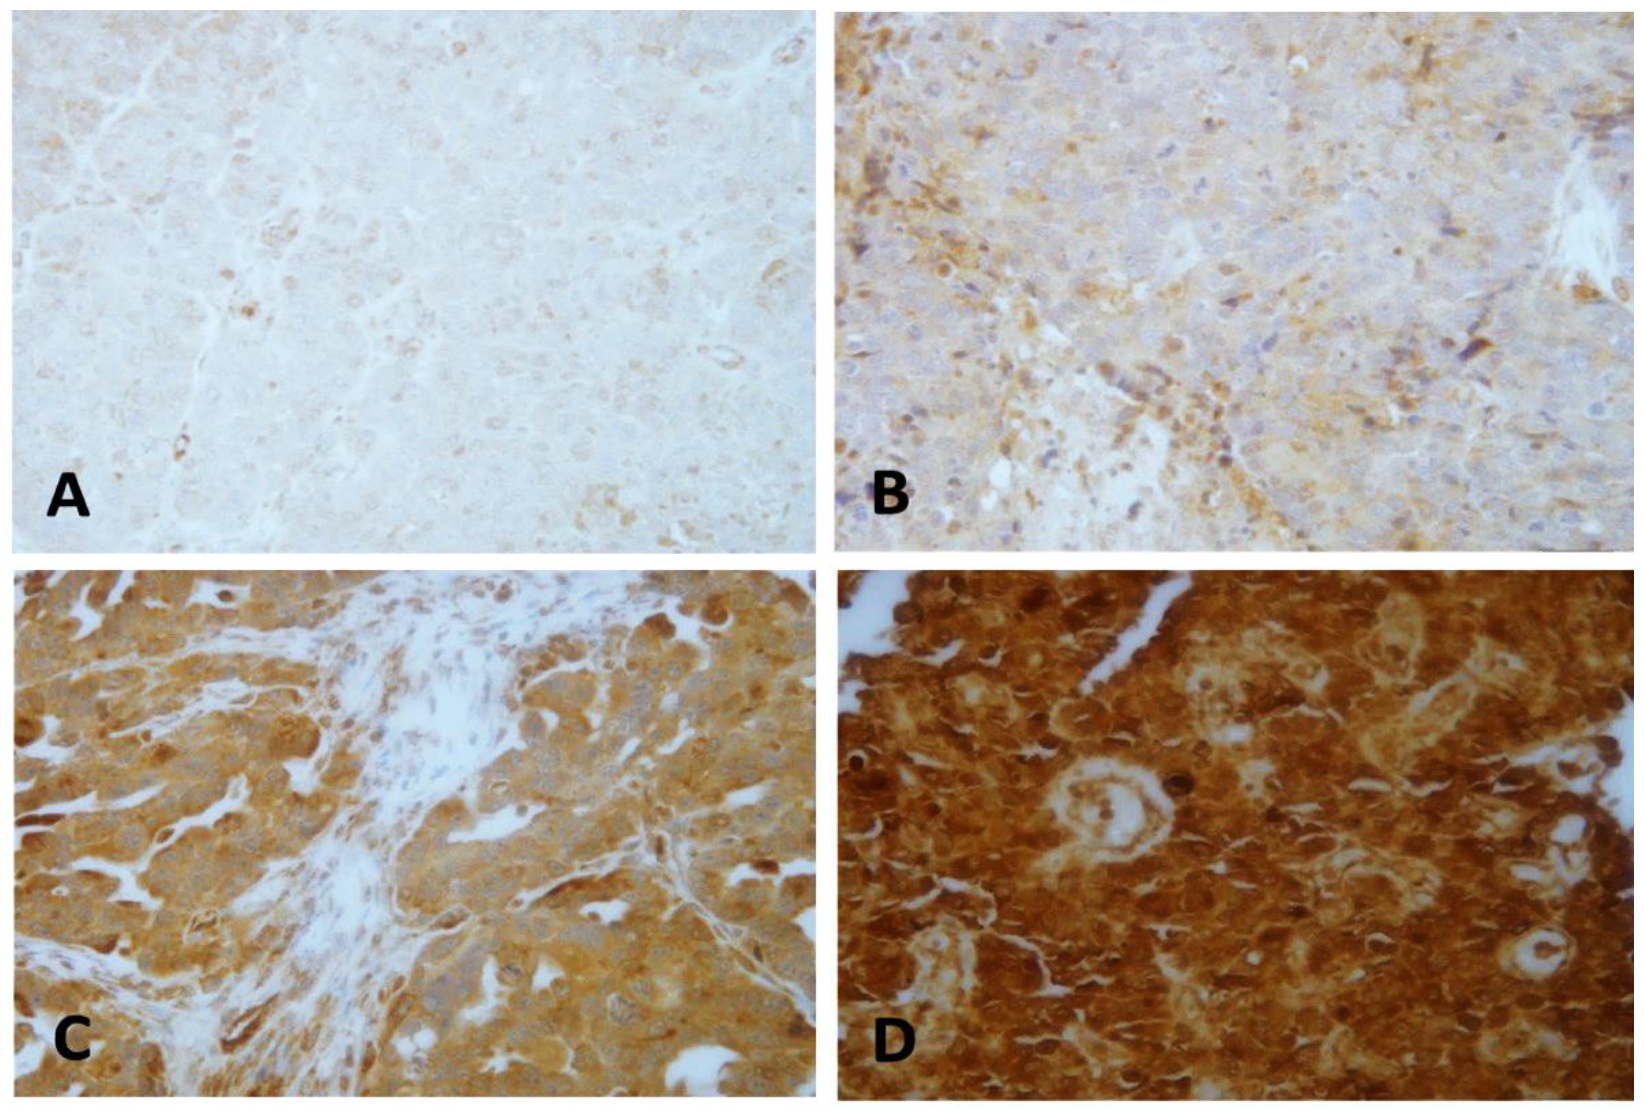
2.2. LEP Protein Expression Pattern
2.3. LEP Protein Expression Pattern and Clinicopathological Features
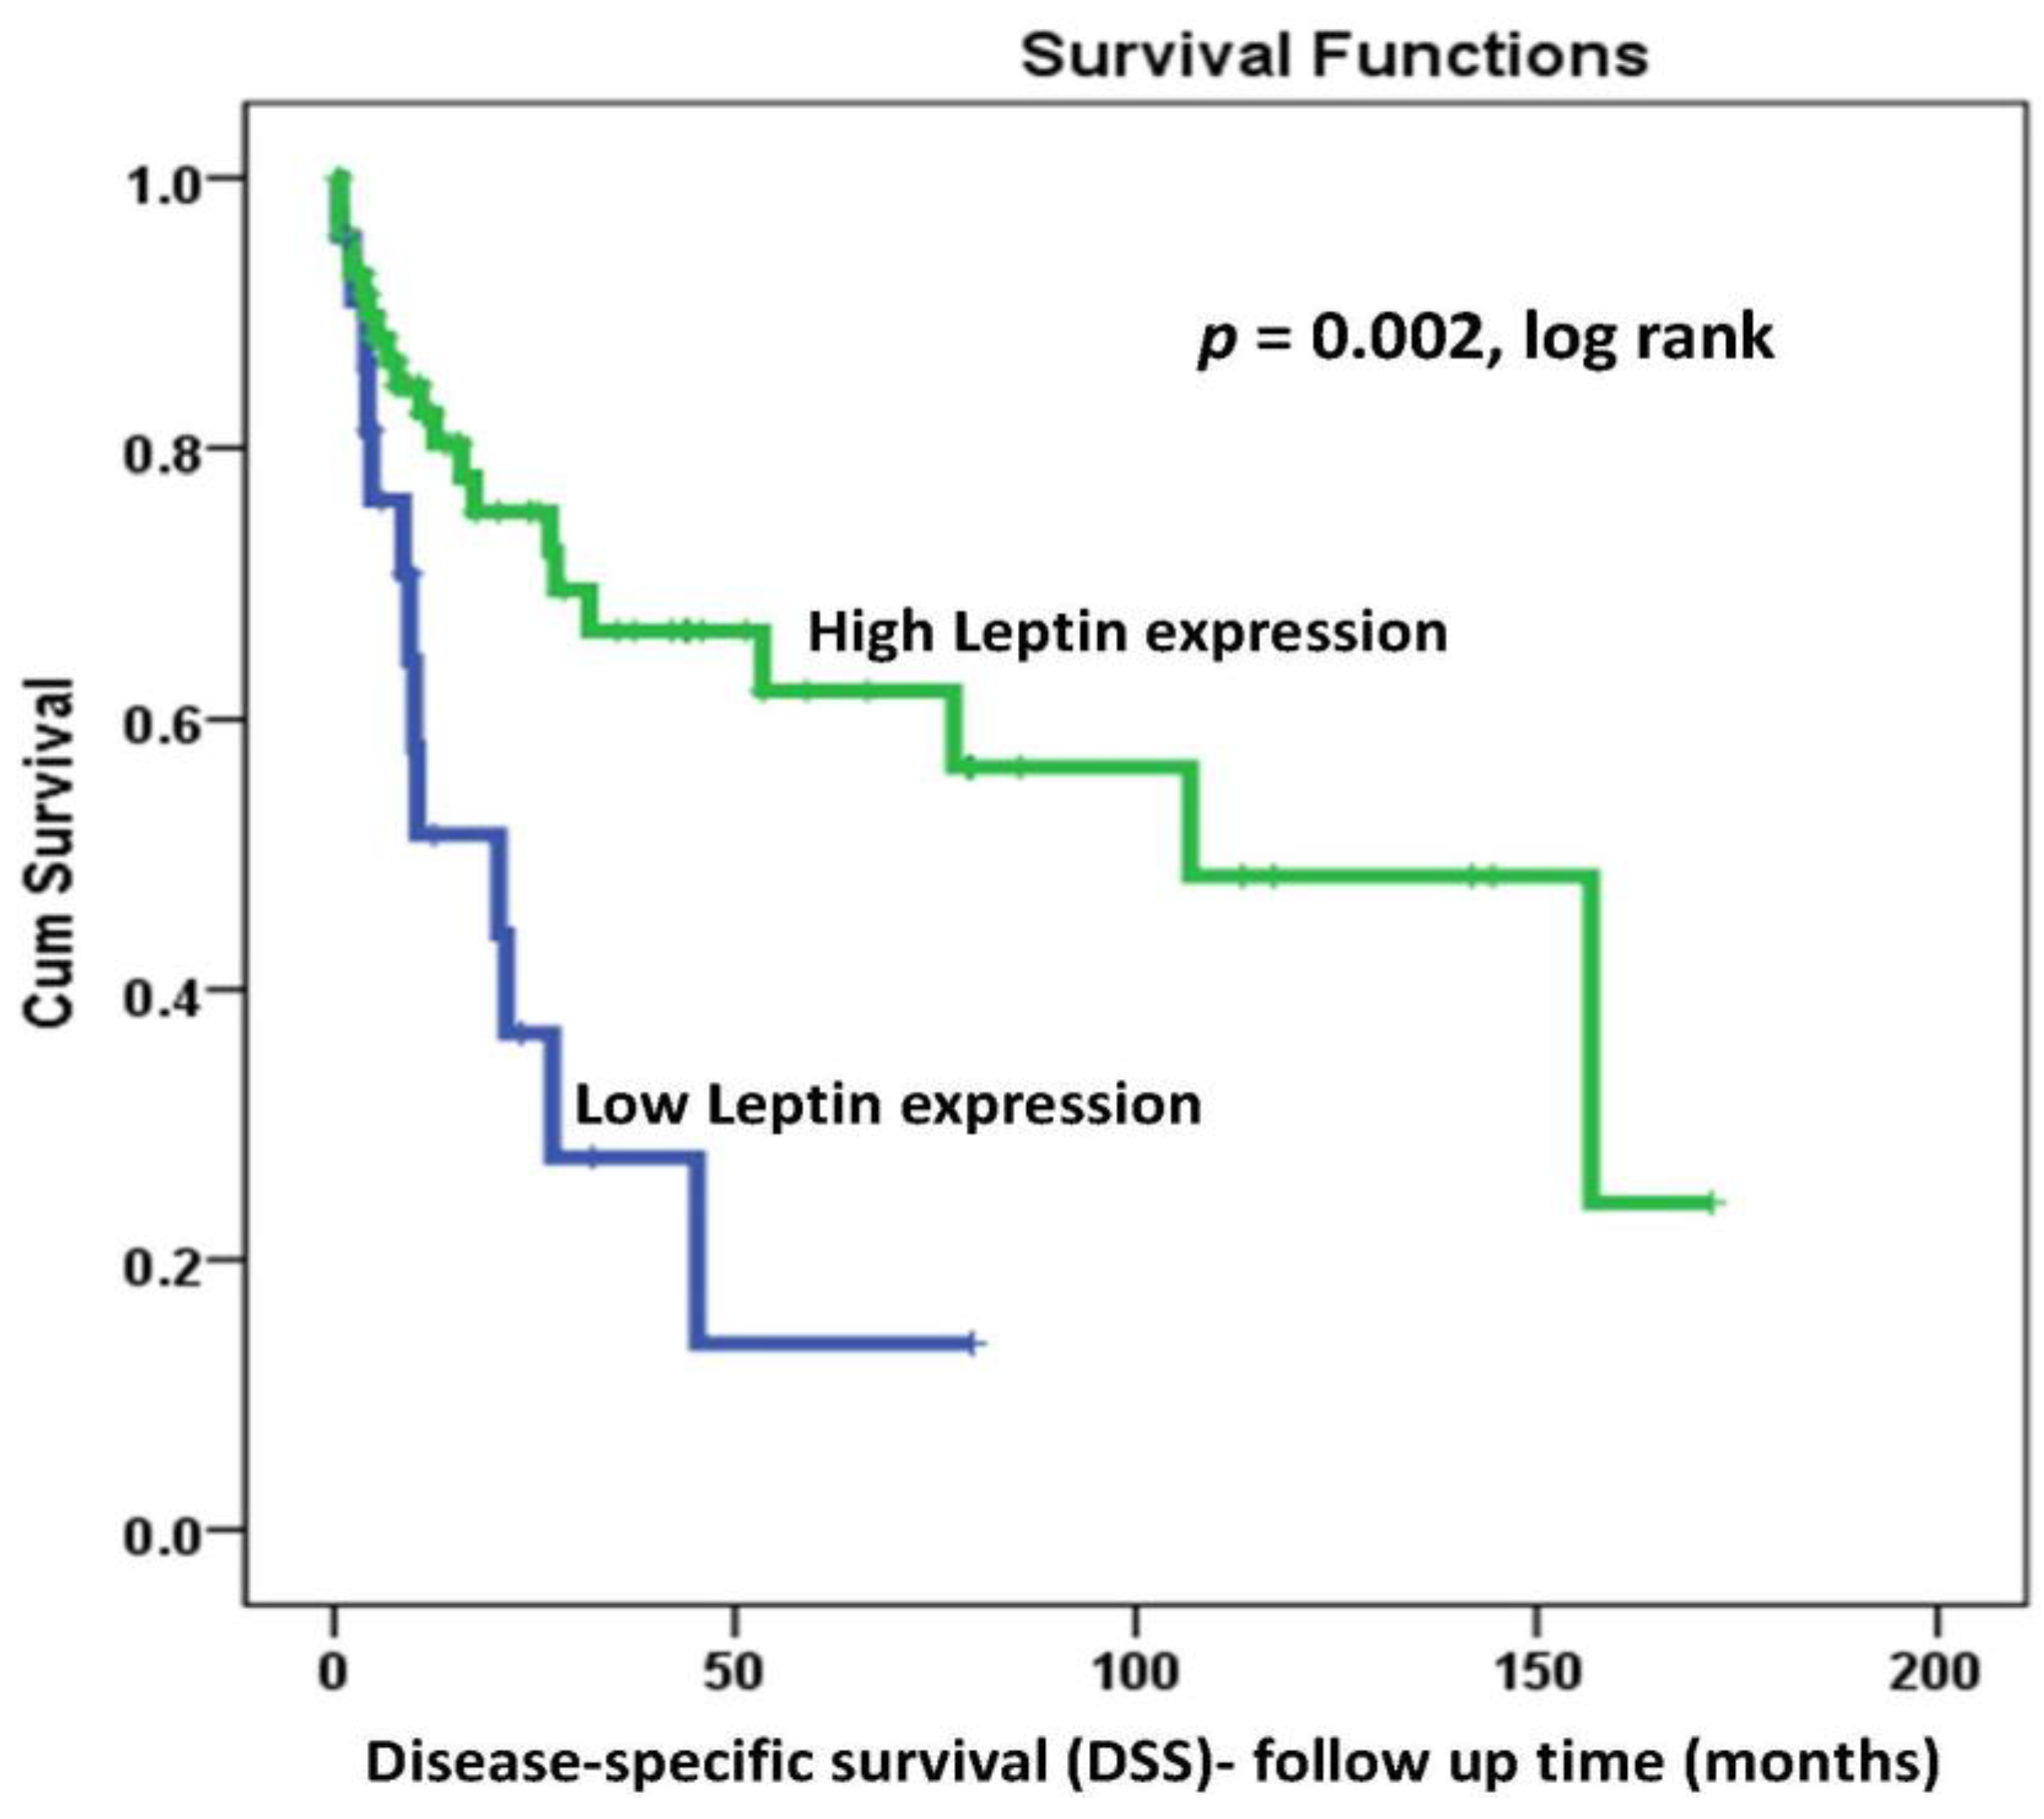
2.4. LEP Protein Expression and Survival Outcomes
2.5. Association of LEP Methylation Profiles with Clinicopathological Features and Survival Outcomes
3. Discussion
4. Materials and Methods
4.1. Patients and Samples
4.2. Tissue Microarray
4.3. Immunohistochemistry
4.3.1. Evaluation of LEP Protein Expression Pattern
4.3.2. Statistical Analysis
4.4. Methylation Profiling of 63 FFPE Tissue Samples
4.4.1. DNA Extraction
4.4.2. Methylation Analysis of the Candidate Genes
4.4.3. qPCR Statistical Analysis
Author Contributions
Funding
Institutional Review Board Statement
Informed Consent Statement
Acknowledgments
Conflicts of Interest
References
- Siegel, R.L.; Miller, K.D.; Jemal, A. Cancer statistics, 2020. CA Cancer J. Clin. 2020, 70, 7–30. [Google Scholar] [CrossRef] [PubMed]
- Ferlay, J.; Ervik, M.; Lam, F.; Colombet, M.; Mery, L.; Piñeros, M.; Ferlay, J.; Ervik, M.; Lam, F.; Colombet, M.; et al. Population Fact Sheets. Global Cancer Observatory: Cancer Today (Lyon, France): International Agency for Research on Cancer. 2020. Available online: https://gco.iarc.fr/today/fact-sheets-populations (accessed on 20 April 2021).
- Al-Zahrani, A.S.; Al-Mutlaq, H.M.; Radwi, A.N.; Bazarbashi, S.M. Cancer Incidence Report Saudi Arabia. Available online: https://nhic.gov.sa/en/eServices/Documents/2016.pdf (accessed on 20 April 2021).
- Althubiti, M.A.; Nour Eldein, M.M. Trends in the incidence and mortality of cancer in Saudi Arabia. Saudi. Med. J. 2018, 39, 1259–1262. [Google Scholar] [CrossRef] [PubMed]
- Torre, L.A.; Trabert, B.; DeSantis, C.E.; Miller, K.D.; Samimi, G.; Runowicz, C.D.; Gaudet, M.M.; Jemal, A.; Siegel, R.L. Ovarian cancer statistics, 2018. CA Cancer J. Clin. 2018, 68, 284–296. [Google Scholar] [CrossRef] [PubMed]
- Khazaei, Z.; Jarrahi, A.M.; Moayed, L.; Adineh, H.A.; Sohrabivafa, M.; Dehghani, S.L.; Goodarzi, E. The Incidence and Mortality of Ovarian Cancer, Its Association with Body Mass Index and Human Development Index: An Ecological Study. World Cancer Res. J. 2019, 6, 12. [Google Scholar]
- Pizarro, G.; Cordova, M.; Cuello, M.; Kato, S.; Jensen, R.; Branes, J.; Villarroel, A.; Pinto, M.; Matias, M.; Bravo, M.L.; et al. Obesity and Inflammation Combined Are Risk Factor for Early Recurrence in High Grade Serous Ovarian Cancer. Int. J. Gynecol. Cancer 2019, 29, A494. [Google Scholar] [CrossRef]
- Bandera, E.V.; Qin, B.; Moorman, P.G.; Alberg, A.J.; Barnholtz-Sloan, J.S.; Bondy, M.; Cote, M.L.; Funkhouser, E.; Peters, E.S.; Schwartz, A.G.; et al. Obesity, weight gain, and ovarian cancer risk in African American women. Int. J. Cancer 2016, 139, 593–600. [Google Scholar] [CrossRef]
- Gallagher, E.J.; LeRoith, D. Obesity and Diabetes: The Increased Risk of Cancer and Cancer-Related Mortality. Physiol. Rev. 2015, 95, 727–748. [Google Scholar] [CrossRef]
- Allott, E.H.; Hursting, S.D. Obesity and cancer: Mechanistic insights from transdisciplinary studies. Endocr.-Relat. Cancer 2015, 22, R365–R386. [Google Scholar] [CrossRef]
- Conde, J.; Scotece, M.; Gomez, R.; Lopez, V.; Gomez-Reino, J.J.; Lago, F.; Gualillo, O. Adipokines: Biofactors from white adipose tissue. A complex hub among inflammation, metabolism, and immunity. Biofactors 2011, 37, 413–420. [Google Scholar] [CrossRef] [PubMed]
- Pan, H.; Guo, J.; Su, Z. Advances in understanding the interrelations between leptin resistance and obesity. Physiol. Behav. 2014, 130, 157–169. [Google Scholar] [CrossRef]
- Brennan, A.M.; Mantzoros, C.S. Drug Insight: The role of leptin in human physiology and pathophysiology—Emerging clinical applications. Nat. Clin. Pract. Endocrinol. Metab. 2006, 2, 318–327. [Google Scholar] [CrossRef] [PubMed]
- Margetic, S.; Gazzola, C.; Pegg, G.G.; Hill, R.A. Leptin: A review of its peripheral actions and interactions. Int. J. Obes. Relat. Metab. Disord. 2002, 26, 1407–1433. [Google Scholar] [CrossRef] [PubMed]
- Li, S.; Li, X. Leptin in normal physiology and leptin resistance. Sci. Bull. 2016, 61, 1480–1488. [Google Scholar] [CrossRef]
- Gu, F.; Zhang, H.; Yao, L.Q.; Jiang, S.H.; Lu, H.; Xing, X.; Zhang, C.C.; Jiang, P.C.; Zhang, R. Leptin contributes to the taxol chemoresistance in epithelial ovarian cancer. Oncol. Lett. 2019, 18, 561–570. [Google Scholar] [CrossRef] [PubMed]
- Houseknecht, K.L.; Baile, C.A.; Matteri, R.L.; Spurlock, M.E. The biology of leptin: A review. J. Anim. Sci. 1998, 76, 1405–1420. [Google Scholar] [CrossRef]
- Lieb, W.; Sullivan, L.M.; Harris, T.B.; Roubenoff, R.; Benjamin, E.J.; Levy, D.; Fox, C.S.; Wang, T.J.; Wilson, P.W.; Kannel, W.B.; et al. Plasma leptin levels and incidence of heart failure, cardiovascular disease, and total mortality in elderly individuals. Diabetes Cazre 2009, 32, 612–616. [Google Scholar] [CrossRef]
- Katsiki, N.; Mikhailidis, D.P.; Banach, M. Leptin, cardiovascular diseases and type 2 diabetes mellitus. Acta Pharmacol. Sin. 2018, 39, 1176–1188. [Google Scholar] [CrossRef]
- Jung, C.H.; Kim, M.-S. Molecular mechanisms of central leptin resistance in obesity. Arch. Pharmacal. Res. 2013, 36, 201–207. [Google Scholar] [CrossRef]
- Said, S.; Hernandez, G.T. The link between chronic kidney disease and cardiovascular disease. J. Nephropathol. 2014, 3, 99–104. [Google Scholar]
- Bell, B.B.; Rahmouni, K. Leptin as a mediator of obesity-induced hypertension. Curr. Obes. Rep. 2016, 5, 397–404. [Google Scholar] [CrossRef]
- Stępień, M.; Stępień, A.; Wlazeł, R.N.; Paradowski, M.; Rizzo, M.; Banach, M.; Rysz, J. Predictors of insulin resistance in patients with obesity: A pilot study. Angiology 2014, 65, 22–30. [Google Scholar] [CrossRef]
- Stępień, M.; Stępień, A.; Banach, M.; Wlazeł, R.N.; Paradowski, M.; Rizzo, M.; Toth, P.P.; Rysz, J. New obesity indices and adipokines in normotensive patients and patients with hypertension: Comparative pilot analysis. Angiology 2014, 65, 333–342. [Google Scholar] [CrossRef] [PubMed]
- Stępień, M.; Wlazeł, R.N.; Paradowski, M.; Banach, M.; Rysz, M.; Misztal, M.; Rysz, J. Serum concentrations of adiponectin, leptin, resistin, ghrelin and insulin and their association with obesity indices in obese normo-and hypertensive patients–pilot study. Arch. Med. Sci. AMS 2012, 8, 431–436. [Google Scholar] [CrossRef]
- Stepień, M.; Rosniak-Bak, K.; Paradowski, M.; Misztal, M.; Kujawski, K.; Banach, M.; Rysz, J. Waist circumference, ghrelin and selected adipose tissue-derived adipokines as predictors of insulin resistance in obese patients: Preliminary results. Med. Sci. Monit. Int. Med. J. Exp. Clin. Res. 2011, 17, PR13. [Google Scholar] [CrossRef]
- Gonzalez-Perez, R.R.; Lanier, V.; Newman, G. Leptin’s Pro-Angiogenic Signature in Breast Cancer. Cancers 2013, 5, 1140–1162. [Google Scholar] [CrossRef]
- Paz-Filho, G.; Mastronardi, C.A.; Licinio, J. Leptin treatment: Facts and expectations. Metabolism 2015, 64, 146–156. [Google Scholar] [CrossRef] [PubMed]
- Ando, S.; Gelsomino, L.; Panza, S.; Giordano, C.; Bonofiglio, D.; Barone, I.; Catalano, S. Obesity, Leptin and Breast Cancer: Epidemiological Evidence and Proposed Mechanisms. Cancers 2019, 11, 62. [Google Scholar] [CrossRef]
- Le Stunff, C.; Le Bihan, C.; Schork, N.J.; Bougnères, P. A common promoter variant of the leptin gene is associated with changes in the relationship between serum leptin and fat mass in obese girls. Diabetes 2000, 49, 2196–2200. [Google Scholar] [CrossRef] [PubMed]
- Manolio, T.A.; Collins, F.S.; Cox, N.J.; Goldstein, D.B.; Hindorff, L.A.; Hunter, D.J.; McCarthy, M.I.; Ramos, E.M.; Cardon, L.R.; Chakravarti, A. Finding the missing heritability of complex diseases. Nature 2009, 461, 747–753. [Google Scholar] [CrossRef]
- Sacks, F.M.; Campos, H. Low-density lipoprotein size and cardiovascular disease: A reappraisal. J. Clin. Endocrinol. Metab. 2003, 88, 4525–4532. [Google Scholar] [CrossRef]
- Cordell, H.J. Detecting gene–gene interactions that underlie human diseases. Nat. Rev. Genet. 2009, 10, 392–404. [Google Scholar] [CrossRef] [PubMed]
- Shabana; Hasnain, S. Leptin promoter variant G2548A is associated with serum leptin and HDL-C levels in a case control observational study in association with obesity in a Pakistani cohort. J. Biosci. 2016, 41, 251–255. [Google Scholar] [CrossRef]
- Mendoza-Perez, J.; Gu, J.; Herrera, L.A.; Tannir, N.M.; Zhang, S.Y.; Matin, S.; Karam, J.A.; Wood, C.G.; Wu, X.F. Prognostic significance of promoter CpG island methylation of obesity-related genes in patients with nonmetastatic renal cell carcinoma. Cancer 2017, 123, 3617–3627. [Google Scholar] [CrossRef]
- Saxena, N.K.; Vertino, P.M.; Anania, F.A.; Sharma, D. leptin-induced growth stimulation of breast cancer cells involves recruitment of histone acetyltransferases and mediator complex to CYCLIN D1 promoter via activation of Stat3. J. Biol. Chem. 2007, 282, 13316–13325. [Google Scholar] [CrossRef] [PubMed]
- Ghasemi, A.; Saeidi, J.; Azimi-Nejad, M.; Hashemy, S.I. Leptin-induced signaling pathways in cancer cell migration and invasion. Cell Oncol. 2019, 42, 243–260. [Google Scholar] [CrossRef]
- Olea-Flores, M.; Juárez-Cruz, J.C.; Zuñiga-Eulogio, M.D.; Acosta, E.; García-Rodríguez, E.; Zacapala-Gomez, A.E.; Mendoza-Catalán, M.A.; Ortiz-Ortiz, J.; Ortuño-Pineda, C.; Navarro-Tito, N. New Actors Driving the Epithelial-Mesenchymal Transition in Cancer: The Role of Leptin. Biomolecules 2020, 10, 1676. [Google Scholar] [CrossRef] [PubMed]
- Modzelewska, P.; Chludzińska, S.; Lewko, J.; Reszeć, J. The influence of leptin on the process of carcinogenesis. Contemp. Oncol. 2019, 23, 63–68. [Google Scholar] [CrossRef]
- Pu, X.; Chen, D. Targeting Adipokines in Obesity-Related Tumors. Front. Oncol. 2021, 11, 685923. [Google Scholar] [CrossRef]
- Losi, L.; Fonda, S.; Saponaro, S.; Chelbi, S.T.; Lancellotti, C.; Gozzi, G.; Alberti, L.; Fabbiani, L.; Botticelli, L.; Benhattar, J. Distinct DNA Methylation Profiles in Ovarian Tumors: Opportunities for Novel Biomarkers. Int. J. Mol. Sci. 2018, 19, 1559. [Google Scholar] [CrossRef]
- Ebell, M.H.; Culp, M.B.; Radke, T.J. A Systematic Review of Symptoms for the Diagnosis of Ovarian Cancer. Am. J. Prev. Med. 2016, 50, 384–394. [Google Scholar] [CrossRef]
- Rooth, C. Ovarian cancer: Risk factors, treatment and management. Br. J. Nurs. 2013, 22, S23–S30. [Google Scholar] [CrossRef] [PubMed]
- McMillan, D.C.; Sattar, N.; Lean, M.; McArdle, C.S. Obesity and cancer. BMJ 2006, 333, 1109. [Google Scholar] [CrossRef] [PubMed]
- Ottaiano, A.; De Divitiis, C.; Capozzi, M.; Avallone, A.; Pisano, C.; Pignata, S.; Tafuto, S. Obesity and Cancer: Biological Links and Treatment Implications. Curr. Cancer Drug Targets 2018, 18, 231–238. [Google Scholar] [CrossRef] [PubMed]
- Guerra, J.V.S.; Dias, M.M.G.; Brilhante, A.; Terra, M.F.; García-Arévalo, M.; Figueira, A.C.M. Multifactorial Basis and Therapeutic Strategies in Metabolism-Related Diseases. Nutrients 2021, 13, 2830. [Google Scholar] [CrossRef] [PubMed]
- Cordero-Barreal, A.; González-Rodríguez, M.; Ruiz-Fernández, C.; Eldjoudi, D.A.; AbdElHafez, Y.R.F.; Lago, F.; Conde, J.; Gómez, R.; González-Gay, M.A.; Mobasheri, A.; et al. An Update on the Role of Leptin in the Immuno-Metabolism of Cartilage. Int. J. Mol. Sci. 2021, 22, 2411. [Google Scholar] [CrossRef]
- Pérez-Pérez, A.; Sánchez-Jiménez, F.; Vilariño-García, T.; Sánchez-Margalet, V. Role of leptin in inflammation and vice versa. Int. J. Mol. Sci. 2020, 21, 5887. [Google Scholar] [CrossRef]
- Lin, T.-C.; Hsiao, M. Leptin and Cancer: Updated Functional Roles in Carcinogenesis, Therapeutic Niches, and Developments. Int. J. Mol. Sci. 2021, 22, 2870. [Google Scholar] [CrossRef]
- Valladares, M.; Corsini, G.; Romero, C. Association between obesity and ovarian cancer. Rev. Med. Chil. 2014, 142, 593–598. [Google Scholar] [CrossRef]
- Farag, K.I.; Makkouk, A.; Norian, L.A. Re-Evaluating the Effects of Obesity on Cancer Immunotherapy Outcomes in Renal Cancer: What Do We Really Know? Front. Immunol. 2021, 12, 668494. [Google Scholar] [CrossRef]
- Crean-Tate, K.K.; Reizes, O. Leptin Regulation of Cancer Stem Cells in Breast and Gynecologic Cancer. Endocrinology 2018, 159, 3069–3080. [Google Scholar] [CrossRef]
- Erondu, C.O.; Alberg, A.J.; Bandera, E.V.; Barnholtz-Sloan, J.; Bondy, M.; Cote, M.L.; Funkhouser, E.; Peters, E.; Schwartz, A.G.; Terry, P.D.; et al. The Association between Body Mass Index and Presenting Symptoms in African American Women with Ovarian Cancer. J. Womens Health 2016, 25, 571–578. [Google Scholar] [CrossRef] [PubMed]
- Genchi, V.A.; D’Oria, R.; Palma, G.; Caccioppoli, C.; Cignarelli, A.; Natalicchio, A.; Laviola, L.; Giorgino, F.; Perrini, S. Impaired Leptin Signalling in Obesity: Is Leptin a New Thermolipokine? Int. J. Mol. Sci. 2021, 22, 6445. [Google Scholar] [CrossRef]
- Friedman, J.M. Leptin and the endocrine control of energy balance. Nat. Metab. 2019, 1, 754–764. [Google Scholar] [CrossRef] [PubMed]
- Kato, S.; Abarzua-Catalan, L.; Trigo, C.; Delpiano, A.; Sanhueza, C.; García, K.; Ibañez, C.; Hormazábal, K.; Diaz, D.; Brañes, J.; et al. Leptin stimulates migration and invasion and maintains cancer stem-like properties in ovarian cancer cells: An explanation for poor outcomes in obese women. Oncotarget 2015, 6, 21100–21119. [Google Scholar] [CrossRef] [PubMed]
- Chin, Y.T.; Wang, L.M.; Hsieh, M.T.; Shih, Y.J.; Nana, A.W.; Changou, C.A.; Yang, Y.; Chiu, H.C.; Fu, E.; Davis, P.J.; et al. Leptin OB3 peptide suppresses leptin-induced signaling and progression in ovarian cancer cells. J. Biomed. Sci. 2017, 24, 51. [Google Scholar] [CrossRef]
- Ptak, A.; Kolaczkowska, E.; Gregoraszczuk, E.L. Leptin stimulation of cell cycle and inhibition of apoptosis gene and protein expression in OVCAR-3 ovarian cancer cells. Endocrine 2013, 43, 394–403. [Google Scholar] [CrossRef] [PubMed]
- Llanos, A.A.M.; Yao, S.; Singh, A.; Aremu, J.B.; Khiabanian, H.; Lin, Y.; Omene, C.; Omilian, A.R.; Khoury, T.; Hong, C.C.; et al. Gene expression of adipokines and adipokine receptors in the tumor microenvironment: Associations of lower expression with more aggressive breast tumor features. Breast Cancer Res. Treat. 2021, 185, 785–798. [Google Scholar] [CrossRef] [PubMed]
- Llanos, A.A.M.; Lin, Y.; Chen, W.J.; Yao, S.; Norin, J.; Chekmareva, M.A.; Omene, C.; Cong, L.; Omilian, A.R.; Khoury, T.; et al. Immunohistochemical analysis of adipokine and adipokine receptor expression in the breast tumor microenvironment: Associations of lower leptin receptor expression with estrogen receptor-negative status and triple-negative subtype. Breast Cancer Res. 2020, 22, 18. [Google Scholar] [CrossRef]
- Al-Shibli, S.M.; Harun, N.; Ashour, A.E.; Kasmuri, M.; Mizan, S. Expression of leptin and leptin receptors in colorectal cancer-an immunohistochemical study. Peerj 2019, 7, e7624. [Google Scholar] [CrossRef]
- Uddin, S.; Bu, R.; Ahmed, M.; Abubaker, J.; Al-Dayel, F.; Bavi, P.; Al-Kuraya, K.S. Overexpression of leptin receptor predicts an unfavorable outcome in Middle Eastern ovarian cancer. Mol. Cancer 2009, 8, 74. [Google Scholar] [CrossRef]
- Koda, M.; Sulkowska, M.; Wincewicz, A.; Kanczuga-Koda, L.; Musiatowicz, B.; Szymanska, M.; Sulkowski, S. Expression of leptin, leptin receptor, and hypoxia-inducible factor 1 alpha in human endometrial cancer. Ann. N.Y. Acad. Sci. 2007, 1095, 90–98. [Google Scholar] [CrossRef] [PubMed]
- Grabowski, J.P.; Markowska, A.; Markowska, J. Evaluation of leptin serum concentrations during surgery and first-line chemotherapy in primary epithelial ovarian cancer patients. Contemp. Oncol. 2014, 18, 318–322. [Google Scholar] [CrossRef] [PubMed]
- Jin, J.H.; Kim, H.-J.; Kim, C.Y.; Kim, Y.H.; Ju, W.; Kim, S.C. Association of plasma adiponectin and leptin levels with the development and progression of ovarian cancer. Obstet. Gynecol. Sci. 2016, 59, 279–285. [Google Scholar] [CrossRef] [PubMed]
- Hwang, J.; Na, S.; Lee, H.; Lee, D. Correlation between preoperative serum levels of five biomarkers and relationships between these biomarkers and cancer stage in epithelial overian cancer. J. Gynecol. Oncol. 2009, 20, 169. [Google Scholar] [CrossRef] [PubMed][Green Version]
- Matte, I.; Lane, D.; Laplante, C.; Rancourt, C.; Pich, A. Profiling of cytokines in human epithelial ovarian cancer ascites. Am. J. Cancer Res. 2012, 2, 566–580. [Google Scholar]
- Serin, I.S.; Tanriverdi, F.; Yilmaz, M.O.; Ozcelik, B.; Unluhizarci, K. Serum insulin-like growth factor (IGF)-I, IGF binding protein (IGFBP)-3, leptin concentrations and insulin resistance in benign and malignant epithelial ovarian tumors in postmenopausal women. Gynecol. Endocrinol. 2008, 24, 117–121. [Google Scholar] [CrossRef]
- Macciò, A.; Madeddu, C.; Massa, D.; Astara, G.; Farci, D.; Melis, G.B.; Mantovani, G. Interleukin-6 and leptin as markers of energy metabolic changes in advanced ovarian cancer patients. J. Cell. Mol. Med. 2009, 13, 3951–3959. [Google Scholar] [CrossRef]
- Jiménez-Cortegana, C.; López-Saavedra, A.; Sánchez-Jiménez, F.; Pérez-Pérez, A.; Castiñeiras, J.; Virizuela-Echaburu, J.A.; de la Cruz-Merino, L.d.l.; Sánchez-Margalet, V. Leptin, Both Bad and Good Actor in Cancer. Biomolecules 2021, 11, 913. [Google Scholar] [CrossRef]
- Nagle, C.; Dixon, S.; Jensen, A.; Kjaer, S.; Modugno, F.; DeFazio, A.; Fereday, S.; Hung, J.; Johnatty, S.; Fasching, P. Obesity and survival among women with ovarian cancer: Results from the Ovarian Cancer Association Consortium. Br. J. Cancer 2015, 113, 817–826. [Google Scholar] [CrossRef]
- Kumar, J.; Fang, H.; McCulloch, D.R.; Crowley, T.; Ward, A.C. Leptin receptor signaling via Janus kinase 2/Signal transducer and activator of transcription 3 impacts on ovarian cancer cell phenotypes. Oncotarget 2017, 8, 93530–93540. [Google Scholar] [CrossRef]
- Cuello-Fredes, M.; Kato, S.; Abarzúa-Catalán, L.; Delpiano, A.; Trigo, C.; García, K.; Sanhueza, C.; Ibañez, C.; Brañes, J.; Castellon, E.; et al. Leptin Promotes a More Aggresive Behavior of Ovarian Cancer Cells: A Potential Explanation for a Worse Prognosis in Obese Ovarian Cancer Patients: IGCS-0095 Ovarian Cancer. Int. J. Gynecol. Cancer 2015, 25 (Suppl. 1), 67. [Google Scholar] [CrossRef]
- Sahin, D.S.; Tumer, C.; Demir, C.; Celik, M.M.; Celik, M.; Ucar, E.; Gunesacar, R. Association with leptin gene C.-2548 G> A polymorphism, serum leptin levels, and body mass index in Turkish obese patients. Cell Biochem. Biophys. 2013, 65, 243–247. [Google Scholar] [CrossRef] [PubMed]
- Shahid, A.; Rana, S.; Mahmood, S.; Saeed, S. Role of leptin G-2548A polymorphism in age- and gender-specific development of obesity. J. Biosci. 2015, 40, 521–530. [Google Scholar] [CrossRef] [PubMed]
- Gallardo-Escribano, C.; Buonaiuto, V.; Ruiz-Moreno, M.I.; Vargas-Candela, A.; Vilches-Perez, A.; Benitez-Porres, J.; Romance-Garcia, A.R.; Ruiz-Moreno, A.; Gomez-Huelgas, R.; Bernal-Lopez, M.R. Epigenetic approach in obesity: DNA methylation in a prepubertal population which underwent a lifestyle modification. Clin. Epigenetics 2020, 12, 144. [Google Scholar] [CrossRef] [PubMed]
- Kim, M.S.; Lee, J.; Sidransky, D. DNA methylation markers in colorectal cancer. Cancer Metastasis Rev. 2010, 29, 181–206. [Google Scholar] [CrossRef]
- McMahon, K.W.; Karunasena, E.; Ahuja, N. The Roles of DNA Methylation in the Stages of Cancer. Cancer J. 2017, 23, 257–261. [Google Scholar] [CrossRef] [PubMed]
- Lohman, T.; Bains, G.; Berk, L.; Lohman, E. Predictors of Biological Age: The Implications for Wellness and Aging Research. Gerontol. Geriatr. Med. 2021, 7, 23337214211046419. [Google Scholar] [CrossRef]
- Chudasama, Y.V.; Khunti, K.; Gillies, C.L.; Dhalwani, N.N.; Davies, M.J.; Yates, T.; Zaccardi, F. Healthy lifestyle and life expectancy in people with multimorbidity in the UK Biobank: A longitudinal cohort study. PLoS Med. 2020, 17, e1003332. [Google Scholar] [CrossRef]
- Fava, G.A.; McEwen, B.S.; Guidi, J.; Gostoli, S.; Offidani, E.; Sonino, N. Clinical characterization of allostatic overload. Psychoneuroendocrinology 2019, 108, 94–101. [Google Scholar] [CrossRef]
- Unnikrishnan, A.; Freeman, W.M.; Jackson, J.; Wren, J.D.; Porter, H.; Richardson, A. The role of DNA methylation in epigenetics of aging. Pharmacol. Ther. 2019, 195, 172–185. [Google Scholar] [CrossRef]
- Montserrat-de la Paz, S.; Pérez-Pérez, A.; Vilariño-García, T.; Jimenez-Cortegana, C.; Muriana, F.J.G.; Millán-Linares, M.C.; Sanchez-Margalet, V. Nutritional modulation of leptin expression and leptin action in obesity and obesity-asociated complications. J. Nutr. Biochem. 2020, 108561. [Google Scholar]
- Lingappan, K. Does the Epigenome Hold Clues to Leptin-Associated Hypertension in Obesity? Am. J. Respir. Cell Mol. Biol. 2021, 65, 132–133. [Google Scholar] [CrossRef]
- Sadashiv; Modi, A.; Khokhar, M.; Sharma, P.; Joshi, R.; Mishra, S.S.; Bharshankar, R.; Tiwari, S.; Singh, P.K.; Bhosale, V.V.; et al. Leptin DNA Methylation and Its Association with Metabolic Risk Factors in a Northwest Indian Obese Population. J. Obes. Metab. Syndr. 2021, 30, 304–311. [Google Scholar] [CrossRef]
- Zheng, J.; Cai, W.; Lu, X.; He, W.; Li, D.; Zhong, H.; Yang, L.; Li, S.; Li, H.; Rafee, S.; et al. Chronic stress accelerates the process of gastric precancerous lesions in rats. J. Cancer 2021, 12, 4121–4133. [Google Scholar] [CrossRef] [PubMed]
- Yu, H.; Pan, R.; Qi, Y.; Zheng, Z.; Li, J.; Li, H.; Ying, J.; Xu, M.; Duan, S. LEPR hypomethylation is significantly associated with gastric cancer in males. Exp. Mol. Pathol. 2020, 116, 104493. [Google Scholar] [CrossRef]
- Gorska, E.; Popko, K.; Stelmaszczyk-Emmel, A.; Ciepiela, O.; Kucharska, A.; Wasik, M. Leptin receptors. Eur. J. Med. Res. 2010, 15, 50. [Google Scholar] [CrossRef] [PubMed]
- Lipponen, P.K.; Collan, Y. Simple quantitation of immunohistochemical staining positivity in microscopy for histopathology routine. Acta Stereol. 1992, 11. [Google Scholar]
- Buhmeida, A.; Elzagheid, A.; Algars, A.; Collan, Y.; Syrjänen, K.; Pyrhönen, S. Expression of the cell-cell adhesion molecule beta-catenin in colorectal carcinomas and their metastases. Apmis 2008, 116, 1–9. [Google Scholar] [CrossRef]
- Dallol, A.; Al-Ali, W.; Al-Shaibani, A.; Al-Mulla, F. Analysis of DNA Methylation in FFPE Tissues Using the MethyLight Technology. In Formalin-Fixed Paraffin-Embedded Tissues: Methods and Protocols; Al-Mulla, F., Ed.; Humana Press: Totowa, NJ, USA, 2011; pp. 191–204. [Google Scholar]


| Features | Total Number of Patients N (%) | Number of LEP Expression Cases (%) | p-Value | |
|---|---|---|---|---|
| Low Expression (0, 1+) | High Expression (2+, 3+) | |||
| Age | ||||
| <50 | 117 (56%) | 22% | 78% | 0.77 |
| >50 | 90 (43.5%) | 20% | 80% | |
| Missing | 1 (0.5%) | |||
| Tumor Site | ||||
| Right | 36 (17%) | 20% | 80% | 0.52 |
| Left | 24 (12%) | 37% | 63% | |
| Bilateral | 146 (70%) | 20% | 80% | |
| Missing | 2 (1%) | |||
| Tumor Size | ||||
| 1–5 cm | 44 (21%) | 14% | 86% | 0.01 |
| 6–10 cm | 50 (24%) | 4% | 96% | |
| >10 cm | 98 (47%) | 33% | 67% | |
| Missing | 16 (8%) | |||
| Tumor Subtype | ||||
| Serous | 96 (46%) | 0% | 100% | 0.001 |
| Mucinous | 39 (19%) | 17% | 83% | |
| Other | 63 (30%) | 43% | 57% | |
| Missing | 10 (5%) | |||
| Tumor Grade | ||||
| Low grade | 29 (14%) | 8% | 92% | 0.24 |
| Intermediate | 35 (17%) | 32% | 69% | |
| High grade | 107 (51%) | 14% | 86% | |
| Missing | 37 (18%) | |||
| LVI Status | ||||
| Positive | 67 (32%) | 39% | 61% | 0.001 |
| Negative | 106 (51%) | 7% | 93% | |
| Missing | 35 (17%) | |||
| BMI | ||||
| <23 | 19 (9%) | 0% | 100% | 0.20 |
| 23–26 | 52 (25%) | 41% | 59% | |
| >26 | 88 (42%) | 23% | 77% | |
| Missing | 49 (24%) | |||
| Parity | ||||
| Parous | 98 (47%) | 31% | 69% | 0.07 |
| Nulliparous | 64 (31%) | 49% | 51% | |
| Missing | 46 (22%) | |||
| Age of Menarche | ||||
| <13 | 58 (28%) | 57% | 43% | 0.01 |
| >13 | 99 (48%) | 20% | 80% | |
| Missing | 49 (24%) | |||
| Menopausal Status | ||||
| Premenopausal | 118 (57%) | 26% | 74% | 0.29 |
| Postmenopausal | 88 (42%) | 17% | 83% | |
| Missing | 2 (1%) | |||
| Tumor Stage | ||||
| Stage I | 59 (28%) | 28% | 72% | 0.04 |
| Stage II | 17 (8%) | 50% | 50% | |
| Stage III | 85 (41%) | 9% | 91% | |
| Stage IV | 30 (15%) | 29% | 71% | |
| Missing | 17 (8%) | |||
| Feature | Number of Cases (%) | LEP Methylation Profile | p-Value | |
|---|---|---|---|---|
| “0” (%) | “1” (%) | |||
| Age | ||||
| <50 | 40 (64%) | 19 (79%) | 21 (55%) | 0.06 |
| >50 | 22 (35%) | 5 (21%) | 17 (45%) | |
| Missing | 1 (2%) | |||
| Tumor Site | ||||
| Right | 11 (18%) | 4 (17%) | 7 (18%) | 0.04 |
| Left | 11 (18%) | 8 (33%) | 3 (8%) | |
| bilateral | 40 (64%) | 12 (50%) | 28 (74%) | |
| Missing | 1 (2%) | |||
| Tumor Size | ||||
| 1–5 cm | 18 (29%) | 9 (39%) | 9 (24%) | 0.39 |
| 6–10 cm | 16 (25%) | 6 (26%) | 10 (26%) | |
| >10 cm | 27 (43%) | 8 (35%) | 19 (50%) | |
| Missing | 2 (3%) | |||
| Tumor Subtype | ||||
| Serous | 30 (48%) | 12 (50%) | 18 (47%) | 0.001 |
| Mucinous | 17 (27%) | 1 (4%) | 16 (42%) | |
| Other | 14 (22%) | 11 (46%) | 3 (8%) | |
| Unknown | 1 (2%) | 0 (0%) | 1 (3%) | |
| Missing | 1 (2%) | |||
| Tumor Grade | ||||
| Low grade | 8 (13%) | 4 (20%) | 4 (13%) | 0.80 |
| Intermediate | 15 (24%) | 5 (24%) | 10 (32%) | |
| High grade | 19 (30%) | 7 (33%) | 12 (39%) | |
| Missing | 21 (11%) | |||
| LVI Status | ||||
| Positive | 28 (44%) | 7 (54%) | 21 (68%) | 0.38 |
| Negative | 16 (25%) | 6 (46%) | 10 (32%) | |
| Missing | 19 (30%) | |||
| BMI | ||||
| <23 | 2 (3%) | 0 (0%) | 2 (10%) | 0.11 |
| 23–26 | 12 (19%) | 8 (47%) | 4 (19%) | |
| >26 | 24 (38%) | 9 (53%) | 15 (71%) | |
| Missing | 25 (40%) | |||
| Parity | ||||
| Parous | 29 (46%) | 10 (63%) | 19 (73%) | 0.47 |
| Nulliparous | 13 (20%) | 6 (38%) | 7 (27%) | |
| Missing | 21 (33%) | |||
| Menopausal Status | ||||
| Premenopausal | 41 (65%) | 19 (79%) | 22 (58%) | 0.09 |
| Postmenopausal | 21 (33%) | 5 (21%) | 16 (42%) | |
| Missing | 1 (2%) | |||
| Tumor Stage | ||||
| Stage I | 16 (25%) | 8 (38%) | 8 (23%) | 0.64 |
| Stage II | 4 (6%) | 1 (5%) | 3 (9%) | |
| Stage III | 31 (49%) | 10 (48%) | 21 (60%) | |
| Stage IV | 5 (8%) | 2 (10%) | 3 (9%) | |
| Missing | 7 (11%) | |||
| LEP Protein Expression Patterns | LEP Promoter Methylation Status | ||
|---|---|---|---|
| No/Low expression | 38% | Hypermethylation | 43% |
| High expression | 62% | Unmethylated | 57% |
Publisher’s Note: MDPI stays neutral with regard to jurisdictional claims in published maps and institutional affiliations. |
© 2021 by the authors. Licensee MDPI, Basel, Switzerland. This article is an open access article distributed under the terms and conditions of the Creative Commons Attribution (CC BY) license (https://creativecommons.org/licenses/by/4.0/).
Share and Cite
Assidi, M.; Yahya, F.M.; Al-Zahrani, M.H.; Elkhatib, R.; Zari, A.; Elaimi, A.; Al-Maghrabi, J.; Dallol, A.; Buhmeida, A.; Abu-Elmagd, M. Leptin Protein Expression and Promoter Methylation in Ovarian Cancer: A Strong Prognostic Value with Theranostic Promises. Int. J. Mol. Sci. 2021, 22, 12872. https://doi.org/10.3390/ijms222312872
Assidi M, Yahya FM, Al-Zahrani MH, Elkhatib R, Zari A, Elaimi A, Al-Maghrabi J, Dallol A, Buhmeida A, Abu-Elmagd M. Leptin Protein Expression and Promoter Methylation in Ovarian Cancer: A Strong Prognostic Value with Theranostic Promises. International Journal of Molecular Sciences. 2021; 22(23):12872. https://doi.org/10.3390/ijms222312872
Chicago/Turabian StyleAssidi, Mourad, Fatimah M. Yahya, Maryam H. Al-Zahrani, Razan Elkhatib, Ali Zari, Aisha Elaimi, Jaudah Al-Maghrabi, Ashraf Dallol, Abdelbaset Buhmeida, and Muhammad Abu-Elmagd. 2021. "Leptin Protein Expression and Promoter Methylation in Ovarian Cancer: A Strong Prognostic Value with Theranostic Promises" International Journal of Molecular Sciences 22, no. 23: 12872. https://doi.org/10.3390/ijms222312872
APA StyleAssidi, M., Yahya, F. M., Al-Zahrani, M. H., Elkhatib, R., Zari, A., Elaimi, A., Al-Maghrabi, J., Dallol, A., Buhmeida, A., & Abu-Elmagd, M. (2021). Leptin Protein Expression and Promoter Methylation in Ovarian Cancer: A Strong Prognostic Value with Theranostic Promises. International Journal of Molecular Sciences, 22(23), 12872. https://doi.org/10.3390/ijms222312872