Figure 1.
Whole-body knockdown of dSLC5A5 perturbs systemic glucose metabolism without affecting food intake. (A–D) Systemic glucose levels in control flies (UAS-dSLC5A5RNAi) or in flies bearing the whole-body KD of dSLC5A5 using different ubiquitous drivers, Act-Gal4 (A), Da-Gal4 (B), or Ubi-Gal4 (C). Systemic glucose levels (μg/μL) were normalized to whole-body protein (μg/μL). (D,E) Circulating levels of glucose (D) and trehalose (E) in control flies or in flies with the whole-body KD of dSLC5A5 mediated by Act-Gal4 (Act-Gal4 > dSLC5A5RNAi). (F) Food consumption in control flies or in flies with the whole-body KD of dSLC5A5 mediated by Act-Gal4 (Act-Gal4 > dSLC5A5RNAi). In all cases, control flies are the RNAi transgene control flies (UAS-dSLC5A5RNAi). Results are the mean ± standard error of the mean (SEM) of 30–40 flies analyzed over at least five independent experiments and expressed as the fold change compared with that of the control flies (set at 1.0). Student’s t-test was used to derive p-values between the transgene control and KD flies. ND, normal diet.

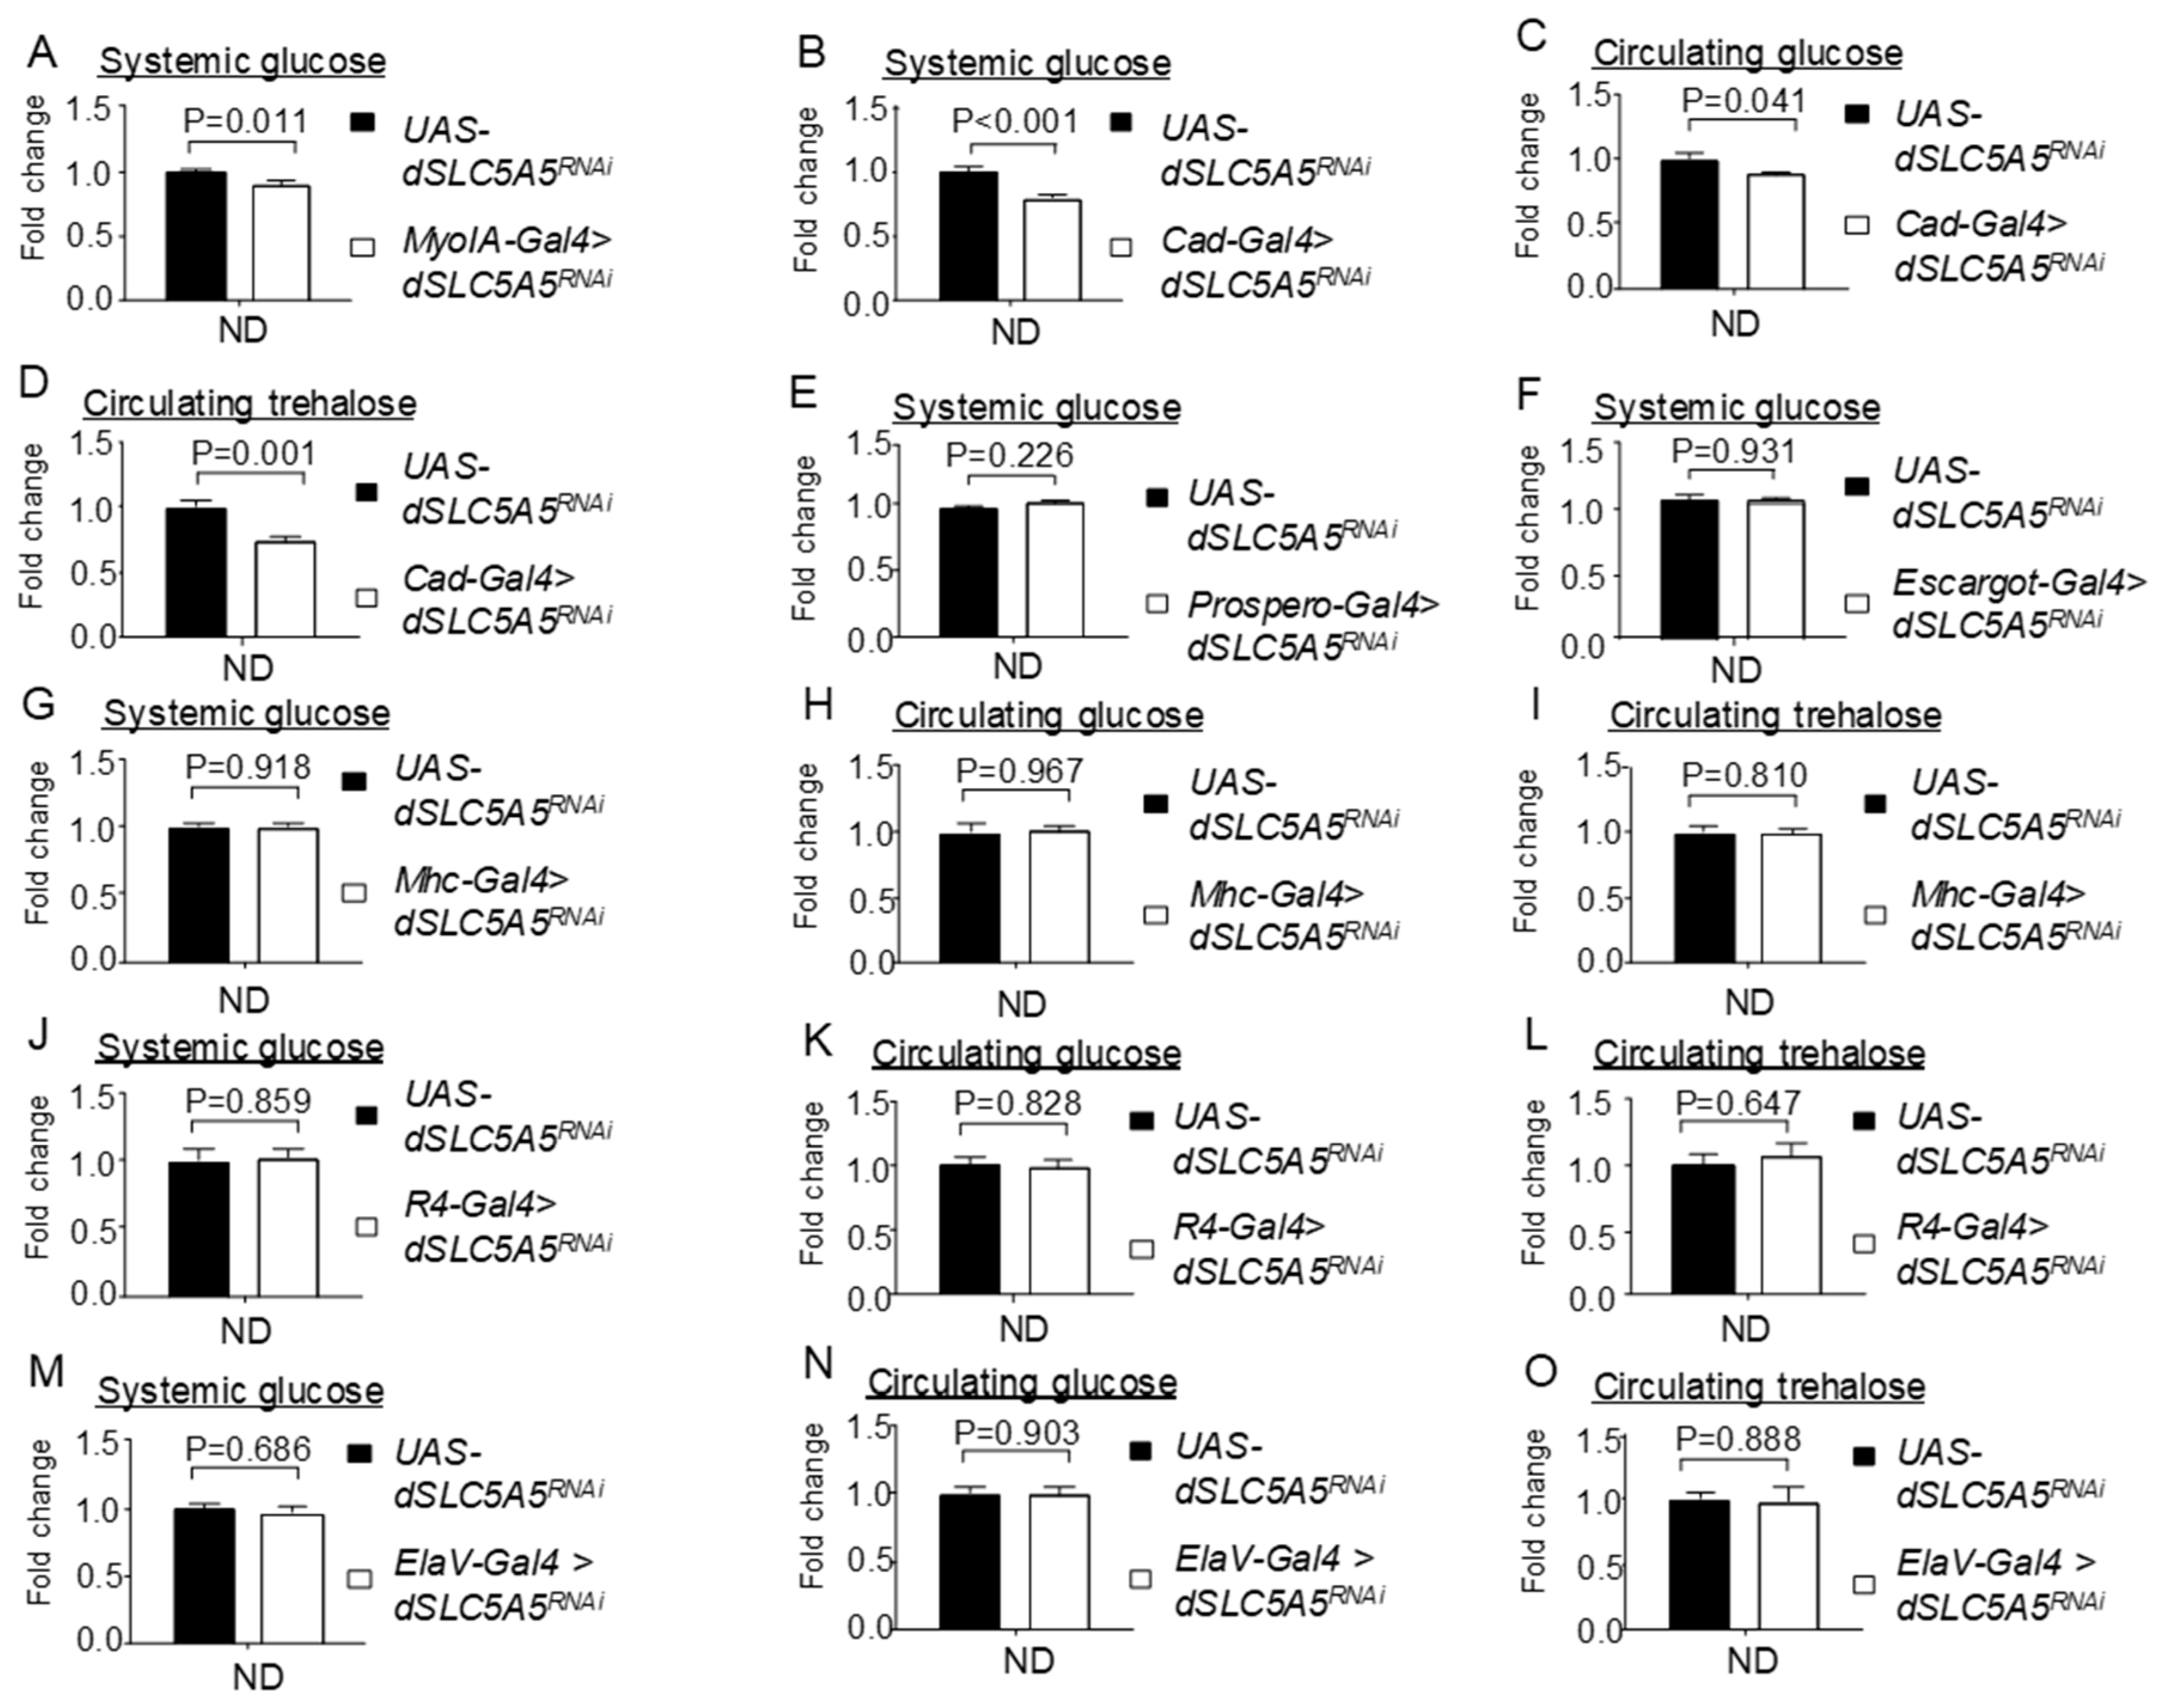
Figure 2.
Tissue-specific knockdown of dSLC5A5 differentially perturbs systemic glucose metabolism. (A,B) Systemic glucose levels in control flies (UAS-dSLC5A5RNAi) or in midgut-specific dSLC5A5-KD flies mediated by MyoIA-Gal4 (A) or Cad-Gal4 (B). (C,D) Circulating glucose levels (C) or circulating trehalose levels (D) in control flies or in midgut-specific dSLC5A5-KD flies mediated by Cad-Gal4. (E) Systemic glucose levels in control flies or in enteroendocrine cell-specific dSLC5A5-KD flies mediated by Prospero-Gal4. (F) Systemic glucose levels in control flies or in intestinal stem cell/enteroblast-specific dSLC5A5-KD flies mediated by Escargot-Gal4. (G–I) Systemic glucose levels (G), circulating glucose levels (H), or circulating trehalose levels (I) in control flies or in skeletal-muscle-specific dSLC5A5-KD flies mediated by Mhc-Gal4. (J–L) Systemic glucose levels (J), circulating glucose levels (K), or circulating trehalose levels (L) in control flies or in fat-body-specific dSLC5A5-KD flies mediated by R4-Gal4. (M–O) Systemic glucose levels (M), circulating glucose levels (N), or circulating trehalose levels (O) in control flies or in neuronal-specific dSLC5A5-KD flies mediated by ElaV-Gal4. In all cases, systemic glucose levels (μg/μL) were normalized to whole-body protein (μg/μL). Results are the mean ± SEM of 30–40 flies analyzed over at least five independent experiments and expressed as the fold change compared with that of the control flies (set at 1.0). Student’s t-test was used to derive p-values between the transgene control and KD flies. ND, normal diet.

Figure 3.
Overexpression of dSLC5A5 alters systemic glucose metabolism. (A) Quantitative real-time PCR analysis of the whole-fly levels of dSLC5A5 in Gal4 control flies (Hsp70-Gal4) or in whole-body dSLC5A5-overexpressing flies mediated by Hsp70-Gal4 (Hsp70-Gal4 > dSLC5A5-FLAG). Flies were subjected to a 40 min heat shock for the induction of dSLC5A5 overexpression. RPL14 served as an internal control. Results are the mean ± SEM of 15 flies analyzed over three independent experiments per genotype and expressed as the fold change compared with that of the control flies (set at 1.0). Student’s t-test was used to derive p-values between the control and KD flies. (B–C′) Representative confocal images of the sagittal sections of midguts (R4c-R5 regions) in (B,B′) or in whole-body dSLC5A5-overexpressing flies mediated by Hsp70-Gal4 (C,C′). Flies were subjected to a 40 min heat shock and a 1 h post-recovery (25 °C) regimen for the induction of dSLC5A5 overexpression followed by midgut isolation and immunostaining for FLAG (red), F-actin (green), and DNA (blue). Scale bars represent 10 μm. (D) Quantification of FLAG immunofluorescence with the mean intensity for the Hsp70-Gal4 > dSLC5A5-FLAG flies normalized to that of control flies (Hsp70-Gal4; set at 1.0). For each genotype, three to five intestines were analyzed for FLAG immunofluorescence and the results are represented as the mean fold change ± SEM. (E-G) Systemic glucose levels (E,G) or circulating glucose levels (F) in control flies or in whole-body (E,F) or midgut-specific (G) dSLC5A5-overexpressing flies. Systemic glucose levels (μg/μL) were normalized to whole-body protein (μg/μL). Results are the mean ± SEM of 30–40 flies analyzed over at least five independent experiments and expressed as the fold change compared with that of the control flies (set at 1.0). Student’s t-test was used to derive p-values between the transgene control and Gal4-mediated RNAi lines. ND, normal diet.

Figure 4.
Intestinal-specific inhibition or overexpression of dSLC5A5 disrupts glucose uptake in the enterocytes. (A–C″) Representative confocal images of the intracellular accumulation of 2-NBDG in the ex vivo (A–A″) or in vivo (C–C″) enterocytes in the R4c-R5 midgut region of control flies (UAS-dSLC5A5RNAi) (A,C) or in midgut-specific dSLC5A5-KD flies mediated by Cad-Gal4 (A′,C′) or MyoIA-Gal4 (A″,C″). Scale bars represent 20 μm. (B,D) Quantification of 2-NBDG fluorescence with the mean intensity for the different genotypes normalized to that of control flies (set at 1.0) in ex vivo glucose uptake assay (B) or in vivo uptake assay (D). For each genotype, three to five intestines were analyzed for 2-NBDG fluorescence and results are represented as the mean fold change ± SEM. (E,E′) Representative confocal images of the intracellular accumulation of 2-NBDG in the enterocytes of the R4c-R5 midgut region of control flies (Hsp70-Gal4) (E) or in whole-body dSLC5A5-overexpressing flies mediated by Hsp70-Gal4 (E′). Flies were subjected to a 40 min heat shock followed by a 1 h post-recovery regimen (25 °C) for the induction of dSLC5A5 overexpression followed by midgut isolation and 2-NBDG incubation ex vivo. Scale bars represent 20 μm. (F) Quantification of 2-NBDG fluorescence with the mean intensity for the Hsp70-Gal4 > dSLC5A5-FLAG flies normalized to that of control flies (set at 1.0). For each genotype, three to five intestines were analyzed for 2-NBDG fluorescence and results are represented as the mean fold change ± SEM. (G,H) 2-NBDG levels (G) or glucose levels (H) in the excrement of control flies or midgut-specific dSLC5A5-KD flies mediated by Caudal-Gal4 after 2-NBDG or glucose feeding for an hour following overnight starvation. Five 1-week-old female flies per genotype were used for 6 h excrement collection. (I,J) Circulating glucose levels (I) or circulating fructose levels (J) in control flies or midgut-specific dSLC5A5-KD flies mediated by MyoIA-Gal4 after glucose or fructose feeding for an hour following overnight starvation. Results are the mean ± SEM of 30–40 flies analyzed over at least five independent experiments and expressed as the fold change compared with that of the control flies (set at 1.0). Student’s t-test was used for statistical analysis between the transgene control and KD flies. ND, normal diet.

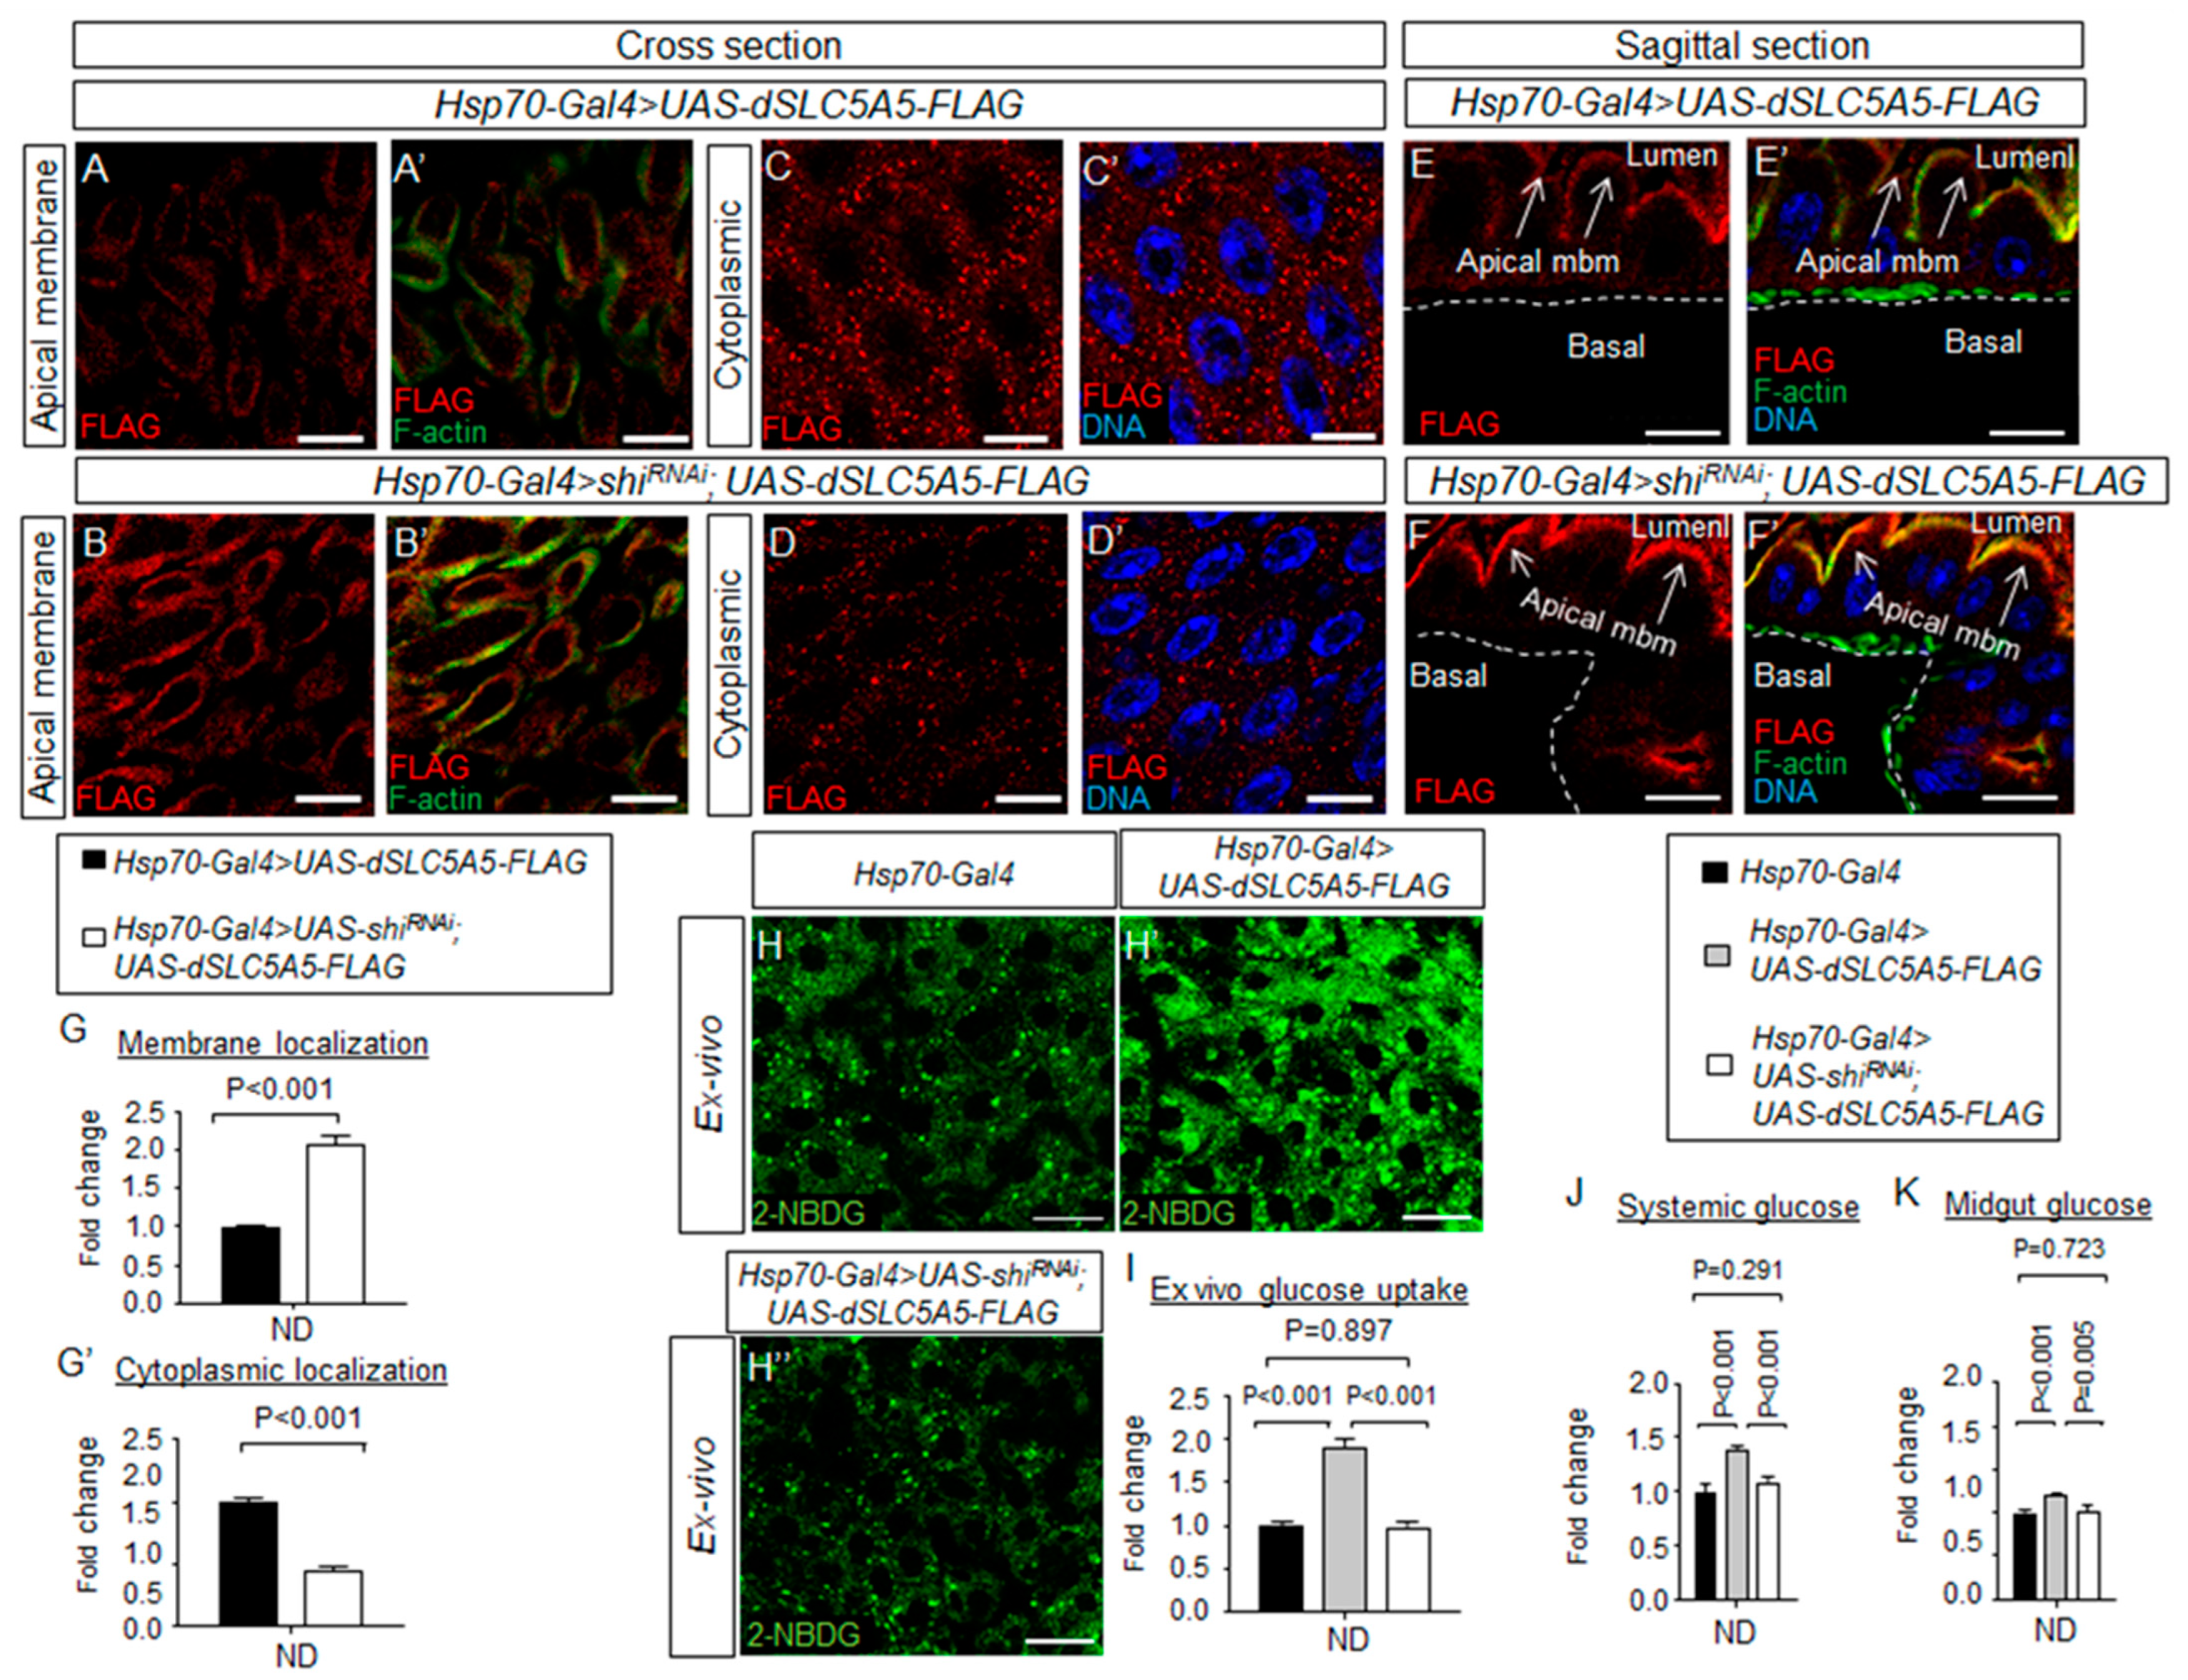
Figure 5.
Dynamin-dependent endocytosis regulates dSLC5A5 membrane trafficking and glucose uptake in the enterocytes. (A–F′) Representative confocal images of dSLC5A5-FLAG-overexpressing enterocytes in the R4c-R5 midgut region that are immunostained for FLAG (red), F-actin (green), and DNA (blue) in the absence (A,A′,C,C′,E,E′) or the presence (B,B’,D,D′,F,F′) of shibire-KD mediated by Hsp70-Gal4. Scale bars represent 20 μm. (G,G′) Quantification of the FLAG immunofluorescence in the apical membrane (G) or cytoplasm (G′) of enterocytes with the mean intensity for the Hsp70-Gal4 > shibireRNAi; dSLC5A5-FLAG flies normalized to that of control flies (Hsp70-Gal4; set at 1.0). Data represent the mean fold change ± SEM from three independent images. (H–H″) Representative confocal images of the intracellular accumulation of 2-NBDG in the enterocytes of the R4c-R5 midgut region of control flies (Hsp70-Gal4), dSLC5A5-FLAG-overexpressing flies (Hsp70-Gal4 > dSLC5A5-FLAG) or dSLC5A5-overexpressing and shibire-KD flies (Hsp70-Gal4 > shibireRNAi; dSLC5A5-FLAG). The flies were subjected to a 40 min heat shock followed by a 1 h post-recovery regimen (25 °C) for the induction of dSLC5A5 overexpression followed by midgut isolation and 2-NBDG incubation ex vivo. Scale bars represent 20 μm. (I) Quantification of 2-NBDG fluorescence with the mean intensity for the different genotypes normalized to that of driver control flies (Hsp70-Gal4; set at 1.0). For each genotype, three to five intestines were analyzed for 2-NBDG fluorescence and results are represented as mean fold change ± SEM. (J,K) Systemic glucose levels (J) or midgut glucose levels (K) in control flies (Hsp70-Gal4), dSLC5A5-FLAG-overexpressing flies (Hsp70-Gal4 > dSLC5A5-FLAG), or dSLC5A5-overexpressing and shibire-KD flies (Hsp70-Gal4 > shiRNAi; dSLC5A5-FLAG). Systemic glucose levels (μg/μL) were normalized to whole-body protein (μg/μL). Results are the mean ± SEM of 30–40 flies analyzed over at least five independent experiments and expressed as the fold change compared with that of the control flies (set at 1.0). Student’s t-test was used for statistical analysis. ND, normal diet.

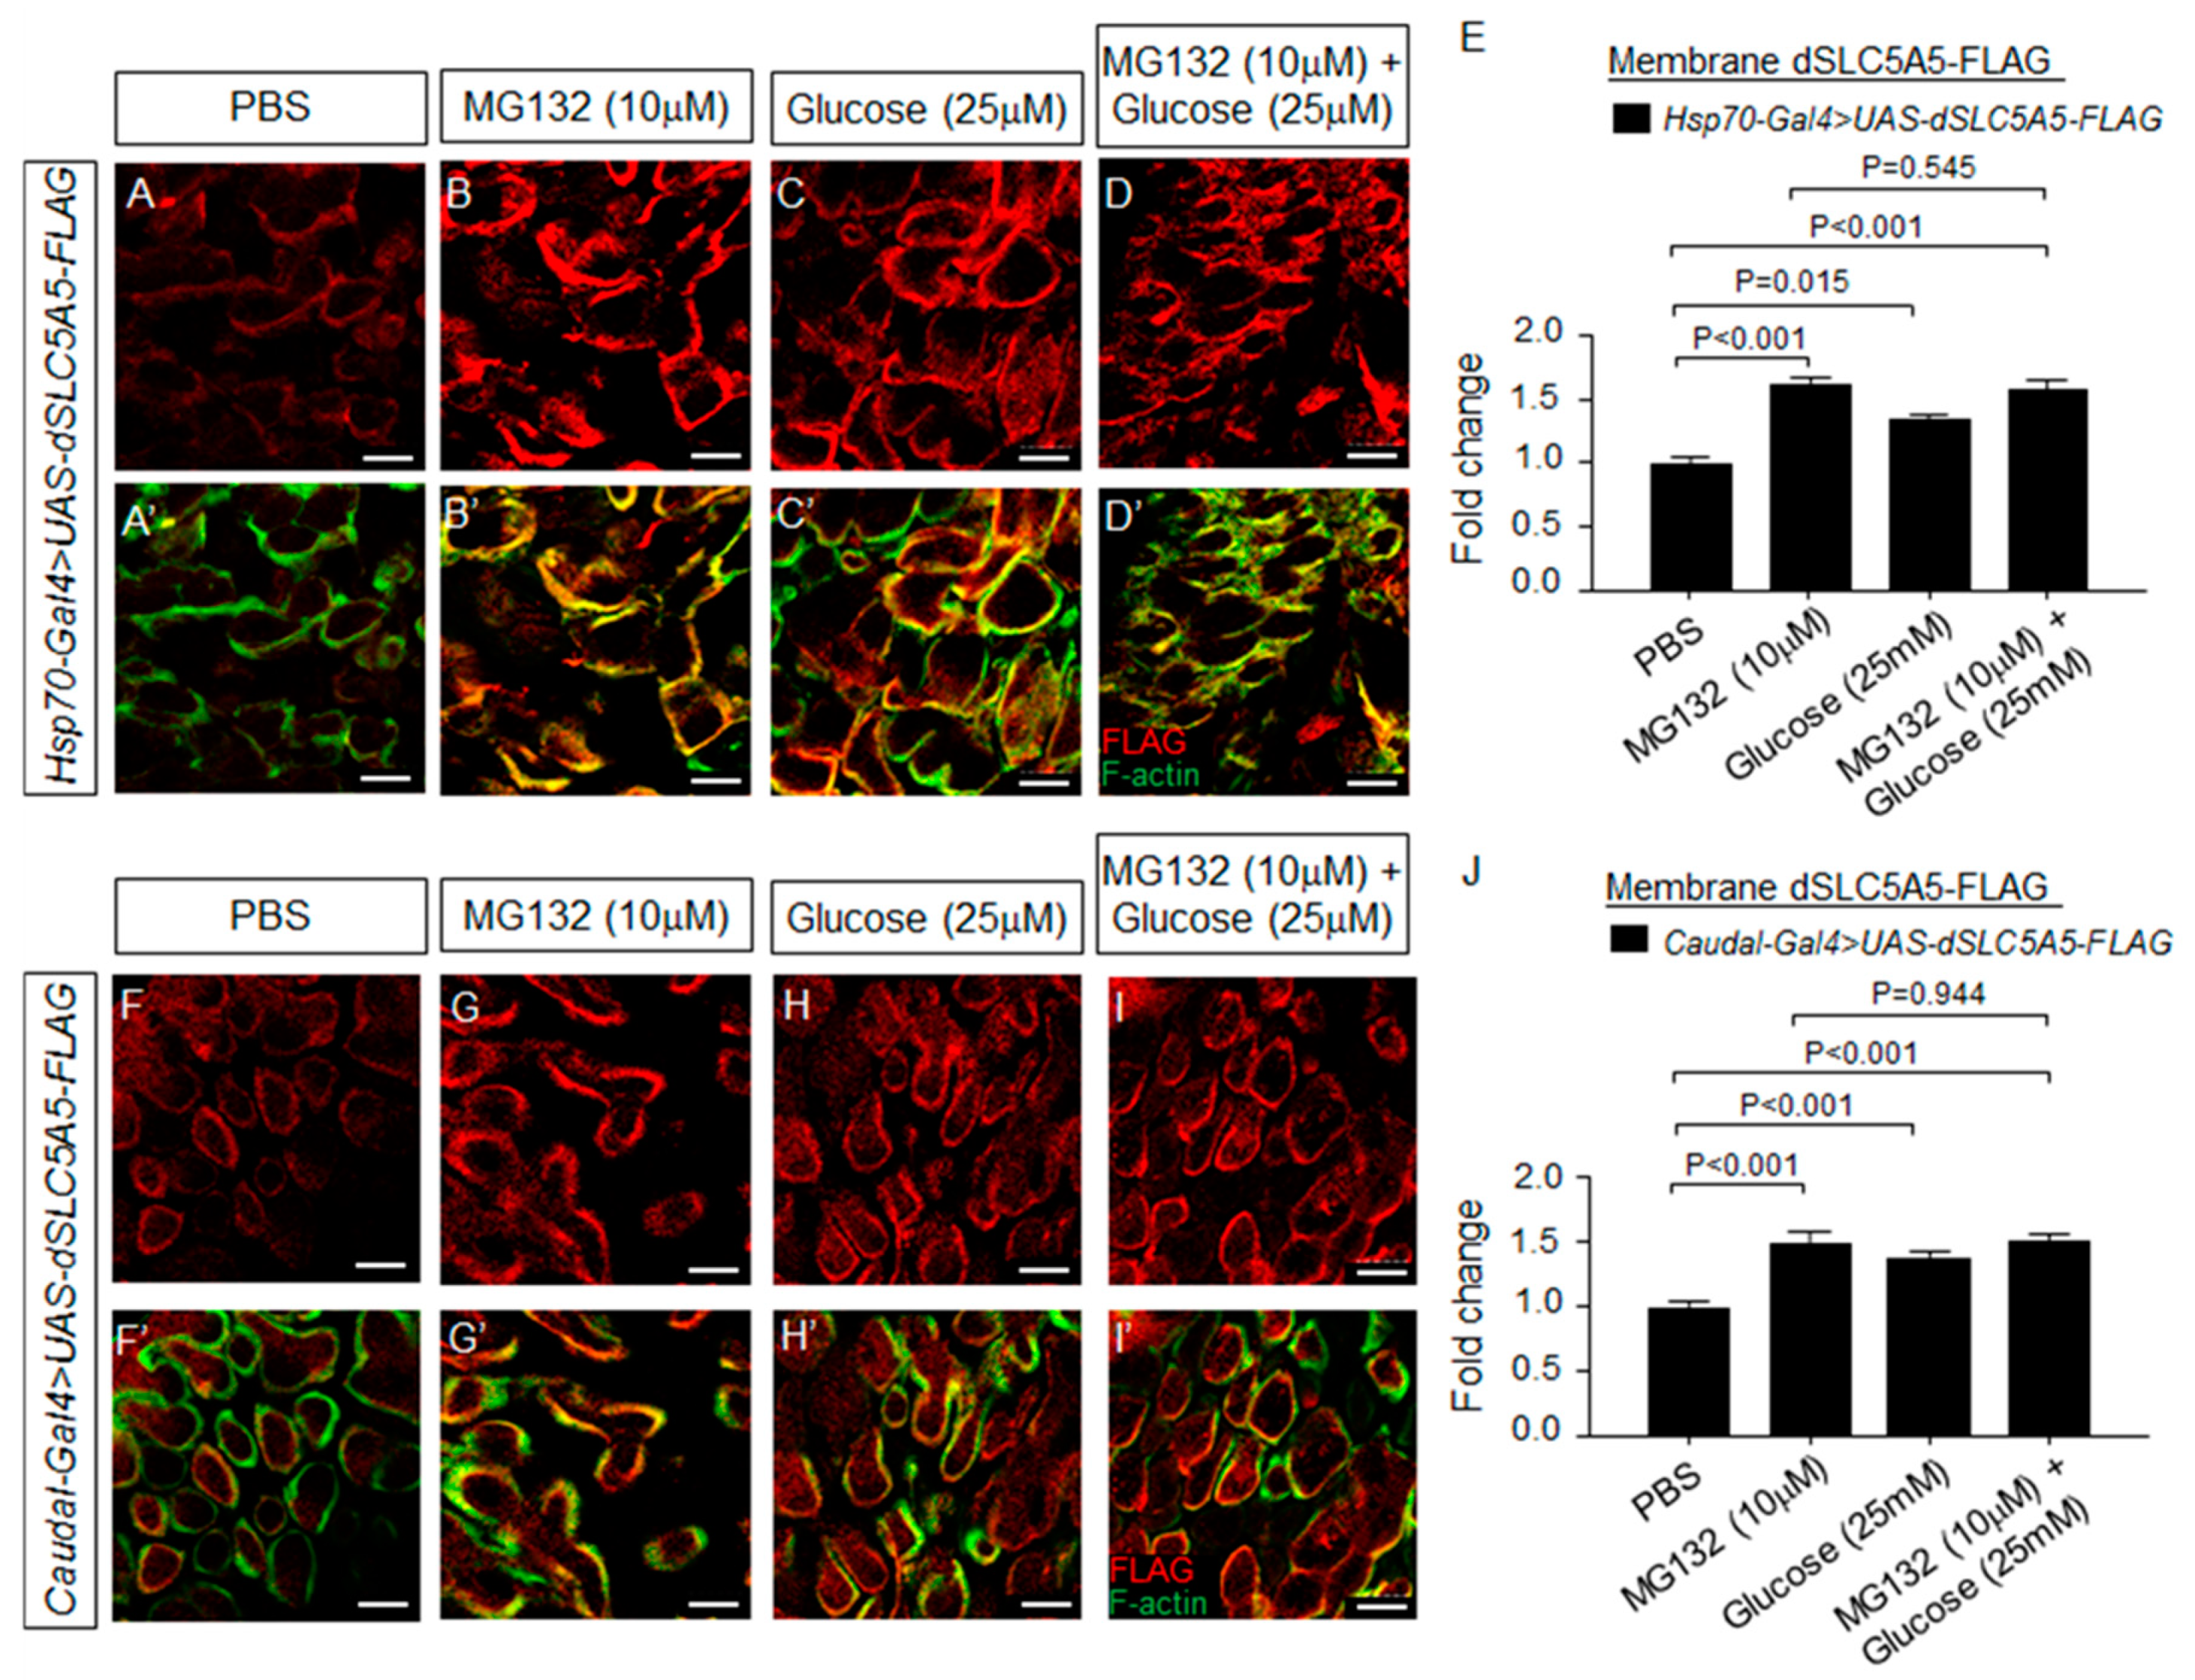
Figure 6.
Regulation of dSLC5A5 membrane abundance by proteasome inhibitor, high glucose, or both. (A–D′) Representative confocal images of the Hsp70-Gal4-mediated dSLC5A5-FLAG-overexpressing enterocytes in the R4c-R5 midgut region that are immunostained for FLAG (red), F-actin (green), and DNA (blue). Flies were subjected to a 40 min heat shock followed by a 1 h post-recovery session (25 °C) for the induction of dSLC5A5 overexpression followed by midgut isolation and 30 min of incubation with PBS (A,A′), proteasome inhibitor MG132 (10 µM) (B,B′), high extracellular glucose (25 mM) (C,C′), or a combination of these (D,D′). Scale bars represent 10 μm. (E) Quantification of the apical membrane FLAG immunofluorescence with the mean intensity for the different genotypes normalized to that of PBS treatment (set at 1.0). For each genotype, three to five intestines were analyzed for FLAG immunofluorescence and results are represented as the mean fold change ± SEM. (F–I′). Representative confocal images of Cad-Gal4-mediated dSLC5A5-FLAG-overexpressing enterocytes in the R4c-R5 midgut region that are immunostained for FLAG (red), F-actin (green), and DNA (blue). Flies were subjected to a 40 min heat shock followed by a 1 h post-recovery session (25 °C) for the induction of dSLC5A5 overexpression followed by midgut isolation and 30 min of incubation with PBS (F,F′), proteasome inhibitor MG132 (10 µM) (G,G′), high extracellular glucose (25 mM) (H,H′), or a combination of these (I,I′). Scale bars represent 10 μm. (J) Quantification of the apical membrane FLAG immunofluorescence with the mean intensity for the different genotypes normalized to that of PBS treatment (set at 1.0). For each genotype, three to five intestines were analyzed for FLAG immunofluorescence and results are represented as the mean fold change ± SEM.

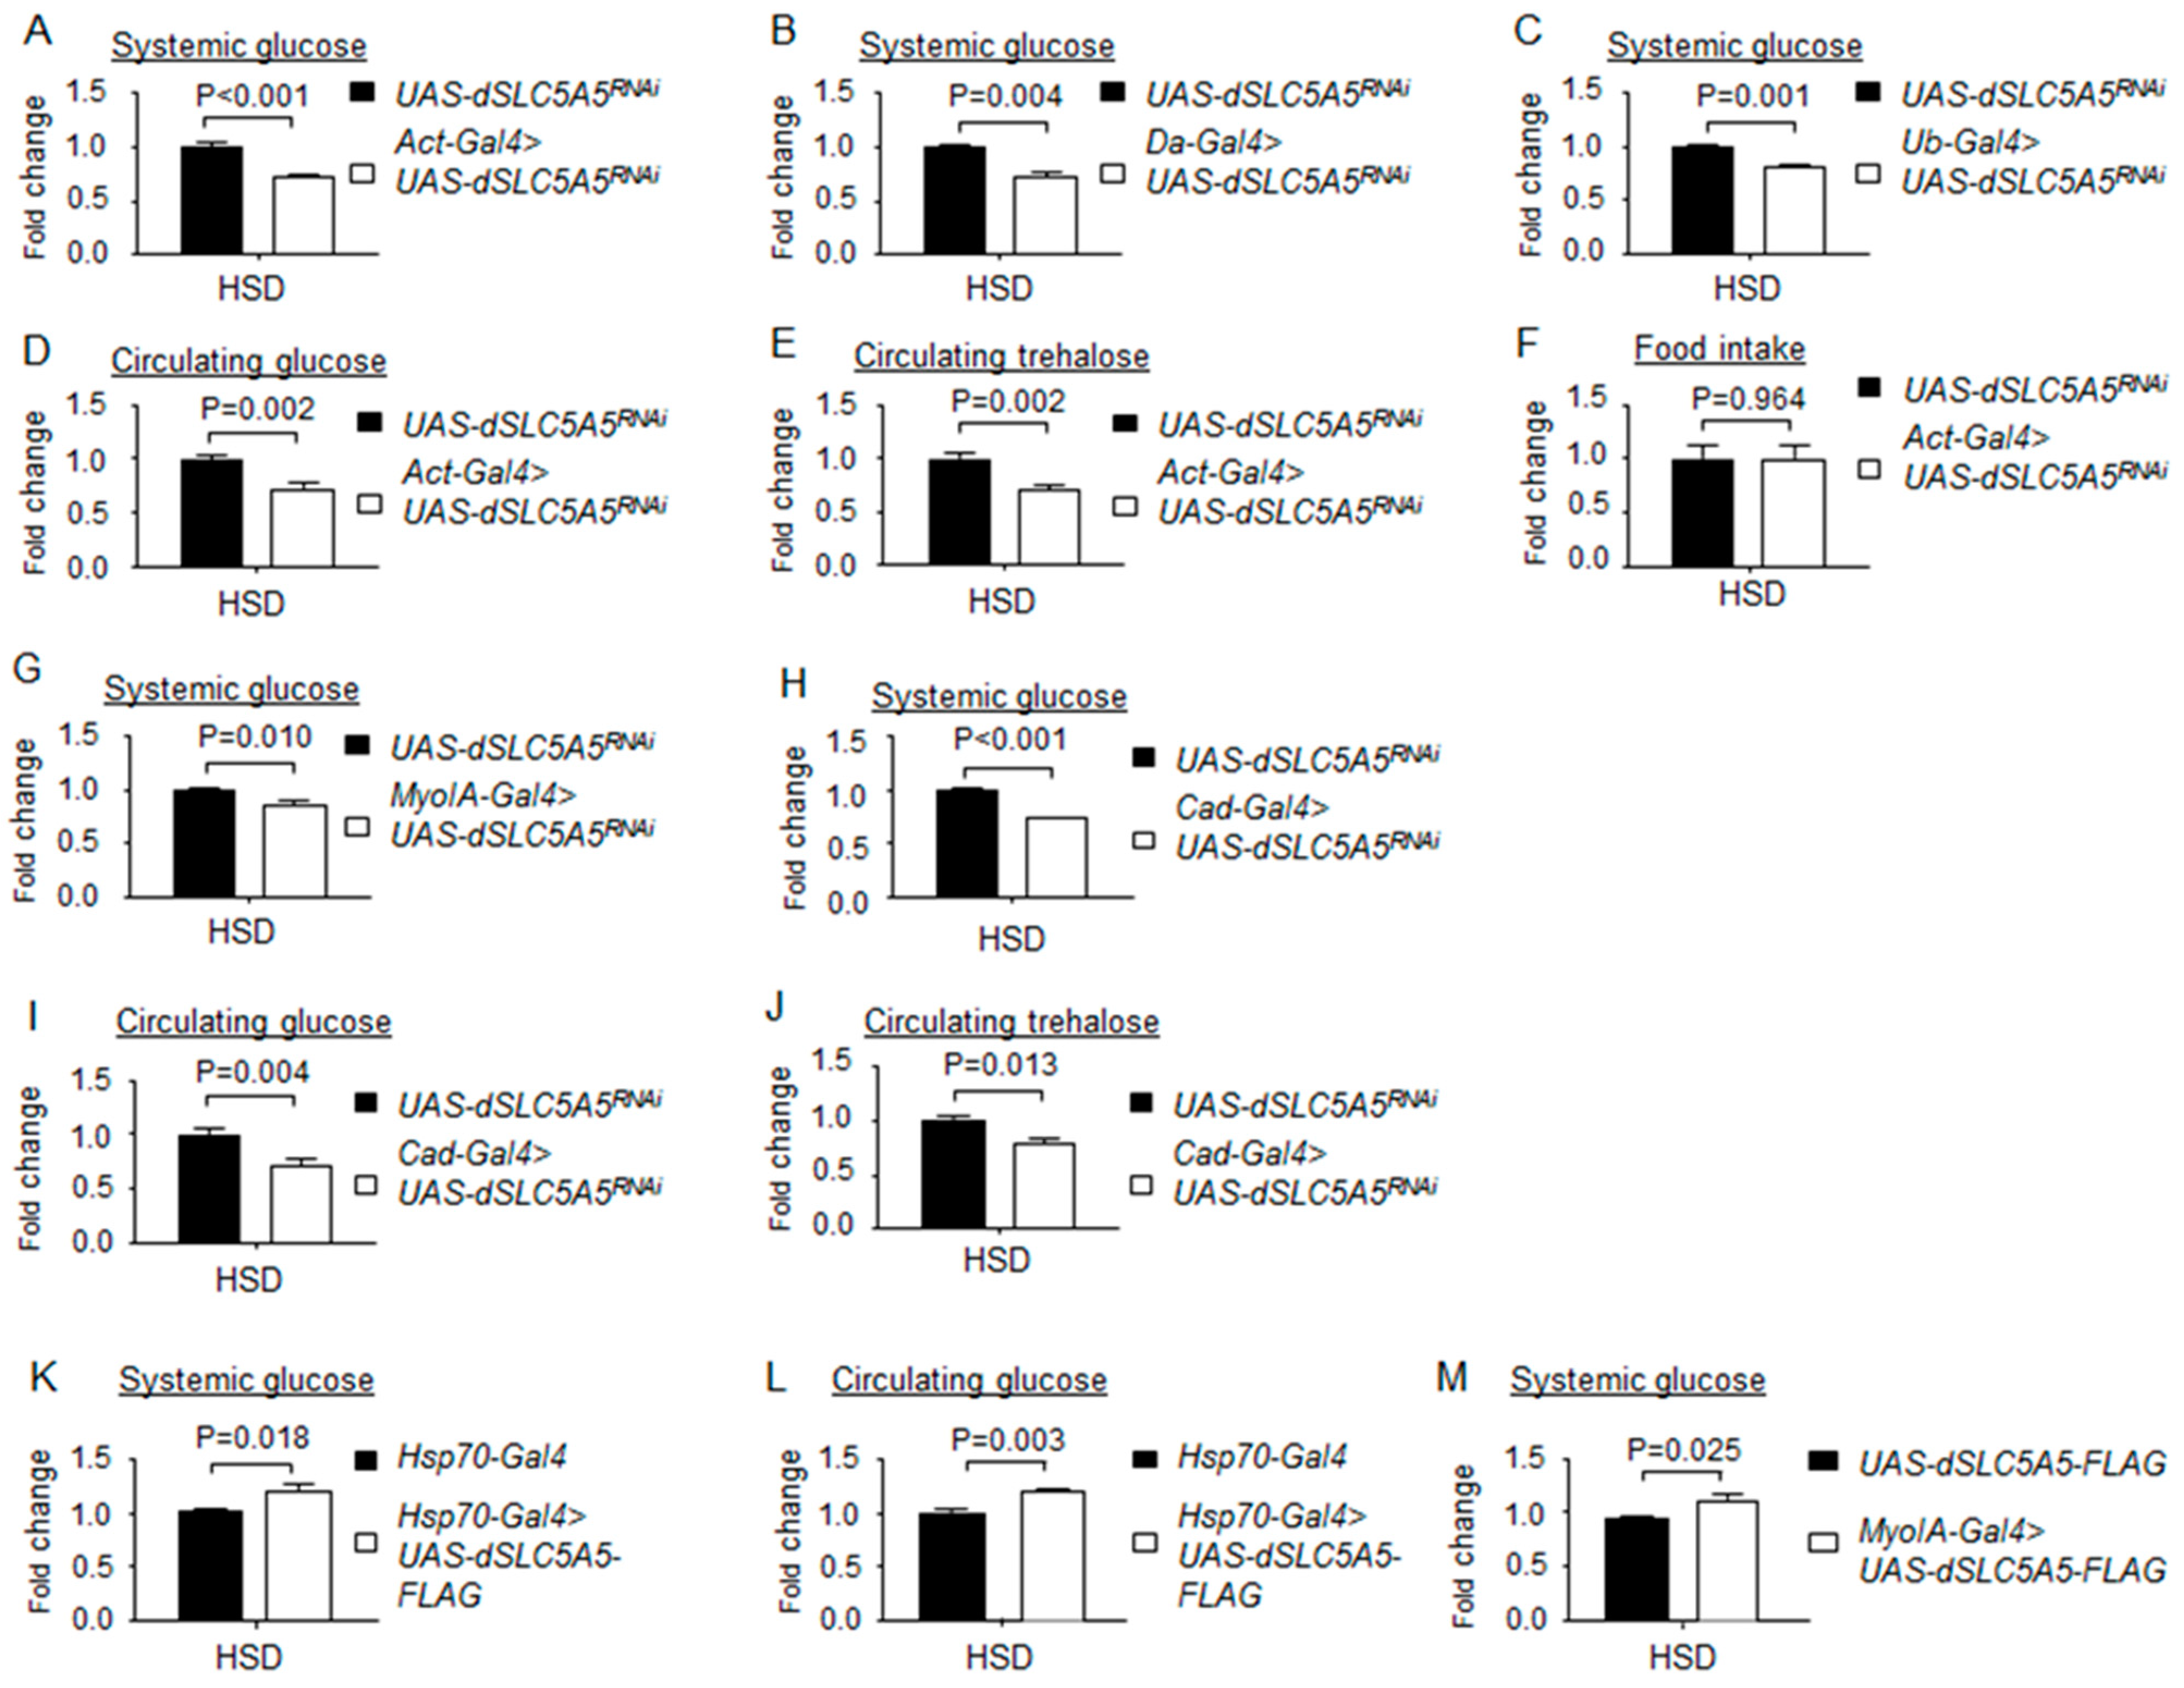
Figure 7.
Loss- or gain-of-function of dSLC5A5 alters systemic glucose metabolism on a high-sugar diet (HSD). (A–C) Systemic glucose levels in control flies (UAS-dSLC5A5RNAi) or in flies bearing the whole-body KD of dSLC5A5 using different ubiquitous drivers, Act-Gal4 (A), Da-Gal4 (B), or Ub-Gal4 (C). (D,E) Circulating levels of glucose (D) and trehalose (E) in control flies or in flies with the whole-body KD of dSLC5A5 mediated by Act-Gal4 (Act-Gal4 > dSLC5A5RNAi). (F) Food consumption in control flies or in flies with the whole-body KD of dSLC5A5 mediated by Act-Gal4 (Act-Gal4 > dSLC5A5RNAi). (G,H) Systemic glucose levels in control flies or in midgut-specific dSLC5A5-KD flies mediated by MyoIA-Gal4 (G) or Cad-Gal4 (H) on an HSD. (I,J) Circulating glucose levels (I) or circulating trehalose levels (J) in control flies or in midgut-specific dSLC5A5-KD flies mediated by Cad-Gal4. (K–M) Systemic glucose levels (K), circulating glucose levels (L), or systemic glucose levels (M) in control flies (Hsp70-Gal4) or dSLC5A5-FLAG-overexpressing flies (Hsp70-Gal4 > dSLC5A5-FLAG) flies. In all cases, systemic glucose levels (μg/μL) were normalized to whole-body protein (μg/μL). Results are the mean ± SEM of 30–40 flies analyzed over at least five independent experiments and are expressed as the fold change compared with that of the control flies (set at 1.0). Student’s t-test was used to derive p-values between the driver control and KD flies. HSD, high-sugar diet.

Figure 8.
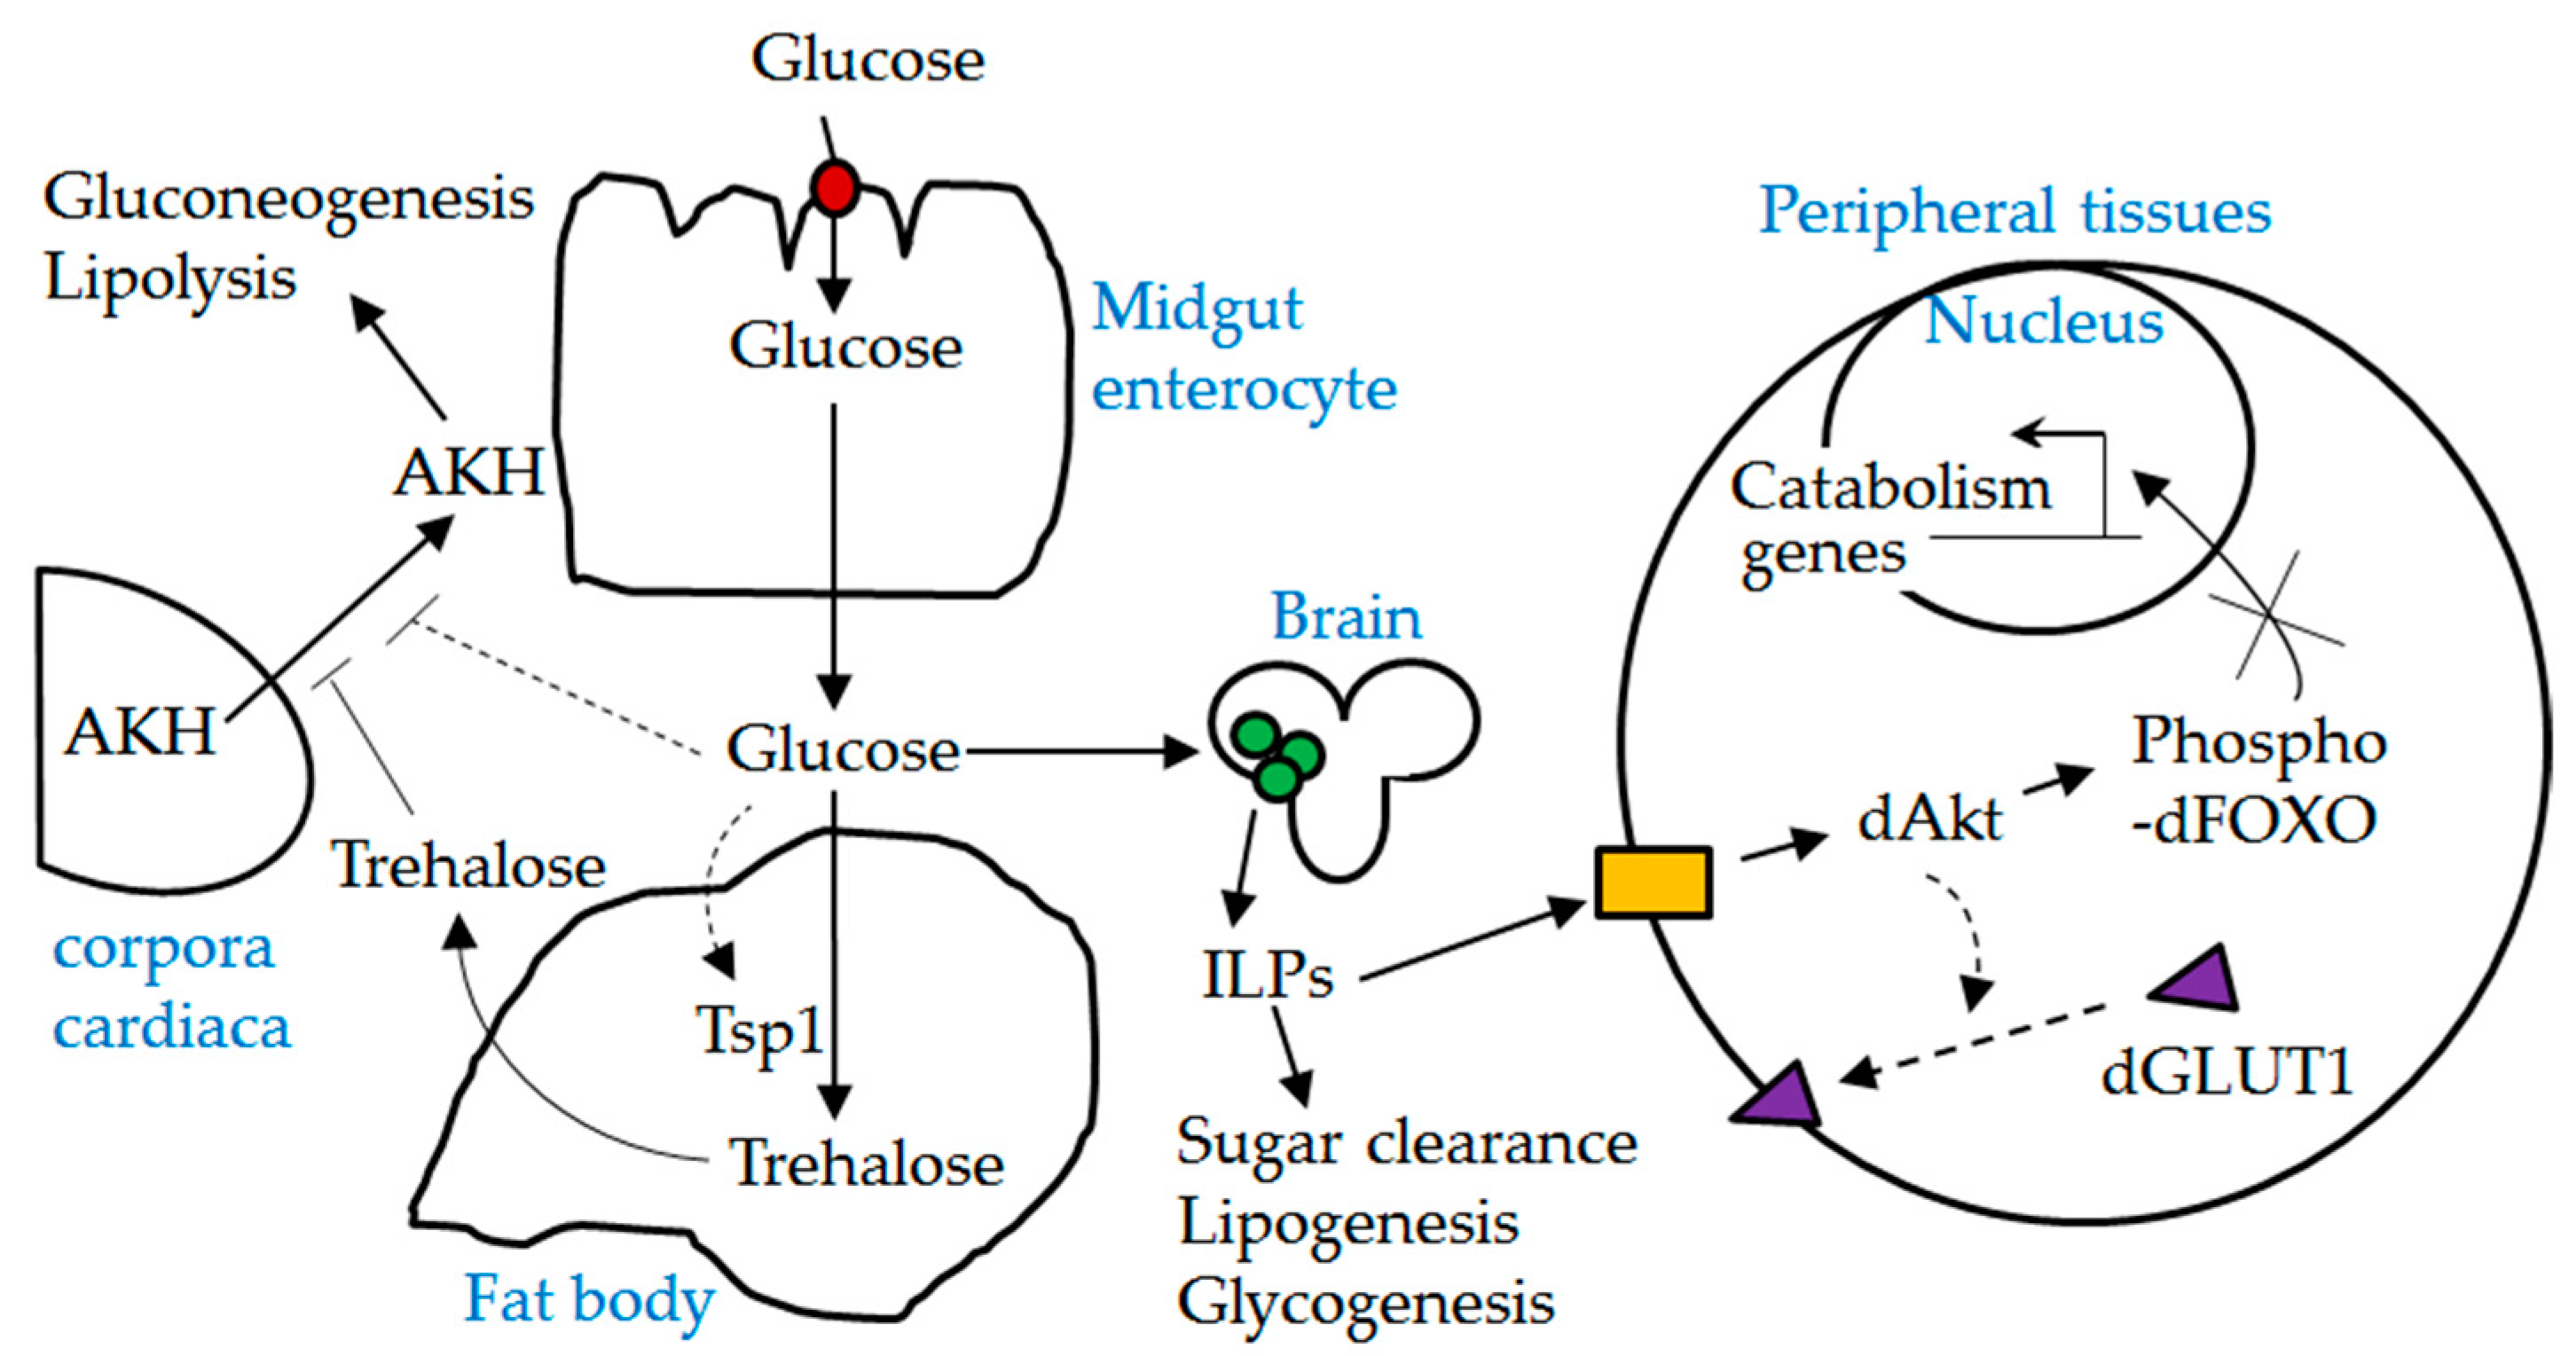
A schematic diagram depicting the interplay between dSLC5A5 and other players involved in glucose homeostasis. Red solid circle, dSLC5A5; green solid circles, insulin producing cells (IPCs); ILPs, insulin-like peptides; yellow solid box, Drosophila insulin-like receptor (dInR); AKH, adipokinetic hormone. Dotted lines indicate possible mechanisms. dSLC5A5-mediated uptake of glucose in the midgut into the circulation is expected to stimulate the release of ILPs from the IPCs while suppressing the secretion of AKH from the corpora cardiaca. Upon their release, ILPs act through the dInR to elicit the phosphorylation of dFOXO, which leads to the cytoplasmic retention and inactivation of dFOXO. It is also possible that activation of dInR signaling promotes the plasma membrane localization of dGLUT1.
Figure 8.
A schematic diagram depicting the interplay between dSLC5A5 and other players involved in glucose homeostasis. Red solid circle, dSLC5A5; green solid circles, insulin producing cells (IPCs); ILPs, insulin-like peptides; yellow solid box, Drosophila insulin-like receptor (dInR); AKH, adipokinetic hormone. Dotted lines indicate possible mechanisms. dSLC5A5-mediated uptake of glucose in the midgut into the circulation is expected to stimulate the release of ILPs from the IPCs while suppressing the secretion of AKH from the corpora cardiaca. Upon their release, ILPs act through the dInR to elicit the phosphorylation of dFOXO, which leads to the cytoplasmic retention and inactivation of dFOXO. It is also possible that activation of dInR signaling promotes the plasma membrane localization of dGLUT1.


