
Nectar Chemistry or Flower Morphology—What Is More Important for the Reproductive Success of Generalist Orchid Epipactis palustris in Natural and Anthropogenic Populations?


Abstract
:1. Introduction
2. Results
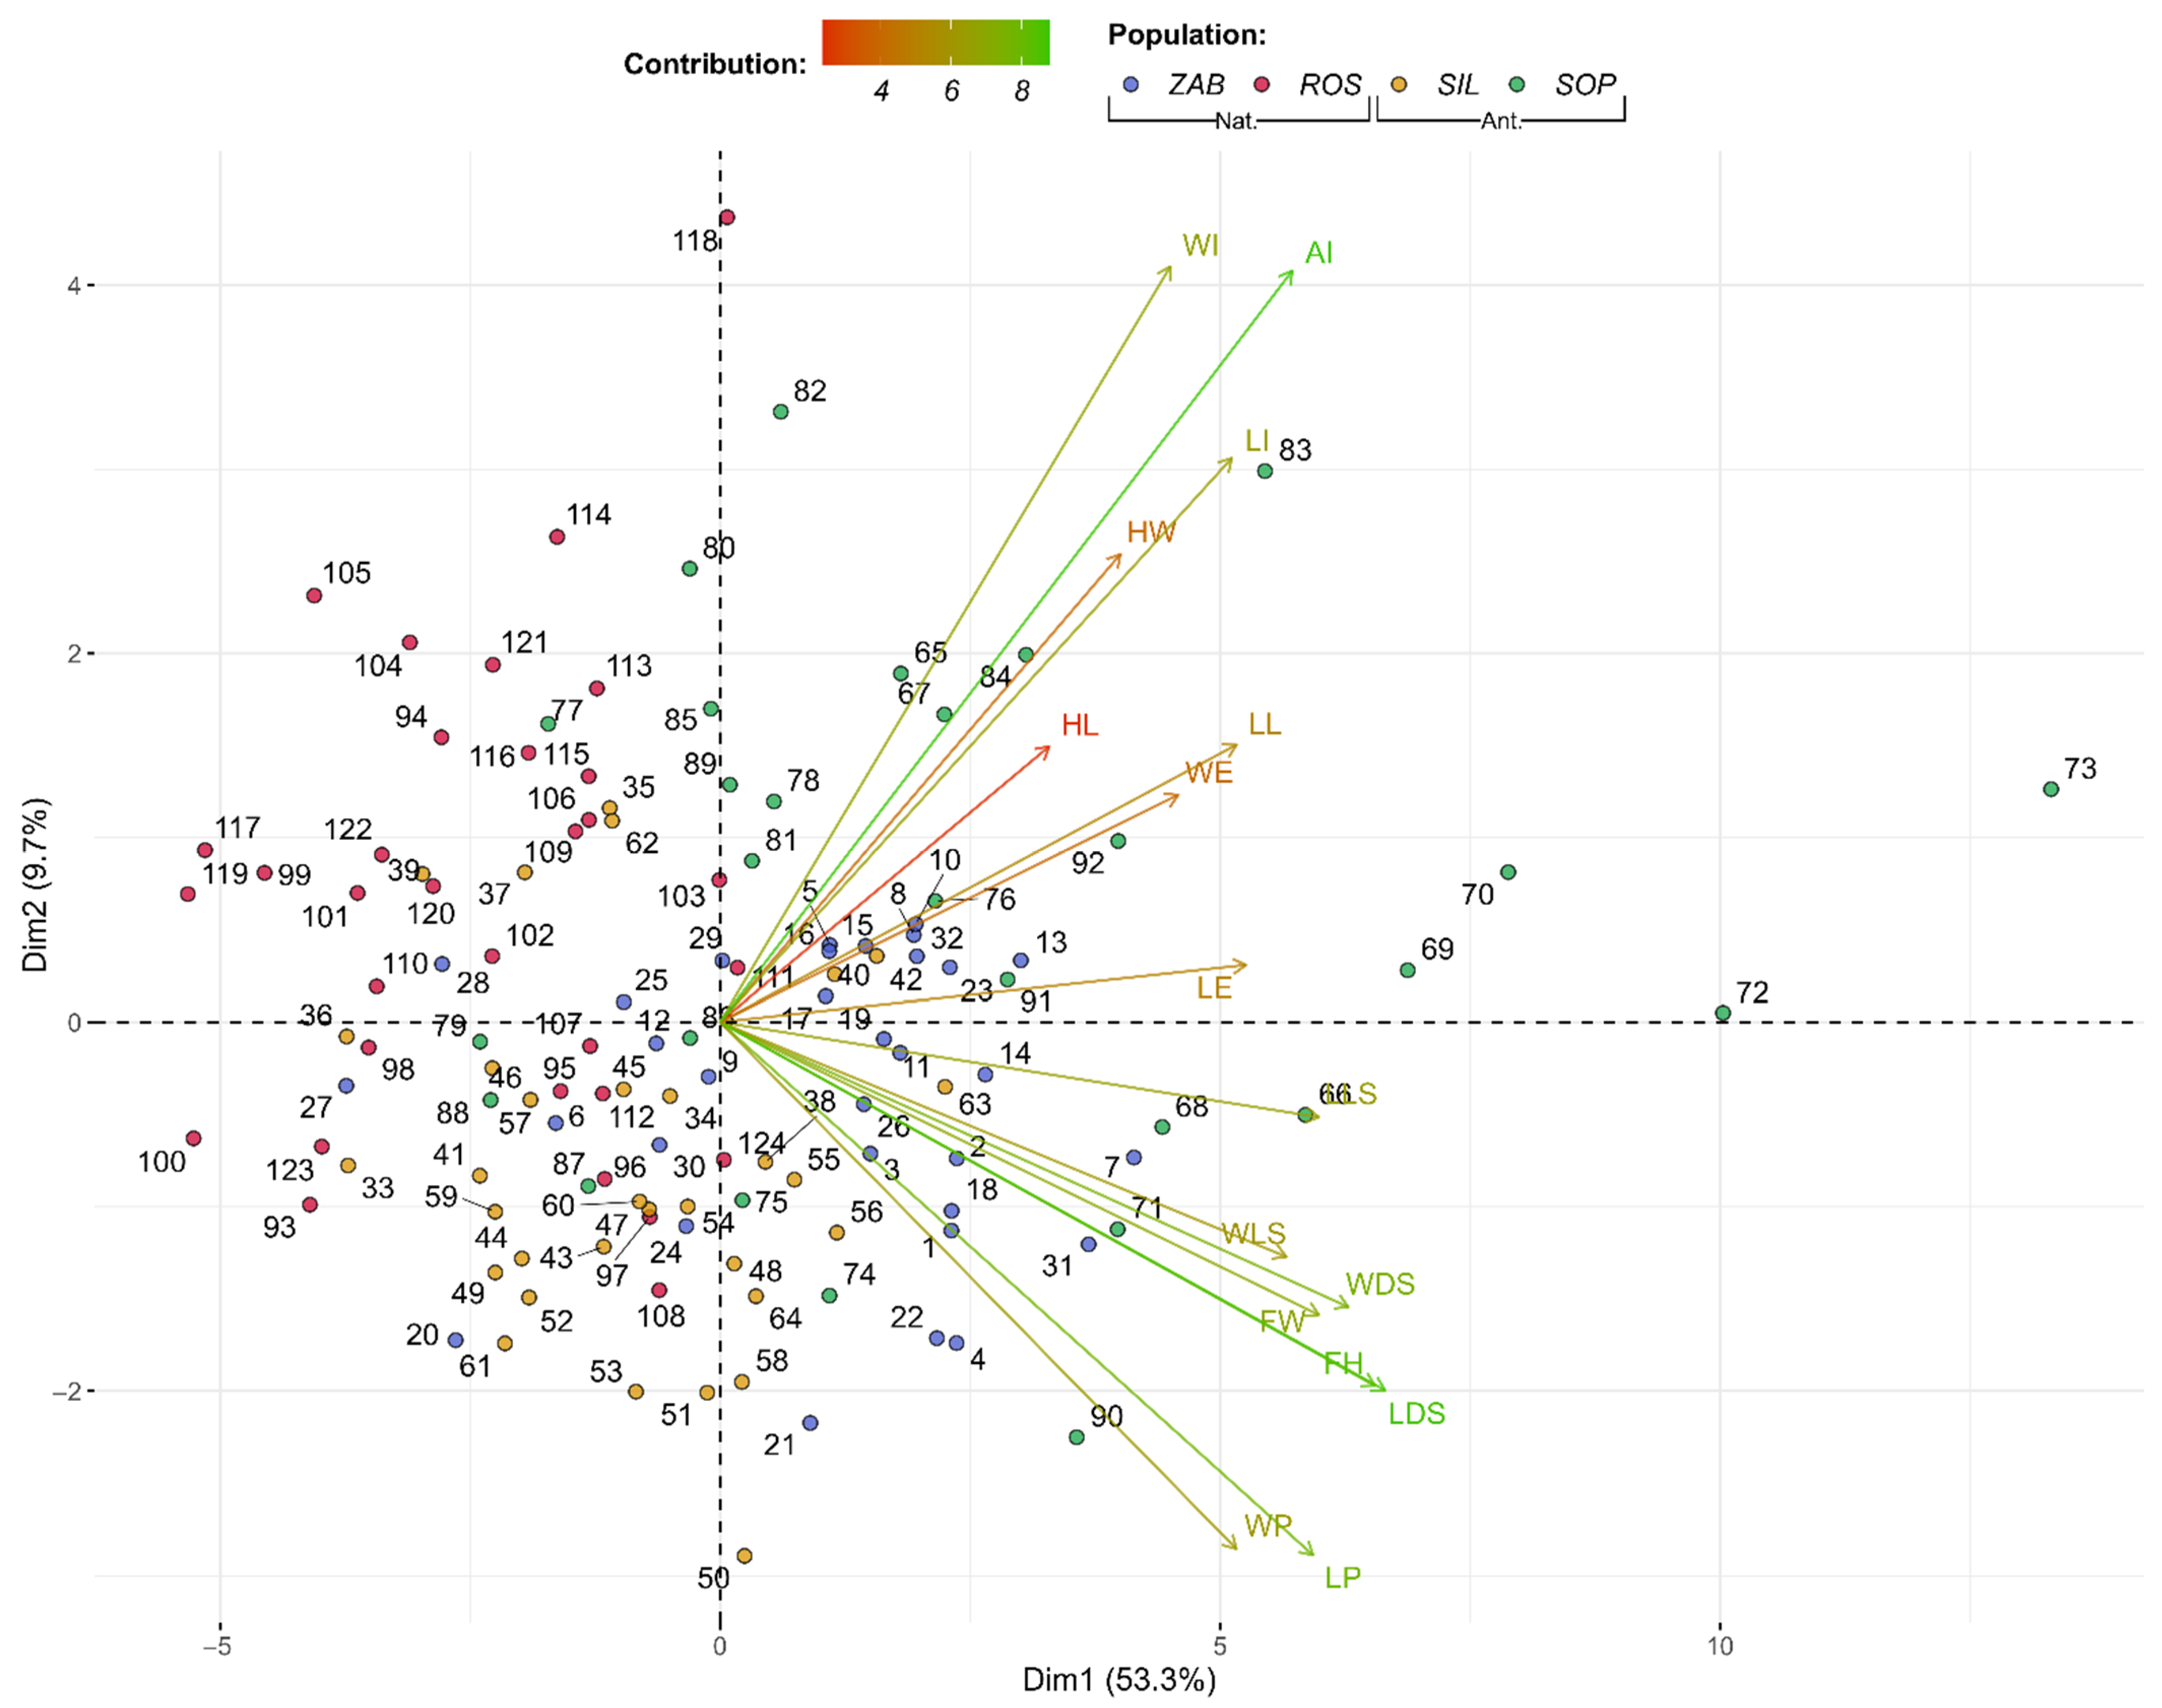
2.1. Floral Display and Flower Structure
2.2. Nectar Chemistry
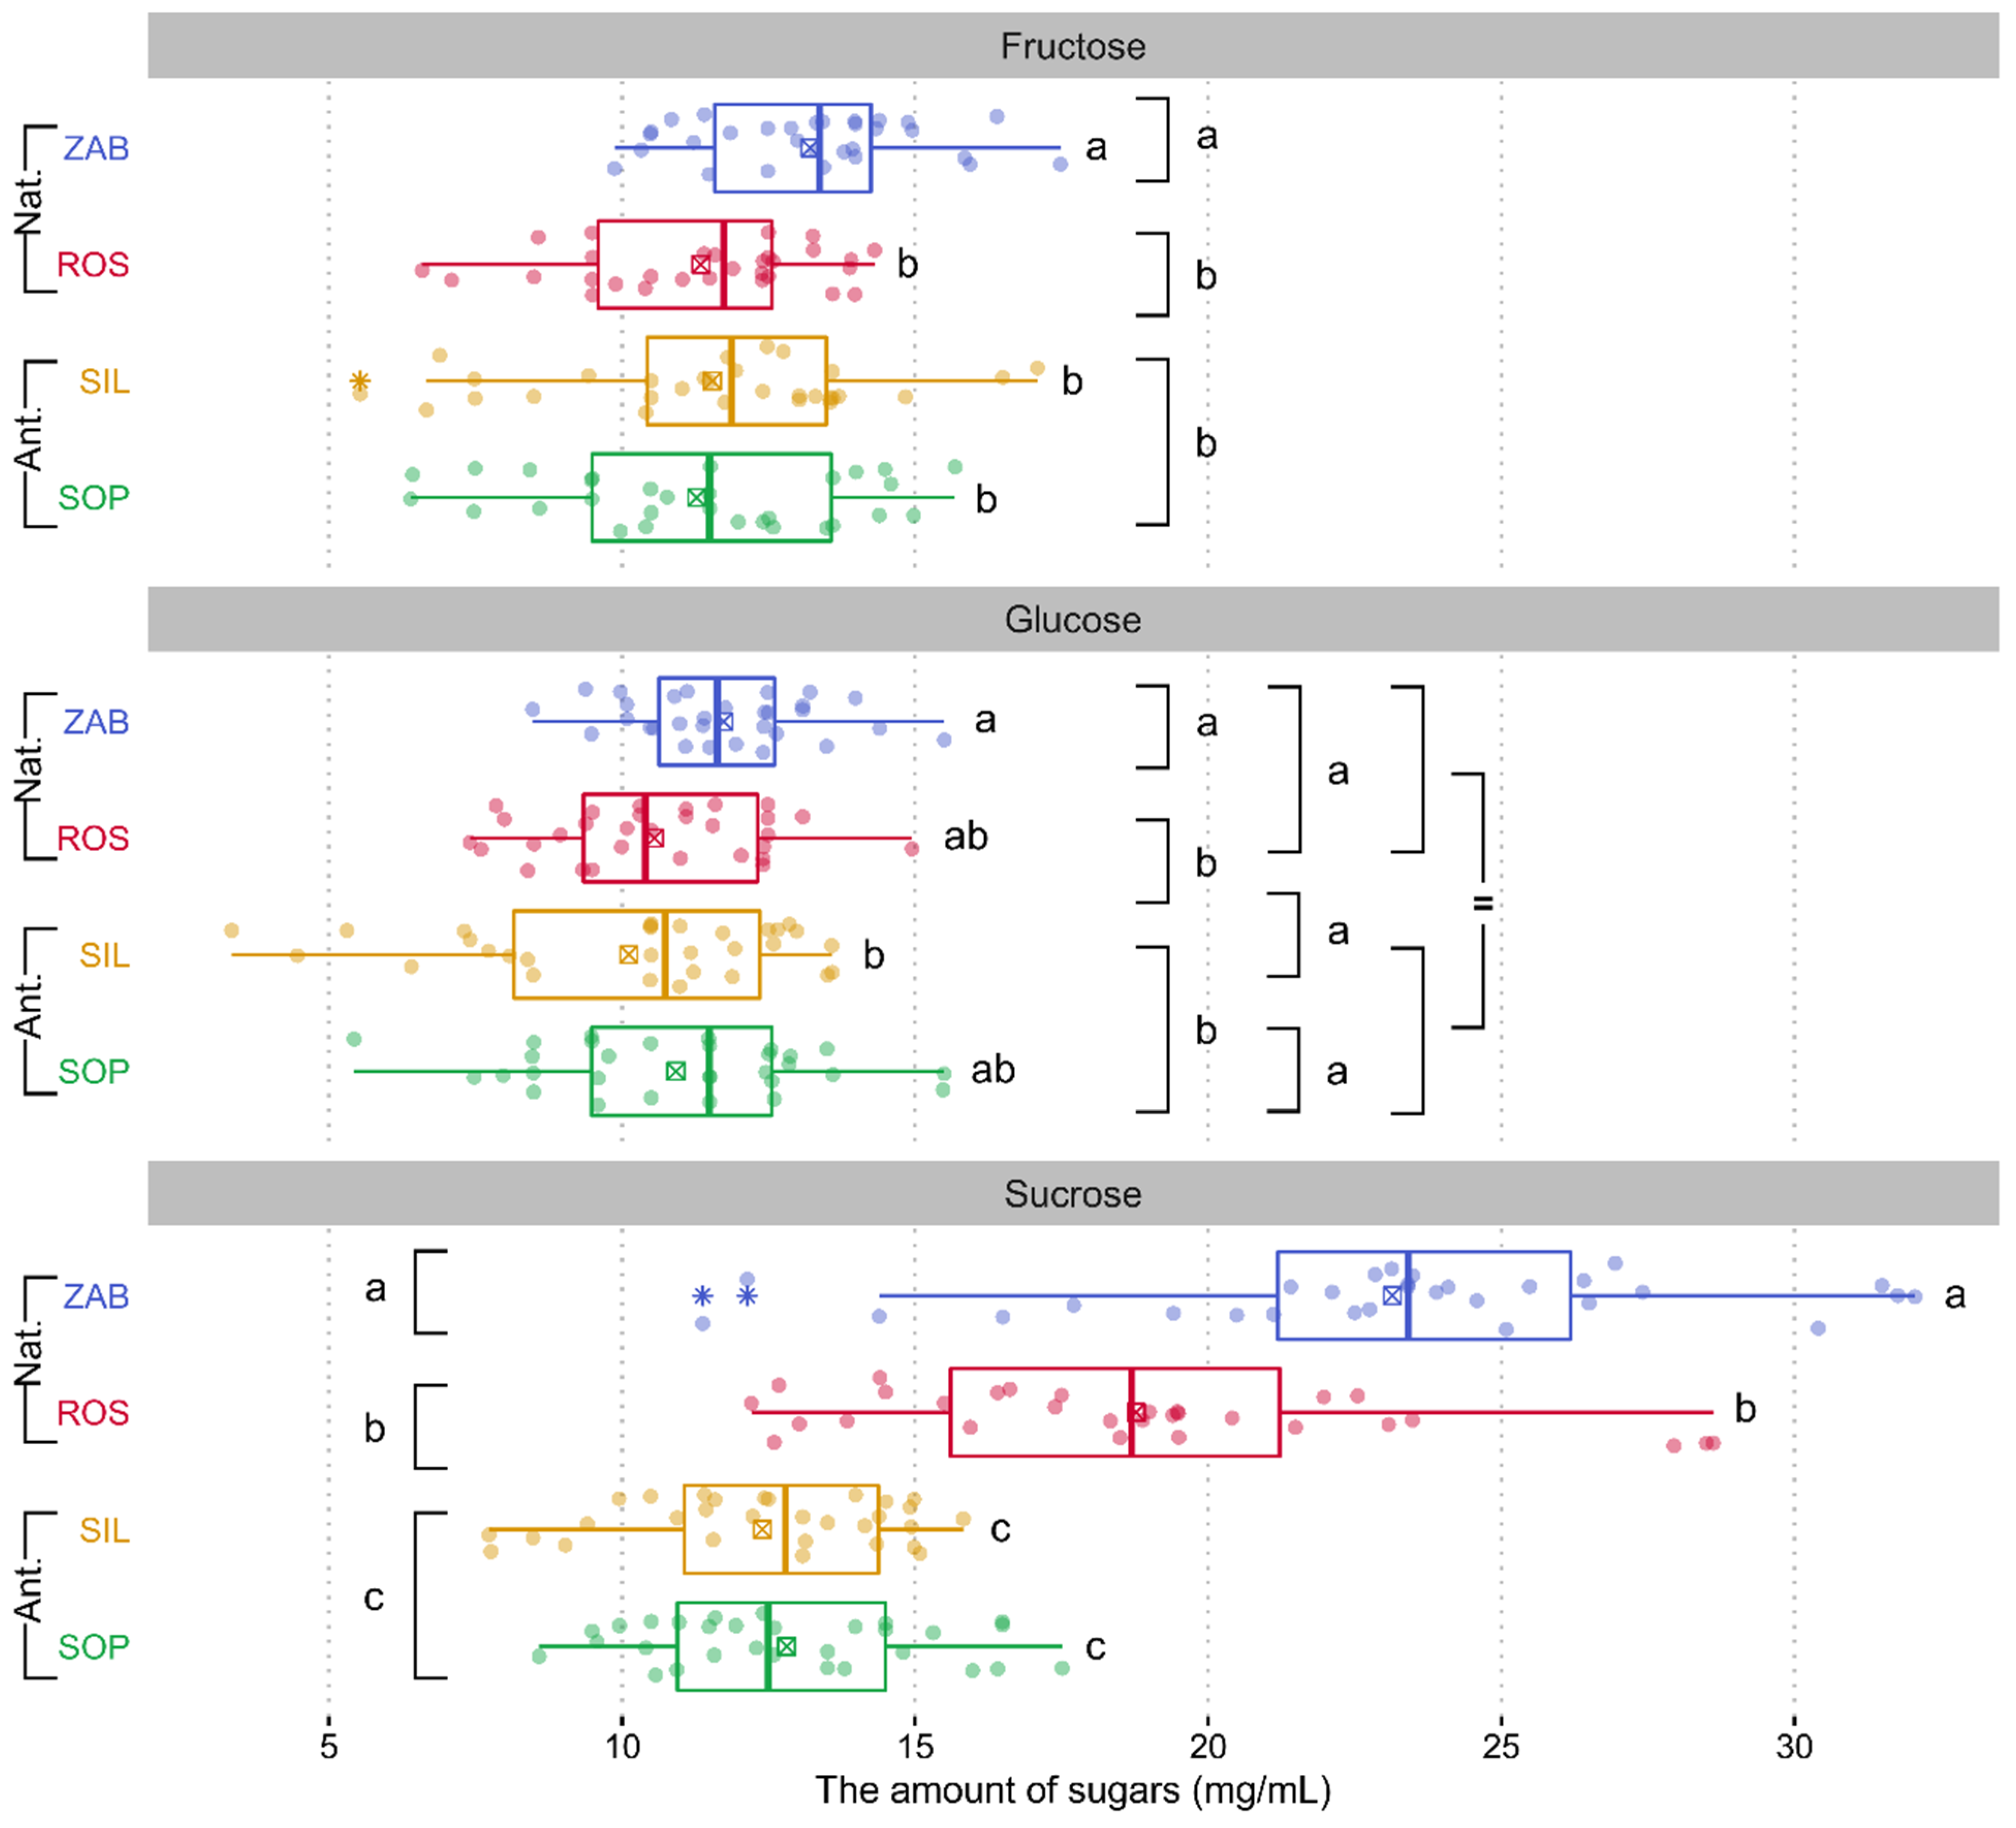
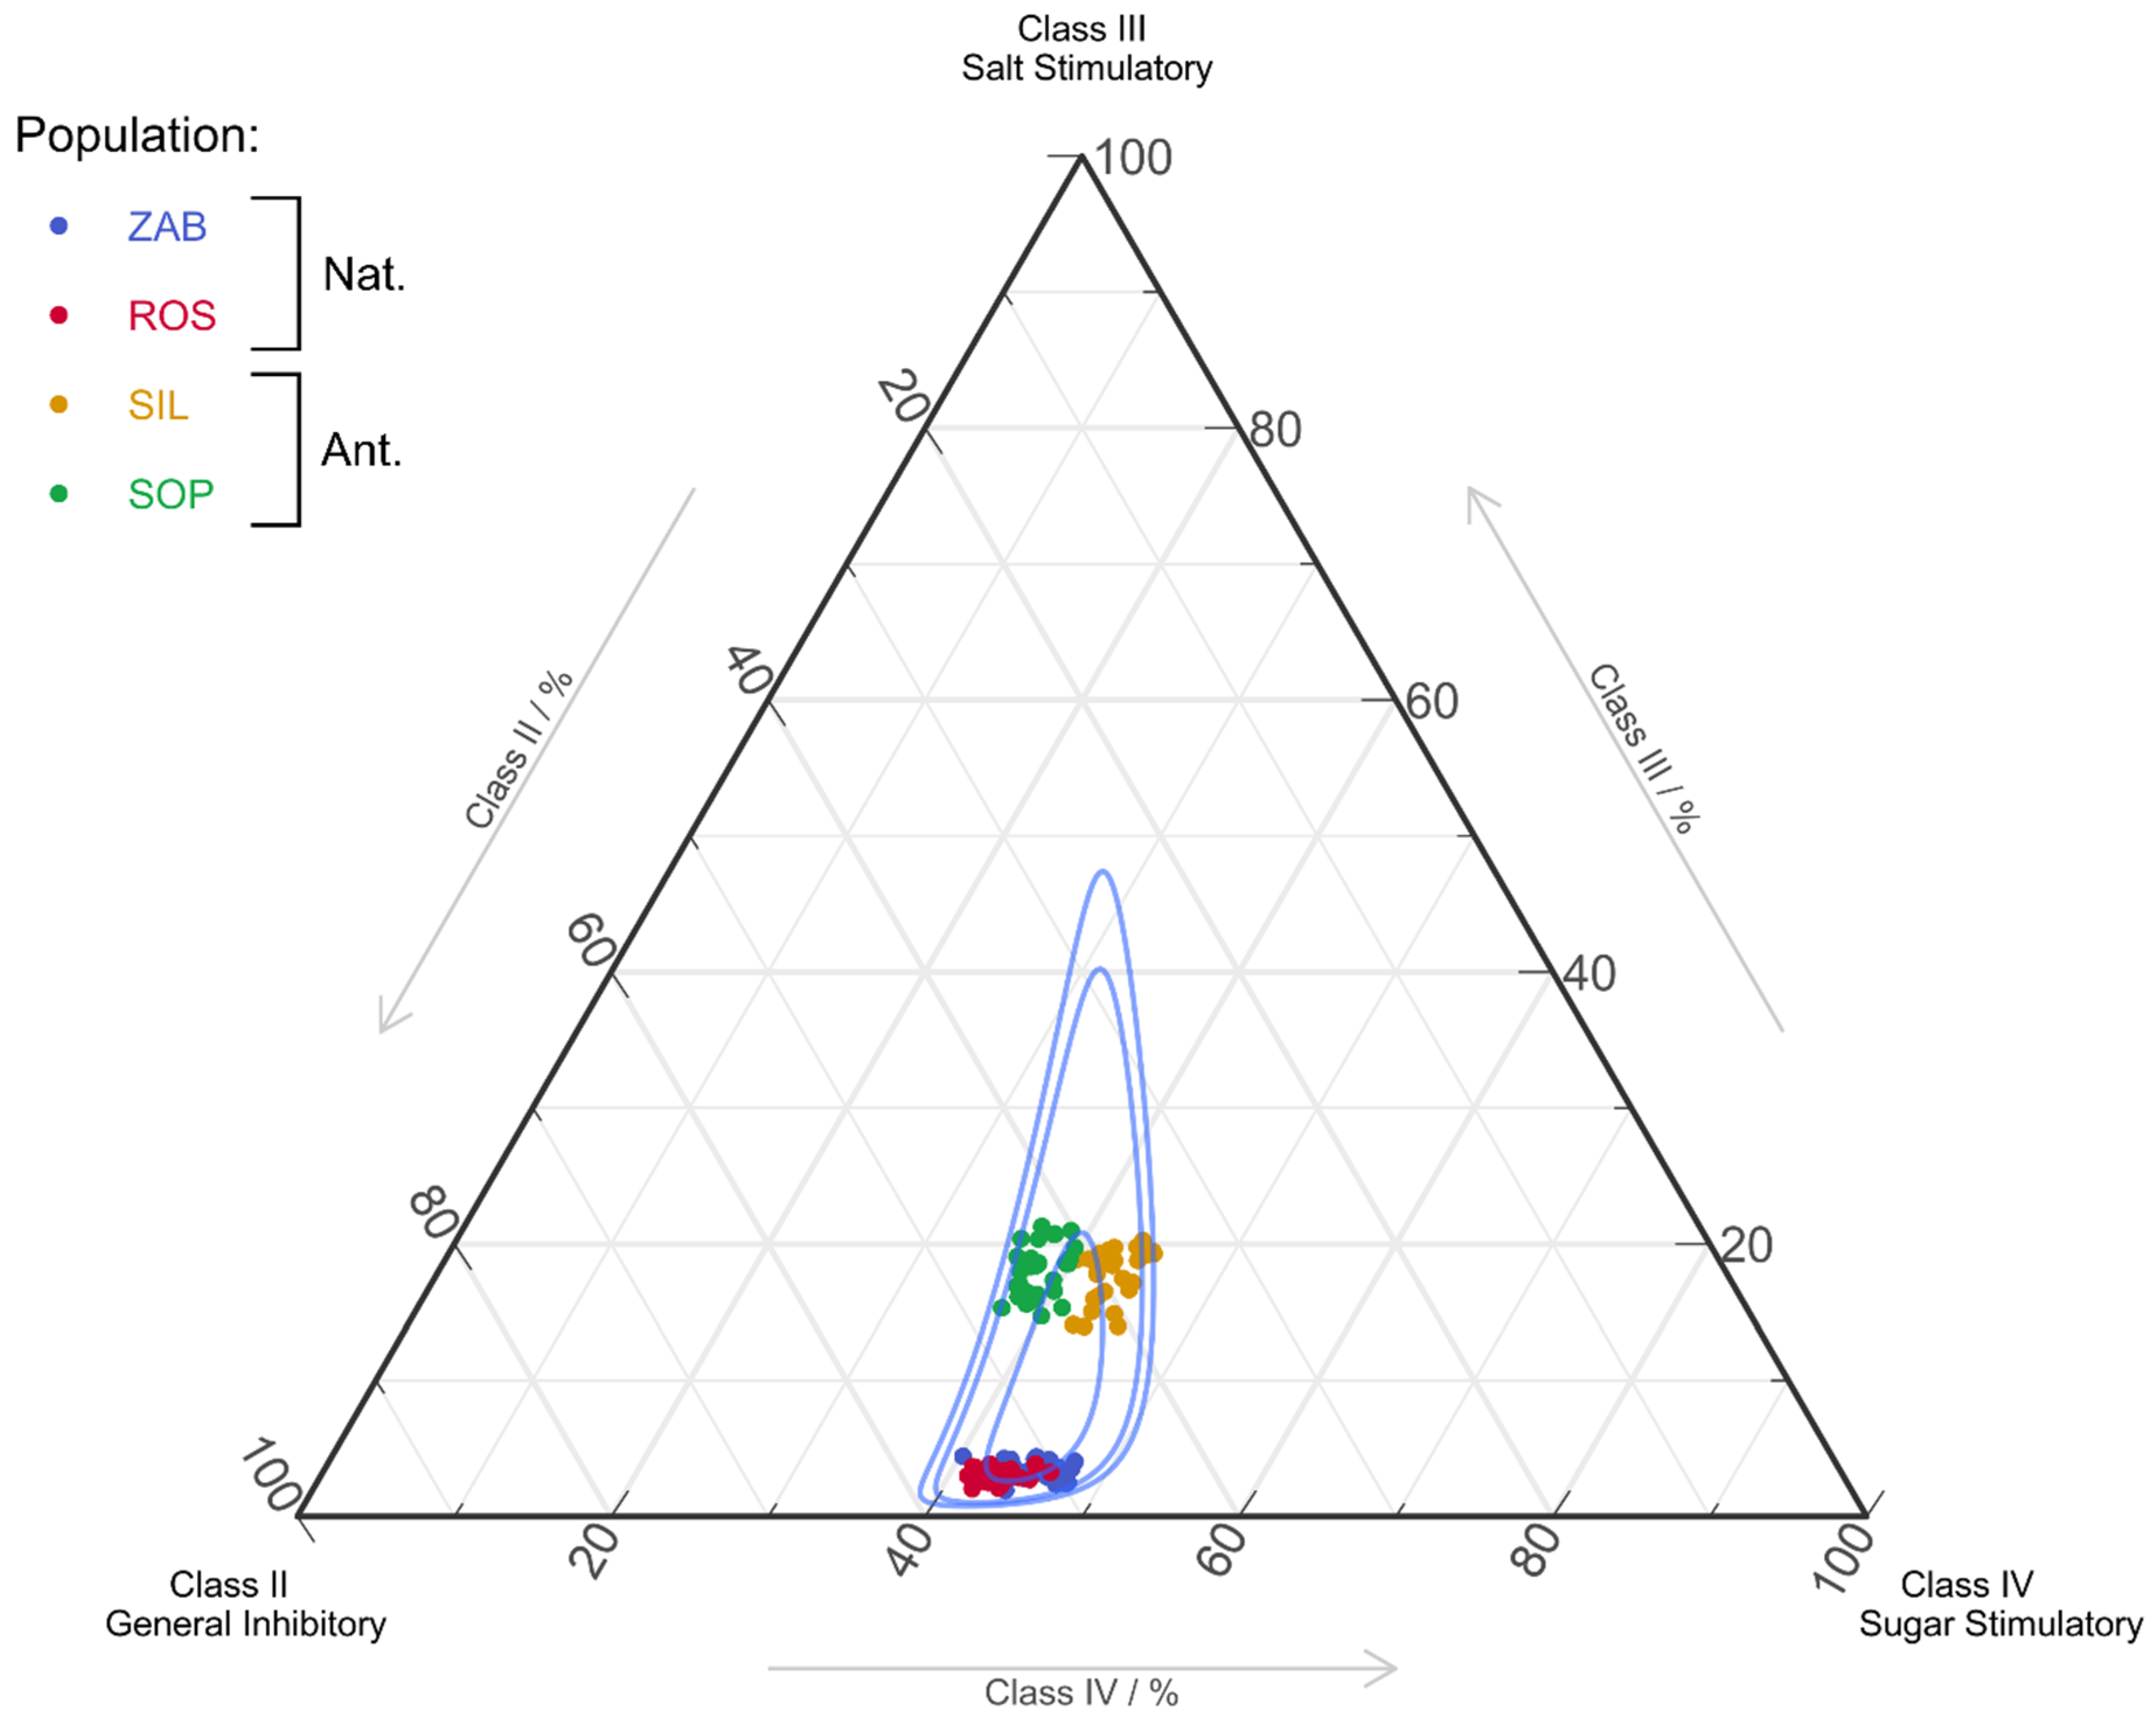
2.2.1. Sugars
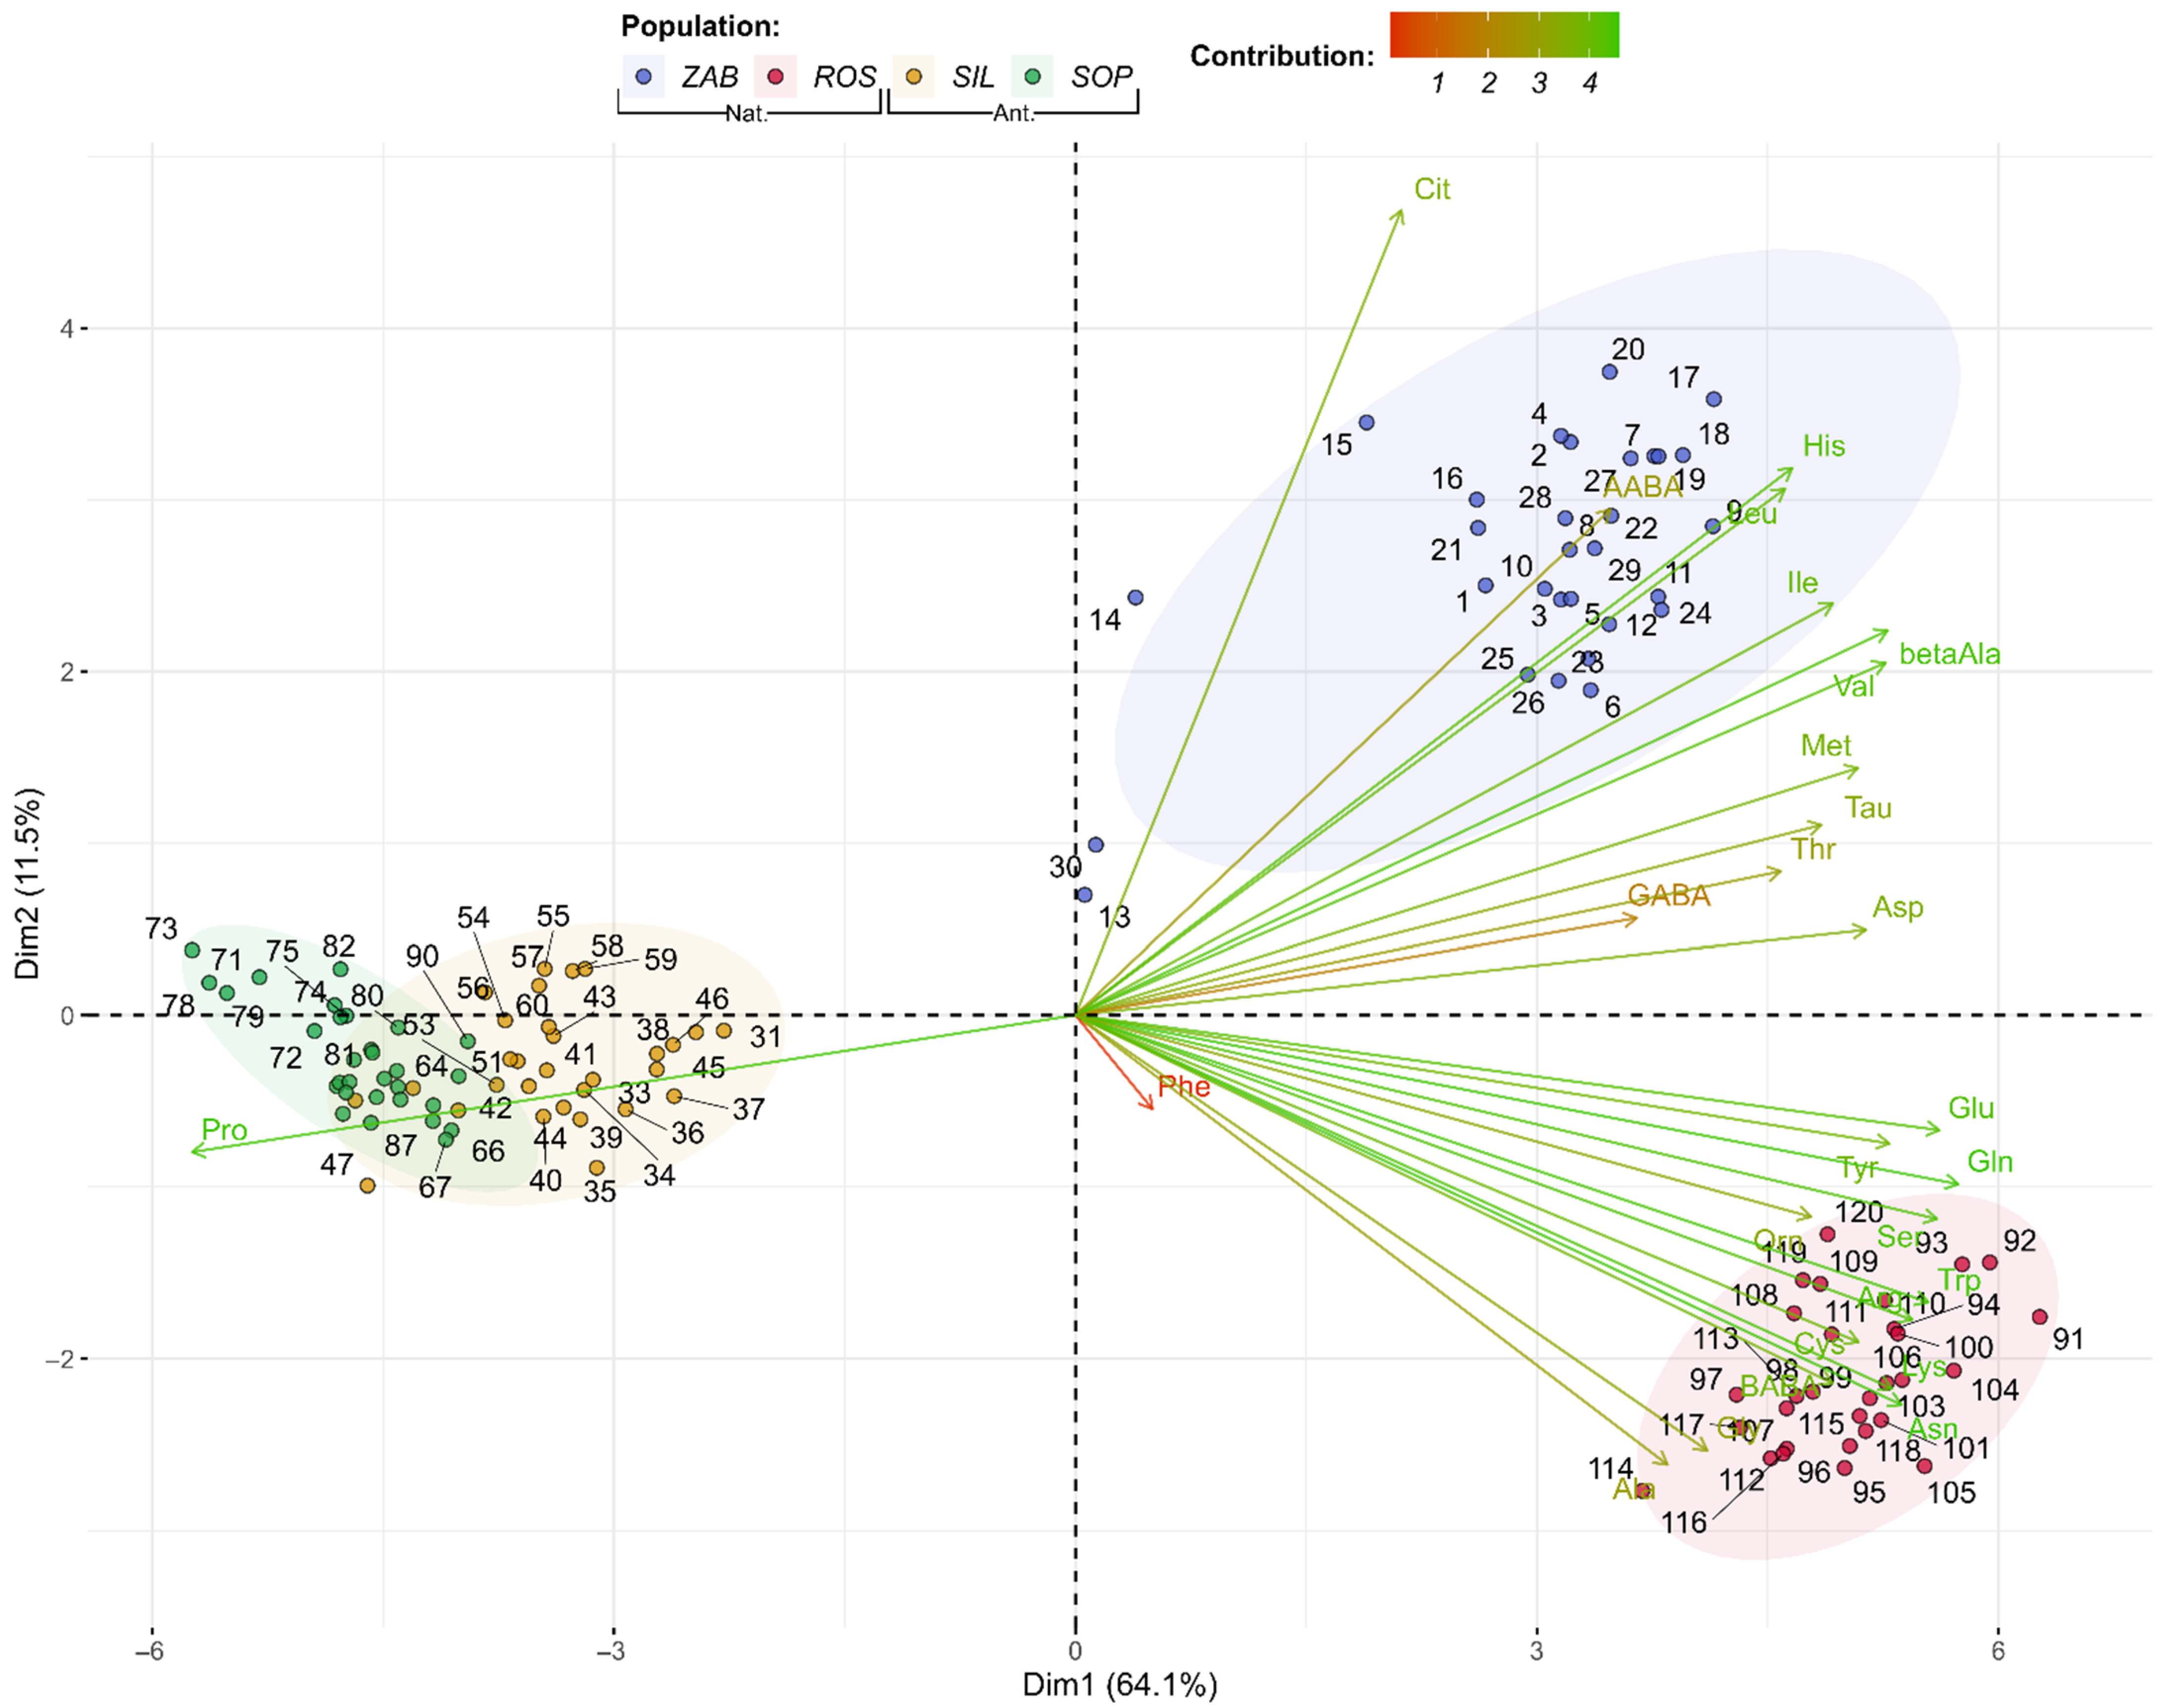
2.2.2. Amino Acids
2.3. Reproductive Success
3. Discussion
4. Materials and Methods
4.1. Study Species
4.2. Study Area
4.3. Fieldwork and Floral Trait Measurements
4.4. Nectar Analysis
4.4.1. Nectar Isolation
4.4.2. Sugar and Amino Acid Determination
4.5. Statistical Analysis
Supplementary Materials
Author Contributions
Funding
Informed Consent Statement
Data Availability Statement
Acknowledgments
Conflicts of Interest
References
- Joffard, N.; Massol, F.; Grenié, M.; Montgelard, C.; Schatz, B. Effect of pollination strategy, phylogeny and distribution on pollination niches of Euro-Mediterranean orchids. J. Ecol. 2019, 107, 478–490. [Google Scholar] [CrossRef] [Green Version]
- Ollerton, J.; Winfree, R.; Tarrant, S. How many flowering plants are pollinated by animals? Oikos 2011, 120, 321–326. [Google Scholar] [CrossRef]
- Phillips, R.D.; Reiter, N.; Peakall, R. Orchid conservation: From theory to practice. Ann. Bot. 2020, 126, 345–362. [Google Scholar] [CrossRef] [PubMed]
- Tremblay, R.L. Trends in the pollination ecology of the Orchidaceae: Evolution and systematics. Can. J. Bot. 1992, 70, 642–650. [Google Scholar] [CrossRef]
- Claessens, J.; Kleynen, J. The Flower of the European Orchid. Form and Function; Claessens & Kleynen: Guelle, The Netherlands, 2011; p. 440. [Google Scholar]
- Nilsson, L.A. Pollination ecology of Epipactis palustris (L.) Crantz (Orchidaceae). Bot. Not. 1978, 131, 355–368. [Google Scholar]
- Ackerman, J.D. Mechanisms and evolution of food-deceptive pollination systems in orchids. Lindleyana 1986, 1, 108–113. [Google Scholar]
- Cozzolino, S.; Widmer, A. Orchid diversity: An evolutionary consequence of deception? Trends Ecol. Evol. 2005, 20, 487–494. [Google Scholar] [CrossRef] [PubMed]
- Jersáková, J.; Johnson, S.D.; Kindlmann, P. Mechanisms and evolution of deceptive pollination in orchids. Biol. Rev. 2006, 81, 219–235. [Google Scholar] [CrossRef]
- Renner, S.S. Rewardless flowers in the angiosperms and the role of insect cognition in their evolution. In Plant-Pollinator Interactions: From Specialization to generalization; Waser, N.M., Ollerton, J., Eds.; The University of Chicago Press: Chicago, IL, USA, 2006; pp. 123–144. [Google Scholar]
- Tremblay, R.L.; Ackerman, J.D.; Zimmerman, J.K.; Calvo, R.N. Variation in sexual reproduction in orchids and its evolutionary consequences: A spasmodic journey to diversification. Biol. J. Linn. Soc. 2005, 84, 1–54. [Google Scholar] [CrossRef]
- Dressler, R. The Orchids: Natural History and Classification; Harvard University Press: Cambridge, MA, USA, 1981; p. 356. [Google Scholar] [CrossRef]
- Neiland, M.R.M.; Wilcock, C.C. Fruit set, nectar reward, and rarity in the Orchidaceae. Am. J. Bot. 1998, 85, 1657–1671. [Google Scholar] [CrossRef] [PubMed]
- Jersáková, J.; Johnson, S.D.; Kindlmann, P.; Pupin, A.C. Effect of nectar supplementation on male and female components of pollination success in the deceptive orchid Dactylorhiza sambucina. Acta Oecol. 2008, 33, 300–306. [Google Scholar] [CrossRef]
- Brzosko, E.; Bajguz, A. Nectar composition in moth-pollinated Platanthera bifolia and P. chlorantha and its importance for reproductive success. Planta 2019, 250, 263–279. [Google Scholar] [CrossRef] [PubMed] [Green Version]
- Gijbels, P.; Ceulemans, T.; Van den Ende, W.; Honnay, O. Experimental fertilization increases amino acid content in floral nectar, fruit set and degree of selfing in the orchid Gymnadenia conopsea. Oecologia 2015, 179, 785–795. [Google Scholar] [CrossRef]
- Gijbels, P.; Van den Ende, W.; Honnay, O. Landscape scale variation in nectar amino acid and sugar composition in a Lepidoptera pollinated orchid species and its relation with fruit set. J. Ecol. 2014, 102, 136–144. [Google Scholar] [CrossRef]
- Gijbels, P.; Van den Ende, W.; Honnay, O. Phenotypic selection on nectar amino acid composition in the Lepidoptera pollinated orchid species Gymnadenia conopsea. Oikos 2015, 124, 421–427. [Google Scholar] [CrossRef]
- Brzosko, E.; Bajguz, A.; Chmur, M.; Burzyńska, J.; Jermakowicz, E.; Mirski, P.; Zieliński, P. How are the flower structure and nectar composition of the generalistic orchid Neottia ovata adapted to a wide range of pollinators? Int. J. Mol. Sci. 2021, 22, 2214. [Google Scholar] [CrossRef] [PubMed]
- Jeffrey, D.C.; Arditti, J.; Koopowitz, H. Sugar content in floral and extrafloral exudates of orchids: Pollination, myrmecology and chemotaxonomy implication. New Phytol. 1970, 69, 187–195. [Google Scholar] [CrossRef] [Green Version]
- Percival, M.S. Types of nectar in angiosperms. New Phytol. 1961, 60, 235–281. [Google Scholar] [CrossRef]
- Baker, H.G.; Baker, I. Floral nectar sugar constituents in relation to pollinator type. In Handbook of Experimental Pollination Biology; Jones, C.E., Little, R.J., Eds.; Van Nostrand Reinhold Company Inc.: New York, NY, USA, 1983; pp. 131–141. [Google Scholar]
- Baker, H.G.; Baker, I. The predictive value of nectar chemistry to the recognition of pollinator types. Isr. J. Bot. 1990, 39, 157–166. [Google Scholar] [CrossRef]
- Nicolson, S.W.; Thornburg, R.W. Nectar chemistry. In Nectaries and Nectar; Nicolson, S.W., Nepi, M., Pacini, E., Eds.; Springer: Dordrecht, The Netherlands, 2007; pp. 215–264. [Google Scholar] [CrossRef]
- Petanidou, T. Sugars in Mediterranean floral nectars: An ecological and evolutionary approach. J. Chem. Ecol. 2005, 31, 1065–1088. [Google Scholar] [CrossRef]
- Willmer, P. Pollination by butterflies and moths. In Pollination and Floral Ecology; Willmer, P., Ed.; Princeton University Press: Princeton, NJ, USA, 2011; pp. 322–336. [Google Scholar] [CrossRef]
- Adler, L.S. The ecological significance of toxic nectar. Oikos 2000, 91, 409–420. [Google Scholar] [CrossRef]
- Gardener, M.C.; Gillman, M.P. The taste of nectar—A neglected area of pollination ecology. Oikos 2002, 98, 552–557. [Google Scholar] [CrossRef]
- Heil, M. Postsecretory hydrolysis of nectar sucrose and specialization in ant/plant mutualism. Science 2005, 308, 560–563. [Google Scholar] [CrossRef] [PubMed] [Green Version]
- Levin, E.; McCue, M.D.; Davidowitz, G. More than just sugar: Allocation of nectar amino acids and fatty acids in a Lepidopteran. Proc. Biol. Sci. 2017, 284, 20162126. [Google Scholar] [CrossRef] [PubMed]
- Mevi-Schütz, J.; Erhardt, A. Amino acids in nectar enhance butterfly fecundity: A long-awaited link. Am. Nat. 2005, 165, 411–419. [Google Scholar] [CrossRef] [PubMed]
- Heyneman, A.J. Optimal sugar concentrations of floral nectars—Dependence on sugar intake efficiency and foraging costs. Oecologia 1983, 60, 198–213. [Google Scholar] [CrossRef] [PubMed]
- Pyke, G.H.; Waser, N.M. The production of dilute nectars by hummingbird and honeyeater flowers. Biotropica 1981, 13, 260–270. [Google Scholar] [CrossRef]
- Brzosko, E.; Mirski, P. Floral nectar chemistry in orchids: A short review and meta-analysis. Plants 2021, 10, 2315. [Google Scholar] [CrossRef]
- Heil, M. Nectar: Generation, regulation and ecological functions. Trends Plant Sci. 2011, 16, 191–200. [Google Scholar] [CrossRef]
- Gottsberger, G.; Schrauwen, J.; Linskens, H.F. Amino acids and sugars in nectar, and their putative evolutionary significance. Plant Syst. Evol. 1984, 145, 55–77. [Google Scholar] [CrossRef]
- Pacini, E.; Nepi, M.; Vesprini, J.L. Nectar biodiversity: A short review. Plant Syst. Evol. 2003, 238, 7–21. [Google Scholar] [CrossRef]
- Pais, M.S.; Figueiredo, A.C.S. Floral nectaries from Limodorum abortivum (L.) Sw and Epipactis atropurpurea Rafin (Orchidaceae)—Ultrastructural changes in plastids during the secretory process. Apidologie 1994, 25, 615–626. [Google Scholar] [CrossRef] [Green Version]
- Vandelook, F.; Janssens, S.B.; Gijbels, P.; Fischer, E.; Van den Ende, W.; Honnay, O.; Abrahamczyk, S. Nectar traits differ between pollination syndromes in Balsaminaceae. Ann. Bot. 2019, 124, 269–279. [Google Scholar] [CrossRef] [PubMed] [Green Version]
- Pais, M.; Neves, H.; Maria, P.; Vasconcelos, A. Amino acid and sugar content of the nectar exudate from Limodorum abortivum (Orchidaceae). Comparison with Epipactis atropurpurea nectar composition. Apidologie 1986, 17, 125–136. [Google Scholar] [CrossRef] [Green Version]
- Moré, M.; Amorim, F.W.; Benitez-Vieyra, S.; Medina, A.M.; Sazima, M.; Cocucci, A.A. Armament imbalances: Match and mismatch in plant-pollinator traits of highly specialized long-spurred orchids. PLoS ONE 2012, 7, e41878. [Google Scholar] [CrossRef] [Green Version]
- Trunschke, J.; Sletvold, N.; Ågren, J. Manipulation of trait expression and pollination regime reveals the adaptive significance of spur length. Evolution 2020, 74, 597–609. [Google Scholar] [CrossRef]
- Alexandersson, R.; Johnson, S.D. Pollinator-mediated selection on flower-tube length in a hawkmoth-pollinated Gladiolus (Iridaceae). Proc. Biol. Sci. 2002, 269, 631–636. [Google Scholar] [CrossRef] [Green Version]
- Anderson, B.; Alexandersson, R.; Johnson, S.D. Evolution and coexistence of pollination ecotypes in an African Gladiolus (Iridaceae). Evolution 2010, 64, 960–972. [Google Scholar] [CrossRef] [PubMed]
- Boberg, E.; Ägren, J. Despite their apparent integration, spur length but not perianth size affects reproductive success in the moth-pollinated orchid Platanthera bifolia. Funct. Ecol. 2009, 23, 1022–1028. [Google Scholar] [CrossRef]
- Boberg, E.; Alexandersson, R.; Jonsson, M.; Maad, J.; Ägren, J.; Nilsson, L.A. Pollinator shifts and the evolution of spur length in the moth-pollinated orchid Platanthera bifolia. Ann. Bot. 2014, 113, 267–275. [Google Scholar] [CrossRef] [Green Version]
- Little, K.J.; Dieringer, G.; Romano, M. Pollination ecology, genetic diversity and selection on nectar spur length in Platanthera lacera (Orchidaceae). Plant Spec. Biol. 2005, 20, 183–190. [Google Scholar] [CrossRef]
- Maad, J. Phenotypic selection in hawkmoth-pollinated Platanthera bifolia: Targets and fitness surfaces. Evolution 2000, 54, 112–123. [Google Scholar] [CrossRef]
- Maad, J.; Alexandersson, R. Variable selection in Platanthera bifolia (Orchidaceae): Phenotypic selection differed between sex functions in a drought year. J. Evol. Biol. 2004, 17, 642–650. [Google Scholar] [CrossRef] [PubMed]
- Whittall, J.B.; Hodges, S.A. Pollinator shifts drive increasingly long nectar spurs in columbine flowers. Nature 2007, 447, 706–709. [Google Scholar] [CrossRef]
- Caruso, C.M.; Eisen, K.E.; Martin, R.A.; Sletvold, N. A meta-analysis of the agents of selection on floral traits. Evolution 2018, 73, 4–14. [Google Scholar] [CrossRef] [PubMed] [Green Version]
- De Jager, M.L.; Peakall, R. Experimental examination of pollinator-mediated selection in a sexually deceptive orchid. Ann. Bot. 2019, 123, 347–354. [Google Scholar] [CrossRef]
- Paulus, H.F. Deceived males-pollination biology of the Mediterranean orchid genus Ophrys (Orchidaceae). J. Eur. Orchid. 2006, 38, 303–353. [Google Scholar]
- Scopece, G.; Juillet, N.; Lexer, C.; Cozzolino, S. Fluctuating selection across years and phenotypic variation in food-deceptive orchids. PeerJ 2017, 5, e3704. [Google Scholar] [CrossRef] [PubMed] [Green Version]
- Sletvold, N.; Ågren, J. Nonadditive effects of floral display and spur length on reproductive success in a deceptive orchid. Ecology 2011, 92, 2167–2174. [Google Scholar] [CrossRef] [PubMed] [Green Version]
- Sletvold, N.; Trunschke, J.; Smit, M.; Verbeek, J.; Agren, J. Strong pollinator-mediated selection for increased flower brightness and contrast in a deceptive orchid. Evolution 2016, 70, 716–724. [Google Scholar] [CrossRef]
- Bernhardt, P.; Edens-Meier, R. What we think we know vs. what we need to know about orchid pollination and conservation: Cypripedium L. as a model lineage. Bot. Rev. 2010, 76, 204–219. [Google Scholar] [CrossRef]
- Potts, S.G.; Biesmeijer, J.C.; Kremen, C.; Neumann, P.; Schweiger, O.; Kunin, W.E. Global pollinator declines: Trends, impacts and drivers. Trends Ecol. Evol. 2010, 25, 345–353. [Google Scholar] [CrossRef] [PubMed]
- Jermakowicz, E.; Brzosko, E. Demographic responses of boreal-montane orchid Malaxis monophyllos (L.) Sw. populations to contrasting environmental conditions. Acta Soc. Bot. Pol. 2016, 85, 1. [Google Scholar] [CrossRef] [Green Version]
- Mitchell, R.J.; Flanagan, R.J.; Brown, B.J.; Waser, N.M.; Karron, J.D. New frontiers in competition for pollination. Ann. Bot. 2009, 103, 1403–1413. [Google Scholar] [CrossRef] [Green Version]
- Vamosi, J.C.; Knight, T.M.; Steets, J.A.; Mazer, S.J.; Burd, M.; Ashman, T.-L. Pollination decays in biodiversity hotspots. Proc. Natl. Acad. Sci. USA 2006, 103, 956–961. [Google Scholar] [CrossRef] [Green Version]
- Brzosko, E. The dynamics of Listera ovata populations on mineral islands in the Biebrza National Park. Acta Soc. Bot. Pol. 2002, 71, 243–251. [Google Scholar] [CrossRef] [Green Version]
- Brzosko, E. Dynamics of island populations of Cypripedium calceolus in the Biebrza river valley (north-east Poland). Bot. J. Linn. Soc. 2002, 139, 67–77. [Google Scholar] [CrossRef]
- Brzosko, E. The dynamics of island populations of Platanthera bifolia in the Biebrza National Park (NE Poland). Ann. Bot. Fenn. 2003, 40, 243–253. [Google Scholar]
- Ackerman, J.D. Invasive orchids: Weeds we hate to love? Lankesteriana 2015, 7, 19–21. [Google Scholar] [CrossRef] [Green Version]
- Adamowski, W. Expansion of native orchids in anthropogenous habitats. Pol. Bot. Stud. 2006, 22, 35–44. [Google Scholar]
- Jacquemyn, H.; Brys, R.; Hutchings, M.J. Biological flora of the British Isles: Epipactis palustris. J. Ecol. 2014, 102, 1341–1355. [Google Scholar] [CrossRef]
- Rewicz, A.; Bomanowska, A.; Shevera, M.; Kurowski, J.; Krasoń, K.; Zielińska, K. Cities and disturbed areas as man-made shelters for orchid communities. Not. Bot. Horti Agrobot. Cluj-Napoca 2017, 45, 126–139. [Google Scholar] [CrossRef] [Green Version]
- The IUCN Red List of Threatened Species, Version 2021-2. Available online: https://www.iucnredlist.org/ (accessed on 27 October 2021).
- Fay, M.F. Orchid conservation: How can we meet the challenges in the twenty-first century? Bot. Stud. 2018, 59, 16. [Google Scholar] [CrossRef] [Green Version]
- Kull, T.; Selgis, U.; Peciña, M.V.; Metsare, M.; Ilves, A.; Tali, K.; Sepp, K.; Kull, K.; Shefferson, R.P. Factors influencing IUCN threat levels to orchids across Europe on the basis of national red lists. Ecol. Evol. 2016, 6, 6245–6265. [Google Scholar] [CrossRef]
- Zizka, A.; Silvestro, D.; Vitt, P.; Knight, T.M. Automated conservation assessment of the orchid family with deep learning. Conserv. Biol. 2021, 35, 897–908. [Google Scholar] [CrossRef]
- Swarts, N.D.; Dixon, K.W. Terrestrial orchid conservation in the age of extinction. Ann. Bot. 2009, 104, 543–556. [Google Scholar] [CrossRef] [PubMed] [Green Version]
- Kull, T.; Hutchings, M.J. A comparative analysis of decline in the distribution ranges of orchid species in Estonia and the United Kingdom. Biol. Conserv. 2006, 129, 31–39. [Google Scholar] [CrossRef]
- Jacquemyn, H.; Brys, R.; Hermy, M.; Willems, J. Does nectar reward affect rarity and extinction probabilities of orchid species? An assessment using historical records from Belgium and the Netherlands. Biol. Conserv. 2005, 121, 257–263. [Google Scholar] [CrossRef]
- Goulson, D.; Lye, G.C.; Darvill, B. Decline and conservation of bumble bees. Annu. Rev. Entomol. 2008, 53, 191–208. [Google Scholar] [CrossRef] [PubMed]
- Kaiser, H.F. An index of factorial simplicity. Psychometrika 1974, 39, 31–36. [Google Scholar] [CrossRef]
- Cattell, R.B. The scree test for the number of factors. Multivar. Behav. Res. 1966, 1, 245–276. [Google Scholar] [CrossRef] [PubMed]
- Kaiser, H.F. The application of electronic computers to factor analysis. Educ. Psychol. Meas. 1960, 20, 141–151. [Google Scholar] [CrossRef]
- Tałałaj, I.; Brzosko, E. Selfing potential in Epipactis palustris, E. helleborine and E. atrorubens (Orchidaceae). Plant Syst. Evol. 2008, 276, 21–29. [Google Scholar] [CrossRef]
- Vakhrameeva, M.G.; Tatarenko, I.V.; Varlygina, T.I.; Torosyan, G.K.; Zagulski, M.N. Orchids of Russia and Adjacent Countries (within the Borders of the Former USSR); A.R.G. Gantner Verlag K.G.: Ruggell, Liechtenstein, 2008; p. 690. [Google Scholar]
- Jacquemyn, H.; Brys, R. Pollen limitation and the contribution of autonomous selfing to fruit and seed set in a rewarding orchid. Am. J. Bot. 2015, 102, 67–72. [Google Scholar] [CrossRef] [PubMed] [Green Version]
- Jakubska-Busse, A.; Kadej, M. The pollination of Epipactis Zinn, 1757 (Orchidaceae) species in Central Europe—The significance of chemical attractants, floral morphology and concomitant insects. Acta Soc. Bot. Pol. 2011, 80, 49–57. [Google Scholar] [CrossRef] [Green Version]
- Pellegrino, G.; Bellusci, F. Effects of human disturbance on reproductive success and population viability of Serapias cordigera (Orchidaceae). Bot. J. Linn. Soc. 2014, 176, 408–420. [Google Scholar] [CrossRef] [Green Version]
- Parra-Tabla, V.; Vargas, C.F.; Magaña-Rueda, S.; Navarro, J. Female and male pollination success of Oncidium ascendens Lindey (Orchidaceae) in two contrasting habitat patches. Biol. Conserv. 2000, 94, 335–340. [Google Scholar] [CrossRef]
- Rewicz, A.; Jaskuła, R.; Rewicz, T.; Tończyk, G. Pollinator diversity and reproductive success of Epipactis helleborine (L.) Crantz (Orchidaceae) in anthropogenic and natural habitats. PeerJ 2017, 5, e3159. [Google Scholar] [CrossRef] [Green Version]
- Ollerton, J.; Killick, A.; Lamborn, E.; Watts, S.; Whiston, M. Multiple meanings and modes: On the many ways to be a generalist flower. Taxon 2007, 56, 717–728. [Google Scholar] [CrossRef]
- Ågren, J.; Fortunel, C.; Ehrlén, J. Selection on floral display in insect-pollinated Primula farinosa: Effects of vegetation height and litter accumulation. Oecologia 2006, 150, 225–232. [Google Scholar] [CrossRef]
- Sletvold, N.; Grindeland, J.M.; Ågren, J. Vegetation context influences the strength and targets of pollinator-mediated selection in a deceptive orchid. Ecology 2013, 94, 1236–1242. [Google Scholar] [CrossRef] [PubMed] [Green Version]
- Grindeland, J.M.; Sletvold, N.; Ims, R.A. Effects of floral display size and plant density on pollinator visitation rate in a natural population of Digitalis purpurea. Funct. Ecol. 2005, 19, 383–390. [Google Scholar] [CrossRef] [Green Version]
- Kindlmann, P.; Jersáková, J. Effect of floral display on reproductive success in terrestrial orchids. Folia Geobot. 2006, 41, 47–60. [Google Scholar] [CrossRef]
- Vallius, E.; Arminen, S.; Salonen, V. Are There Fitness Advantages Associated with a Large Inflorescence in Gymnadenia conopsea ssp. conopsea? 2006. Available online: http://www.r-b-o.eu/rbo_public?Vallius_et_al_2006.html (accessed on 29 November 2020).
- Calvo, R.N. Inflorescence size and fruit distribution among individuals in three orchid species. Am. J. Bot. 1990, 77, 1378–1381. [Google Scholar] [CrossRef]
- Pellegrino, G.; Bellusci, F.; Musacchio, A. The effects of inflorescence size and flower position on female reproductive success in three deceptive orchids. Bot. Stud. 2010, 51, 351–356. [Google Scholar]
- Van der Niet, T.; Peakall, R.; Johnson, S.D. Pollinator-driven ecological speciation in plants: New evidence and future perspectives. Ann. Bot. 2014, 113, 199–211. [Google Scholar] [CrossRef] [Green Version]
- Vereecken, N.J.; Cozzolino, S.; Schiestl, F.P. Hybrid floral scent novelty drives pollinator shift in sexually deceptive orchids. BMC Evol. Biol. 2010, 10, 103. [Google Scholar] [CrossRef] [PubMed] [Green Version]
- Peralta, G.; Vázquez, D.P.; Chacoff, N.P.; Lomáscolo, S.B.; Perry, G.L.W.; Tylianakis, J.M. Trait matching and phenological overlap increase the spatio-temporal stability and functionality of plant-pollinator interactions. Ecol. Lett. 2020, 23, 1107–1116. [Google Scholar] [CrossRef] [PubMed]
- Jacquemyn, H.; Brys, R. Lack of strong selection pressures maintains wide variation in floral traits in a food-deceptive orchid. Ann. Bot. 2020, 126, 445–453. [Google Scholar] [CrossRef] [PubMed]
- Abrahamczyk, S.; Kessler, M.; Hanley, D.; Karger, D.N.; Müller, M.P.J.; Knauer, A.C.; Keller, F.; Schwerdtfeger, M.; Humphreys, A.M. Pollinator adaptation and the evolution of floral nectar sugar composition. J. Evol. Biol. 2016, 30, 112–127. [Google Scholar] [CrossRef]
- Parachnowitsch, A.L.; Manson, J.S.; Sletvold, N. Evolutionary ecology of nectar. Ann. Bot. 2019, 123, 247–261. [Google Scholar] [CrossRef] [Green Version]
- Fowler, R.E.; Rotheray, E.L.; Goulson, D. Floral abundance and resource quality influence pollinator choice. Insect Conserv. Divers. 2016, 9, 481–494. [Google Scholar] [CrossRef] [Green Version]
- Petanidou, T.; Van Laere, A.; Ellis, W.N.; Smets, E. What shapes amino acid and sugar composition in Mediterranean floral nectars? Oikos 2006, 115, 155–169. [Google Scholar] [CrossRef] [Green Version]
- Jakubska-Busse, A.; Kadej, M. Pollination ecology of marsh helleborine Epipactis palustris (L.) Crantz on the Polish side of the Orlickie Mts. (Central Sudety Mts.). In Environmental Changes and Biological Assessments IV; Kočárek, P., Plášek, V., Malachová, K., Eds.; Scripra Facultatis Rerum Naturalium Universitatis Ostraviensis: Cambridge, UK, 2008; Volume 186, pp. 247–253. [Google Scholar]
- Gardener, M.C.; Gillman, M.P. The effects of soil fertilizer on amino acids in the floral nectar of corncockle, Agrostemma githago (Caryophyllaceae). Oikos 2001, 92, 101–106. [Google Scholar] [CrossRef] [Green Version]
- Carter, C.; Shafir, S.; Yehonatan, L.; Palmer, R.G.; Thornburg, R. A novel role for proline in plant floral nectars. Naturwissenschaften 2006, 93, 72–79. [Google Scholar] [CrossRef]
- Nepi, M.; Soligo, C.; Nocentini, D.; Abate, M.; Guarnieri, M.; Cai, G.; Bini, L.; Puglia, M.; Bianchi, L.; Pacini, E. Amino acids and protein profile in floral nectar: Much more than a simple reward. Flora 2012, 207, 475–481. [Google Scholar] [CrossRef]
- Nocentini, D.; Pacini, E.; Guarnieri, M.; Martelli, D.; Nepi, M. Intrapopulation heterogeneity in floral nectar attributes and foraging insects of an ecotonal Mediterranean species. Plant Ecol. 2013, 214, 799–809. [Google Scholar] [CrossRef]
- Bertazzini, M.; Medrzycki, P.; Bortolotti, L.; Maistrello, L.; Forlani, G. Amino acid content and nectar choice by forager honeybees (Apis mellifera L.). Amino Acids 2010, 39, 315–318. [Google Scholar] [CrossRef] [Green Version]
- Tiedge, K.; Lohaus, G. Nectar sugars and amino acids in day- and night-flowering Nicotiana species are more strongly shaped by pollinators’ preferences than organic acids and inorganic ions. PLoS ONE 2017, 12, e0176865. [Google Scholar] [CrossRef] [Green Version]
- Kim, Y.S.; Smith, B.H. Effect of an amino acid on feeding preferences and learning behavior in the honey bee, Apis mellifera. J. Insect Physiol. 2000, 46, 793–801. [Google Scholar] [CrossRef]
- Baker, H.G.; Baker, I. Intraspecific constancy of floral nectar amino acid complements. Bot. Gaz. 1977, 138, 183–191. [Google Scholar] [CrossRef]
- Hultén, E.; Fries, M. Atlas of North European Vascular Plants: North of the Tropic of Cancer. Volumes I-III; Koeltz Scientific Books: Königstein, Germany, 1986; p. 1172. [Google Scholar]
- Kowalkowska, A.K.; Kostelecka, J.; Bohdanowicz, J.; Kapusta, M.; Rojek, J. Studies on floral nectary, tepals’ structure, and gynostemium morphology of Epipactis palustris (L.) Crantz (Orchidaceae). Protoplasma 2015, 252, 321–333. [Google Scholar] [CrossRef] [PubMed] [Green Version]
- Morrant, D.S.; Schumann, R.; Petit, S. Field methods for sampling and storing nectar from flowers with low nectar volumes. Ann. Bot. 2009, 103, 533–542. [Google Scholar] [CrossRef] [Green Version]
- Wickham, H.; Averick, M.; Bryan, J.; Chang, W.; McGowan, L.; François, R.; Grolemund, G.; Hayes, A.; Henry, L.; Hester, J.; et al. Welcome to the Tidyverse. J. Open Source Softw. 2019, 4, 1686. [Google Scholar] [CrossRef]
- R Core Team. R: A Language and Environment for Statistical Computing, R Version 4.1.1, Kick Things; R Foundation for Statistical Computing: Vienna, Austria, 2021; Available online: https://www.R-project.org/ (accessed on 5 October 2021).
- Fox, J.; Weisberg, S. An R Companion to Applied Regression, 3rd ed.; SAGE Publications, Inc.: Thousand Oaks, CA, USA, 2019. [Google Scholar]
- Burda, M. Paircompviz: Multiple Comparison Test Visualization (R Package Version 1.28.0); 2020; Available online: https://www.bioconductor.org/packages/release/bioc/html/paircompviz.html (accessed on 5 October 2021).
- Graves, S.; Piepho, H.-P.; Selzer, L.; Dorai-Raj, S. multcompView: Visualizations of Paired Comparisons, R Package Version 0.1-8; 2019; Available online: https://cran.r-project.org/web/packages/multcompView/index.html (accessed on 5 October 2021).
- Mangiafico, S. Rcompanion: Functions to Support Extension Education Program Evaluation (R Package Version 2.3.26); 2020; Available online: https://rdrr.io/cran/rcompanion/ (accessed on 5 October 2021).
- Hamilton, N.E.; Ferry, M. ggtern: Ternary diagrams using ggplot2. J. Stat. Softw. 2018, 87, 1–17. [Google Scholar] [CrossRef] [Green Version]
- Lê, S.; Josse, J.; Husson, F. FactoMineR: An R package for multivariate analysis. J. Stat. Softw. 2008, 25, 1–18. [Google Scholar] [CrossRef] [Green Version]
- Bartlett, M.S. Tests of significance in factor analysis. Br. J. Stat. Psychol. 1950, 3, 77–85. [Google Scholar] [CrossRef]
- Revelle, W. psych: Procedures for Personality and Psychological Research, R Package Version 1.8.10; Northwestern University: Evanston, IL, USA, 2018. [Google Scholar]
- Kassambara, A.; Mundt, F. Factoextra: Extract and Visualize the Results of Multivariate Data Analyses, R Package Version 1.0.6; 2019; Available online: https://cran.r-project.org/web/packages/factoextra/index.html (accessed on 5 October 2021).

| Parameter | Statistic/Comparison | Natural (Nat.) Populations | Anthropogenic (Ant.) Populations | ||
|---|---|---|---|---|---|
| ZAB | ROS | SIL | SOP | ||
| Shoot height (cm) | ± SE | 62.59 ± 3.05 a | 51.69 ± 1.61 b | 42.47 ± 1.36 c | 54.62 ± 2.14 b |
| Q1 | 51.50 | 47.01 | 37.5 | 43.25 | |
| Q2 (IQR) | 64.75 (18.75) | 53 (10) | 42.75 (9) | 56.75 (16.75) | |
| Q3 | 70.25 | 57.00 | 46.5. | 60.00 | |
| Inflorescence length (cm) | ± SE | 9.43 ± 0.58 b | 10.43 ± 0.53 b | 10.26 ± 0.33 b | 13.46 ± 0.79 a |
| Q1 | 7.25 | 9.00 | 9.00 | 10.62 | |
| Q2 (IQR) | 9.25 (3.75) | 10 (3.00) | 10.00 (3.00) | 13.50 (5.38) | |
| Q3 | 11.00 | 12.00 | 12.00 | 16.00 | |
| Nat. vs. SIL vs. SOP | b | b | a | ||
| Flower number | ± SE | 9.00 ± 0.54 | 10.66 ± 0.46 | 9.53 ± 0.43 | 11.85 ± 0.81 |
| Q1 | 7.00 | 9.00 | 9.00 | 9.25 | |
| Q2 (IQR) | 8.00 (4.50) B | 11.00 (3.00) A | 9.00 (1.75) B | 11.00 (5.75) A | |
| Q3 | 11.50 | 12.00 | 10.75 | 15.00 | |
| Length of dorsal sepal (LDS) (mm) | ± SE | 11.22 ± 0.13 a | 10.01 ± 0.09 c | 10.70 ± 0.10 b | 11.55 ± 0.18 a |
| Q1 | 10.64 | 9.56 | 10.33 | 10.99 | |
| Q2 (IQR) | 11.37 (1.04) | 9.99 (0.81) | 10.69 (0.66) | 11.34 (1.07) | |
| Q3 | 11.68 | 10.37 | 10.99 | 12.06 | |
| Width of dorsal sepal (WDS) (mm) | ± SE | 4.48 ± 0.06 a | 3.83 ± 0.05 a | 3.99 ± 0.04 b | 4.37 ± 0.11 b |
| Q1 | 4.34 | 3.64 | 3.87 | 4.02 | |
| Q2 (IQR) | 4.53 (0.28) | 3.84 (0.31) | 4.02 (0.27) | 4.34 (0.68) | |
| Q3 | 4.61 | 3.95 | 4.15 | 4.70 | |
| ZAB vs. ROS vs. Ant. | a | c | b | ||
| Nat. vs. SIL vs. SOP | ab | b | a | ||
| Nat. vs. Ant. | do not differ significantly | ||||
| Length of petal (LP) (mm) | ± SE | 9.38 ± 0.12 a | 8.18 ± 0.11 b | 9.27 ± 0.10 a | 9.36 ± 0.23 a |
| Q1 | 9.06 | 7.74 | 8.77 | 8.63 | |
| Q2 (IQR) | 9.41 (0.74) | 8.03 (0.95) | 9.29 (0.86) | 9.31 (1.34) | |
| Q3 | 9.80 | 8.70 | 9.63 | 9.97 | |
| ZAB vs. ROS vs. Ant. | a | b | a | ||
| Width of petal (WP) (mm) | ± SE | 4.01 ± 0.05 a | 3.44 ± 0.06 b | 3.83 ± 0.06 a | 3.78 ± 0.11 a |
| Q1 | 3.89 | 3.18 | 3.69 | 3.48 | |
| Q2 (IQR) | 4.06 (0.29) | 3.38 (0.42) | 3.86 (0.34) | 3.67 (0.53) | |
| Q3 | 4.17 | 3.60 | 4.03 | 4.01 | |
| ZAB vs. ROS vs. Ant. | a | c | b | ||
| Length of lateral sepal (LLS) (mm) | ± SE | 11.34 ± 0.13 | 11.01 ± 0.12 | 11.35 ± 0.10 | 12.80 ± 0.19 |
| Q1 | 10.82 | 10.53 | 11.05 | 11.93 | |
| Q2 (IQR) | 11.35 (1.01) BC | 10.87 (0.91) C | 11.40 (0.65) B | 12.63 (1.36) A | |
| Q3 | 11.81 | 11.44 | 11.70 | 13.29 | |
| Nat. vs. SIL vs. SOP | B | B | A | ||
| Width of lateral sepal (WLS) (mm) | ± SE | 4.17 ± 0.04 | 3.76 ± 0.04 | 3.83 ± 0.04 | 4.33 ± 0.10 |
| Q1 | 4.03 | 3.63 | 3.69 | 3.96 | |
| Q2 (IQR) | 4.15 (0.29) B | 3.71 (0.34) A | 3.88 (0.32) A | 4.18 (0.56) B | |
| Q3 | 4.32 | 3.96 | 4.01 | 4.52 | |
| Width of flowers (FW) (mm) | ± SE | 22.70 ± 0.35 | 20.83 ± 0.24 | 22.59 ± 0.16 | 24.31 ± 0.38 |
| Q1 | 22.26 | 20.22 | 21.87 | 22.66 | |
| Q2 (IQR) | 22.94 (1.64) B | 20.89 (1.43) A | 22.47 (1.40) B | 24.01 (2.70) C | |
| Q3 | 23.90 | 21.65 | 23.26 | 25.37 | |
| Length of flowers (FH) (mm) | ± SE | 11.47 ± 0.14 ab | 10.36 ± 0.10 c | 11.01 ± 0.12 b | 11.94 ± 0.22 a |
| Q1 | 11.04 | 10.02 | 10.69 | 11.33 | |
| Q2 (IQR) | 11.45 (0.83) | 10.35 (0.76) | 10.97 (0.77) | 11.82 (1.30) | |
| Q3 | 11.86 | 10.78 | 11.46 | 12.63 | |
| Length of labellum (LL) (mm) | ± SE | 11.91 ± 0.16 | 11.46 ± 0.15 | 11.45 ± 0.14 | 11.93 ± 0.26 |
| Q1 | 11.56 | 11.01 | 11.23 | 11.42 | |
| Q2 (IQR) | 12.06 (0.81) B | 11.47 (0.89) A | 11.54 (0.64) A | 11.99 (1.20) B | |
| Q3 | 12.37 | 11.88 | 11.87 | 12.62 | |
| ZAB vs. ROS vs. Ant. | A | B | AB | ||
| Width of hypochile (HW) (mm) | ± SE | 5.81 ± 0.13 a | 4.90 ± 0.10 b | 4.84 ± 0.14 b | 5.54 ± 0.12 a |
| Q1 | 5.25 | 4.64 | 4.31 | 5.06 | |
| Q2 (IQR) | 5.79 (1.15) | 4.95 (0.61) | 4.69 (0.98) | 5.53 (0.83) | |
| Q3 | 6.40 | 5.25 | 5.29 | 5.9 | |
| Length of hypochile (HL) (mm) | ± SE | 5.03 ± 0.13 | 4.58 ± 0.07 | 4.44 ± 0.06 | 4.80 ± 0.10 |
| Q1 | 4.62 | 4.38 | 4.20 | 4.36 | |
| Q2 (IQR) | 4.89 (0.61) C | 4.65 (0.36) AB | 4.47 (0.38) A | 4.76 (0.77) BC | |
| Q3 | 5.23 | 4.74 | 4.58 | 5.12 | |
| Length of epichile (LE) (mm) | ± SE | 7.11 ± 0.08 | 6.74 ± 0.11 | 7.03 ± 0.09 | 7.44 ± 0.11 |
| Q1 | 6.87 | 6.38 | 6.82 | 7.14 | |
| Q2 (IQR) | 7.10 (0.51) B | 6.88 (0.74) A | 7.05 (0.44) B | 7.51 (0.64) C | |
| Q3 | 7.38 | 7.12 | 7.26 | 7.78 | |
| Length of isthmus (LI) (mm) | ± SE | 2.07 ± 0.04 ab | 1.79 ± 0.03 ab | 1.94 ± 0.03 b | 2.24 ± 0.06 a |
| Q1 | 1.92 | 1.66 | 1.82 | 2.09 | |
| Q2 (IQR) | 2.08 (0.33) | 1.79 (0.29) | 1.95 (0.26) | 2.31 (0.41) | |
| Q3 | 2.25 | 1.94 | 2.08 | 2.50 | |
| Nat. vs. SIL vs. SOP | b | b | a | ||
| Width of epichile (WE) (mm) | ± SE | 7.98 ± 0.11 ab | 7.71 ± 0.09 ab | 7.56 ± 0.09 b | 8.07 ± 0.16 a |
| Q1 | 7.52 | 7.46 | 7.27 | 7.47 | |
| Q2 (IQR) | 7.89 (0.84) | 7.66 (0.49) | 7.51 (0.54) | 8.11 (0.94) | |
| Q3 | 8.36 | 7.95 | 7.81 | 8.42 | |
| Nat. vs. SIL vs. SOP | ab | b | a | ||
| Width of isthmus (WI) (mm) | ± SE | 0.84 ± 0.01 | 0.90 ± 0.02 | 0.82 ± 0.01 | 1.02 ± 0.03 |
| Q1 | 0.82 | 0.81 | 0.75 | 0.94 | |
| Q2 (IQR) | 0.85 (0.06) B | 0.91 (0.15) A | 0.82 (0.11) B | 1.01 (0.13) C | |
| Q3 | 0.88 | 0.96 | 0.86 | 1.07 | |
| Isthmus area (AI) (mm2) | ± SE | 1.75 ± 0.05 b | 1.60 ± 0.05 b | 1.59 ± 0.05 b | 2.32 ± 0.11 a |
| Q1 | 1.65 | 1.42 | 1.41 | 1.94 | |
| Q2 (IQR) | 1.75 (0.29) | 1.58 (0.37) | 1.54 (0.34) | 2.28 (0.71) | |
| Q3 | 1.94 | 1.79 | 1.75 | 2.65 | |
| Nat. vs. SIL vs. SOP | b | b | a | ||
| Amino Acid | Class | Statistic | Natural (Nat.) Populations | Anthropogenic (Ant.) Populations | ||
|---|---|---|---|---|---|---|
| ZAB | ROS | SIL | SOP | |||
| Proteogenic amino acids (μM) | ||||||
| Aspartic acid (Asp) | I | ± SE | 357.55 ± 6.47 | 377.50 ± 6.73 | 200.25 ± 6.81 | 259.51 ± 5.06 |
| Q1 | 329.36 | 351.40 | 178.80 | 228.94 | ||
| Q2 (IQR) | 359.31 (56.82) B | 380.49 (50.09) A | 198.98 (48.50) D | 267.79 (49.53) C | ||
| Q3 | 386.17 | 401.49 | 227.30 | 278.48 | ||
| Glutamic acid (Glu) | I | ± SE | 740.90 ± 8.71 b | 884.43 ± 7.46 a | 430.24 ± 6.87 d | 525.11 ± 4.78 c |
| Q1 | 706.06 | 858.27 | 400.67 | 509.22 | ||
| Q2 (IQR) | 730.92 (71.49) | 885.59 (48.87) | 421.47 (64.14) | 522.14 (24.38) | ||
| Q3 | 777.55 | 907.13 | 464.81 | 533.60 | ||
| Alanine (Ala) | I | ± SE | 92.59 ± 2.48 | 116.35 ± 1.74 | 84.42 ± 1.10 | 89.31 ± 2.40 |
| Q1 | 80.82 | 111.75 | 79.64 | 81.50 | ||
| Q2 (IQR) | 89.79 (23.47) B | 117.99 (9.50) A | 84.07 (9.36) C | 83.99 (12.90) C | ||
| Q3 | 104.29 | 121.25 | 89.01 | 94.40 | ||
| ZAB vs. ROS vs. Ant. | B | A | B | |||
| Cysteine (Cys) | I | ± SE | 163.35 ± 3.07 | 229.32 ± 3.52 | 149.33 ± 3.41 | 93.10 ± 1.10 |
| Q1 | 152.41 | 217.42 | 136.75 | 89.49 | ||
| Q2 (IQR) | 168.28 (20.05) B | 229.17 (17.12) A | 143.13 (26.49) B | 92.88 (7.34) C | ||
| Q3 | 172.46 | 234.54 | 163.24 | 96.83 | ||
| Glycine (Gly) | I | ± SE | 68.81 ± 1.92 | 88.60 ± 1.03 | 69.36 ± 1.60 | 57.25 ± 0.69 |
| Q1 | 61.34 | 83.57 | 63.75 | 54.38 | ||
| Q2 (IQR) | 71.38 (16.50) B | 88.39 (9.56) A | 66.38 (7.20) B | 56.96 (6.03) C | ||
| Q3 | 77.83 | 93.13 | 70.96 | 60.41 | ||
| Serine (Ser) | I | ± SE | 273.61 ± 3.77 | 326.20 ± 2.31 | 225.79 ± 2.77 | 184.75 ± 1.71 |
| Q1 | 263.55 | 318.96 | 214.73 | 180.13 | ||
| Q2 (IQR) | 275.68 (23.06) B | 326.89 (12.68) A | 227.17 (16.76) C | 185.01 (9.16) D | ||
| Q3 | 286.61 | 331.64 | 231.50 | 189.29 | ||
| Threonine (Thr) | I | ± SE | 141.01 ± 4.28 a | 139.20 ± 1.34 a | 123.17 ± 1.01 b | 80.10 ± 0.99 c |
| Q1 | 119.21 | 133.71 | 118.35 | 76.39 | ||
| Q2 (IQR) | 139.94 (41.64) | 139.5 (9.77) | 122.99 (9.15) | 80.38 (7.99) | ||
| Q3 | 160.85 | 143.48 | 127.49 | 84.38 | ||
| Nat. vs. SIL vs. SOP | a | b | c | |||
| Tyrosine (Tyr) | I | ± SE | 12.29 ± 0.43 | 15.35 ± 0.34 | 6.91 ± 0.40 | 6.67 ± 0.41 |
| Q1 | 10.49 | 13.64 | 6.41 | 5.64 | ||
| Q2 (IQR) | 12.89 (2.81) B | 15.39 (3.48) A | 7.41 (1.91) C | 7.38 (2.63) C | ||
| Q3 | 13.30 | 17.12 | 8.32 | 8.28 | ||
| ZAB vs. ROS vs. Ant. | B | A | C | |||
| Arginine (Arg) | II | ± SE | 24.84 ± 0.79 b | 34.94 ± 0.42 a | 15.65 ± 0.29 c | 16.15 ± 0.42 c |
| Q1 | 21.95 | 32.70 | 14.42 | 14.39 | ||
| Q2 (IQR) | 24.59 (5.29) | 34.39 (3.80) | 16.13 (2.08) | 16.39 (3.10) | ||
| Q3 | 27.25 | 36.50 | 16.49 | 17.49 | ||
| ZAB vs. ROS vs. Ant. | b | a | c | |||
| Asparagine (Asn) | II | ± SE | 313.16 ± 4.99 | 432.35 ± 2.86 | 246.77 ± 3.26 | 237.69 ± 1.99 |
| Q1 | 302.5 | 421.59 | 232.62 | 228.42 | ||
| Q2 (IQR) | 317.31 (25.06) B | 430.94 (20.08) A | 241.48 (31.30) C | 238.41 (15.70) C | ||
| Q3 | 327.56 | 441.67 | 263.92 | 244.12 | ||
| ZAB vs. ROS vs. Ant. | B | A | C | |||
| Glutamine (Gln) | II | ± SE | 529.06 ± 6.84 b | 623.95 ± 5.04 a | 414.67 ± 2.64 c | 351.19 ± 3.72 d |
| Q1 | 509.06 | 600.73 | 406.49 | 332.55 | ||
| Q2 (IQR) | 521.50 (30.51) | 623.48 (41.83) | 412.54 (15.84) | 349.53 (31.96) | ||
| Q3 | 539.57 | 642.56 | 422.33 | 364.51 | ||
| Histidine (His) | II | ± SE | 133.04 ± 3.02 a | 101.81 ± 1.01 b | 71.05 ± 1.10 c | 68.62 ± 0.71 c |
| Q1 | 128.42 | 97.40 | 66.89 | 65.64 | ||
| Q2 (IQR) | 132.50 (15.12) | 102.48 (8.75) | 69.65 (8.37) | 68.49 (5.53) | ||
| Q3 | 143.54 | 106.15 | 75.27 | 71.17 | ||
| ZAB vs. ROS vs. Ant. | a | b | c | |||
| Lysine (Lys) | II | ± SE | 167.59 ± 3.61 | 231.48 ± 2.75 | 128.46 ± 1.29 | 115.63 ± 0.74 |
| Q1 | 152.75 | 219.45 | 124.67 | 113.68 | ||
| Q2 (IQR) | 162.49 (25.32) B | 230.45 (18.80) A | 128.49 (7.92) C | 116.39 (4.53) D | ||
| Q3 | 178.07 | 238.24 | 132.60 | 118.21 | ||
| Proline (Pro) | III | ± SE | 87.53 ± 2.92 b | 82.45 ± 2.56 b | 362.10 ± 7.85 a | 373.20 ± 8.13 a |
| Q1 | 76.60 | 71.53 | 331.58 | 335.57 | ||
| Q2 (IQR) | 89.14 (25.72) | 83.13 (18.10) | 374.09 (69.02) | 380.04 (69.61) | ||
| Q3 | 102.32 | 89.62 | 400.60 | 405.18 | ||
| ZAB vs. ROS vs. Ant. | b | b | a | |||
| Nat. vs. SIL vs. SOP | b | a | a | |||
| Nat. vs. Ant. | differ significantly | |||||
| Isoleucine (Ile) | IV | ± SE | 162.45 ± 3.79 a | 143.93 ± 1.61 b | 117.30 ± 1.60 c | 100.93 ± 0.62 d |
| Q1 | 148.25 | 138.68 | 111.08 | 98.77 | ||
| Q2 (IQR) | 162.48 (30.83) | 144.89 (12.13) | 118.29 (10.70) | 101.39 (4.52) | ||
| Q3 | 179.08 | 150.80 | 121.78 | 103.28 | ||
| Leucine (Leu) | IV | ± SE | 333.40 ± 4.77 a | 290.65 ± 3.82 b | 240.59 ± 3.13 c | 242.72 ± 1.78 c |
| Q1 | 312.63 | 278.40 | 224.67 | 237.50 | ||
| Q2 (IQR) | 331.99 (31.35 | 291.74 (24.45) | 239.15 (28.87) | 243.39 (11.74) | ||
| Q3 | 343.97 | 302.85 | 253.54 | 249.23 | ||
| ZAB vs. ROS vs. Ant. | a | b | c | |||
| Methionine (Met) | IV | ± SE | 92.10 ± 3.11 a | 87.79 ± 0.79 a | 67.46 ± 0.66 b | 50.42 ± 0.79 c |
| Q1 | 79.01 | 84.48 | 66.03 | 47.66 | ||
| Q2 (IQR) | 89.19 (24.54) | 87.33 (5.79) | 67.43 (3.47) | 50.20 (5.55) | ||
| Q3 | 103.55 | 90.27 | 69.50 | 53.21 | ||
| Nat. vs. SIL vs. SOP | a | b | c | |||
| Phenylalanine (Phe) | IV | ± SE | 44.87 ± 1.66 ab | 46.20 ± 0.61 ab | 48.72 ± 1.17 a | 42.50 ± 0.89 b |
| Q1 | 37.49 | 43.47 | 44.35 | 39.93 | ||
| Q2 (IQR) | 44.95 (14.70) | 46.42 (4.90) | 49.4 (8.94) | 43.38 (6.41) | ||
| Q3 | 52.19 | 48.37 | 53.29 | 46.33 | ||
| Nat. vs. SIL vs. SOP | ab | a | b | |||
| Tryptophan (Trp) | IV | ± SE | 189.82 ± 3.71 | 255.90 ± 2.97 | 145.15 ± 1.20 | 128.45 ± 1.22 |
| Q1 | 176.42 | 244.04 | 140.58 | 124.39 | ||
| Q2 (IQR) | 188.14 (25.84) B | 254.37 (22.42) A | 145.04 (9.16) C | 127.39 (5.84) D | ||
| Q3 | 202.26 | 266.46 | 149.74 | 130.23 | ||
| Valine (Val) | IV | ± SE | 76.77 ± 1.51 a | 69.89 ± 0.94 b | 49.85 ± 0.82 c | 47.51 ± 0.83 c |
| Q1 | 71.41 | 66.29 | 46.37 | 44.62 | ||
| Q2 (IQR) | 77.69 (12.03) | 68.52 (8.12) | 50.05 (6.13) | 47.39 (6.46) | ||
| Q3 | 83.44 | 74.40 | 52.50 | 51.08 | ||
| ZAB vs. ROS vs. Ant. | a | b | c | |||
| Non-proteogenic amino acids (μM) | ||||||
| Ornithine (Orn) | ± SE | 94.95 ± 3.81 | 116.33 ± 2.55 | 67.20 ± 1.24 | ND | |
| Q1 | 78.61 | 109.38 | 64.80 | ND | ||
| Q2 (IQR) | 89.72 (37.50) B | 114.95 (9.11) A | 68.54 (6.44) C | ND | ||
| Q3 | 116.11 | 118.50 | 71.24 | ND | ||
| Citrulline (Cit) | ± SE | 4.15 ± 0.49 | ND | ND | ND | |
| Q1 | 2.48 | ND | ND | ND | ||
| Q2 (IQR) | 4.45 (3.89) | ND | ND | ND | ||
| Q3 | 6.38 | ND | ND | ND | ||
| Taurine (Tau) | ± SE | 16.18 ± 0.67 | 14.98 ± 0.51 | 10.32 ± 0.28 | 7.61 ± 0.18 | |
| Q1 | 13.92 | 12.59 | 9.38 | 6.60 | ||
| Q2 (IQR) | 15.69 (2.84) A | 14.39 (3.90) A | 10.18 (2.11) B | 7.51 (1.90) C | ||
| Q3 | 16.76 | 16.50 | 11.50 | 8.50 | ||
| α-aminobutyric acid (AABA) | ± SE | 11.67 ± 0.42 a | 9.34 ± 0.36 b | 7.04 ± 0.30 c | 10.41 ± 0.34 c | |
| Q1 | 9.95 | 8.40 | 5.50 | 8.91 | ||
| Q2 (IQR) | 11.50 (2.84) | 8.57 (2.13) | 7.45 (2.24) | 10.02 (2.98) | ||
| Q3 | 12.8 | 10.53 | 7.74 | 11.89 | ||
| ZAB vs. ROS vs. Ant. | a | b | c | |||
| Nat. vs. SIL vs. SOP | a | b | b | |||
| Nat. vs. Ant. | differ significantly | |||||
| β-aminobutyric acid (BABA) | ± SE | 14.01 ± 0.38 | 21.74 ± 0.64 | 8.55 ± 0.31 | 4.55 ± 0.23 | |
| Q1 | 12.51 | 18.76 | 7.52 | 3.58 | ||
| Q2 (IQR) | 13.68 (2.26) B | 21.08 (4.52) A | 8.54 (1.84) D | 4.4 (1.92) C | ||
| Q3 | 14.77 | 23.28 | 9.36 | 5.50 | ||
| ZAB vs. ROS vs. Ant. | B | A | C | |||
| γ-aminobutyric acid (GABA) | ± SE | 6.84 ± 0.55 | 7.29 ± 0.35 | 3.91 ± 0.42 | ND | |
| Q1 | 6.54 | 5.50 | 2.52 | ND | ||
| Q2 (IQR) | 7.89 (2.12) A | 6.96 (3.01) A | 3.72 (2.98) B | ND | ||
| Q3 | 8.66 | 8.50 | 5.5 | ND | ||
| ZAB vs. ROS vs. Ant. | A | A | B | |||
| Nat. vs. SIL vs. SOP | A | B | B | |||
| Nat. vs. Ant. | differ significantly | |||||
| β-alanine (β-Ala) | ± SE | 22.81 ± 1.12 | 16.25 ± 0.53 | ND | ND | |
| Q1 | 18.46 | 14.52 | ND | ND | ||
| Q2 (IQR) | 21.53 (8.88) A | 16.04 (2.96) B | ND | ND | ||
| Q3 | 27.34 | 17.48 | ND | ND | ||
| Total amount of amino acids (mg/mL) | ||||||
| ± SE | 0.52 ± 0.003 b | 0.60 ± 0.002 a | 0.41 ± 0.002 c | 0.39 ± 0.002 d | ||
| Q1 | 0.51 | 0.59 | 0.41 | 0.39 | ||
| Q2 (IQR) | 0.52 (0.01) | 0.60 (0.01) | 0.42 (0.01) | 0.39 (0.01) | ||
| Q3 | 0.53 | 0.60 | 0.42 | 0.40 | ||
| Parameter | Natural Populations | Anthropogenic Populations | ||
|---|---|---|---|---|
| ZAB | ROS | SIL | SOP | |
| FRS (%) | 94.40 ± 2.83 | 81.47 ± 4.19 | 87.99 ± 3.36 | 90.60 ± 2.49 |
| PR (%) | 97.03 ± 2.68 | 87.48 ± 3.46 | 85.66 ± 4.36 | 96.55 ± 1.61 |
| PR/FRS | 1.07 ± 0.06 | 1.32 ± 0.22 | 1.07 ± 0.10 | 1.08 ± 0.03 |
| Abbreviation | Full Name |
|---|---|
| AI | isthmus area |
| FH | length of flowers |
| FW | width of flowers |
| HL | length of hypochile |
| HW | width of hypochile |
| LDS | length of dorsal sepal |
| LE | length of epichile |
| LI | length of isthmus |
| LL | length of labellum |
| LLS | length of lateral sepal |
| LP | length of petal |
| WDS | width of dorsal sepal |
| WE | width of epichile |
| WI | width of isthmus |
| WLS | width of lateral sepal |
| WP | width of petal |
| Abbreviation | Full Name |
|---|---|
| AABA | α-aminobutyric acid |
| Ala | alanine |
| Arg | arginine |
| Asn | asparagine |
| Asp | aspartic acid |
| BABA | β-aminobutyric acid |
| Cit | citrulline |
| Cys | cysteine |
| GABA | γ-aminobutyric acid |
| Gln | glutamine |
| Glu | glutamic acid |
| Gly | glycine |
| His | histidine |
| Ile | isoleucine |
| Leu | leucine |
| Lys | lysine |
| Met | methionine |
| Orn | ornithine |
| Phe | phenylalanine |
| Pro | proline |
| Ser | serine |
| Tau | taurine |
| Thr | threonine |
| Trp | tryptophan |
| Tyr | tyrosine |
| Val | valine |
| β-Ala | β-alanine |
Publisher’s Note: MDPI stays neutral with regard to jurisdictional claims in published maps and institutional affiliations. |
© 2021 by the authors. Licensee MDPI, Basel, Switzerland. This article is an open access article distributed under the terms and conditions of the Creative Commons Attribution (CC BY) license (https://creativecommons.org/licenses/by/4.0/).
Share and Cite
Brzosko, E.; Bajguz, A.; Burzyńska, J.; Chmur, M. Nectar Chemistry or Flower Morphology—What Is More Important for the Reproductive Success of Generalist Orchid Epipactis palustris in Natural and Anthropogenic Populations? Int. J. Mol. Sci. 2021, 22, 12164. https://doi.org/10.3390/ijms222212164
Brzosko E, Bajguz A, Burzyńska J, Chmur M. Nectar Chemistry or Flower Morphology—What Is More Important for the Reproductive Success of Generalist Orchid Epipactis palustris in Natural and Anthropogenic Populations? International Journal of Molecular Sciences. 2021; 22(22):12164. https://doi.org/10.3390/ijms222212164
Chicago/Turabian StyleBrzosko, Emilia, Andrzej Bajguz, Justyna Burzyńska, and Magdalena Chmur. 2021. "Nectar Chemistry or Flower Morphology—What Is More Important for the Reproductive Success of Generalist Orchid Epipactis palustris in Natural and Anthropogenic Populations?" International Journal of Molecular Sciences 22, no. 22: 12164. https://doi.org/10.3390/ijms222212164
APA StyleBrzosko, E., Bajguz, A., Burzyńska, J., & Chmur, M. (2021). Nectar Chemistry or Flower Morphology—What Is More Important for the Reproductive Success of Generalist Orchid Epipactis palustris in Natural and Anthropogenic Populations? International Journal of Molecular Sciences, 22(22), 12164. https://doi.org/10.3390/ijms222212164