
An Innovative In Vitro Open-Angle Glaucoma Model (IVOM) Shows Changes Induced by Increased Ocular Pressure and Oxidative Stress

 , , ,
, , ,  ,
, 
Abstract
:1. Introduction
2. Results
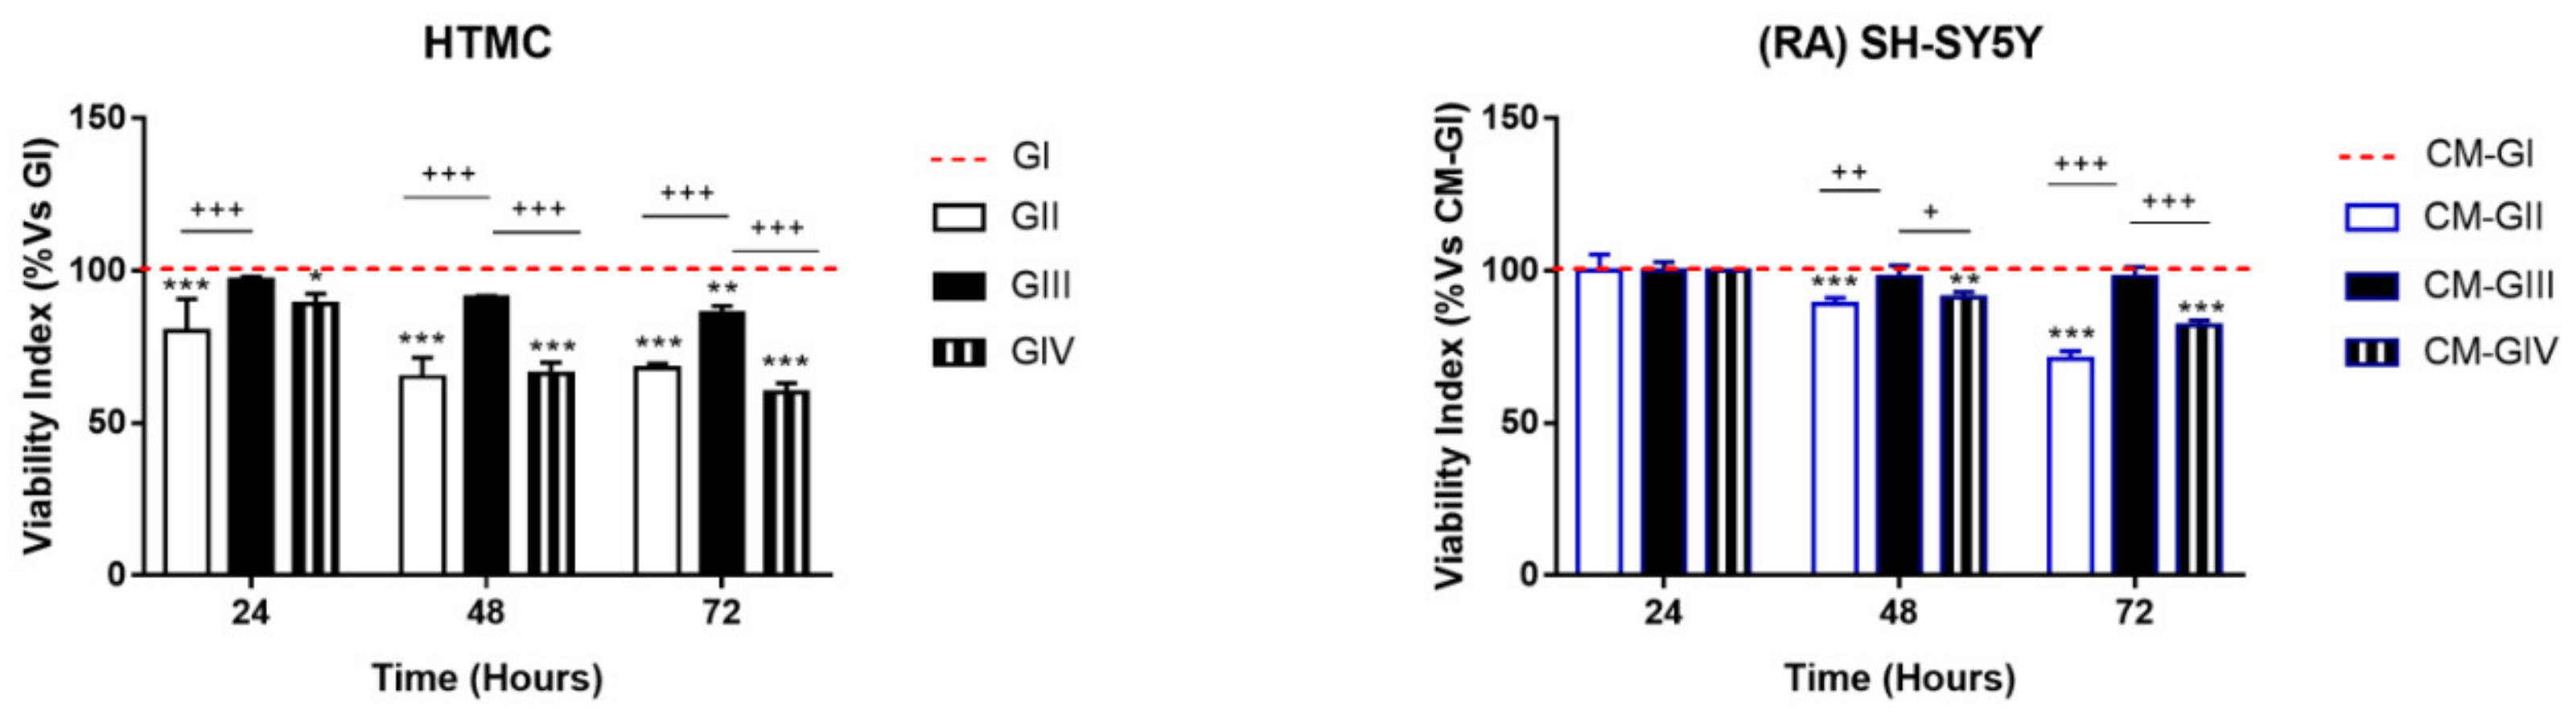
2.1. Viability
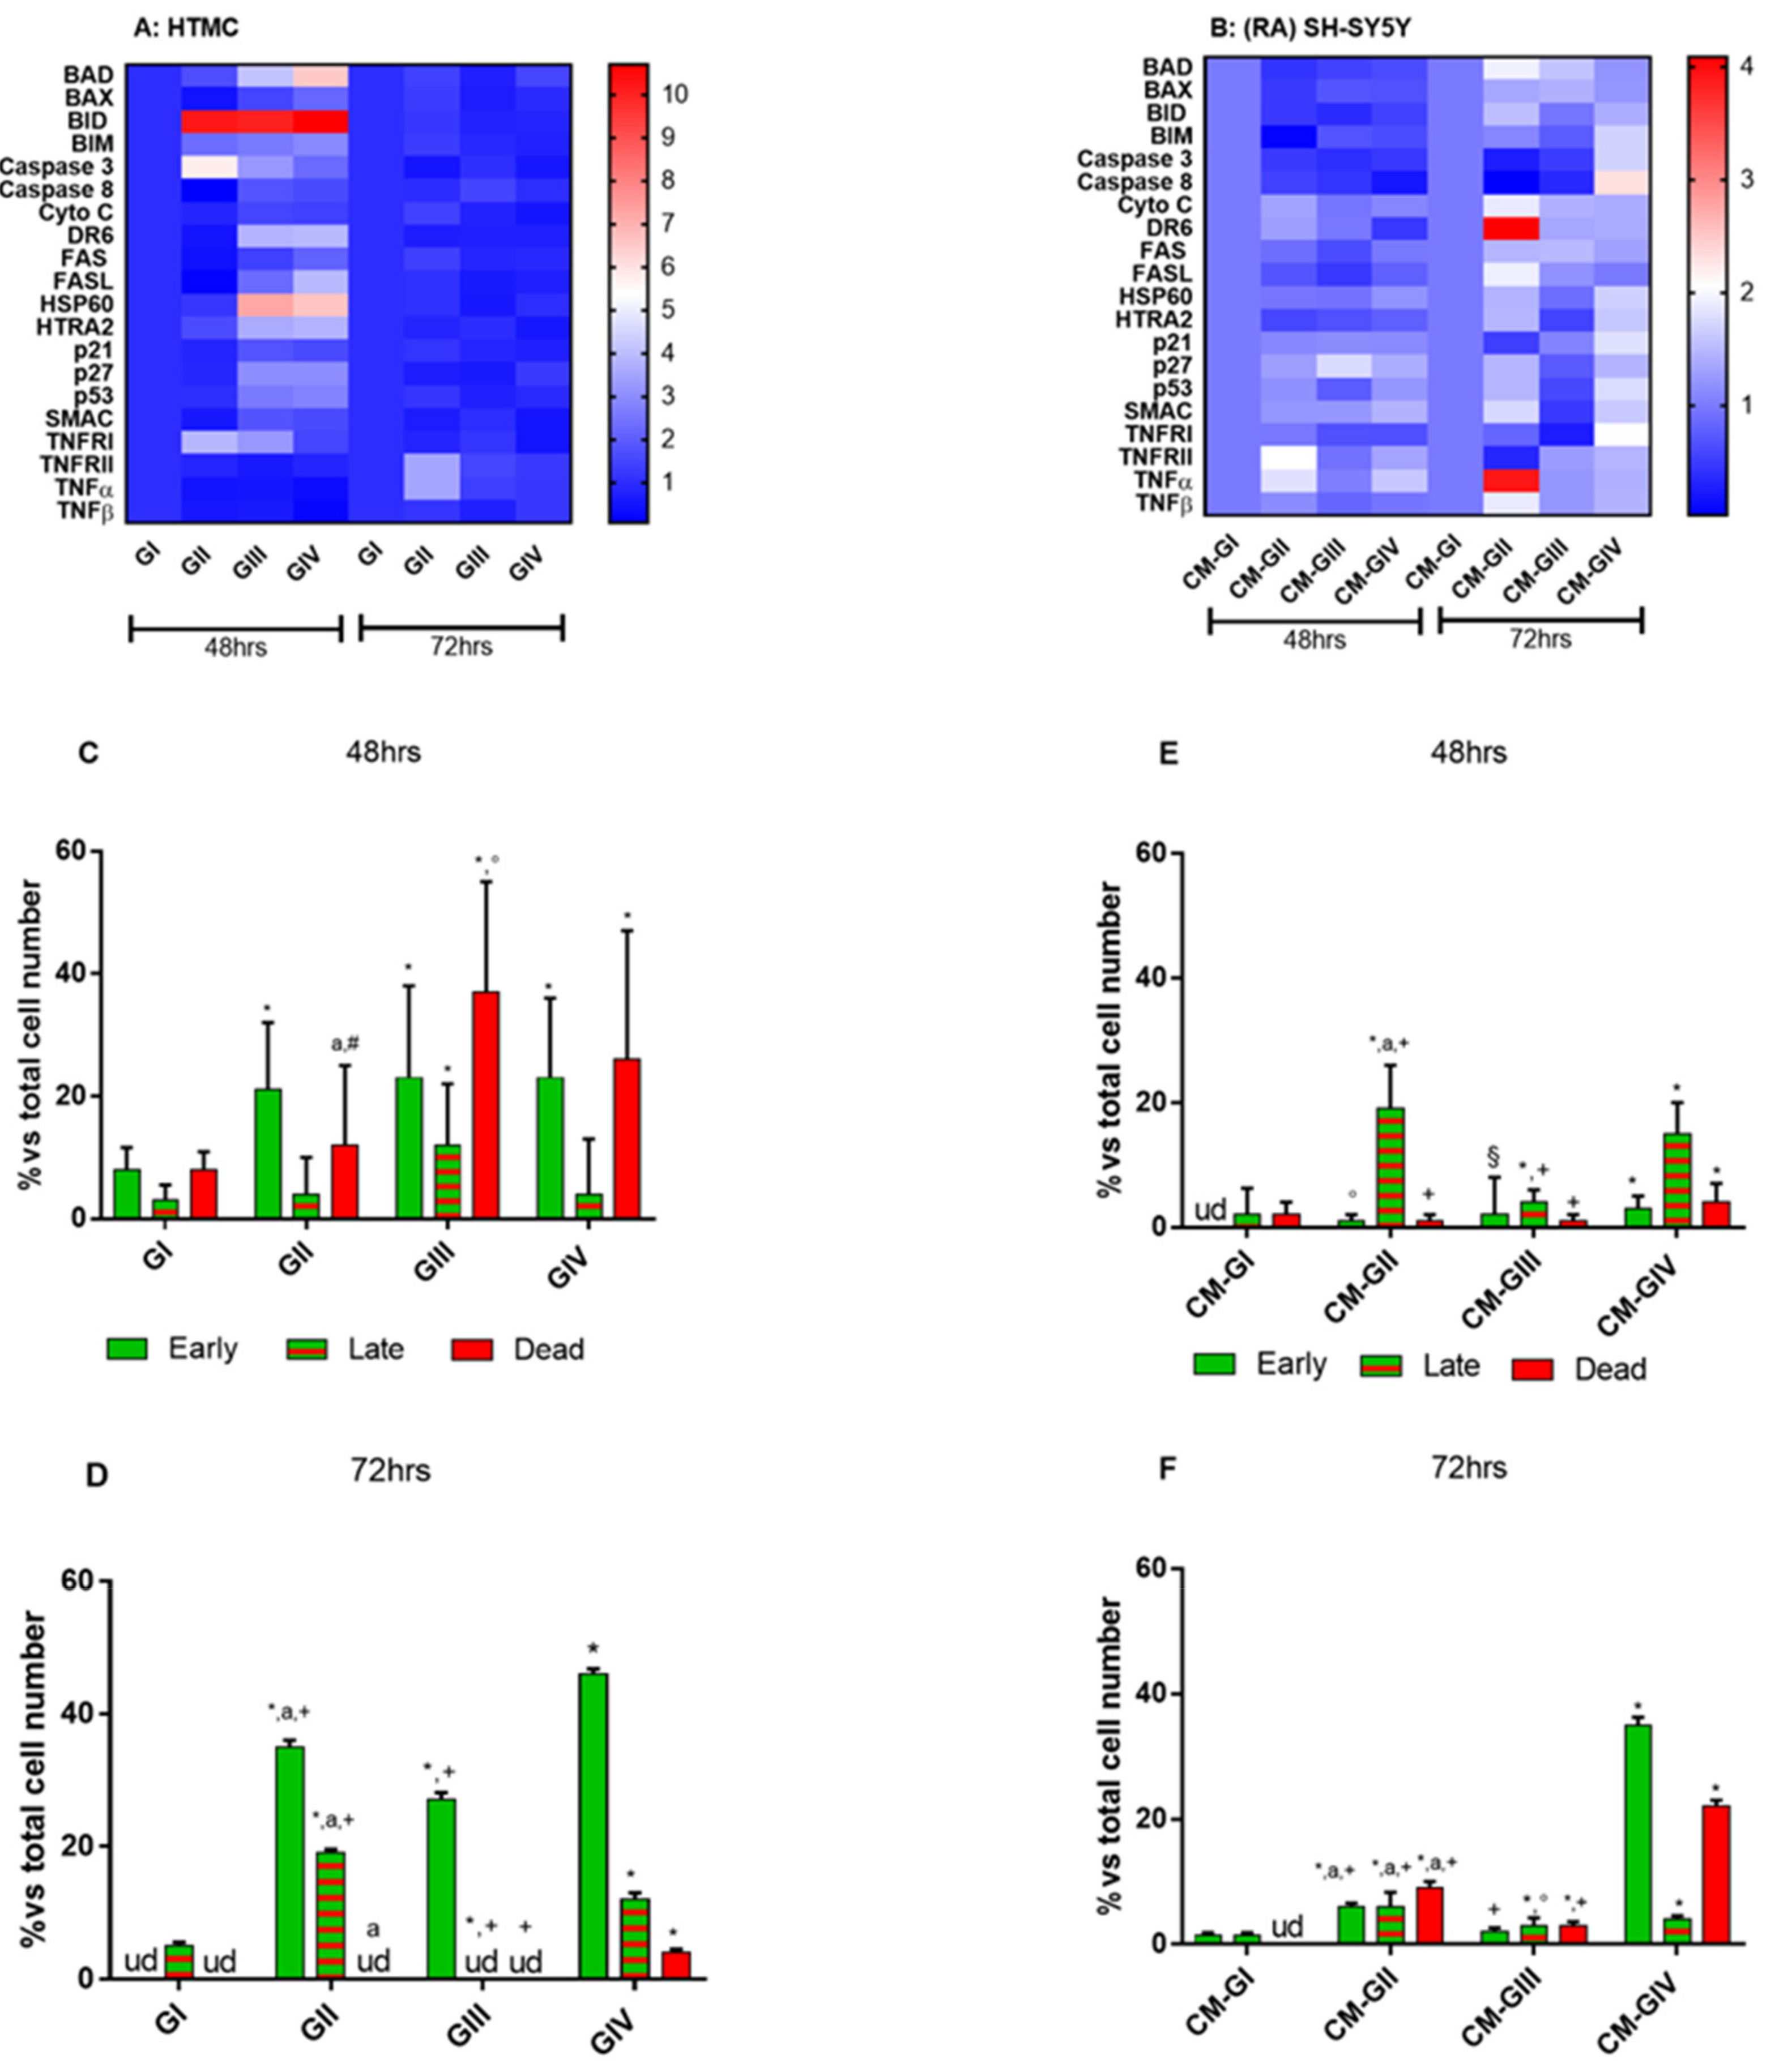
2.2. Apoptosis
2.3. Apoptosis Array
2.4. Annexin V-FITC/PI Stained Fluorescence Microscopy
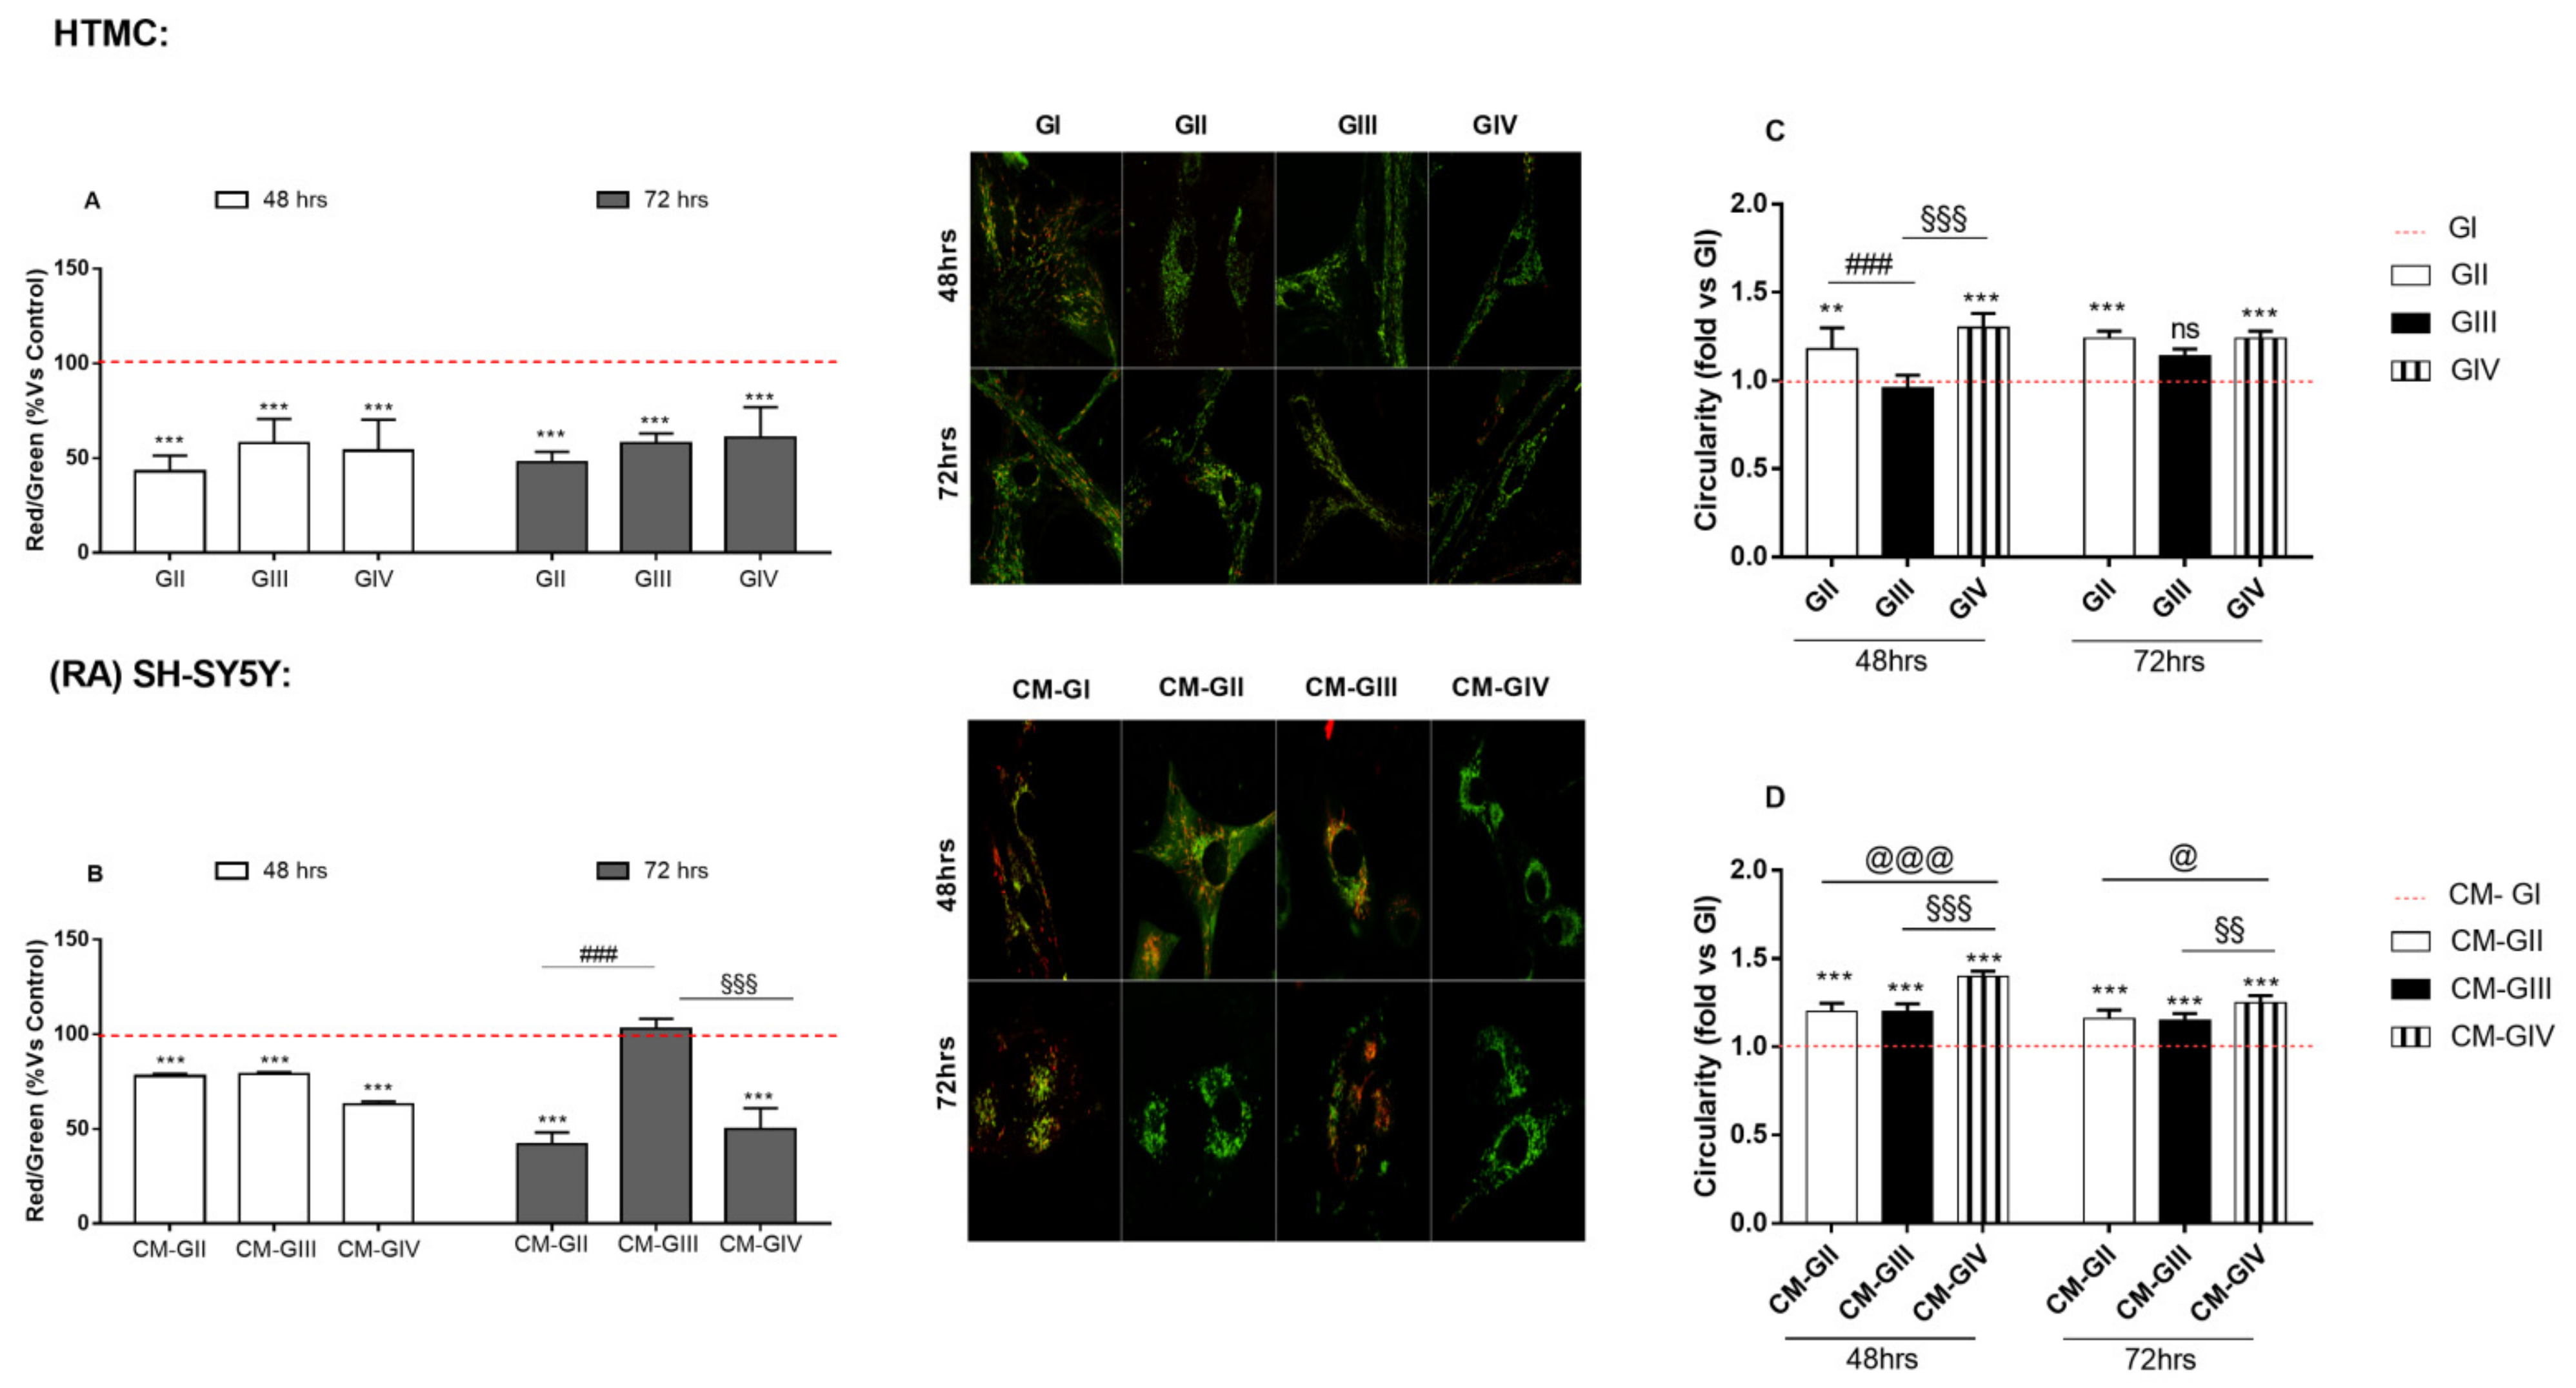
2.5. Mitochondrial Function
3. Discussion
4. Materials and Methods
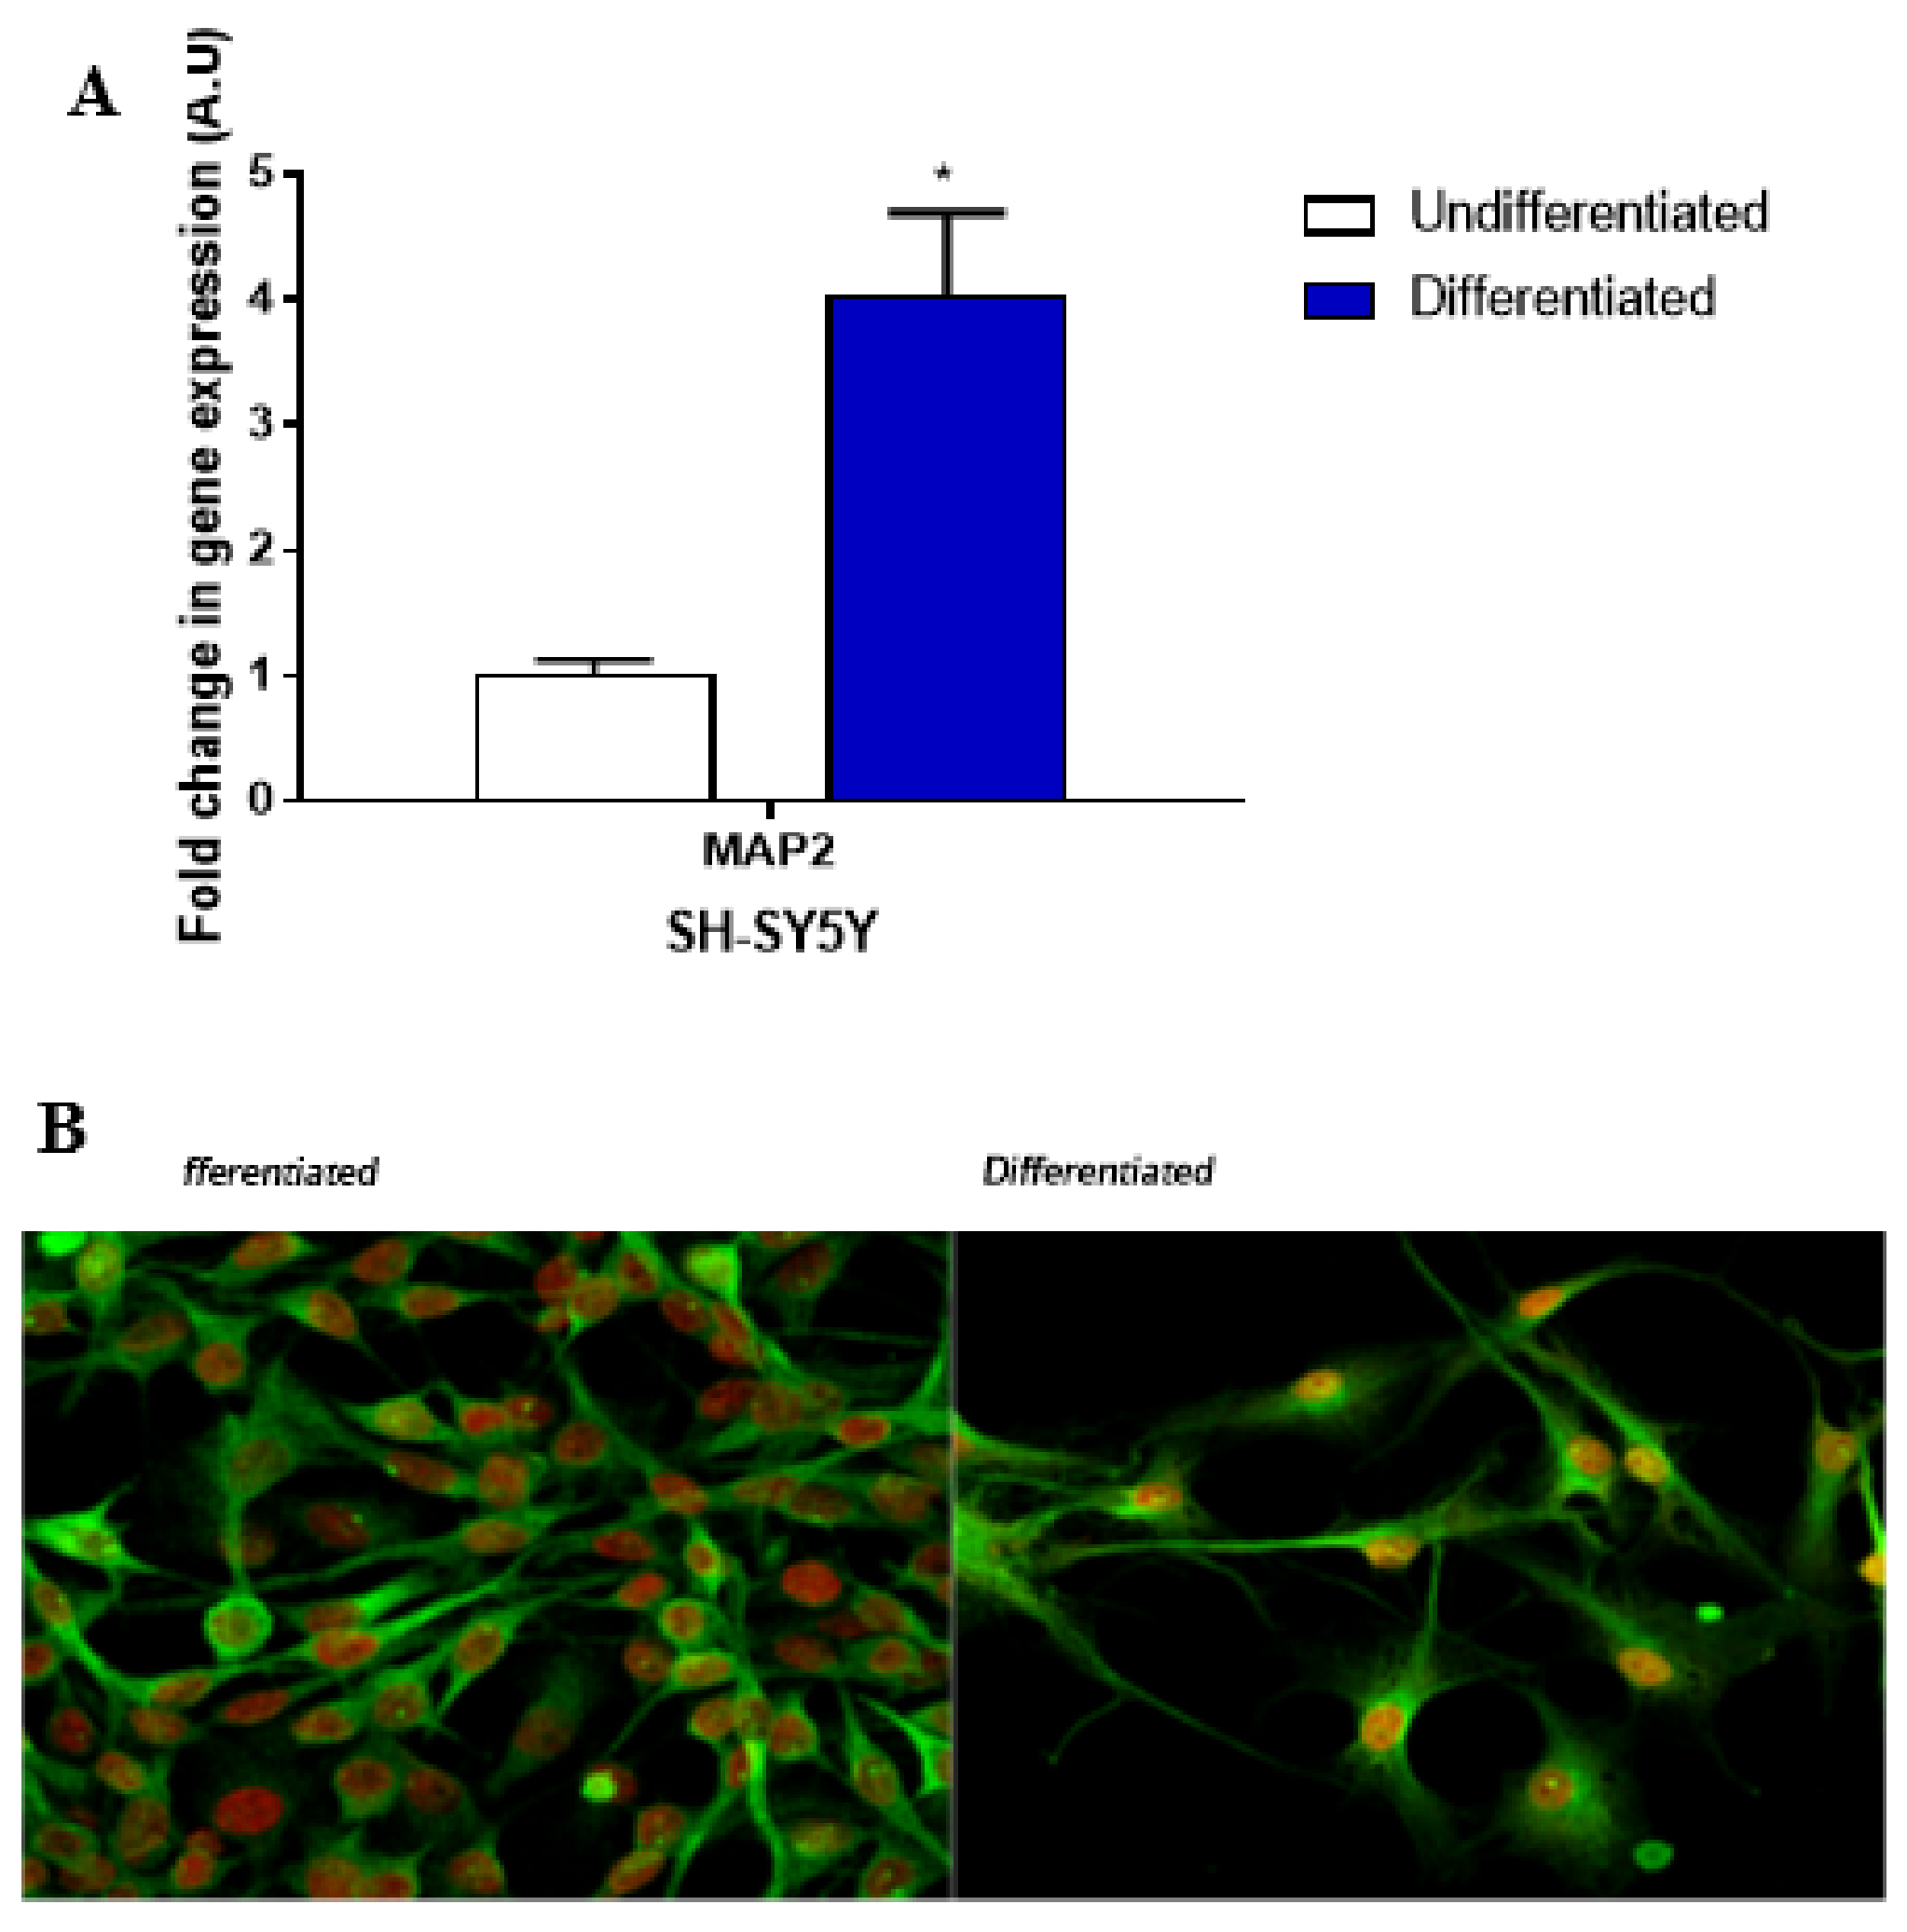
4.1. Cell Cultures
4.2. qPCR
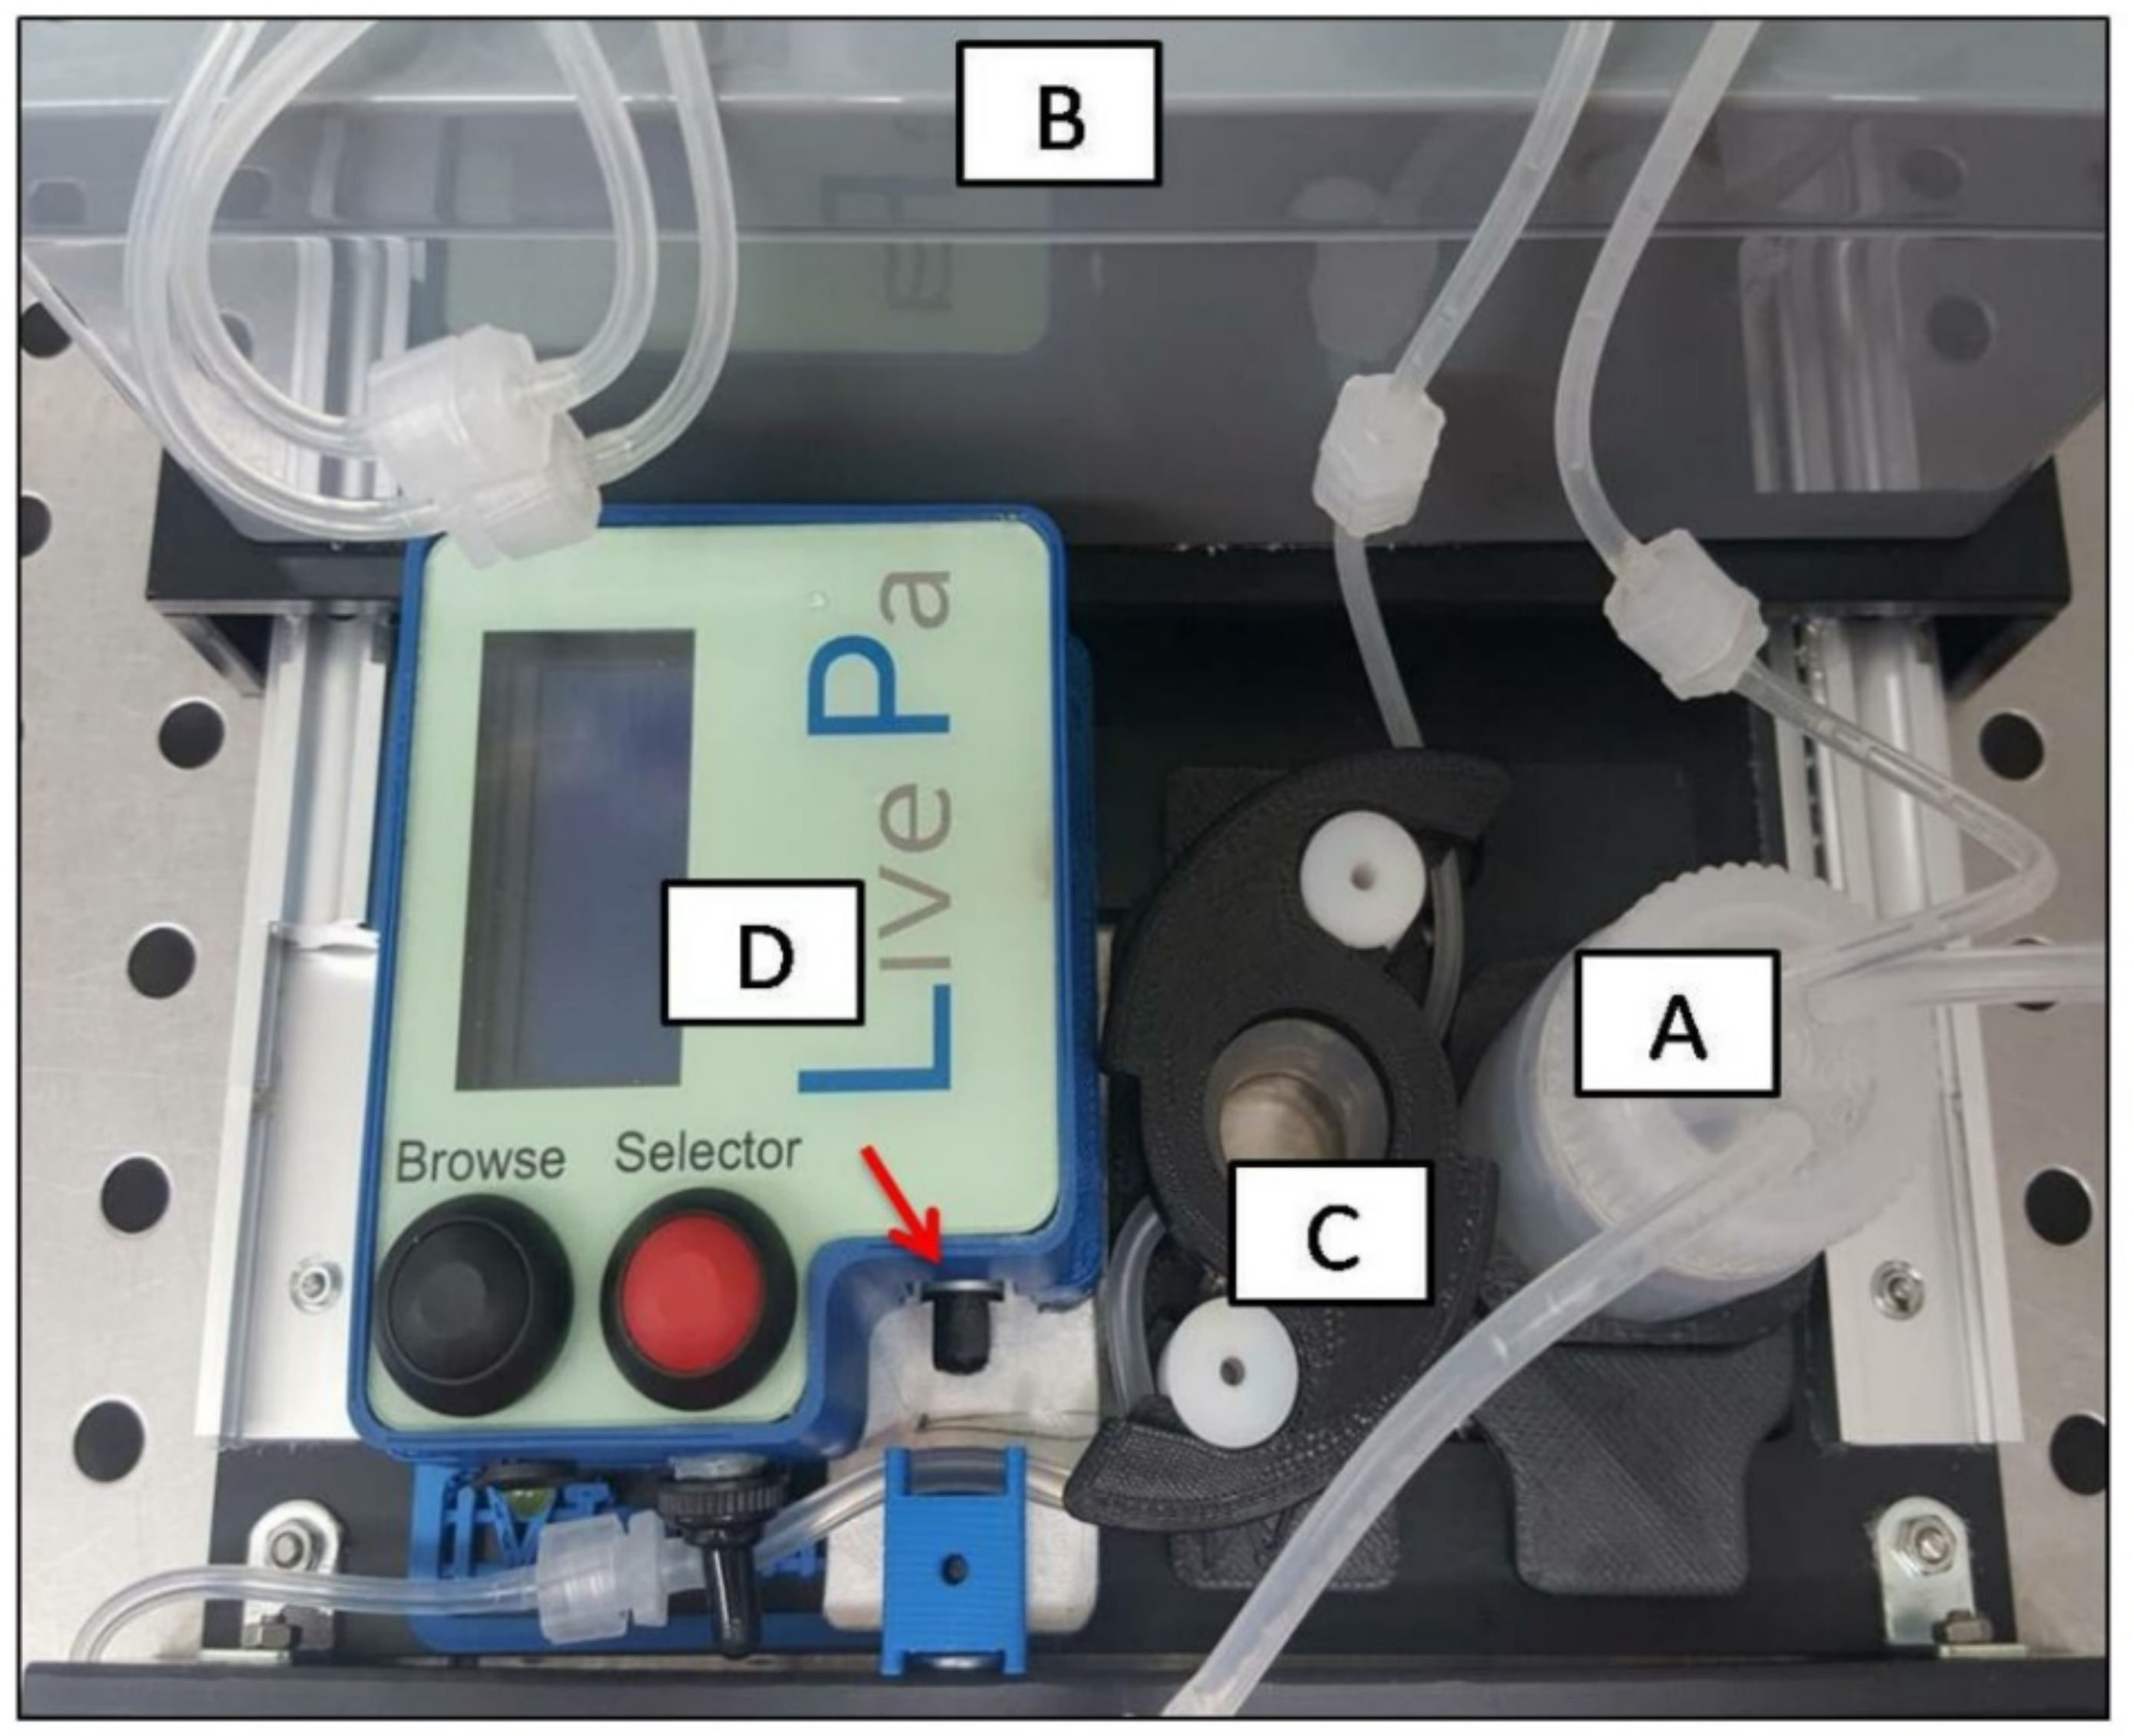
4.3. Dynamic 3D Culture Conditions
4.4. RA-SH-SY5Y Experimental Design: Effects of the HTMCConditioned Medium
4.5. Viability
4.6. Mitochondrial Transmembrane Potential Analysis with the JC-1 Fluorochrome
4.7. Mitochondria Function Analysis
4.8. Human Apoptosis Antibody Array C1
4.9. Annexin V
4.10. Confocal Analysis
4.11. Statistical Analysis
Author Contributions
Funding
Institutional Review Board Statement
Informed Consent Statement
Data Availability Statement
Acknowledgments
Conflicts of Interest
References
- Harasymowycz, P.; Birt, C.; Gooi, P.; Heckler, L.; Hutnik, C.; Jinapriya, D.; Shuba, L.; Yan, D.; Day, R. Medical Management of Glaucoma in the 21st Century from a Canadian Perspective. J. Ophthalmol. 2016, 2016, 1–22. [Google Scholar] [CrossRef] [Green Version]
- McMonnies, C.W. Glaucoma History and Risk Factors. J. Optom. 2017, 10, 71–78. [Google Scholar] [CrossRef] [PubMed] [Green Version]
- Calkins, D.J. Adaptive Responses to Neurodegenerative Stressin Glaucoma. Prog. Retin. Eye Res. 2021, 100953. [Google Scholar] [CrossRef] [PubMed]
- Shin, Y.J.; Kim, E.; Han, B.K.; Yi, K. Serum Biomarkers for the Diagnosis of Glaucoma. Diagnostics 2020, 11, 20. [Google Scholar] [CrossRef] [PubMed]
- Kuehn, M.H.; Vranka, J.A.; Wadkins, D.; Jackson, T.; Cheng, L.; Ledolter, J. Circumferential Trabecular Meshwork Cell Density in the Human Eye. Exp. Eye Res. 2021, 205, 108494. [Google Scholar] [CrossRef] [PubMed]
- Vernazza, S.; Tirendi, S.; Bassi, A.M.; Traverso, C.E.; Saccà, S.C. Neuroinflammation in Primary Open-Angle Glaucoma. JCM 2020, 9, 3172. [Google Scholar] [CrossRef]
- Saccà, S.C.; Gandolfi, S.; Bagnis, A.; Manni, G.; Damonte, G.; Traverso, C.E.; Izzotti, A. From DNA Damage to Functional Changes of the Trabecular Meshwork in Aging and Glaucoma. Ageing Res. Rev. 2016, 29, 26–41. [Google Scholar] [CrossRef]
- Yang, Q.; Li, Y.; Luo, L. Effect of Myricetin on Primary Open-Angle Glaucoma. Transl. Neurosci. 2018, 9, 132–141. [Google Scholar] [CrossRef] [PubMed]
- Kaur, C. Hypoxia-Ischemia and Retinal Ganglion Cell Damage. OPTH 2008, 2008, 879–889. [Google Scholar] [CrossRef] [PubMed] [Green Version]
- Zhang, Y.; Wu, N.; Li, Q.; Hu, X.; Wang, L.; Sun, J.-G.; Wang, Z.; Sun, X.-H. Neuroprotective effect of the somatostatin receptor 5 agonist L-817,818 on retinal ganglion cells in experimental glaucoma. Exp. Eye Res. 2021, 204, 108449. [Google Scholar] [CrossRef] [PubMed]
- Pease, M.E.; Zack, D.J.; Berlinicke, C.; Bloom, K.; Cone, F.; Wang, Y.; Klein, R.L.; Hauswirth, W.W.; Quigley, H.A. Effect of CNTF on Retinal Ganglion Cell Survivalin Experimental Glaucoma. Investig. Opthalmol. Vis. Sci. 2009, 50, 2194. [Google Scholar] [CrossRef] [PubMed] [Green Version]
- Cheung, Z.H.; So, K.-F.; Lu, Q.; Yip, H.K.; Wu, W.; Shan, J.J.; Pang, P.K.T.; Chen, C.-F. Enhanced Survival and Regeneration of Axotomized Retinal Ganglion Cells by a Mixture of Herbal Extracts. J. Neurotrauma 2002, 19, 369–378. [Google Scholar] [CrossRef] [PubMed] [Green Version]
- Krishnan, A.; Fei, F.; Jones, A.; Busto, P.; Marshak-Rothstein, A.; Ksander, B.R.; Gregory-Ksander, M. Overexpression of Soluble Fas Ligand Following Adeno-Associated Virus Gene Therapy Prevents Retinal Ganglion Cell Deathin Chronic and Acute Murine Models of Glaucoma. J. Immunol. 2016, 197, 4626–4638. [Google Scholar] [CrossRef] [PubMed] [Green Version]
- Kim, S.-Y.; Kwak, J.-S.; Shin, J.-P.; Lee, S.-H. The Protection of the Retina from Ischemic Injury by the Free Radical Scavenger EGb761 and Zincin the Cat Retina. Ophthalmologica 1998, 212, 268–274. [Google Scholar] [CrossRef] [PubMed]
- Weinreb, R.N.; Liebmann, J.M.; Cioffi, G.A.; Goldberg, I.; Brandt, J.D.; Johnson, C.A.; Zangwill, L.M.; Schneider, S.; Badger, H.; Bejanian, M. Oral Memantine for the Treatment of Glaucoma: Design and Results of 2 Randomized, Placebo-Controlled, Phase 3 Studies. Ophthalmology 2018, 125, 1874–1885. [Google Scholar] [CrossRef] [PubMed] [Green Version]
- Cordeiro, M.F.; Levin, L.A. Clinical Evidence for Neuroprotectionin Glaucoma. Am. J. Ophthalmol. 2011, 152, 715–716. [Google Scholar] [CrossRef] [Green Version]
- Khatib, T.Z.; Martin, K.R. Neuroprotection in Glaucoma: Towards Clinical Trials and Precision Medicine. Curr. EyeRes. 2020, 45, 327–338. [Google Scholar] [CrossRef] [PubMed] [Green Version]
- Hall, W.; Carter, A.; Forlini, C. The Brain Disease Model of Addiction: Is It Supported by the Evidenceand Has It Delivered on Its Promises? Lancet Psychiatry 2015, 2, 105–110. [Google Scholar] [CrossRef] [Green Version]
- Tannenbaum, J.; Bennett, B.T. Russell and Burch’s 3Rs Then and Now:The Need for Clarity in Definition and Purpose. J. Am. Assoc. Lab. Anim. Sci. 2015, 54, 120–132. [Google Scholar] [PubMed]
- Haycock, J.W. 3D Cell Culture: A Review of Current Approaches and Techniques. In 3D Cell Culture; Haycock, J.W., Ed.; Methods in Molecular Biology; Humana Press: Totowa, NJ, USA, 2011; Volume 695, pp. 1–15. ISBN 978-1-60761-983-3. [Google Scholar]
- Chaicharoenaudomrung, N.; Kunhorm, P.; Noisa, P. Three-Dimensional Cell Culture Systems as an In Vitro Platformf or Cancer and Stem Cell Modeling. World J. Stem Cells 2019, 11, 1065–1083. [Google Scholar] [CrossRef] [PubMed]
- Bouchemi, M.; Roubeix, C.; Kessal, K.; Riancho, L.; Raveu, A.-L.; Soualmia, H.; Baudouin, C.; Brignole-Baudouin, F. Effect of Benzalkonium Chloride on Trabecular Meshwork Cells in a New in Vitro 3D Trabecular Meshwork Model for Glaucoma. Toxicol. Vitr. 2017, 41, 21–29. [Google Scholar] [CrossRef] [PubMed]
- Vernazza, S.; Tirendi, S.; Scarfì, S.; Passalacqua, M.; Oddone, F.; Traverso, C.E.; Rizzato, I.; Bassi, A.M.; Saccà, S.C. 2D- and 3D-Cultures of Human Trabecular Meshwork Cells: A Preliminary Assessment of an in Vitro Model for Glaucoma Study. PLoS ONE 2019, 14, e0221942. [Google Scholar] [CrossRef]
- Osmond, M.; Bernier, S.M.; Pantcheva, M.B.; Krebs, M.D. Collagen and Collagen-Chondroit in Sulfate Scaffolds with Uniaxially Aligned Pores for the Biomimetic, Three Dimensional Culture of Trabecular Meshwork Cells: Trabecular Meshwork Cell Culture Scaffolds. Biotechnol. Bioeng. 2017, 114, 915–923. [Google Scholar] [CrossRef] [PubMed]
- Torrejon, K.Y.; Papke, E.L.; Halman, J.R.; Stolwijk, J.; Dautriche, C.N.; Bergkvist, M.; Danias, J.; Sharfstein, S.T.; Xie, Y. Bioengineered Glaucomatous 3D Human Trabecular Meshworkas an in Vitro Disease Model: Steroid-Induced Glaucomatous 3D HTM Model. Biotechnol. Bioeng. 2016, 113, 1357–1368. [Google Scholar] [CrossRef] [PubMed] [Green Version]
- Saccà, S.C.; Tirendi, S.; Scarfì, S.; Passalacqua, M.; Oddone, F.; Traverso, C.E.; Vernazza, S.; Bassi, A.M. An Advanced in Vitro Model to Assess Glaucoma Onset. ALTEX 2020, 37, 265–274. [Google Scholar] [CrossRef] [PubMed]
- Felder, M.L.; Simmons, A.D.; Shambaugh, R.L.; Sikavitsas, V.I. Effects of Flow Rateon Mesenchymal Stem Cell Oxygen Consumption Rates in 3D Bone-Tissue-Engineered Constructs Cultured in Perfusion Bioreactor Systems. Fluids 2020, 5, 30. [Google Scholar] [CrossRef] [Green Version]
- Saccà, S.C.; Izzotti, A.; Vernazza, S.; Tirendi, S.; Scarfì, S.; Gandolfi, S.; Bassi, A.M. Can Polyphenols in Eye Drops Be Useful for Trabecular Protection from Oxidative Damage? JCM 2020, 9, 3584. [Google Scholar] [CrossRef] [PubMed]
- Krishnan-Sivadoss, I.; Mijares-Rojas, I.A.; Villarreal-Leal, R.A.; Torre-Amione, G.; Knowlton, A.A.; Guerrero-Beltrán, C.E. Heat Shock Protein 60 and Cardiovascular Diseases: An Intricate Love-hate Story. Med. Res. Rev. 2021, 41, 29–71. [Google Scholar] [CrossRef]
- Lee, S.; VanBergen, N.J.; Kong, G.Y.; Chrysostomou, V.; Waugh, H.S.; O’Neill, E.C.; Crowston, J.G.; Trounce, I.A. Mitochondrial Dysfunction in Glaucoma and Emerging Bioenergetic Therapies. Exp. EyeRes. 2011, 93, 204–212. [Google Scholar] [CrossRef]
- HvozdaArana, A.G.; LasagniVitar, R.M.; Reides, C.G.; Calabró, V.; Marchini, T.; Lerner, S.F.; Evelson, P.A.; Ferreira, S.M. Mitochondrial Function Is Impaired in the Primary Visual Cortexin an Experimental Glaucoma Model. Arch. Biochem. Biophys. 2021, 701, 108815. [Google Scholar] [CrossRef]
- Kong, G.Y.X.; VanBergen, N.J.; Trounce, I.A.; Crowston, J.G. Mitochondrial Dysfunction and Glaucoma. J. Glaucoma 2009, 18, 93–100. [Google Scholar] [CrossRef] [PubMed]
- Susanna, R.; Moraes, C.G.D.; Cioffi, G.A.; Ritch, R. Why Do People (Still) Go Blind from Glaucoma? Trans. Vis. Sci. Technol. 2015, 4, 1. [Google Scholar] [CrossRef] [PubMed] [Green Version]
- Quaranta, L.; Bruttini, C.; Micheletti, E.; Konstas, A.G.P.; Michelessi, M.; Oddone, F.; Katsanos, A.; Sbardella, D.; De Angelis, G.; Riva, I. Glaucoma and Neuroinflammation: An Overview. Surv. Ophthalmol. 2021, 27, R713–R715. [Google Scholar] [CrossRef]
- Beykin, G.; Norcia, A.M.; Srinivasan, V.J.; Dubra, A.; Goldberg, J.L. Discovery and Clinical Translation of Novel Glaucoma Biomarkers. Prog. Retin. Eye Res. 2021, 80, 100875. [Google Scholar] [CrossRef] [PubMed]
- Keller, K.E.; Bhattacharya, S.K.; Borrás, T.; Brunner, T.M.; Chansangpetch, S.; Clark, A.F.; Dismuke, W.M.; Du, Y.; Elliott, M.H.; Ethier, C.R.; et al. Consensus Recommendations for TrabecularMeshwork Cell Isolation, Characterization and Culture. Exp. Eye Res. 2018, 171, 164–173. [Google Scholar] [CrossRef] [PubMed]
- Nitti, M.; Furfaro, A.L.; Cevasco, C.; Traverso, N.; Marinari, U.M.; Pronzato, M.A.; Domenicotti, C. PKC Delta and NADPH Oxidase in Retinoic Acid-Induced Neuroblastoma Cell Differentiation. Cell. Signal. 2010, 22, 828–835. [Google Scholar] [CrossRef] [PubMed]
- Poehlmann, A.; Reissig, K.; Schönfeld, P.; Walluscheck, D.; Schinlauer, A.; Hartig, R.; Lessel, W.; Guenther, T.; Silver, A.; Roessner, A. Repeated H2O2 Exposure Drives Cell Cycle Progression in an inVitro Model of Ulcerative Colitis. J. Cell. Mol. Med. 2013, 17, 1619–1631. [Google Scholar] [CrossRef] [PubMed]
- Kaczara, P.; Sarna, T.; Burke, J.M. Dynamics of H2O2 Availability to ARPE-19 Cultures in Models of Oxidative Stress. FreeRadic. Biol. Med. 2010, 48, 1064–1070. [Google Scholar] [CrossRef] [PubMed] [Green Version]


| Gene | Gene Bank | Forward | Reverse |
|---|---|---|---|
| MAP2 | NM_002374. 3 | TGCCATCTTGGTGCCGA | CTTGACATTACCACCTCCAGGT |
| HPRT | NM_000194. 3 | GGTCAGGCAGTATAATCCAAAG | TTCATTATAGTCAAGGGCATATCC |
Publisher’s Note: MDPI stays neutral with regard to jurisdictional claims in published maps and institutional affiliations. |
© 2021 by the authors. Licensee MDPI, Basel, Switzerland. This article is an open access article distributed under the terms and conditions of the Creative Commons Attribution (CC BY) license (https://creativecommons.org/licenses/by/4.0/).
Share and Cite
Vernazza, S.; Tirendi, S.; Passalacqua, M.; Piacente, F.; Scarfì, S.; Oddone, F.; Bassi, A.M. An Innovative In Vitro Open-Angle Glaucoma Model (IVOM) Shows Changes Induced by Increased Ocular Pressure and Oxidative Stress. Int. J. Mol. Sci. 2021, 22, 12129. https://doi.org/10.3390/ijms222212129
Vernazza S, Tirendi S, Passalacqua M, Piacente F, Scarfì S, Oddone F, Bassi AM. An Innovative In Vitro Open-Angle Glaucoma Model (IVOM) Shows Changes Induced by Increased Ocular Pressure and Oxidative Stress. International Journal of Molecular Sciences. 2021; 22(22):12129. https://doi.org/10.3390/ijms222212129
Chicago/Turabian StyleVernazza, Stefania, Sara Tirendi, Mario Passalacqua, Francesco Piacente, Sonia Scarfì, Francesco Oddone, and Anna Maria Bassi. 2021. "An Innovative In Vitro Open-Angle Glaucoma Model (IVOM) Shows Changes Induced by Increased Ocular Pressure and Oxidative Stress" International Journal of Molecular Sciences 22, no. 22: 12129. https://doi.org/10.3390/ijms222212129
APA StyleVernazza, S., Tirendi, S., Passalacqua, M., Piacente, F., Scarfì, S., Oddone, F., & Bassi, A. M. (2021). An Innovative In Vitro Open-Angle Glaucoma Model (IVOM) Shows Changes Induced by Increased Ocular Pressure and Oxidative Stress. International Journal of Molecular Sciences, 22(22), 12129. https://doi.org/10.3390/ijms222212129