
Model Identifies Genetic Predisposition of Alzheimer’s Disease as Key Decider in Cell Susceptibility to Stress


 ,
,  and
and
Abstract
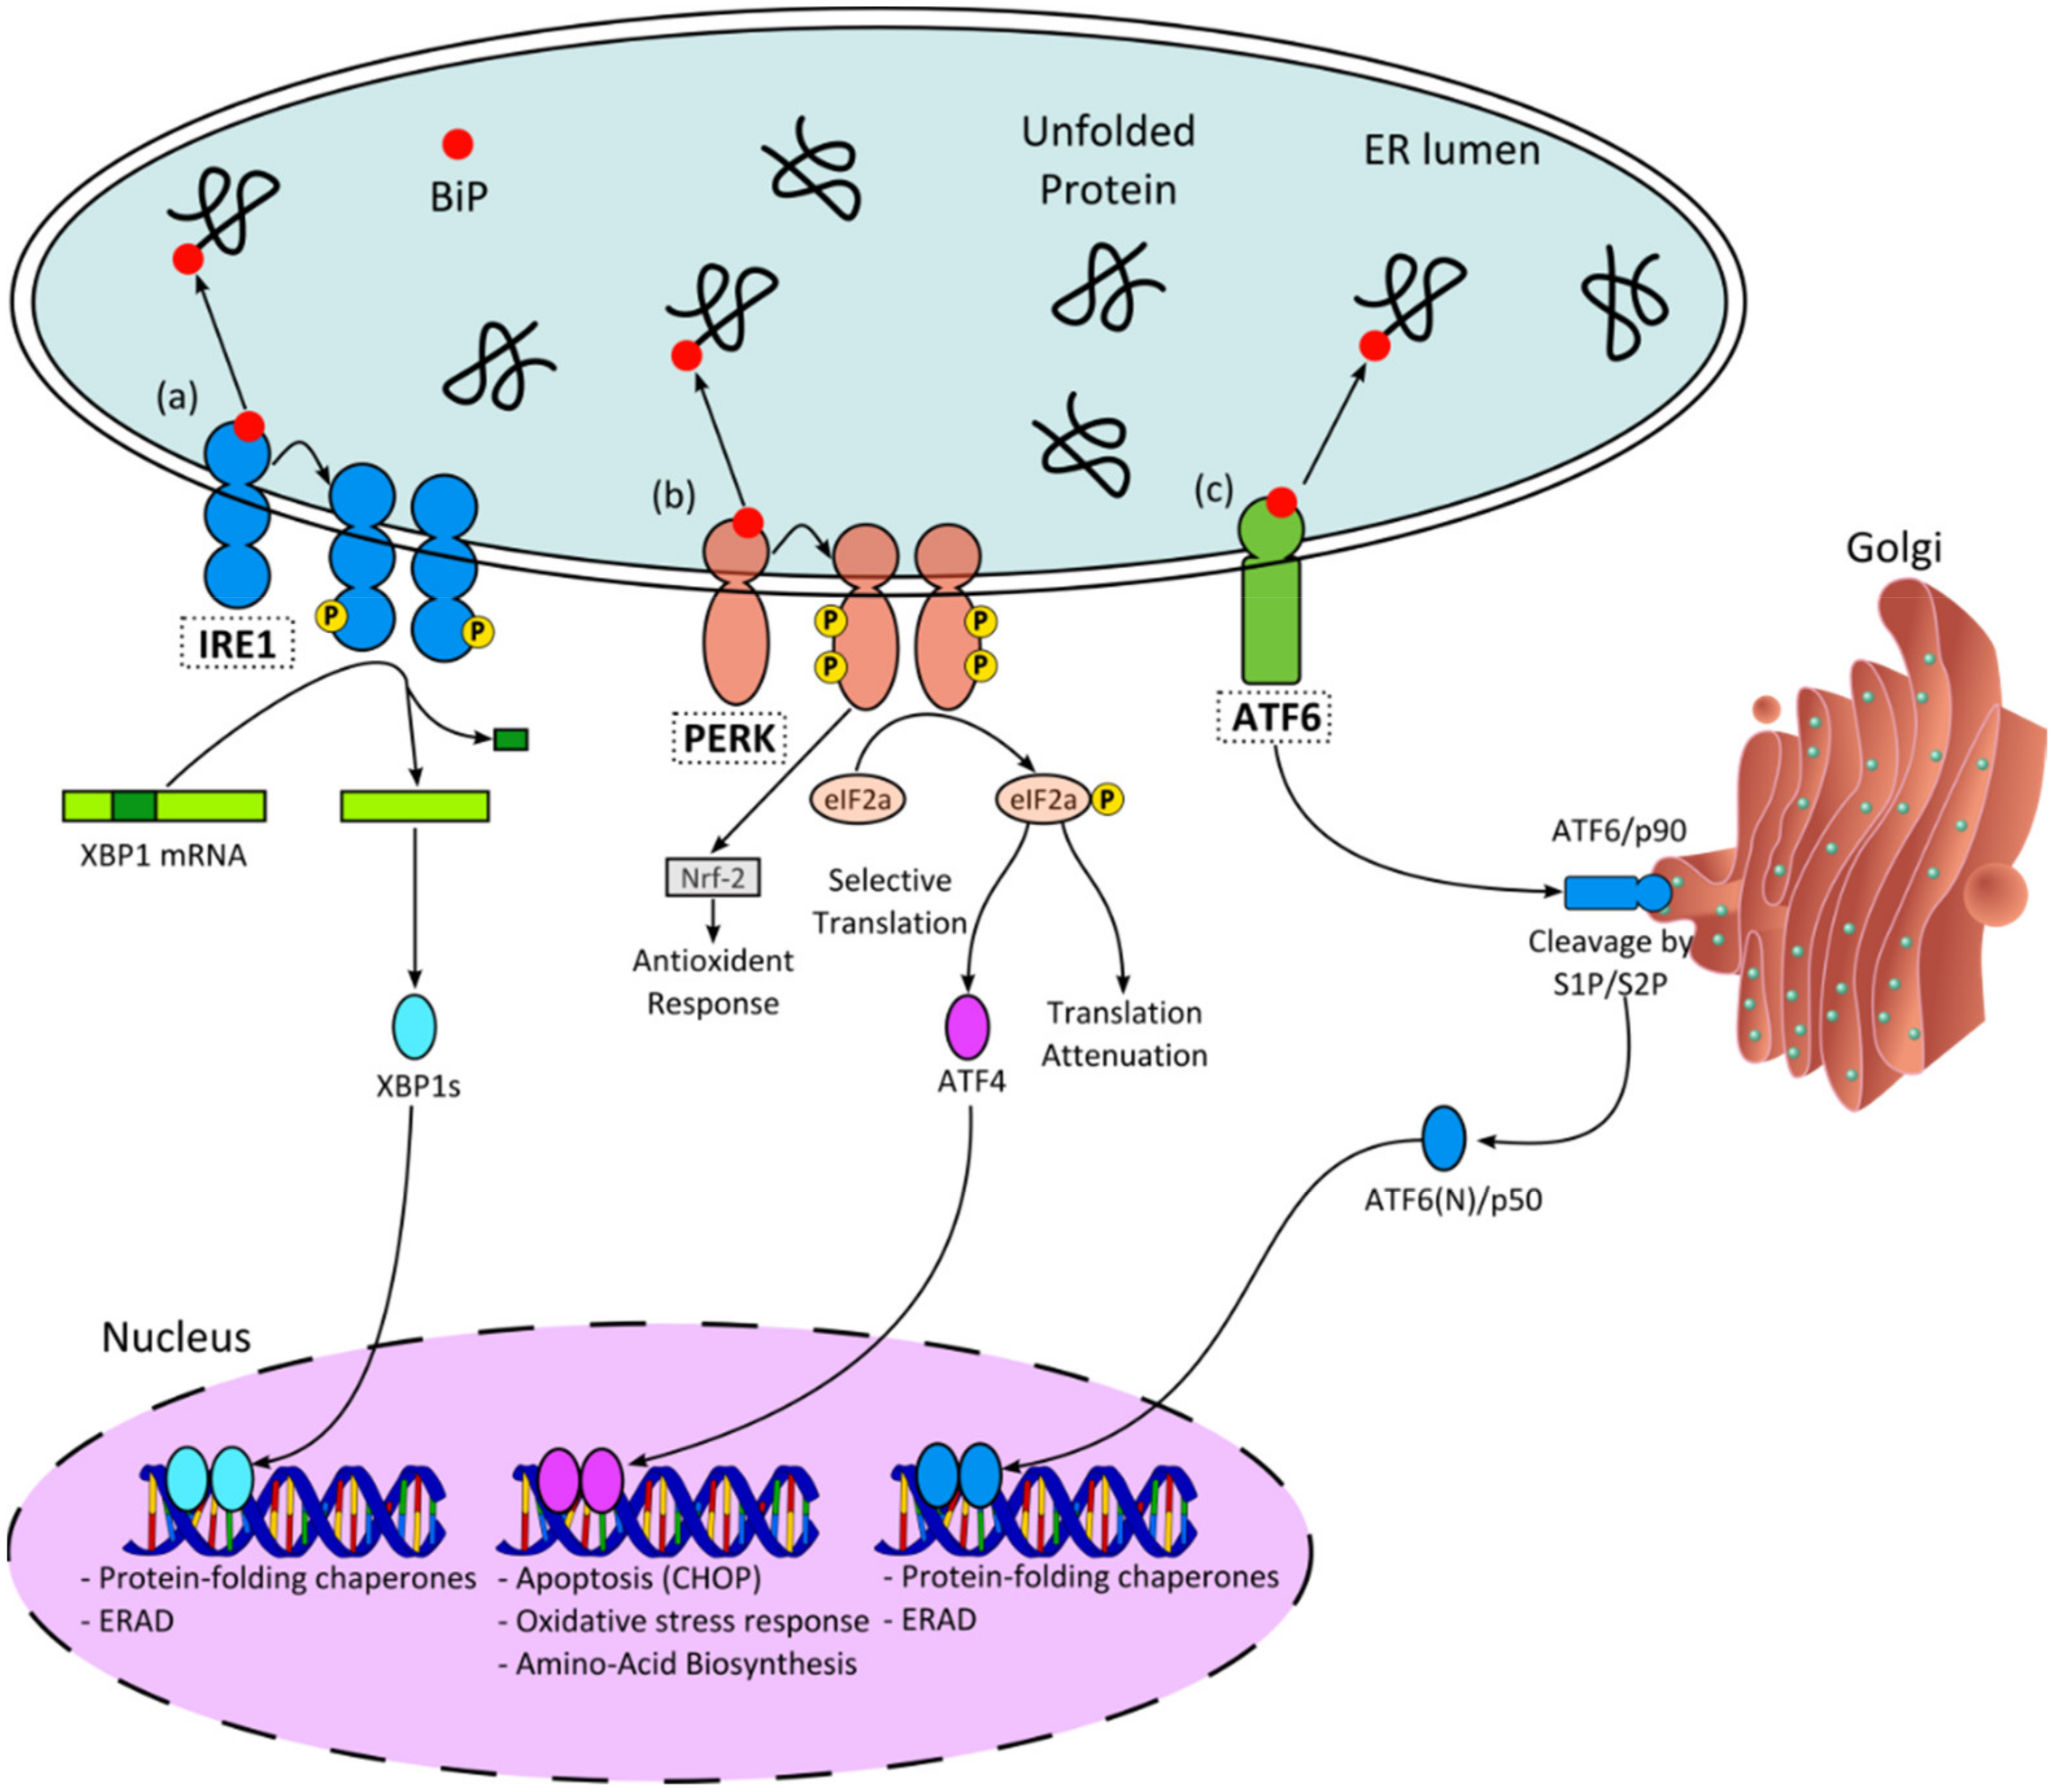
:1. Introduction
2. Results
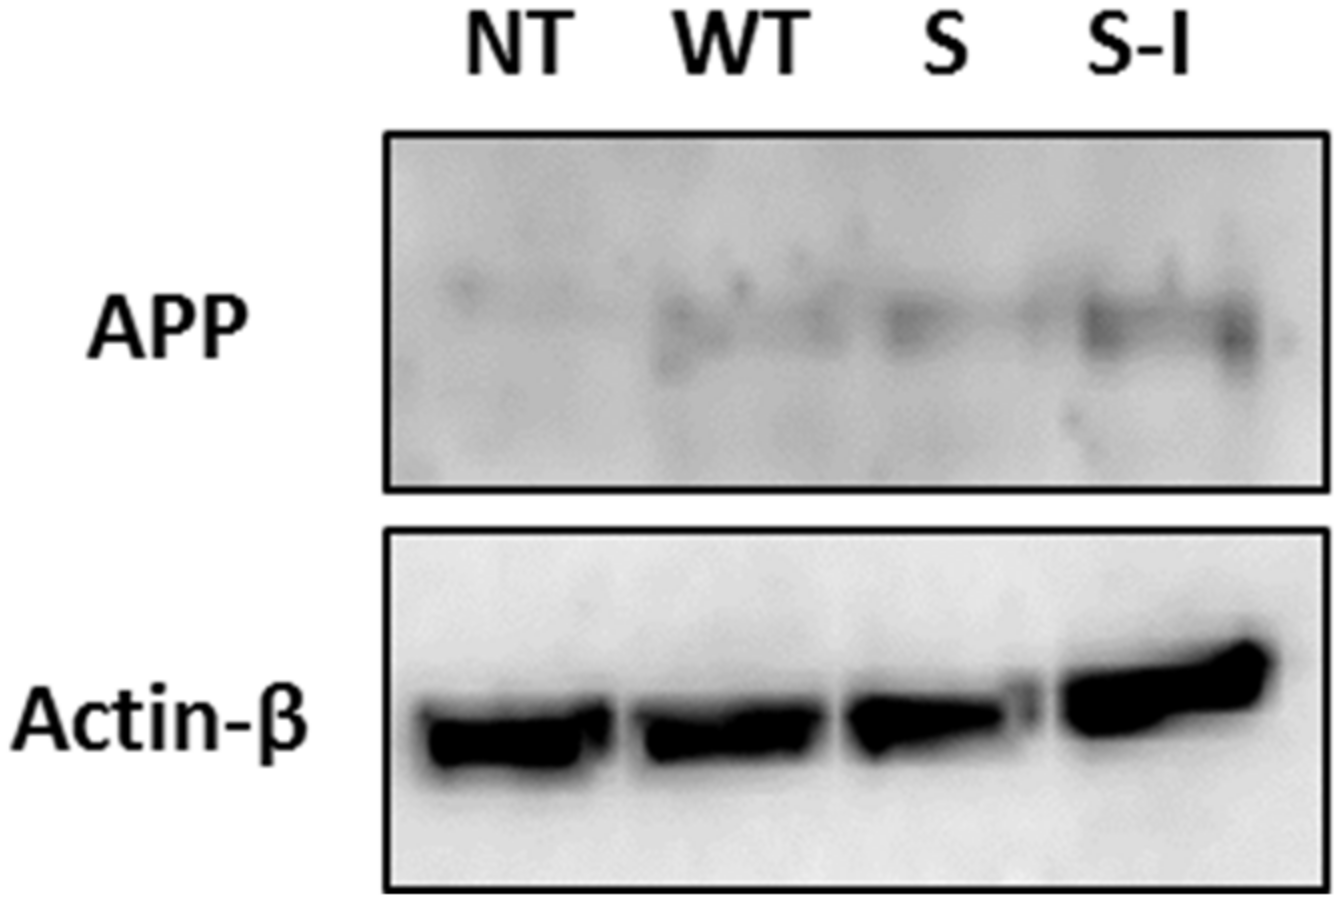
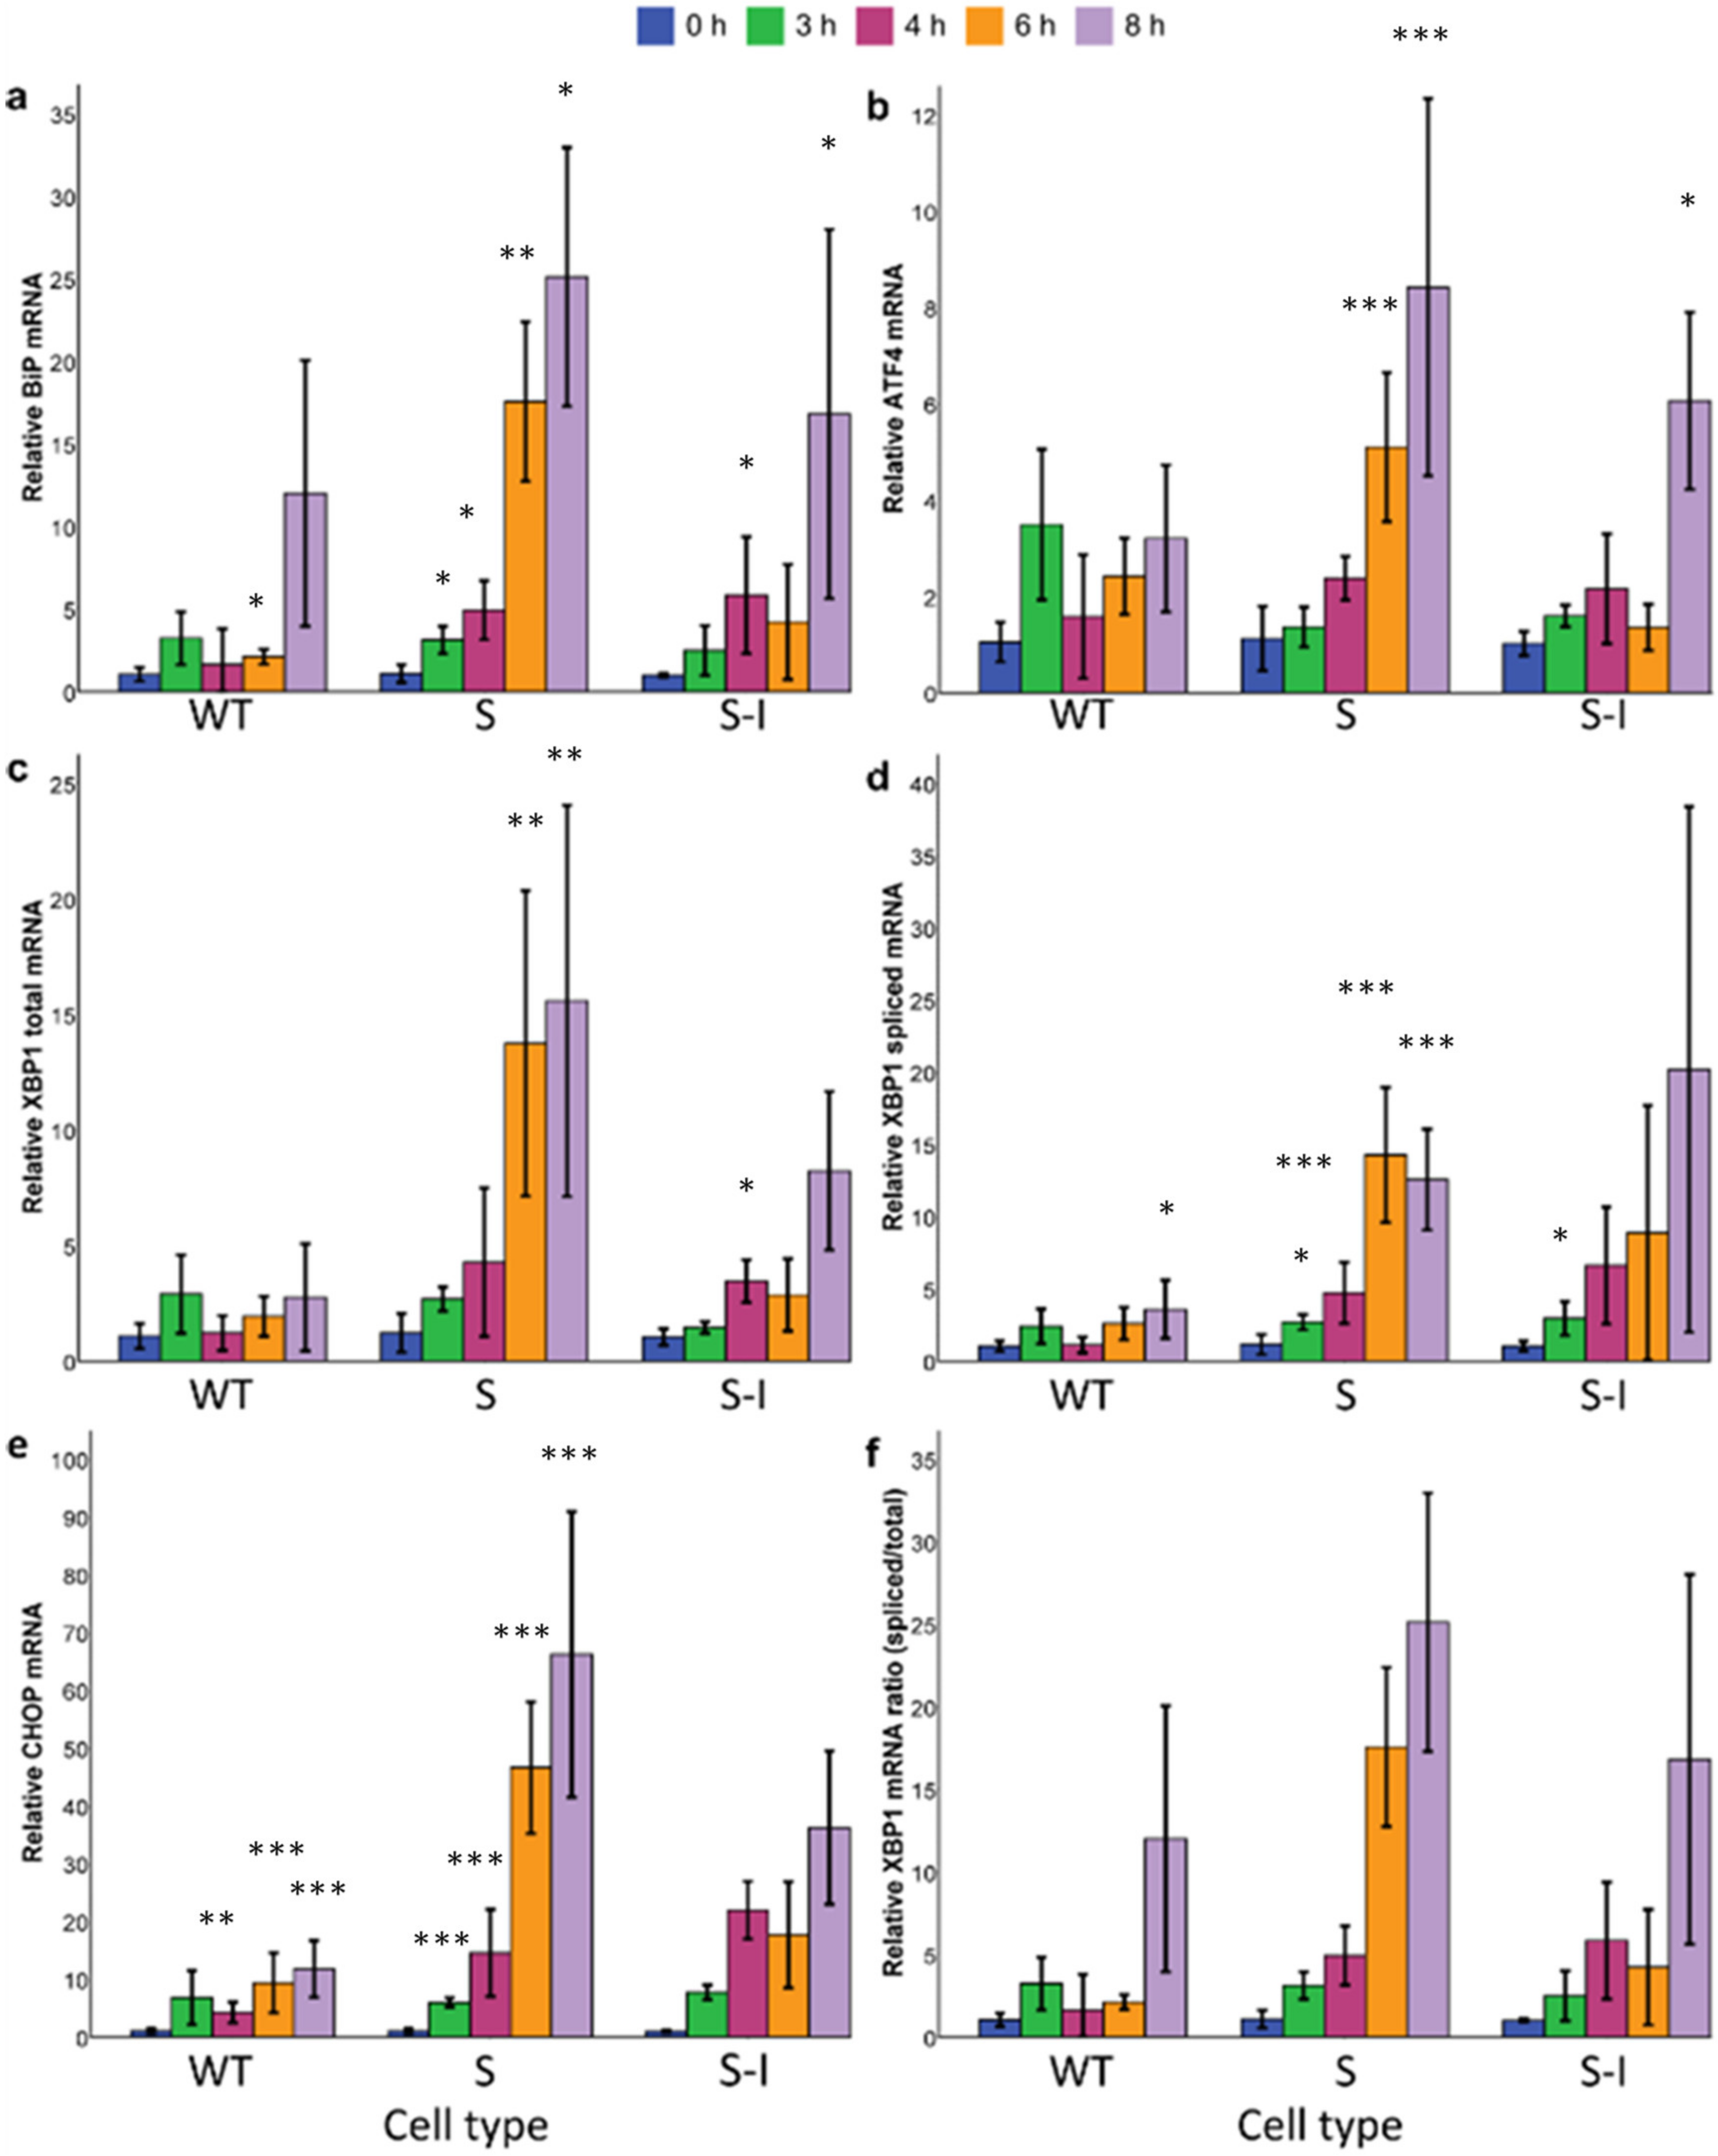
2.1. Mutations in APP Associated with FAD Lead to Different Magnitude of ER Stress Response Signalling
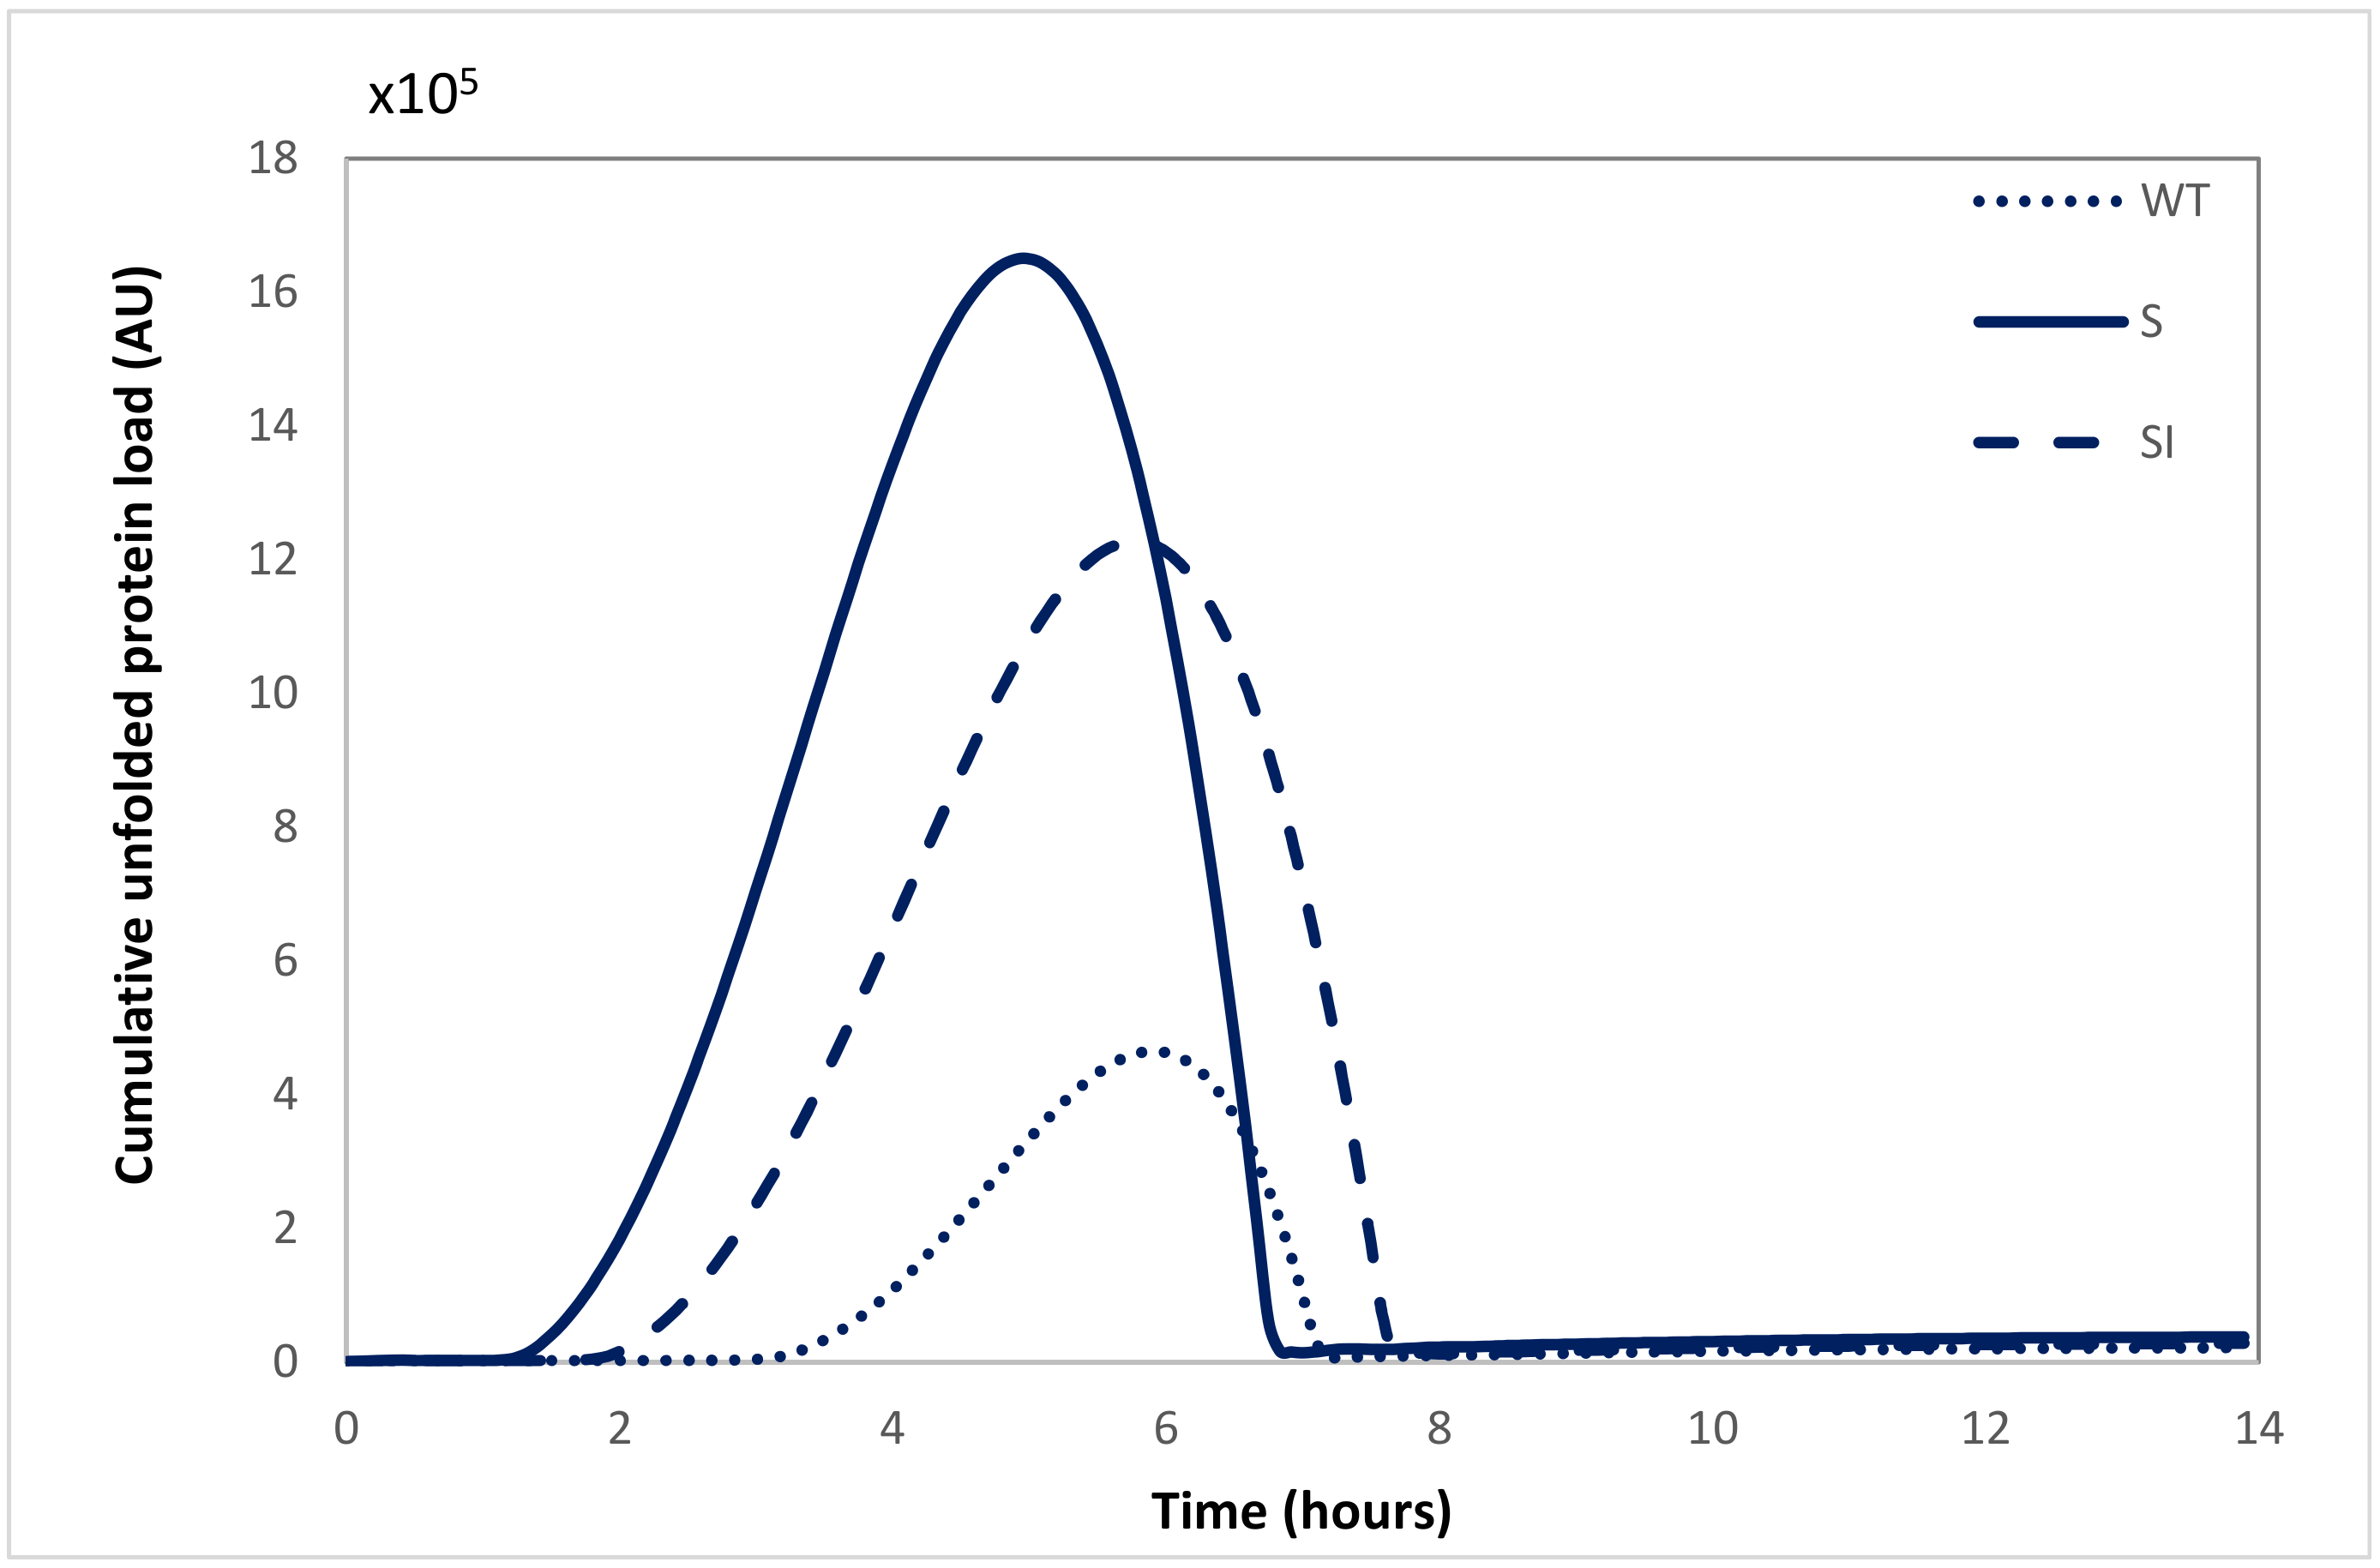
2.2. Model-Based Comparison of Protein Load and UPR Kinetics for Wild-Type and Mutant APP Cell Lines Suggests Mutant APP Cell Lines Have a Higher Load of Unfolded Proteins and a Larger Transcriptional Response
2.3. The Computational Model Can Be Used as a Basis to Explore Treatments In Silico
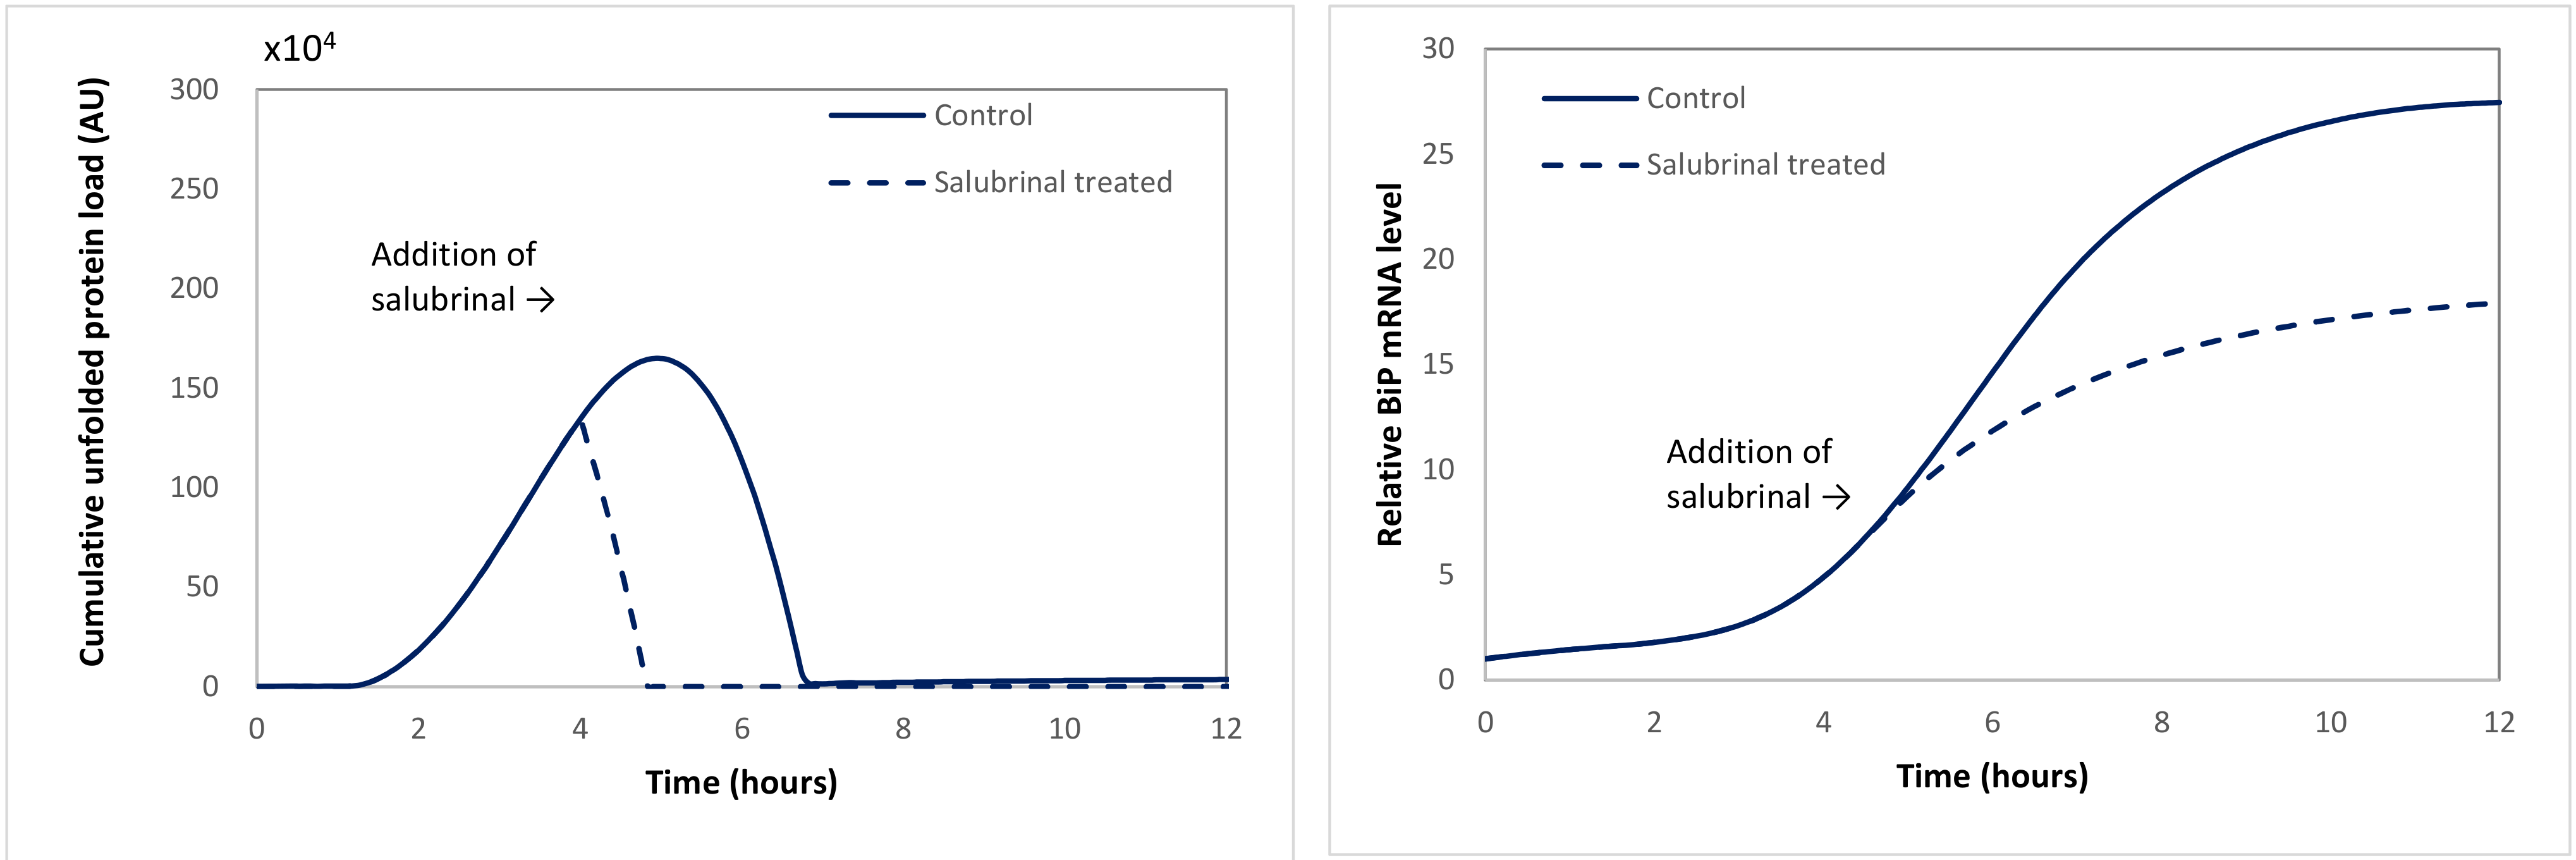
2.3.1. Case Study 1: Salubrinal Is Able to Quench Stress by Attenuating the Level of Unfolded Proteins
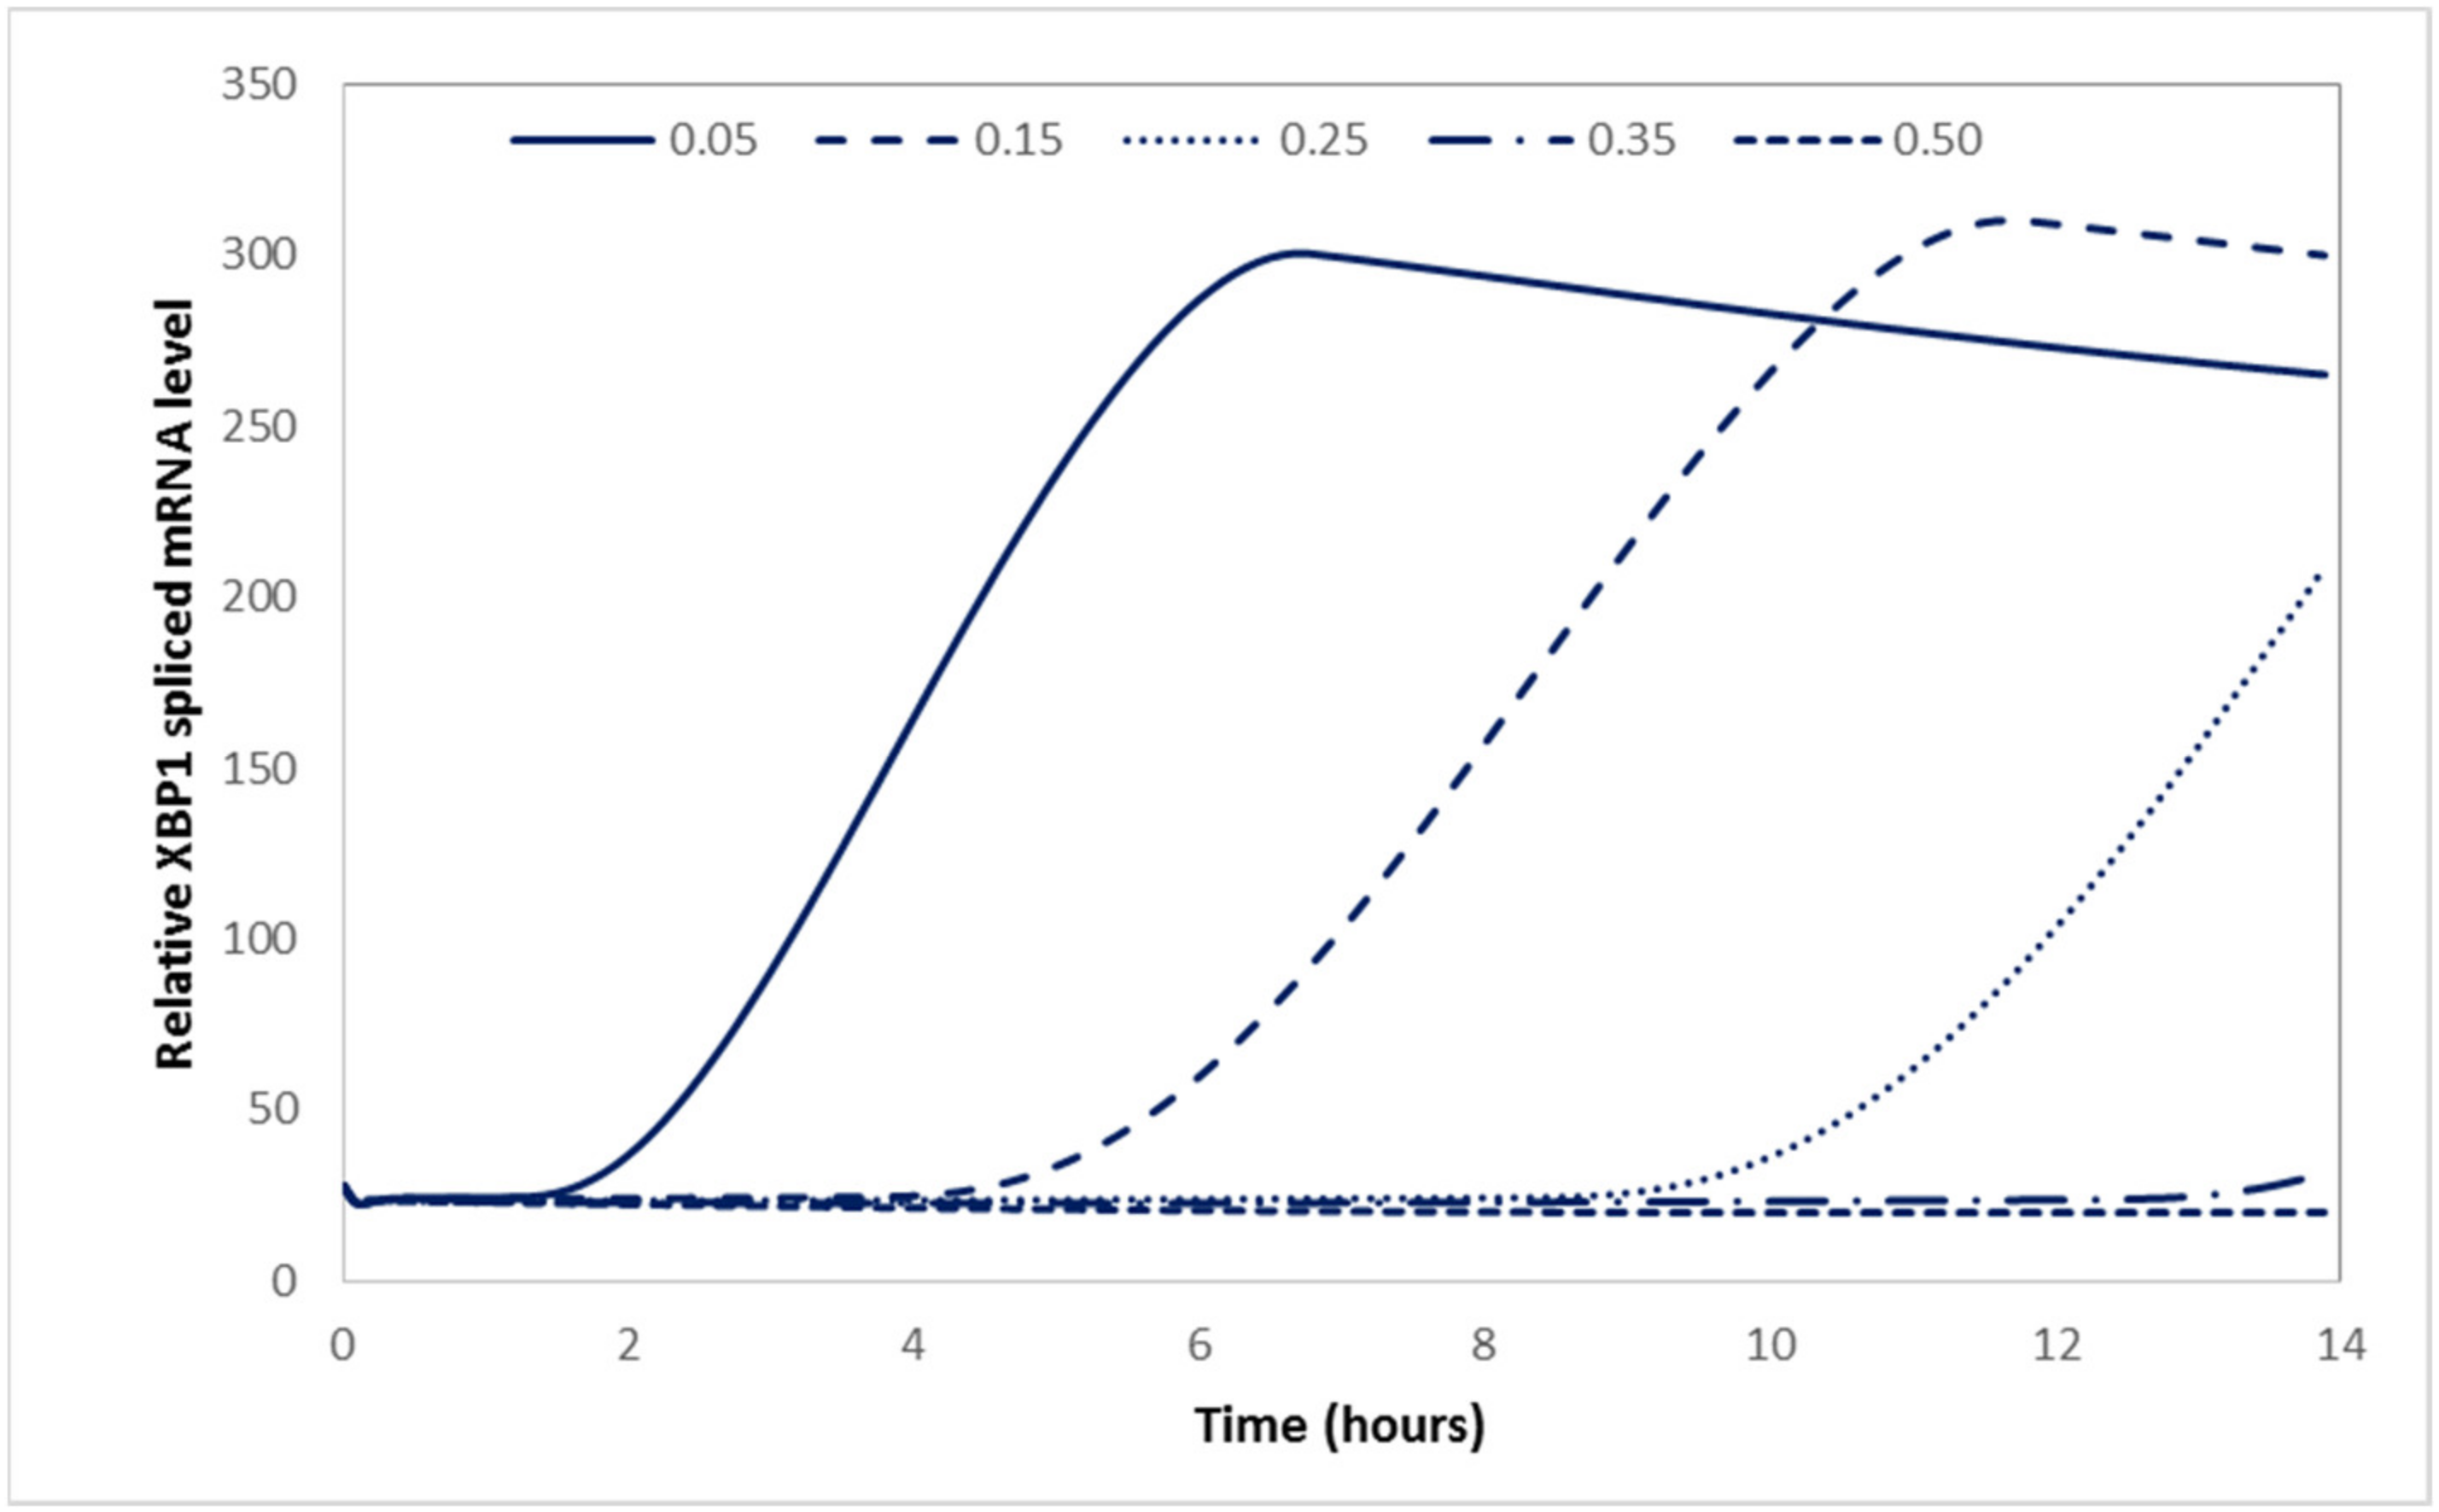
2.3.2. Case Study 2: The Reported Biological Effects of Lithium and Valproate Can Be Captured within Our Model System
3. Discussion
4. Materials and Methods
4.1. Cell Culture
4.2. Constructs of Mutant APP695
4.3. Generation of Stable Cell Lines
4.4. SDS-PAGE and Western Blotting
4.5. Stress Induction Protocol
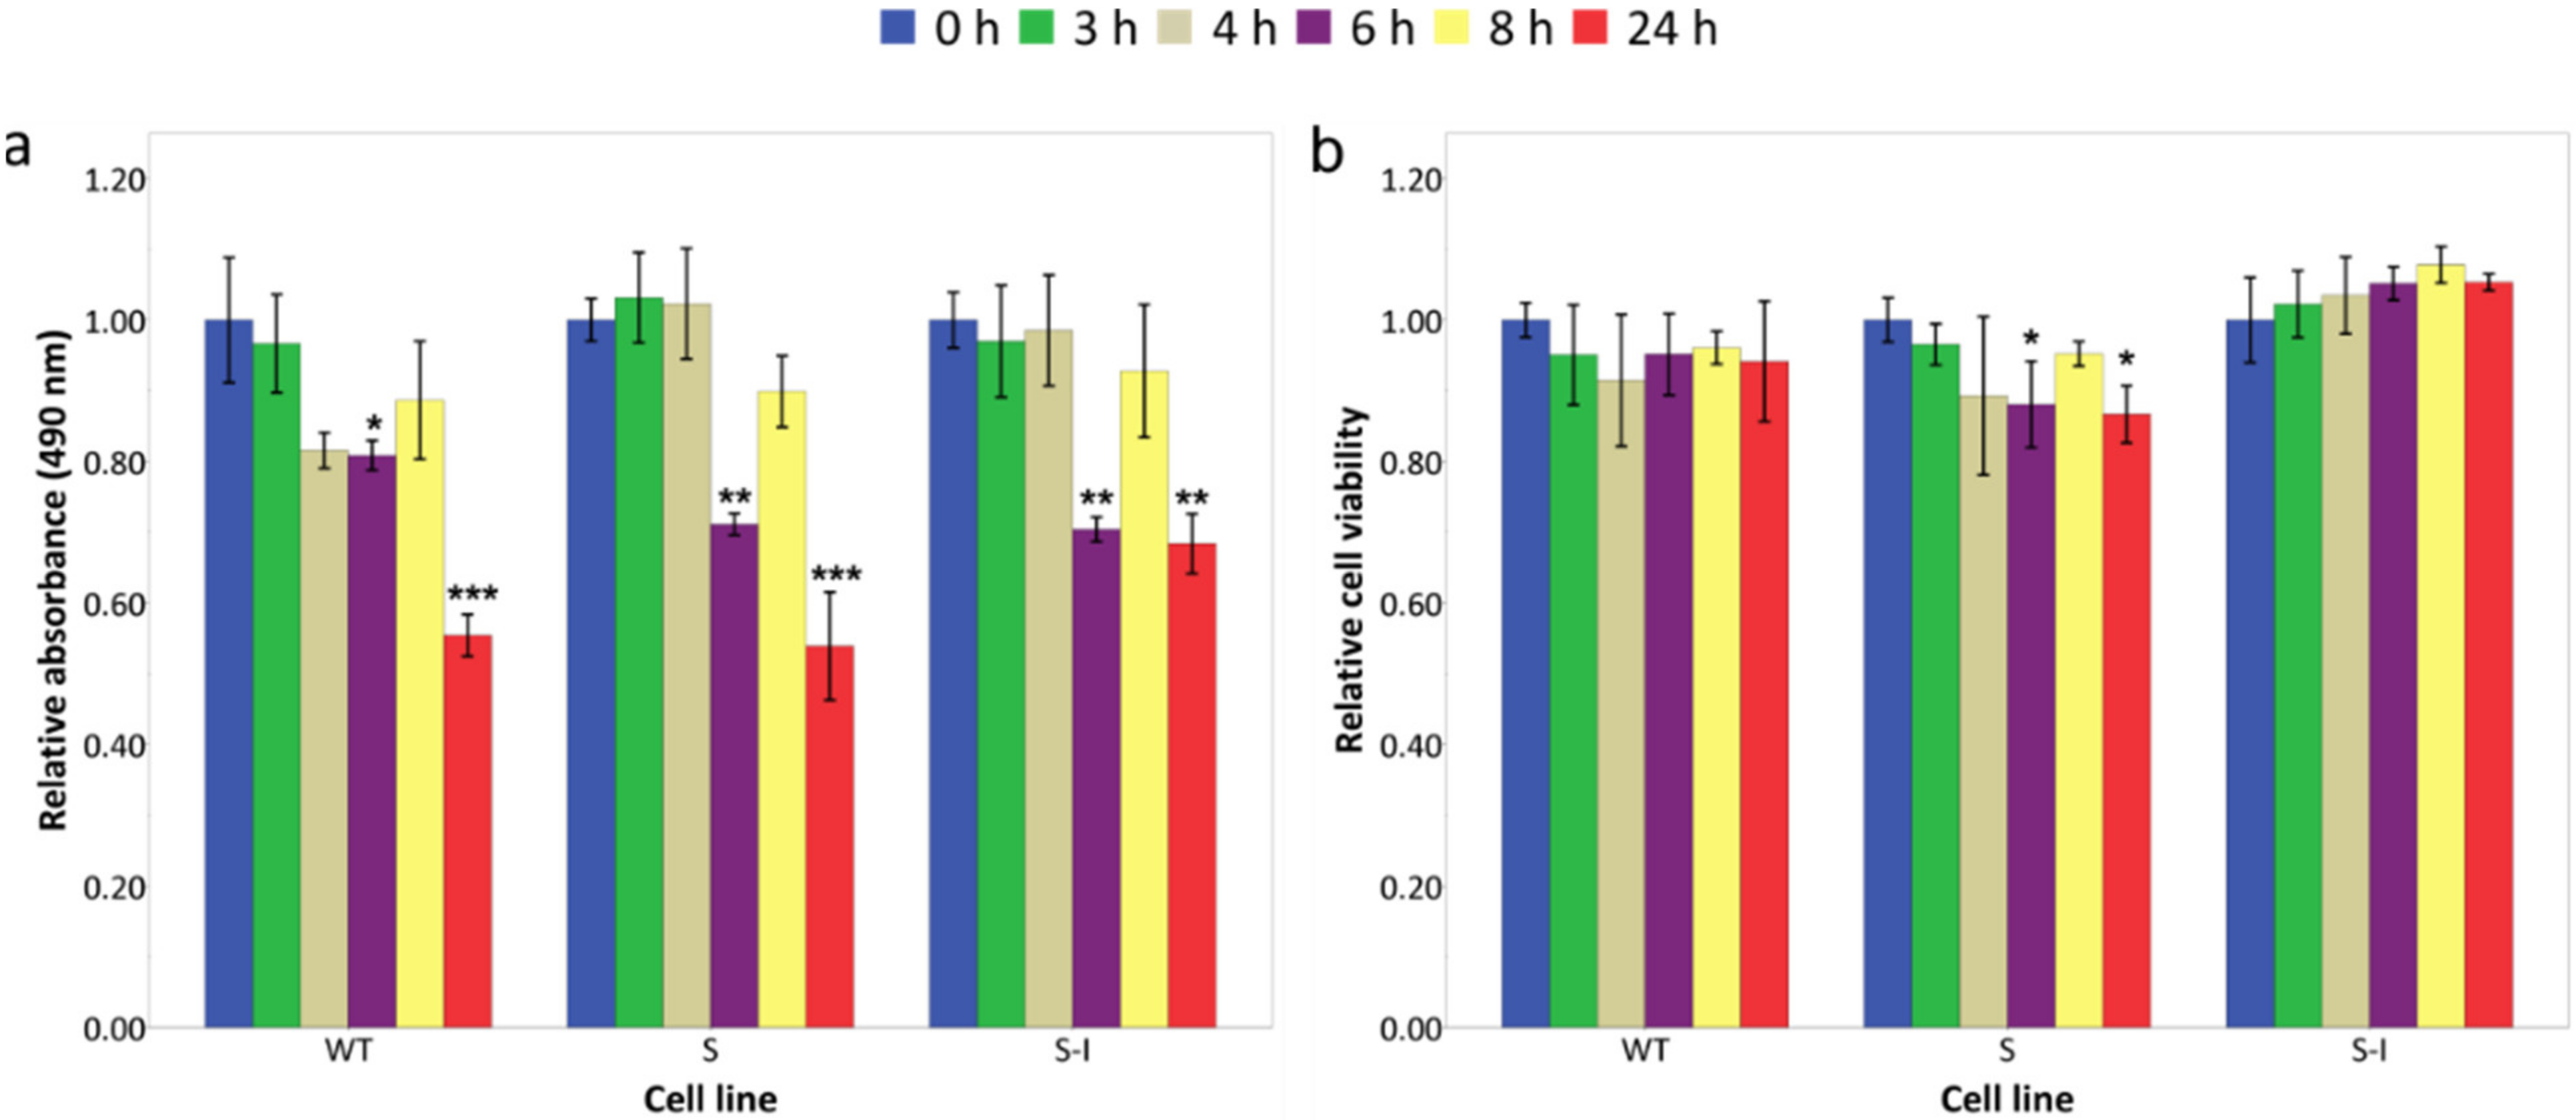
4.6. MTS Assay
4.7. RNA Isolation and cDNA Construction
4.8. Optimisation of qRT-PCR Conditions
4.9. Quantitative Reverse Transcription Polymerase Chain Reaction (qRT-PCR)
4.10. Statistical Analysis
5. Conclusions
Supplementary Materials
Author Contributions
Funding
Data Availability Statement
Conflicts of Interest
References
- Haass, C.; Selkoe, D.J. Soluble protein oligomers in neurodegeneration: Lessons from the Alzheimer’s amyloid beta-peptide. Nat. Rev. Mol. Cell Biol. 2007, 8, 101–112. [Google Scholar] [CrossRef]
- Imaizumi, K.; Miyoshi, K.; Katayama, T.; Yoneda, T.; Taniguchi, M.; Kudo, T.; Tohyama, M. The unfolded protein response and Alzheimer’s disease. BBA-Mol. Basis Dis. 2001, 1536, 85–96. [Google Scholar]
- Hoozemans, J.J.; van Haastert, E.S.; Nijholt, D.A.; Rozemuller, A.J.; Eikelenboom, P.; Scheper, W. The Unfolded Protein Response Is Activated in Pretangle Neurons in Alzheimer’s Disease Hippocampus. Am. J. Pathol. 2009, 174, 1241–1251. [Google Scholar] [CrossRef] [PubMed] [Green Version]
- Hoozemans, J.J.M.; Veerhuis, R.; Van Haastert, E.S.; Rozemuller, J.M.; Baas, F.; Eikelenboom, P.; Scheper, W. The unfolded protein response is activated in Alzheimer’s disease. Acta Neuropathol. 2005, 110, 165–172. [Google Scholar] [CrossRef] [PubMed]
- Hetz, C. The unfolded protein response: Controlling cell fate decisions under ER stress and beyond. Nat. Rev. Mol. Cell Biol. 2012, 13, 89–102. [Google Scholar] [CrossRef]
- Stefani, I.C.; Wright, D.; Polizzi, K.M.; Kontoravdi, C. The Role of ER Stress-Induced Apoptosis in Neurodegeneration. Curr. Alzheimer Res. 2012, 9, 373–387. [Google Scholar] [CrossRef] [PubMed]
- Moreno, J.A.; Halliday, M.; Molloy, C.; Radford, H.; Verity, N.; Axten, J.M.; Ortori, C.A.; Willis, A.E.; Fischer, P.M.; Barrett, D.A.; et al. Oral treatment targeting the unfolded protein response prevents neurodegeneration and clinical disease in prion-infected mice. Sci. Transl. Med. 2013, 5, 206ra138. [Google Scholar] [CrossRef] [PubMed]
- Inagi, R. Endoplasmic reticulum stress as a progression factor for kidney injury. Curr. Opin. Pharm. 2010, 10, 156–165. [Google Scholar] [CrossRef] [PubMed]
- Erguler, K.; Pieri, M.; Deltas, C. A mathematical model of the unfolded protein stress response reveals the decision mechanism for recovery, adaptation and apoptosis. BMC Syst. Biol. 2013, 7, 16. [Google Scholar] [CrossRef] [Green Version]
- Moreno, J.A.; Radford, H.; Peretti, D.; Steinert, J.R.; Verity, N.; Martin, M.G.; Halliday, M.; Morgan, J.; Dinsdale, D.; Ortori, C.A.; et al. Sustained translational repression by eIF2alpha-P mediates prion neurodegeneration. Nature 2012, 485, 507–511. [Google Scholar]
- Ma, Y.; Shimizu, Y.; Mann, M.J.; Jin, Y.; Hendershot, L.M. Plasma cell differentiation initiates a limited ER stress response by specifically suppressing the PERK-dependent branch of the unfolded protein response. Cell Stress Chaperones 2010, 15, 281–293. [Google Scholar] [CrossRef] [PubMed] [Green Version]
- Ma, T.; Trinh, M.A.; Wexler, A.J.; Bourbon, C.; Gatti, E.; Pierre, P.; Cavener, D.R.; Klann, E. Suppression of eIF2 alpha kinases alleviates Alzheimer’s disease-related plasticity and memory deficits. Nat. Neurosci. 2013, 16, 1299–1305. [Google Scholar] [PubMed] [Green Version]
- Scheper, W.; Hoozemans, J.J. A New PERKspective on Neurodegeneration. Sci. Transl. Med. 2013, 5, 206fs237. [Google Scholar] [CrossRef] [PubMed]
- Pincus, D.; Chevalier, M.W.; Aragón, T.; Van Anken, E.; Vidal, S.E.; El-Samad, H.; Walter, P. BiP Binding to the ER-Stress Sensor Ire1 Tunes the Homeostatic Behavior of the Unfolded Protein Response. PLoS Biol. 2010, 8, e1000415. [Google Scholar] [CrossRef] [PubMed] [Green Version]
- Stahl, S.; Burkhart, J.M.; Hinte, F.; Tirosh, B.; Mohr, H.; Zahedi, R.P.; Sickmann, A.; Ruzsics, Z.; Budt, M.; Brune, W. Cytomegalovirus Downregulates IRE1 to Repress the Unfolded Protein Response. PLoS Pathog. 2013, 9, e1003544. [Google Scholar] [CrossRef]
- Calfon, M.; Zeng, H.; Urano, F.; Till, J.H.; Hubbard, S.R.; Harding, H.P.; Clark, S.G.; Ron, D. IRE1 couples endoplasmic reticulum load to secretory capacity by processing the XBP-1 mRNA. Nature 2020, 415, 92–96, Erratum in 2002, 420, 202. [Google Scholar] [CrossRef]
- Yamamoto, K.; Yoshida, H.; Kokame, K.; Kaufman, R.J.; Mori, K. Differential contributions of ATF6 and XBP1 to the activation of endoplasmic reticulum stress-responsive cis-acting elements ERSE, UPRE and ERSE-II. J. Biochem. 2004, 136, 343–350. [Google Scholar] [CrossRef]
- Chakrabarti, A.; Chen, A.W.; Varner, J.D. A Review of the Mammalian Unfolded Protein Response. Biotechnol. Bioeng. 2011, 108, 2777–2793. [Google Scholar]
- Park, S.J.; Schertel, A.; Han, S.S. Altered structure of synapse in a brain of the Swedish mutation which causes early-onset Alzheimer’s disease: A FIB-SEM Microscopy study. J. Neurogenet. 2010, 24, 38–39. [Google Scholar]
- De Jonghe, C.; Esselens, C.; Kumar-Singh, S.; Craessaerts, K.; Serneels, S.; Checler, F.; Annaert, W.; Van Broeckhoven, C.; De Strooper, B. Pathogenic APP mutations near the gamma-secretase cleavage site differentially affect A beta secretion and APP C-terminal fragment stability. Hum. Mol. Genet. 2001, 10, 1665–1671. [Google Scholar] [CrossRef] [Green Version]
- Katayama, T.; Imaizumi, K.; Honda, A.; Yoneda, T.; Kudo, T.; Takeda, M.; Mori, K.; Rozmahel, R.; Fraser, P.; St. George-Hyslop, P.; et al. Disturbed activation of endoplasmic reticulum stress transducers by familial Alzheimer’s disease-linked presenilin-1 mutations. J. Biol. Chem. 2001, 276, 43446–43454. [Google Scholar] [CrossRef] [PubMed] [Green Version]
- Kuperstein, I.; Broersen, K.; Benilova, I.; Rozenski, J.; Jonckheere, W.; Debulpaep, M.; Vandersteen, A.; Segers-Nolten, I.; Van Der Werf, K.; Subramaniam, V.; et al. Neurotoxicity of Alzheimer’s disease A beta peptides is induced by small changes in the A beta(42) to A beta(40) ratio. EMBO J. 2010, 29, 3408–3420. [Google Scholar] [CrossRef] [PubMed]
- Kudo, T.; Katayama, T.; Imaizumi, K.; Yasuda, Y.; Yatera, M.; Okochi, M.; Tohyama, M.; Takeda, M. The unfolded protein response is involved in the pathology of Alzheimer’s disease. Ann. N. Y. Acad. Sci. 2002, 977, 349–355. [Google Scholar] [PubMed]
- Hitomi, J.; Katayama, T.; Eguchi, Y.; Kudo, T.; Taniguchi, M.; Koyama, Y.; Manabe, T.; Yamagishi, S.; Bando, Y.; Imaizumi, K.; et al. Involvement of caspase-4 in endoplasmic reticulum stress-induced apoptosis and A beta-induced cell death. J. Cell Biol. 2004, 165, 347–356. [Google Scholar] [CrossRef] [PubMed]
- Savage, K.E.; Baur, P.S. Effect of tunicamycin, an inhibitor of protein glycosylation, on division of tumour cells in vitro. J. Cell Sci. 1983, 64, 295–306. [Google Scholar] [CrossRef]
- Yoshida, H.; Matsui, T.; Yamamoto, A.; Okada, T.; Mori, K. XBP1 mRNA is induced by ATF6 and spliced by IRE1 in response to ER stress to produce a highly active transcription factor. Cell 2001, 107, 881–891. [Google Scholar] [CrossRef] [Green Version]
- Haze, K.; Yoshida, H.; Yanagi, H.; Yura, T.; Mori, K. Mammalian Transcription Factor ATF6 Is Synthesized as a Transmembrane Protein and Activated by Proteolysis in Response to Endoplasmic Reticulum Stress. Mol. Biol. Cell 1999, 10, 3787–3799. [Google Scholar] [CrossRef] [Green Version]
- Lee, A.S. The ER chaperone and signaling regulator GRP78/BiP as a monitor of endoplasmic reticulum stress. Methods 2005, 35, 373–381. [Google Scholar] [CrossRef] [PubMed]
- Dey, S.; Baird, T.D.; Zhou, D.; Palam, L.R.; Spandau, D.F.; Wek, R.C. Both transcriptional regulation and translational control of ATF4 are central to the integrated stress response. J. Biol. Chem. 2010, 285, 33165–33174. [Google Scholar] [PubMed] [Green Version]
- Chafekar, S.M.; Hoozemans, J.J.; Zwart, R.; Baas, F.; Scheper, W. Abeta 1-42 induces mild endoplasmic reticulum stress in an aggregation state-dependent manner. Antioxid. Redox Signal. 2007, 9, 2245–2254. [Google Scholar]
- Sakono, M.; Zako, T. Amyloid oligomers: Formation and toxicity of Aβ oligomers. FEBS J. 2010, 277, 1348–1358. [Google Scholar] [CrossRef]
- Cross, B.C.S.; Bond, P.J.; Sadowski, P.G.; Jha, B.K.; Zak, J.; Goodman, J.M.; Silverman, R.H.; Neubert, T.A.; Baxendale, I.R.; Ron, D.R.; et al. The molecular basis for selective inhibition of unconventional mRNA splicing by an IRE1-binding small molecule. Proc. Natl. Acad. Sci. USA 2012, 109, E869–E878. [Google Scholar] [CrossRef] [Green Version]
- Axten, J.M.; Medina, J.R.; Feng, Y.; Shu, A.; Romeril, S.P.; Grant, S.W.; Li, W.H.H.; Heerding, D.A.; Minthorn, E.; Mencken, T.; et al. Discovery of 7-Methyl-5-(1-{[3-(trifluoromethyl)phenyl]acetyl}-2,3-dihydro-1H-indol-5-yl)-7H-pyrrolo[2,3-d]pyrimidin-4-amine (GSK2606414), a Potent and Selective First-in-Class Inhibitor of Protein Kinase R (PKR)-like Endoplasmic Reticulum Kinase (PERK). J. Med. Chem. 2012, 55, 7193–7207. [Google Scholar] [CrossRef] [PubMed]
- Boyce, M.; Bryant, K.F.; Jousse, C.; Long, K.; Harding, H.P.; Scheuner, D.; Kaufman, R.J.; Coen, D.M.; Ron, D.; Yuan, J. A selective inhibitor-of eIF2 alpha dephosphorylation protects cells from ER stress. Science 2005, 307, 935–939. [Google Scholar] [CrossRef]
- Tsaytler, P.; Harding, H.P.; Ron, D.; Bertolotti, A. Selective Inhibition of a Regulatory Subunit of Protein Phosphatase 1 Restores Proteostasis. Science 2011, 332, 91–94. [Google Scholar] [CrossRef] [PubMed]
- Hetz, C.; Chevet, E.; Harding, H.P. Targeting the unfolded protein response in disease. Nat. Rev. Drug Discov. 2013, 12, 703–719. [Google Scholar] [CrossRef]
- Shao, L.; Sun, X.; Xu, L.; Young, L.T.; Wang, J.F. Mood stabilizing drug lithium increases expression of endoplasmic reticulum stress proteins in primary cultured rat cerebral cortical cells. Life Sci. 2006, 78, 1317–1323. [Google Scholar] [PubMed]
- Wang, J.F.; Young, L.T. Regulation of molecular chaperone GRP78 by mood stabilizing drugs. Clin. Neurosci. Res. 2004, 4, 281–288. [Google Scholar] [CrossRef]
- Bown, C.D.; Wang, J.F.; Chen, B.; Young, L.T. Regulation of ER stress proteins by valproate: Therapeutic implications. Bipolar. Disord. 2002, 4, 145–151. [Google Scholar]
- Sokka, A.L.; Putkonen, N.; Mudo, G.; Pryazhnikov, E.; Reijonen, S.; Khiroug, L.; Belluardo, N.; Lindholm, D.; Korhonen, L. Endoplasmic Reticulum Stress Inhibition Protects against Excitotoxic Neuronal Injury in the Rat Brain. J. Neurosci. 2007, 27, 901–908. [Google Scholar] [CrossRef] [Green Version]
- Walter, P.; Ron, D. The unfolded protein response: From stress pathway to homeostatic regulation. Science 2011, 334, 1081–1086. [Google Scholar] [CrossRef] [PubMed] [Green Version]
- Glover-Cutter, K.M.; Lin, S.; Blackwell, T.K. Integration of the Unfolded Protein and Oxidative Stress Responses through SKN-1/Nrf. PLoS Genet. 2013, 9, e1003701. [Google Scholar] [CrossRef] [Green Version]
- Vattem, K.M.; Wek, R.C. Reinitiation involving upstream ORFs regulates ATF4 mRNA translation in mammalian cells. Proc. Natl. Acad. Sci. USA 2004, 101, 11269–11274. [Google Scholar] [CrossRef] [PubMed] [Green Version]
- Lin, J.H.; Li, H.; Yasumura, D.; Cohen, H.R.; Zhang, C.; Panning, B.; Shokat, K.M.; Lavail, M.M.; Walter, P. IRE1 signaling affects cell fate during the unfolded protein response. Science 2007, 318, 944–949. [Google Scholar] [PubMed] [Green Version]
- Kondo, T.; Asai, M.; Tsukita, K.; Kutoku, Y.; Ohsawa, Y.; Sunada, Y.; Imamura, K.; Egawa, N.; Yahata, N.; Okita, K.; et al. Modeling Alzheimer’s disease with iPSCs reveals stress phenotypes associated with intracellular Abeta and differential drug responsiveness. Cell Stem Cell 2013, 12, 487–496. [Google Scholar] [CrossRef] [PubMed] [Green Version]
- Samali, A.; Fitzgerald, U.; Deegan, S.; Gupta, S. Methods for monitoring endoplasmic reticulum stress and the unfolded protein response. Int. J. Cell Biol. 2010, 2010, 830307. [Google Scholar] [PubMed]
- Pfaffl, M.W. A new mathematical model for relative quantification in real-time RT-PCR. Nucleic Acids Res. 2001, 29, e45. [Google Scholar] [PubMed]

| TM-Treatment | Normalised Viable Cell Concentration | |||
|---|---|---|---|---|
| WT | S | S-I | ||
| 0 h | Mean | 1.00 | 1.00 | 1.00 |
| SD | 1.23 × 10⁻¹ | 1.80 × 10⁻¹ | 8.21 × 10⁻² | |
| 24 h | Mean | 6.52 × 10⁻¹ | 5.83 × 10⁻¹ | 5.30 × 10⁻¹ |
| SD | 6.91 × 10⁻² | 1.06 × 10⁻¹ | 1.14 × 10⁻¹ | |
Publisher’s Note: MDPI stays neutral with regard to jurisdictional claims in published maps and institutional affiliations. |
© 2021 by the authors. Licensee MDPI, Basel, Switzerland. This article is an open access article distributed under the terms and conditions of the Creative Commons Attribution (CC BY) license (https://creativecommons.org/licenses/by/4.0/).
Share and Cite
Stefani, I.C.; de Thé, F.-X.B.; Kontoravdi, C.; Polizzi, K.M. Model Identifies Genetic Predisposition of Alzheimer’s Disease as Key Decider in Cell Susceptibility to Stress. Int. J. Mol. Sci. 2021, 22, 12001. https://doi.org/10.3390/ijms222112001
Stefani IC, de Thé F-XB, Kontoravdi C, Polizzi KM. Model Identifies Genetic Predisposition of Alzheimer’s Disease as Key Decider in Cell Susceptibility to Stress. International Journal of Molecular Sciences. 2021; 22(21):12001. https://doi.org/10.3390/ijms222112001
Chicago/Turabian StyleStefani, Ioanna C., François-Xavier Blaudin de Thé, Cleo Kontoravdi, and Karen M. Polizzi. 2021. "Model Identifies Genetic Predisposition of Alzheimer’s Disease as Key Decider in Cell Susceptibility to Stress" International Journal of Molecular Sciences 22, no. 21: 12001. https://doi.org/10.3390/ijms222112001
APA StyleStefani, I. C., de Thé, F.-X. B., Kontoravdi, C., & Polizzi, K. M. (2021). Model Identifies Genetic Predisposition of Alzheimer’s Disease as Key Decider in Cell Susceptibility to Stress. International Journal of Molecular Sciences, 22(21), 12001. https://doi.org/10.3390/ijms222112001