
Expression Pattern of Purinergic Signaling Components in Colorectal Cancer Cells and Differential Cellular Outcomes Induced by Extracellular ATP and Adenosine

 ,
,  ,
,  and
and 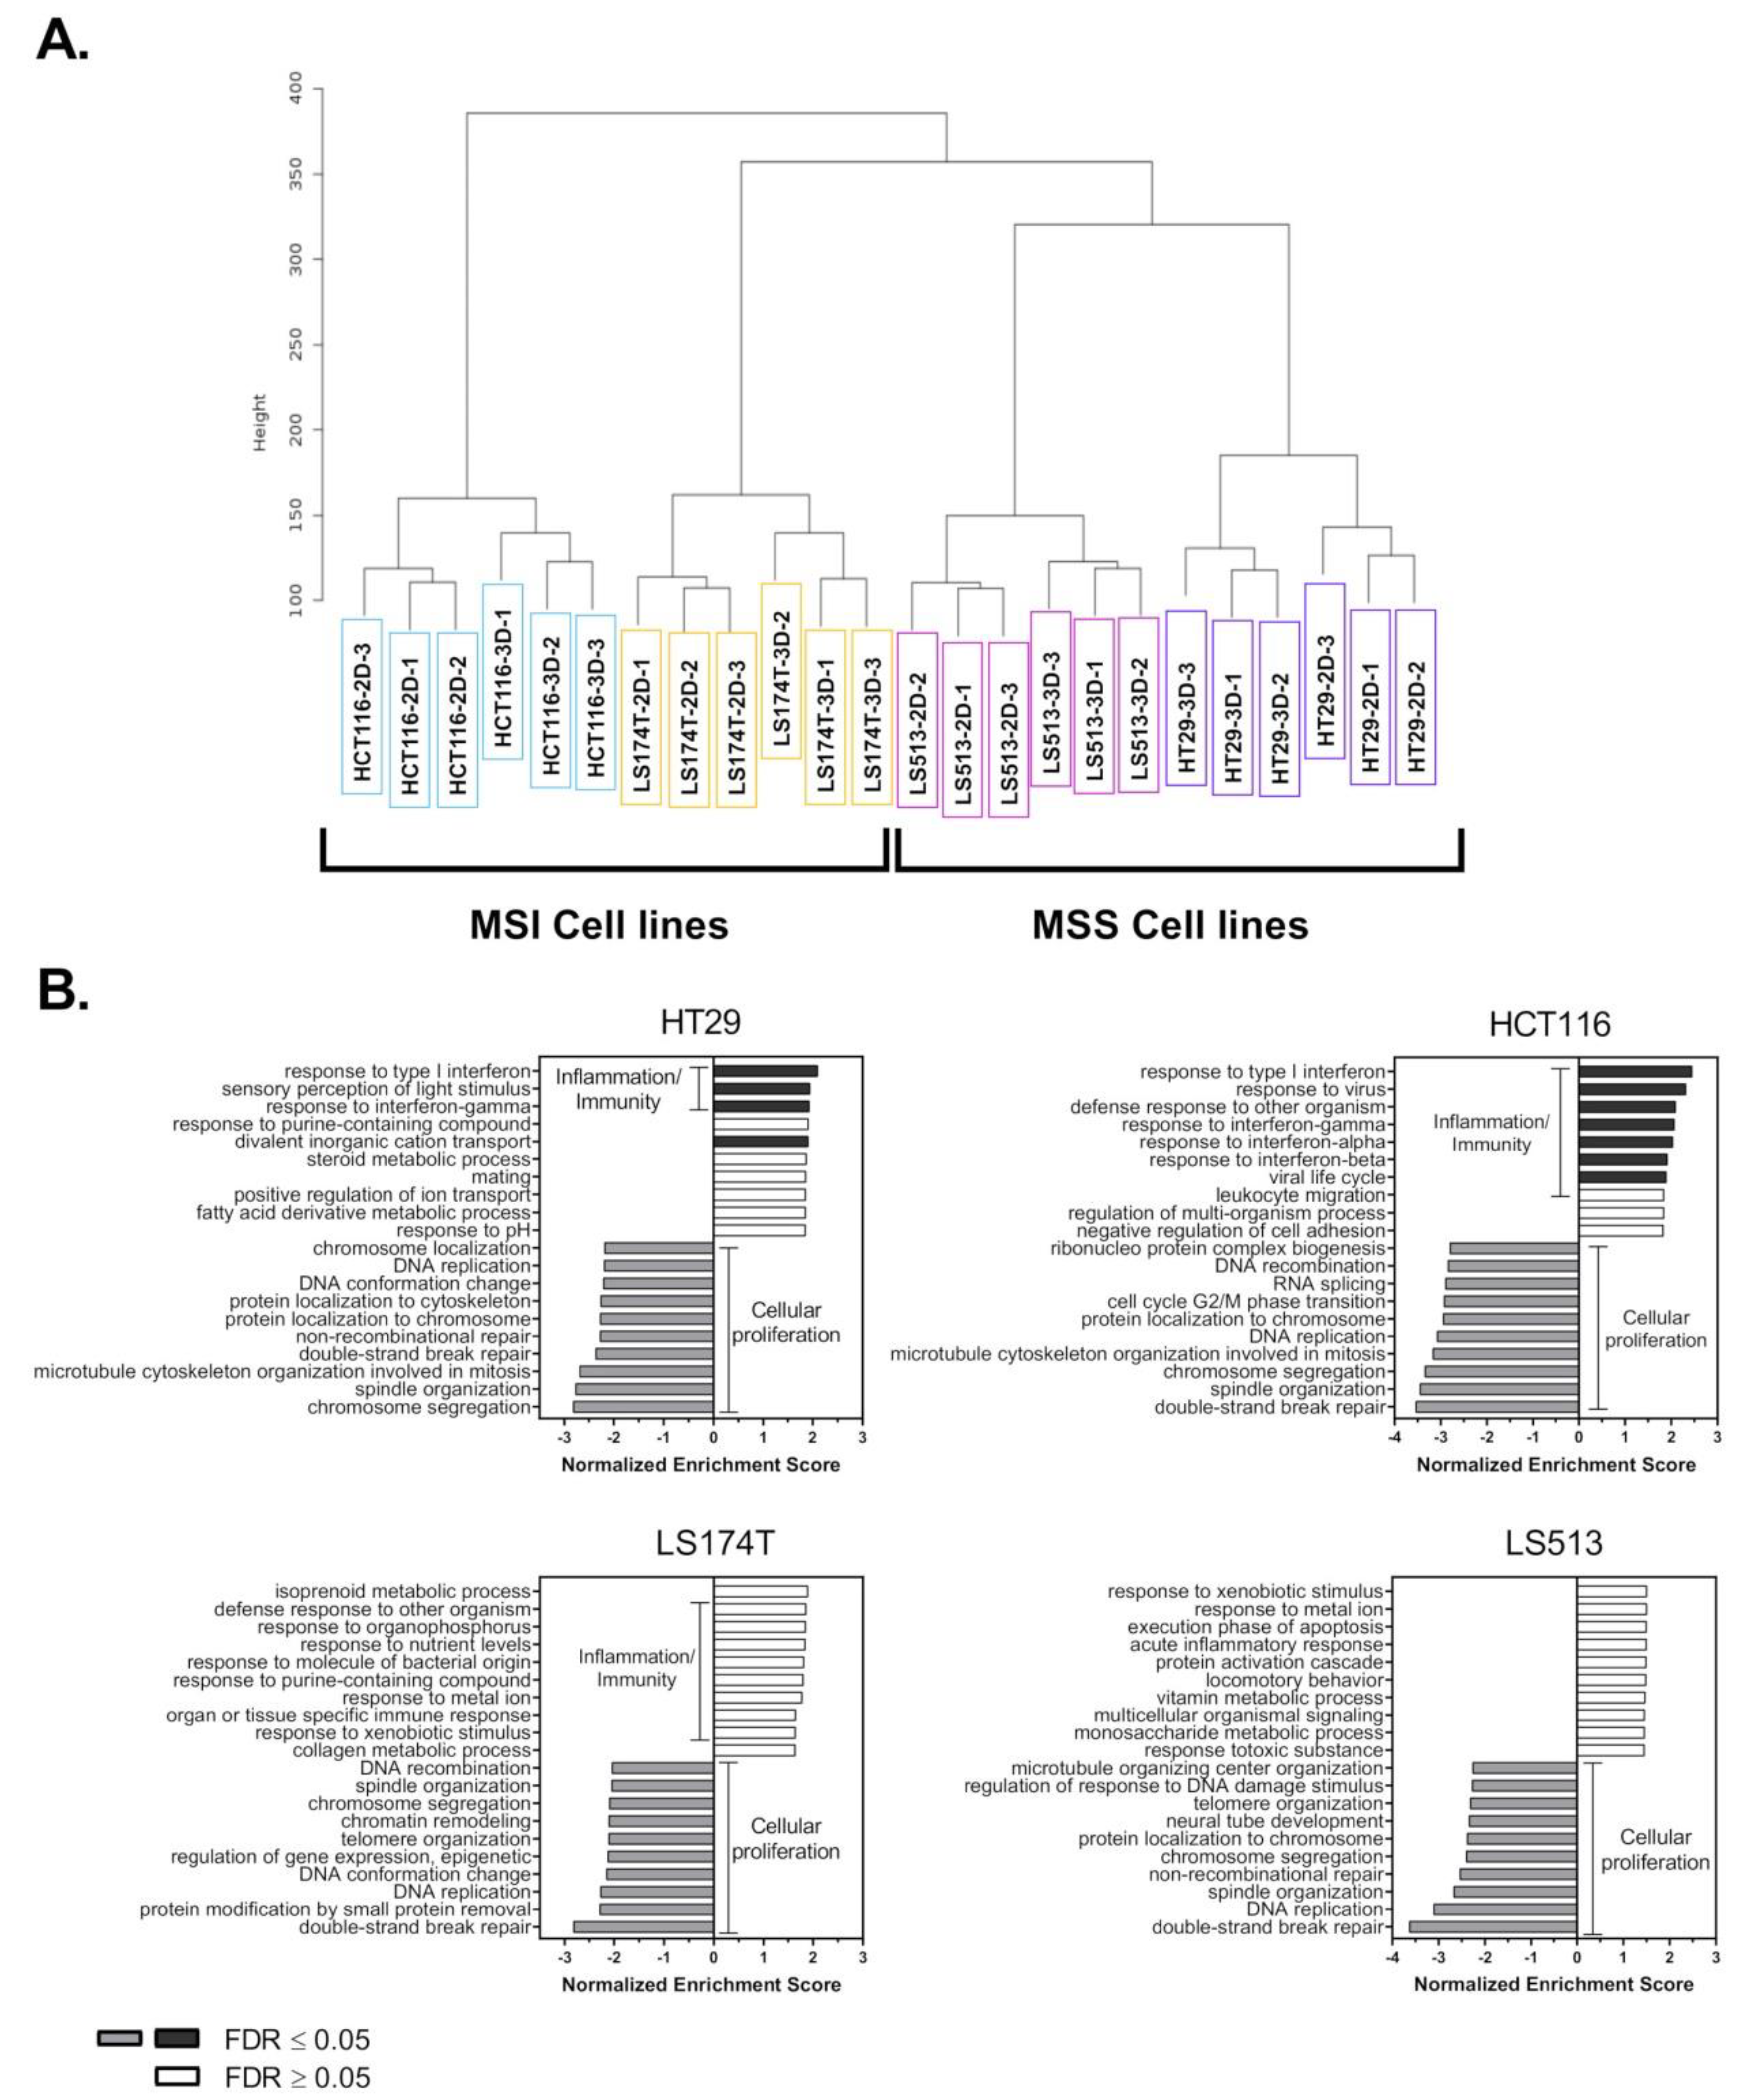
Abstract
1. Introduction
2. Results
2.1. Transcriptomic Analysis of Colorectal Cancer Cell Lines Grown in 2D and 3D Culture Conditions
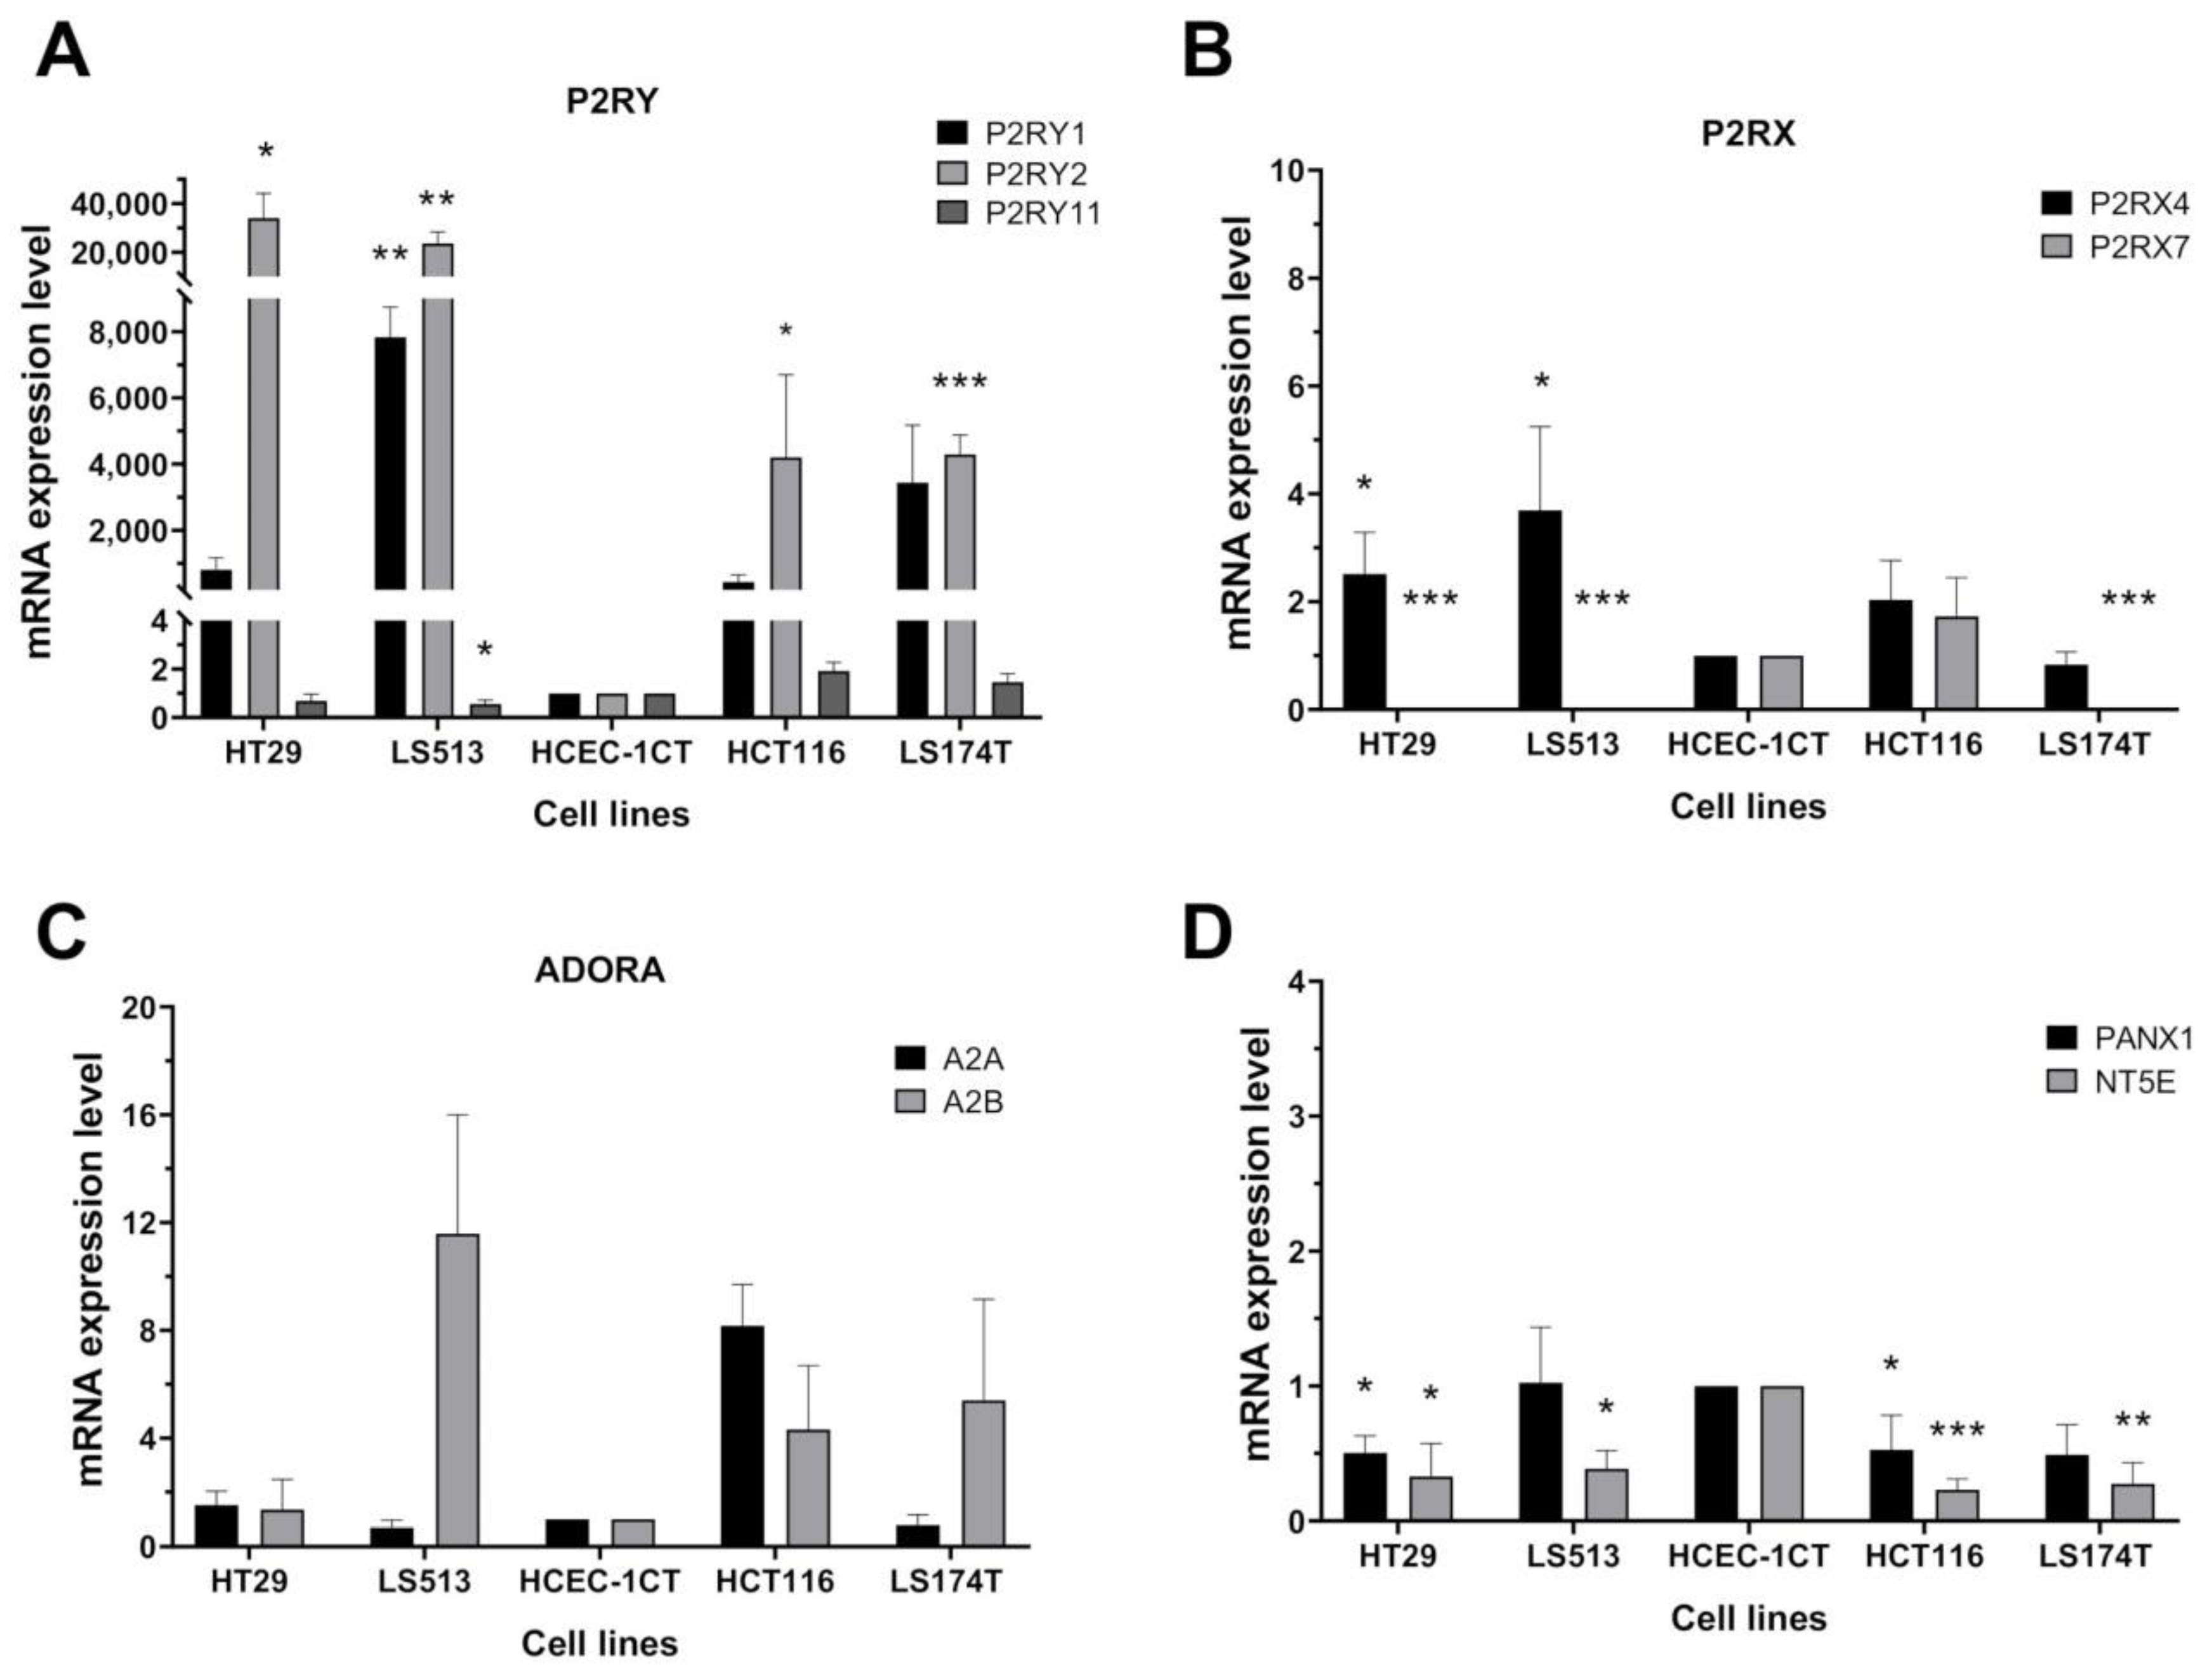
2.2. Transcriptional Expression of Purinergic Receptors and Ectonucleotidases Coding Genes in CRC Cell Lines
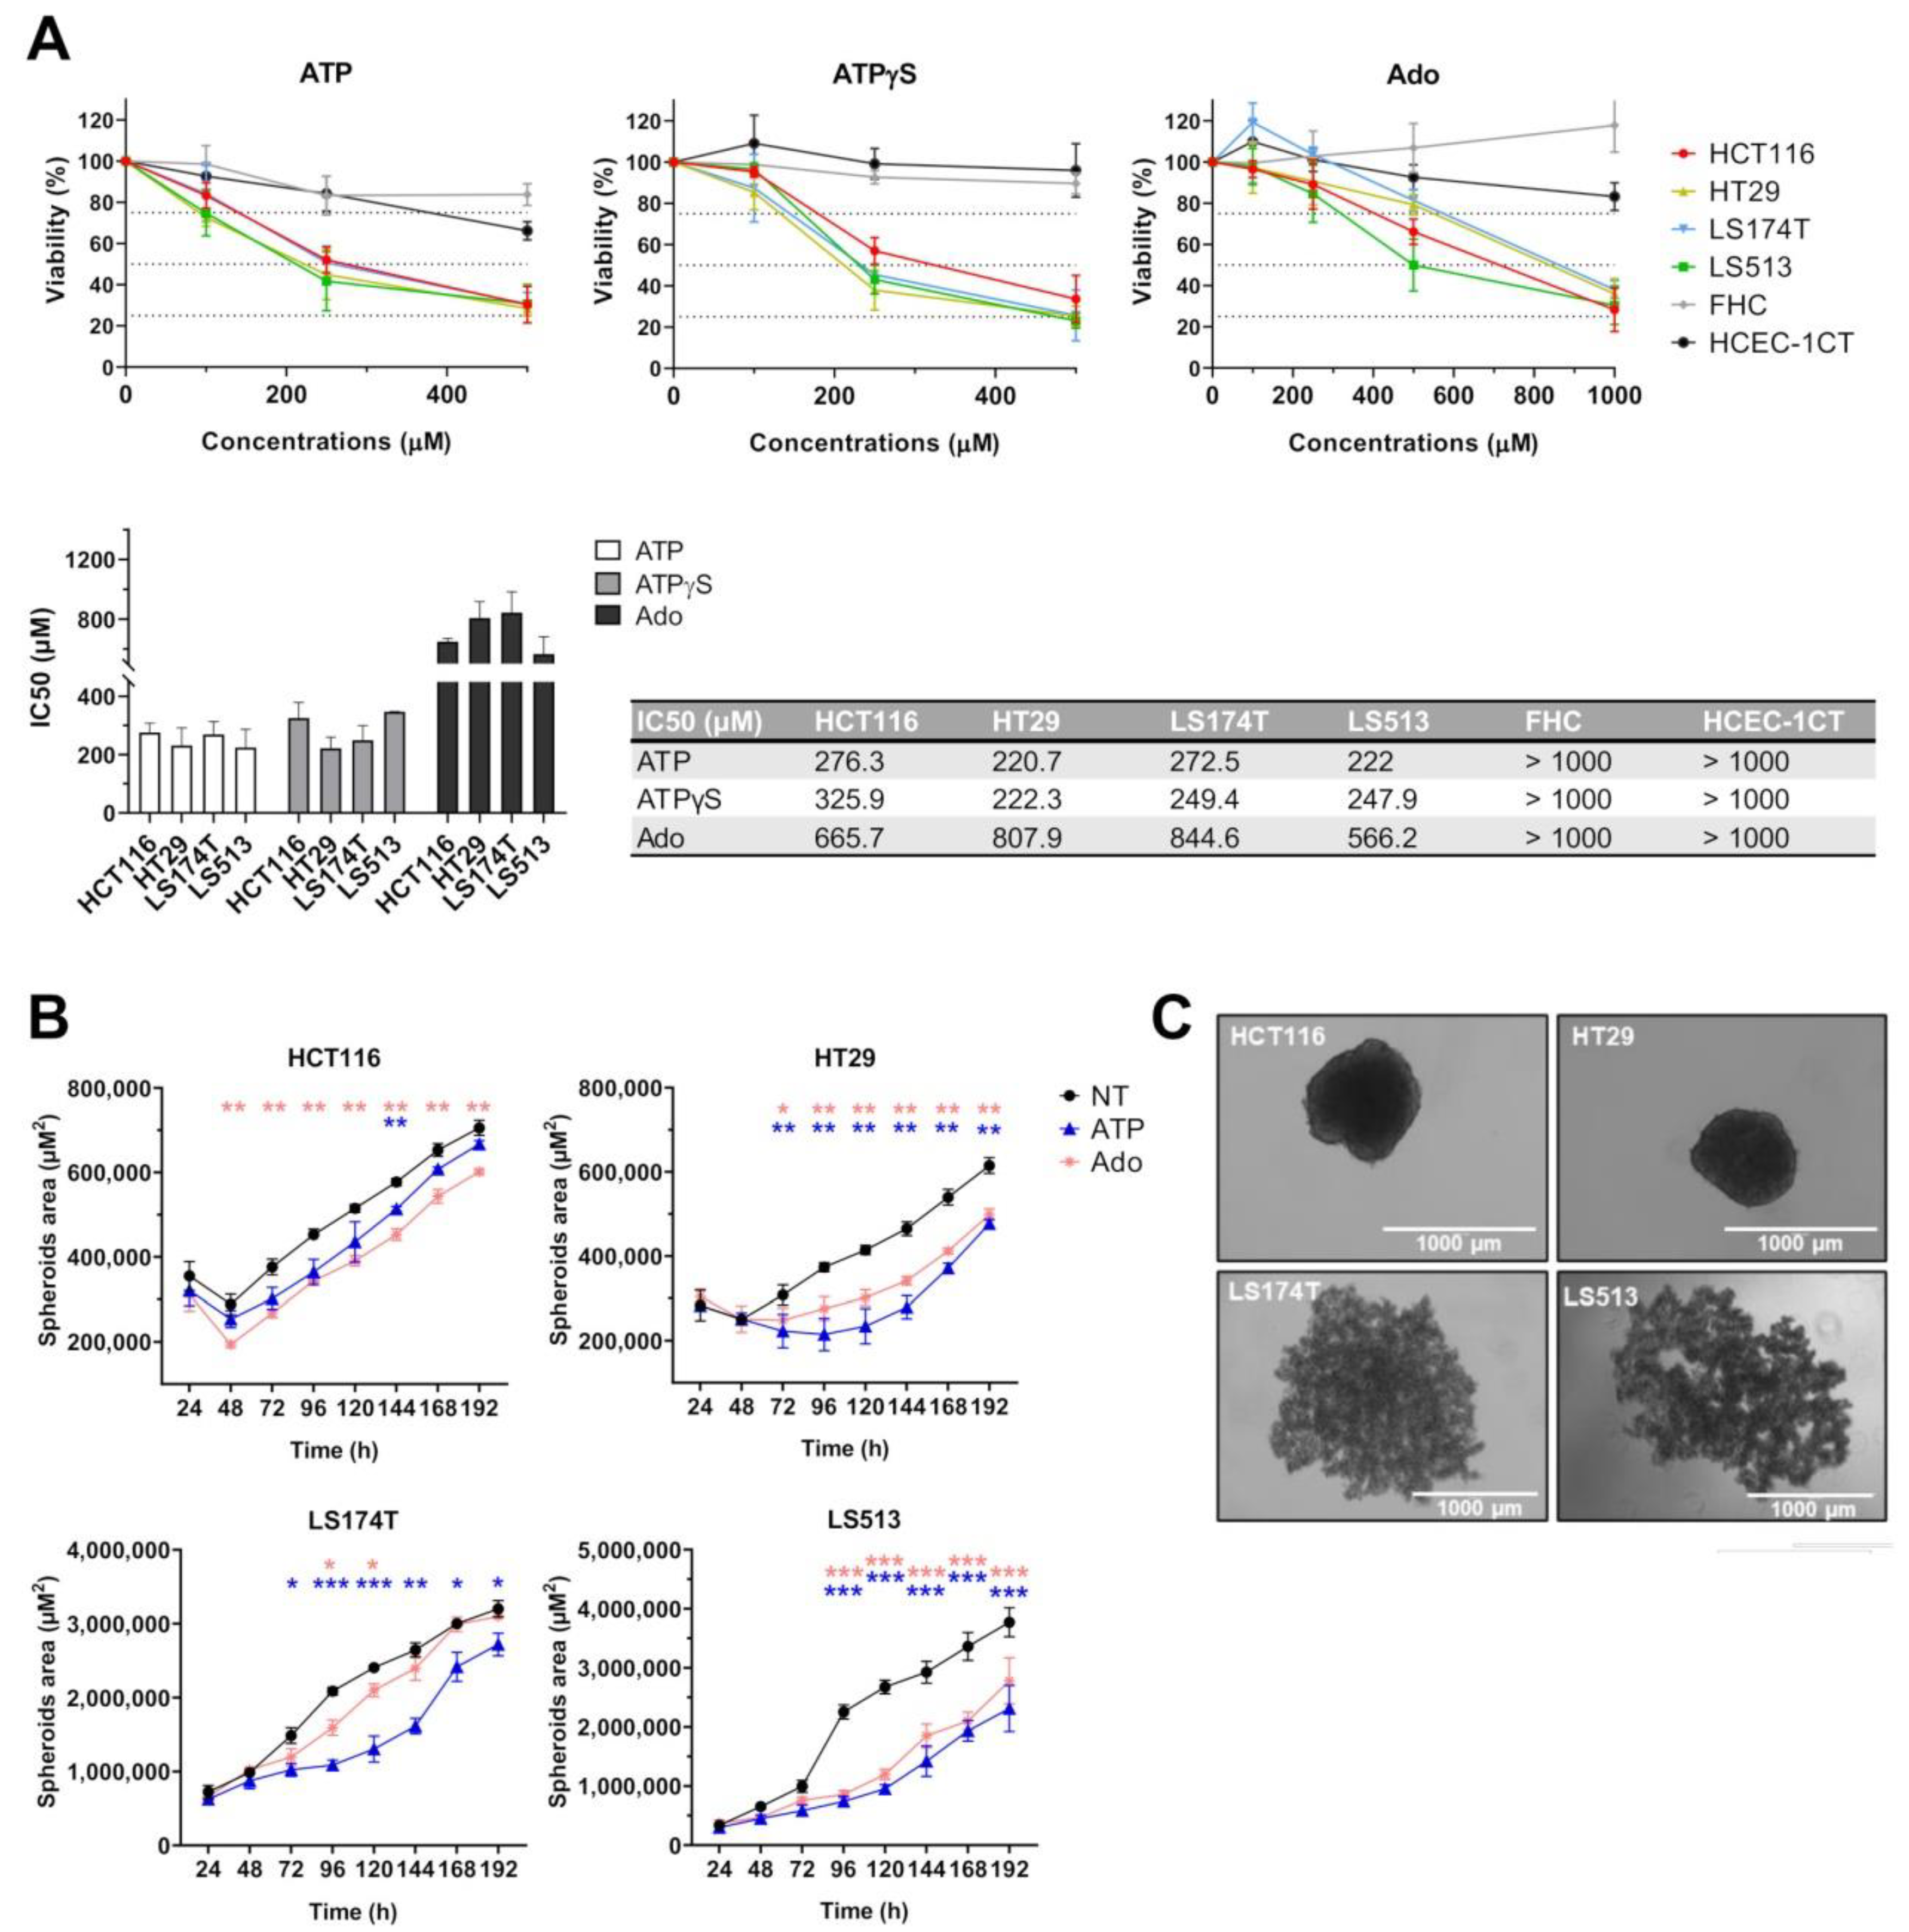
2.3. Effect of Purine Molecules on 2D Cell Viability and 3D Spheroid Growth
2.4. Cell Type Dependent Cellular Death Processes Induced by Purine Molecules
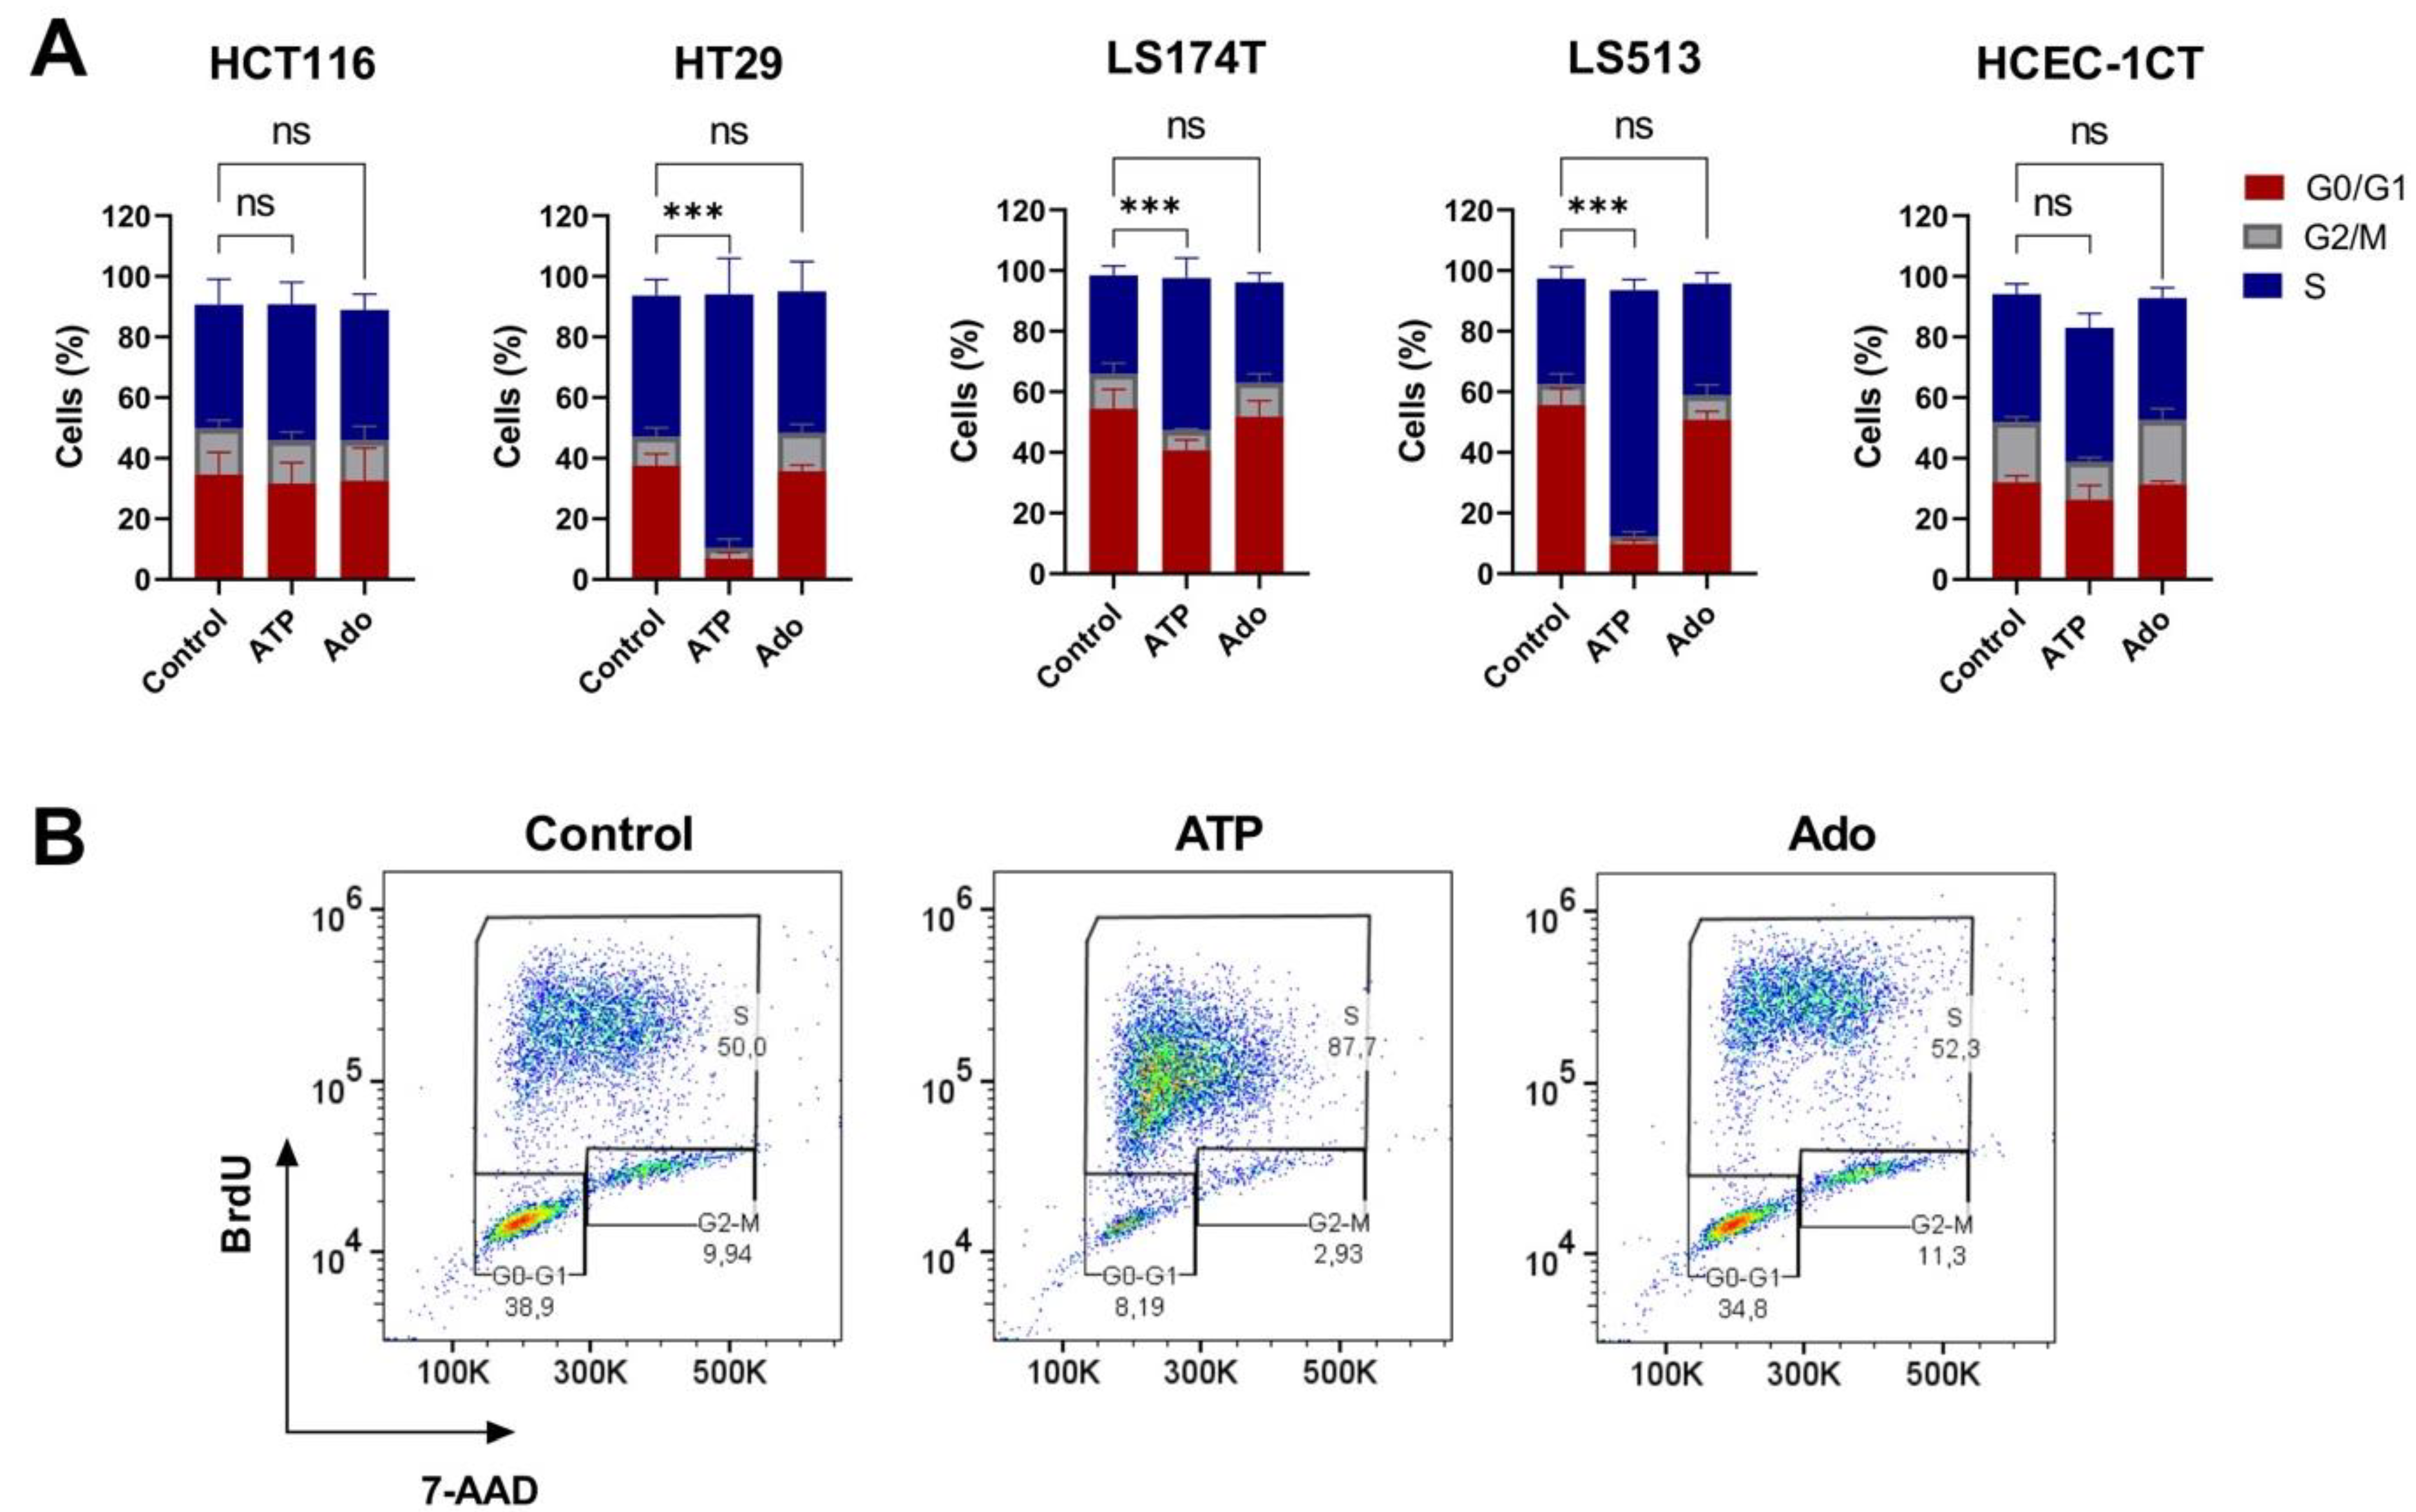
2.5. Cell Cycle Modulation in CRC Cell Lines Induced by Purine Molecules
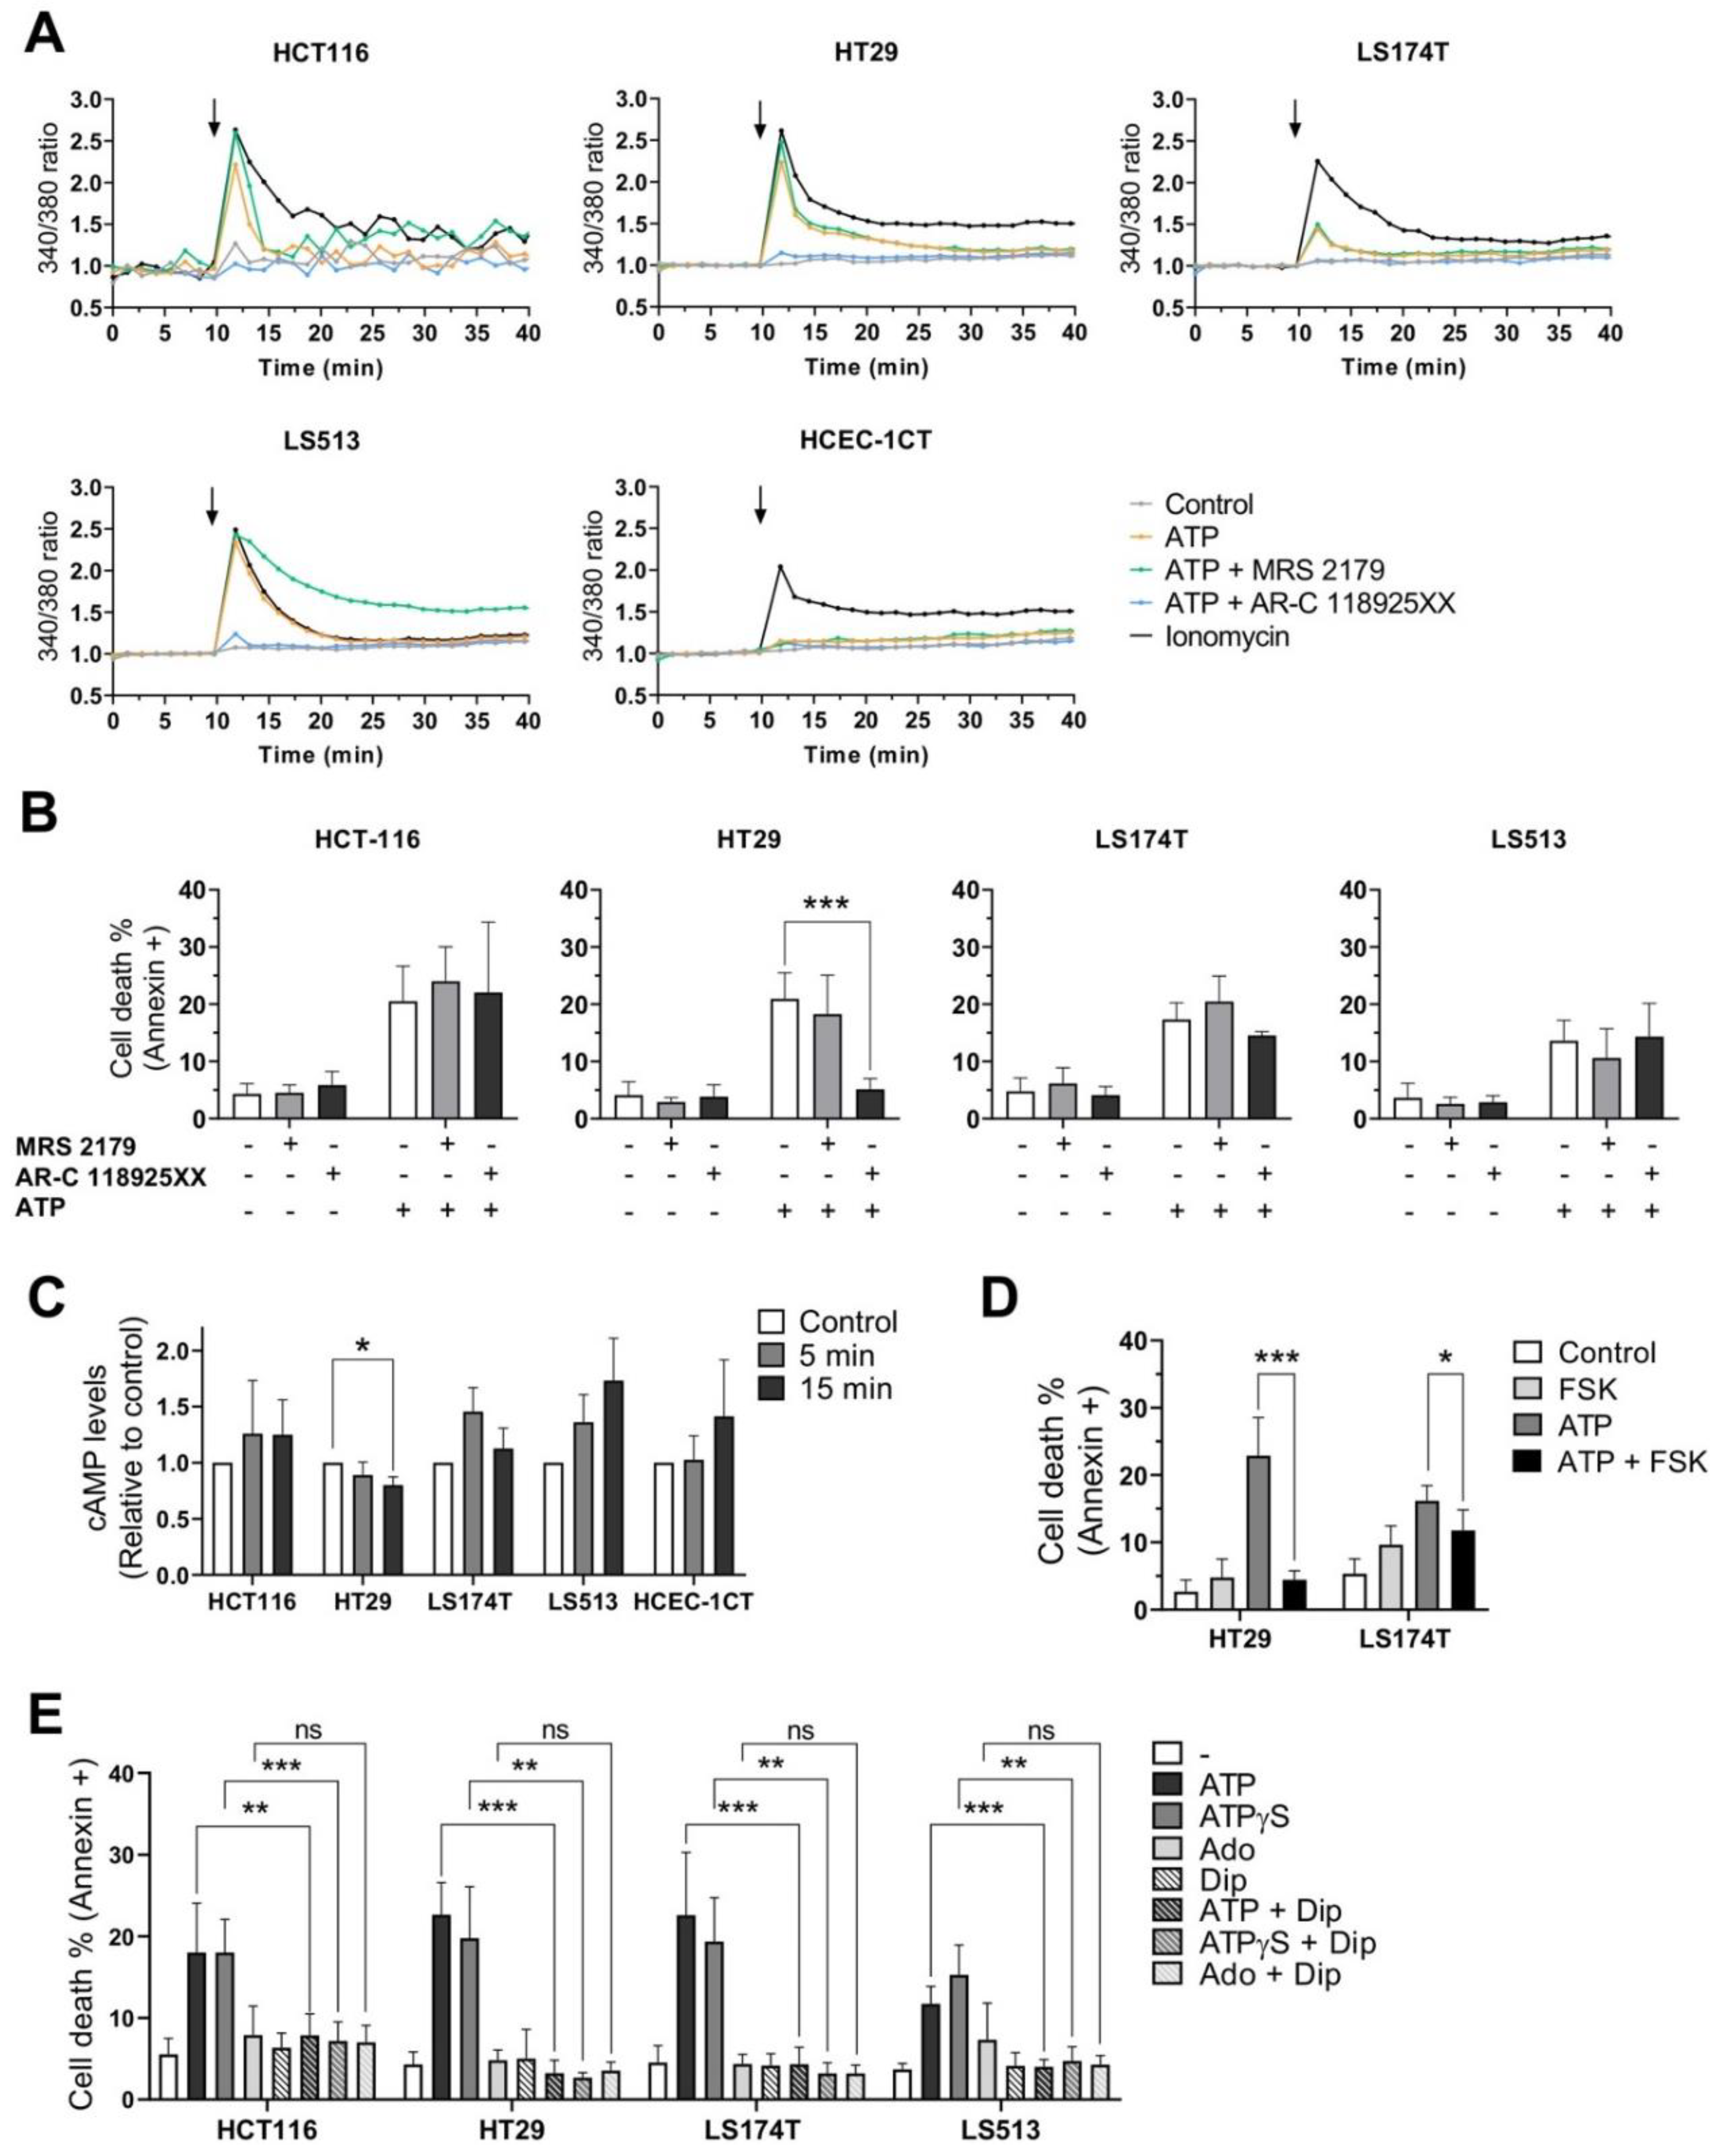
2.6. Effects of P2RY1 or P2RY2 Pharmacological Inhibition on Intracellular Ca2+ Mobilization Induced by Extracellular ATP
2.7. Effects of P2RY1 or P2RY2 Pharmacological Inhibition on CRC Cell Survival after Exposure to Extracellular ATP
2.8. Effects of Extracellular ATP Exposure on Cellular cAMP Levels
2.9. Effects of Dipyridamole on CRC Cell Survival after Exposure to Extracellular Purines
3. Discussion
4. Materials and Methods
4.1. Cells and Therapeutics
4.2. RNA Extraction and RNA Sequencing
4.3. Quantitative Real Time PCR

4.4. Cell Viability Assay
4.5. Spheroid Growth
4.6. Cell Death Induction and Inhibition
4.7. γ-H2AX Immunolabeling
4.8. Cell Cycle Analysis
4.9. Measurement of Intracellular Calcium Concentrations
4.10. cAMP Levels Measurement
4.11. Statistical Analysis
Supplementary Materials
Author Contributions
Funding
Institutional Review Board Statement
Informed Consent Statement
Data Availability Statement
Conflicts of Interest
References
- Burnstock, G.; Campbell, G.; Satchell, D.; Smythe, A. Evidence that adenosine triphosphate or a related nucleotide is the transmitter substance released by non-adrenergic inhibitory nerves in the gut. Br. J. Pharmacol. 1970, 40, 668–688. [Google Scholar] [CrossRef]
- Di Virgilio, F.; Adinolfi, E. Extracellular purines, purinergic receptors and tumor growth. Oncogene 2017, 36, 293–303. [Google Scholar] [CrossRef]
- Gudipaty, L.; Munetz, J.; Verhoef, P.A.; Dubyak, G.R. Essential role for Ca2+ in regulation of IL-1β secretion by P2X7 nucleotide receptor in monocytes, macrophages, and HEK-293 cells. Am. J. Physiol. Cell Physiol. 2003, 285, C286–C299. [Google Scholar] [CrossRef]
- Elliott, M.R.; Chekeni, F.B.; Trampont, P.C.; Lazarowski, E.R.; Kadl, A.; Walk, S.F.; Park, D.; Woodson, R.I.; Ostankovich, M.; Sharma, P.; et al. Nucleotides released by apoptotic cells act as a find-me signal to promote phagocytic clearance. Nature 2009, 461, 282–286. [Google Scholar] [CrossRef]
- Clayton, A.; Al-Taei, S.; Webber, J.; Mason, M.D.; Tabi, Z. Cancer exosomes express CD39 and CD73, which suppress T cells through adenosine production. J. Immunol. 2011, 187, 676–683. [Google Scholar] [CrossRef]
- Kroemer, G.; Galluzzi, L.; Kepp, O.; Zitvogel, L. Immunogenic cell death in cancer therapy. Annu Rev. Immunol. 2013, 31, 51–72. [Google Scholar] [CrossRef]
- Cekic, C.; Linden, J. Purinergic regulation of the immune system. Nat. Rev. Immunol. 2016, 16, 177–192. [Google Scholar] [CrossRef]
- Zitvogel, L.; Galluzzi, L.; Smyth, M.J.; Kroemer, G. Mechanism of action of conventional and targeted anticancer therapies: Reinstating immunosurveillance. Immunity 2013, 39, 74–88. [Google Scholar] [CrossRef]
- Idzko, M.; Dichmann, S.; Ferrari, D.; Di Virgilio, F.; la Sala, A.; Girolomoni, G.; Panther, E.; Norgauer, J. Nucleotides induce chemotaxis and actin polymerization in immature but not mature human dendritic cells via activation of pertussis toxin-sensitive P2y receptors. Blood 2002, 100, 925–932. [Google Scholar] [CrossRef]
- Chen, D.S.; Mellman, I. Oncology meets immunology: The cancer-immunity cycle. Immunity 2013, 39, 1–10. [Google Scholar] [CrossRef]
- Stagg, J.; Divisekera, U.; McLaughlin, N.; Sharkey, J.; Pommey, S.; Denoyer, D.; Dwyer, K.M.; Smyth, M.J. Anti-CD73 antibody therapy inhibits breast tumor growth and metastasis. Proc. Natl. Acad. Sci. USA 2010, 107, 1547–1552. [Google Scholar] [CrossRef]
- Pellegatti, P.; Raffaghello, L.; Bianchi, G.; Piccardi, F.; Pistoia, V.; Di Virgilio, F. Increased level of extracellular ATP at tumor sites: In vivo imaging with plasma membrane luciferase. PLoS ONE 2008, 3, e2599. [Google Scholar] [CrossRef]
- Resta, R.; Yamashita, Y.; Thompson, L.F. Ecto-enzyme and signaling functions of lymphocyte CD73. Immunol. Rev. 1998, 161, 95–109. [Google Scholar] [CrossRef] [PubMed]
- Stagg, J.; Smyth, M.J. Extracellular adenosine triphosphate and adenosine in cancer. Oncogene 2010, 29, 5346–5358. [Google Scholar] [CrossRef] [PubMed]
- Di Virgilio, F.; Sarti, A.C.; Falzoni, S.; De Marchi, E.; Adinolfi, E. Extracellular ATP and P2 purinergic signalling in the tumour microenvironment. Nat. Rev. Cancer 2018, 18, 601–618. [Google Scholar] [CrossRef]
- Borea, P.A.; Gessi, S.; Merighi, S.; Vincenzi, F.; Varani, K. Pharmacology of adenosine receptors: The state of the art. Physiol. Rev. 2018, 98, 1591–1625. [Google Scholar] [CrossRef] [PubMed]
- Von Kügelgen, I. Molecular pharmacology of P2Y receptor subtypes. Biochem. Pharmacol. 2021, 187, 114361. [Google Scholar] [CrossRef]
- Campos-Contreras, A.D.R.; Díaz-Muñoz, M.; Vázquez-Cuevas, F.G. Purinergic signaling in the hallmarks of cancer. Cells 2020, 9, 1612. [Google Scholar] [CrossRef]
- Adinolfi, E.; Melchiorri, L.; Falzoni, S.; Chiozzi, P.; Morelli, A.; Tieghi, A.; Cuneo, A.; Castoldi, G.; Di Virgilio, F.; Baricordi, O.R. P2X7 receptor expression in evolutive and indolent forms of chronic B lymphocytic leukemia. Blood 2002, 99, 706–708. [Google Scholar] [CrossRef]
- Slater, M.; Danieletto, S.; Pooley, M.; Cheng Teh, L.; Gidley-Baird, A.; Barden, J.A. Differentiation between cancerous and normal hyperplastic lobules in breast lesions. Breast Cancer Res. Treat. 2004, 83, 1–10. [Google Scholar] [CrossRef]
- Slater, M.; Danieletto, S.; Gidley-Baird, A.; Teh, L.C.; Barden, J.A. Early prostate cancer detected using expression of non-functional cytolytic P2X7 receptors. Histopathology 2004, 44, 206–215. [Google Scholar] [CrossRef]
- Solini, A.; Cuccato, S.; Ferrari, D.; Santini, E.; Gulinelli, S.; Callegari, M.G.; Dardano, A.; Faviana, P.; Madec, S.; Di Virgilio, F.; et al. Increased P2X7 receptor expression and function in thyroid papillary cancer: A new potential marker of the disease? Endocrinology 2008, 149, 389–396. [Google Scholar] [CrossRef]
- Qian, F.; Xiao, J.; Hu, B.; Sun, N.; Yin, W.; Zhu, J. High expression of P2X7R is an independent postoperative indicator of poor prognosis in colorectal cancer. Hum. Pathol. 2017, 64, 61–68. [Google Scholar] [CrossRef]
- Calik, I.; Calik, M.; Turken, G.; Ozercan, I.H. A promising independent prognostic biomarker in colorectal cancer: P2X7 receptor. Int. J. Clin. Exp. Pathol. 2020, 13, 107–121. [Google Scholar]
- Asif, A.; Khalid, M.; Manzoor, S.; Ahmad, H.; Rehman, A.U. Role of purinergic receptors in hepatobiliary carcinoma in pakistani population: An approach towards proinflammatory role of P2X4 and P2X7 receptors. Purinergic Signal. 2019, 15, 367–374. [Google Scholar] [CrossRef]
- Qiu, Y.; Liu, Y.; Li, W.-H.; Zhang, H.-Q.; Tian, X.-X.; Fang, W.-G. P2Y2 receptor promotes the migration and invasion of breast cancer cells via EMT-related genes snail and E-cadherin. Oncol. Rep. 2018, 39, 138–150. [Google Scholar] [CrossRef]
- Aquea, G.; Bresky, G.; Lancellotti, D.; Madariaga, J.A.; Zaffiri, V.; Urzua, U.; Haberle, S.; Bernal, G. Increased expression of P2RY2, CD248 and EphB1 in gastric cancers from chilean patients. Asian Pac. J. Cancer Prev. 2014, 15, 1931–1936. [Google Scholar] [CrossRef]
- Hu, L.-P.; Zhang, X.-X.; Jiang, S.-H.; Tao, L.-Y.; Li, Q.; Zhu, L.-L.; Yang, M.-W.; Huo, Y.-M.; Jiang, Y.-S.; Tian, G.-A.; et al. Targeting purinergic receptor P2Y2 prevents the growth of pancreatic ductal adenocarcinoma by inhibiting cancer cell glycolysis. Clin. Cancer Res. 2019, 25, 1318–1330. [Google Scholar] [CrossRef]
- Greig, A.V.H.; Linge, C.; Healy, V.; Lim, P.; Clayton, E.; Rustin, M.H.A.; McGrouther, D.A.; Burnstock, G. Expression of purinergic receptors in non-melanoma skin cancers and their functional roles in A431 cells. J. Invest. Dermatol. 2003, 121, 315–327. [Google Scholar] [CrossRef]
- Xiang, H.-J.; Liu, Z.-C.; Wang, D.-S.; Chen, Y.; Yang, Y.-L.; Dou, K.-F. Adenosine A(2b) receptor is highly expressed in human hepatocellular carcinoma. Hepatol. Res. 2006, 36, 56–60. [Google Scholar] [CrossRef]
- Ma, D.-F.; Kondo, T.; Nakazawa, T.; Niu, D.-F.; Mochizuki, K.; Kawasaki, T.; Yamane, T.; Katoh, R. Hypoxia-inducible adenosine A2B receptor modulates proliferation of colon carcinoma cells. Hum. Pathol. 2010, 41, 1550–1557. [Google Scholar] [CrossRef]
- Kasama, H.; Sakamoto, Y.; Kasamatsu, A.; Okamoto, A.; Koyama, T.; Minakawa, Y.; Ogawara, K.; Yokoe, H.; Shiiba, M.; Tanzawa, H.; et al. Adenosine A2b receptor promotes progression of human oral cancer. BMC Cancer 2015, 15, 563. [Google Scholar] [CrossRef]
- Zhou, Y.; Chu, X.; Deng, F.; Tong, L.; Tong, G.; Yi, Y.; Liu, J.; Tang, J.; Tang, Y.; Xia, Y.; et al. The adenosine A2b receptor promotes tumor progression of bladder urothelial carcinoma by enhancing MAPK signaling pathway. Oncotarget 2017, 8, 48755–48768. [Google Scholar] [CrossRef]
- Zheng, L.M.; Zychlinsky, A.; Liu, C.C.; Ojcius, D.M.; Young, J.D. Extracellular ATP as a trigger for apoptosis or programmed cell death. J. Cell Biol. 1991, 112, 279–288. [Google Scholar] [CrossRef]
- Bronte, V.; Macino, B.; Zambon, A.; Rosato, A.; Mandruzzato, S.; Zanovello, P.; Collavo, D. Protein tyrosine kinases and phosphatases control apoptosis induced by extracellular adenosine 5’-triphosphate. Biochem. Biophys. Res. Commun. 1996, 218, 344–351. [Google Scholar] [CrossRef]
- Yasuda, Y.; Saito, M.; Yamamura, T.; Yaguchi, T.; Nishizaki, T. Extracellular adenosine induces apoptosis in Caco-2 human colonic cancer cells by activating caspase-9/-3 via A(2a) adenosine receptors. J. Gastroenterol. 2009, 44, 56–65. [Google Scholar] [CrossRef]
- Qian, Y.; Wang, X.; Liu, Y.; Li, Y.; Colvin, R.A.; Tong, L.; Wu, S.; Chen, X. Extracellular ATP Is Internalized by macropinocytosis and induces intracellular ATP increase and drug resistance in cancer cells. Cancer Lett. 2014, 351, 242–251. [Google Scholar] [CrossRef]
- White, N.; Burnstock, G. P2 receptors and cancer. Trends Pharmacol. Sci. 2006, 27, 211–217. [Google Scholar] [CrossRef]
- Gessi, S.; Merighi, S.; Sacchetto, V.; Simioni, C.; Borea, P.A. Adenosine receptors and cancer. Biochim. Biophys. Acta 2011, 1808, 1400–1412. [Google Scholar] [CrossRef]
- Li, W.-H.; Qiu, Y.; Zhang, H.-Q.; Liu, Y.; You, J.-F.; Tian, X.-X.; Fang, W.-G. P2Y2 receptor promotes cell invasion and metastasis in prostate cancer cells. Br. J. Cancer 2013, 109, 1666–1675. [Google Scholar] [CrossRef]
- Xie, R.; Xu, J.; Wen, G.; Jin, H.; Liu, X.; Yang, Y.; Ji, B.; Jiang, Y.; Song, P.; Dong, H.; et al. The P2Y2 nucleotide receptor mediates the proliferation and migration of human hepatocellular carcinoma cells induced by ATP. J. Biol. Chem. 2014, 289, 19137–19149. [Google Scholar] [CrossRef] [PubMed]
- Joo, Y.N.; Jin, H.; Eun, S.Y.; Park, S.W.; Chang, K.C.; Kim, H.J. P2Y2R activation by nucleotides released from the highly metastatic breast cancer cell MDA-MB-231 contributes to pre-metastatic niche formation by mediating lysyl oxidase secretion, collagen crosslinking, and monocyte recruitment. Oncotarget 2014, 5, 9322–9334. [Google Scholar] [CrossRef]
- Coutinho-Silva, R.; Stahl, L.; Cheung, K.-K.; de Campos, N.E.; de Oliveira Souza, C.; Ojcius, D.M.; Burnstock, G. P2X and P2Y purinergic receptors on human intestinal epithelial carcinoma cells: Effects of extracellular nucleotides on apoptosis and cell proliferation. Am. J. Physiol. Gastrointest. Liver Physiol. 2005, 288, G1024–G1035. [Google Scholar] [CrossRef]
- Yang, G.; Zhang, S.; Zhang, Y.; Zhou, Q.; Peng, S.; Zhang, T.; Yang, C.; Zhu, Z.; Zhang, F. The inhibitory effects of extracellular ATP on the growth of nasopharyngeal carcinoma cells via P2Y2 receptor and osteopontin. J. Exp. Clin. Cancer Res. 2014, 33, 53. [Google Scholar] [CrossRef] [PubMed]
- Arnaud-Sampaio, V.F.; Rabelo, I.L.A.; Ulrich, H.; Lameu, C. The P2X7 receptor in the maintenance of cancer stem cells, chemoresistance and metastasis. Stem. Cell Rev. Rep. 2020, 16, 288–300. [Google Scholar] [CrossRef]
- Park, M.; Kim, J.; Phuong, N.T.T.; Park, J.G.; Park, J.-H.; Kim, Y.-C.; Baek, M.C.; Lim, S.C.; Kang, K.W. Involvement of the P2X7 receptor in the migration and metastasis of tamoxifen-resistant breast cancer: Effects on small extracellular vesicles production. Sci. Rep. 2019, 9, 11587. [Google Scholar] [CrossRef]
- Lara, R.; Adinolfi, E.; Harwood, C.A.; Philpott, M.; Barden, J.A.; Di Virgilio, F.; McNulty, S. P2X7 in cancer: From molecular mechanisms to therapeutics. Front. Pharmacol. 2020, 11, 793. [Google Scholar] [CrossRef] [PubMed]
- Wan, H.-X.; Hu, J.-H.; Xie, R.; Yang, S.-M.; Dong, H. Important roles of P2Y receptors in the inflammation and cancer of digestive system. Oncotarget 2016, 7, 28736–28747. [Google Scholar] [CrossRef]
- Höpfner, M.; Lemmer, K.; Jansen, A.; Hanski, C.; Riecken, E.O.; Gavish, M.; Mann, B.; Buhr, H.; Glassmeier, G.; Scherübl, H. Expression of functional P2-purinergic receptors in primary cultures of human colorectal carcinoma cells. Biochem. Biophys. Res. Commun. 1998, 251, 811–817. [Google Scholar] [CrossRef]
- Höpfner, M.; Maaser, K.; Barthel, B.; von Lampe, B.; Hanski, C.; Riecken, E.O.; Zeitz, M.; Scherübl, H. Growth inhibition and apoptosis induced by P2Y2 receptors in human colorectal carcinoma cells: Involvement of intracellular calcium and cyclic adenosine monophosphate. Int. J. Colorectal. Dis. 2001, 16, 154–166. [Google Scholar] [CrossRef]
- Nylund, G.; Nordgren, S.; Delbro, D.S. Expression of P2Y2 purinoceptors in MCG 101 murine sarcoma cells, and HT-29 human colon carcinoma cells. Auton. Neurosci. 2004, 112, 69–79. [Google Scholar] [CrossRef]
- Nylund, G.; Hultman, L.; Nordgren, S.; Delbro, D.S. P2Y2- and P2Y4 purinergic receptors are over-expressed in human colon cancer. Auton. Autacoid Pharmacol. 2007, 27, 79–84. [Google Scholar] [CrossRef]
- Li, X.; Qi, X.; Zhou, L.; Fu, W.; Abdul-Karim, F.W.; Maclennan, G.; Gorodeski, G.I. P2X(7) receptor expression is decreased in epithelial cancer cells of ectodermal, uro-genital sinus, and distal paramesonephric duct origin. Purinergic Signal. 2009, 5, 351–368. [Google Scholar] [CrossRef]
- Zhang, Y.; Ding, J.; Wang, L. The role of P2X7 receptor in prognosis and metastasis of colorectal cancer. Adv. Med. Sci. 2019, 64, 388–394. [Google Scholar] [CrossRef] [PubMed]
- Roig, A.I.; Eskiocak, U.; Hight, S.K.; Kim, S.B.; Delgado, O.; Souza, R.F.; Spechler, S.J.; Wright, W.E.; Shay, J.W. Immortalized epithelial cells derived from human colon biopsies express stem cell markers and differentiate in vitro. Gastroenterology 2010, 138, 1012–1021. [Google Scholar] [CrossRef] [PubMed]
- Eastman, A. Improving anticancer drug development begins with cell culture: Misinformation perpetrated by the misuse of cytotoxicity assays. Oncotarget 2017, 8, 8854. [Google Scholar] [CrossRef] [PubMed]
- Rogakou, E.P.; Nieves-Neira, W.; Boon, C.; Pommier, Y.; Bonner, W.M. Initiation of DNA fragmentation during apoptosis induces phosphorylation of H2AX histone at serine 139. J. Biol. Chem. 2000, 275, 9390–9395. [Google Scholar] [CrossRef]
- Ding, Y.; He, C.; Lu, S.; Wang, X.; Wang, C.; Wang, L.; Zhang, J.; Piao, M.; Chi, G.; Luo, Y.; et al. MLKL contributes to shikonin-induced glioma cell necroptosis via promotion of chromatinolysis. Cancer Lett. 2019, 467, 58–71. [Google Scholar] [CrossRef]
- Baritaud, M.; Cabon, L.; Delavallée, L.; Galán-Malo, P.; Gilles, M.-E.; Brunelle-Navas, M.-N.; Susin, S.A. AIF-mediated caspase-independent necroptosis requires ATM and DNA-PK-induced histone H2AX Ser139 phosphorylation. Cell Death Dis. 2012, 3, e390. [Google Scholar] [CrossRef]
- Gresele, P.; Momi, S.; Falcinelli, E. Anti-platelet therapy: Phosphodiesterase inhibitors. Br. J. Clin. Pharmacol. 2011, 72, 634–646. [Google Scholar] [CrossRef]
- Baillie, G.S.; Tejeda, G.S.; Kelly, M.P. Therapeutic targeting of 3’,5’-cyclic nucleotide phosphodiesterases: Inhibition and beyond. Nat. Rev. Drug Discov. 2019, 18, 770–796. [Google Scholar] [CrossRef]
- Harker, L.A.; Kadatz, R.A. Mechanism of action of dipyridamole. Thromb. Res. Suppl. 1983, 4, 39–46. [Google Scholar] [CrossRef]
- Wang, C.; Lin, W.; Playa, H.; Sun, S.; Cameron, K.; Buolamwini, J. Dipyridamole analogues as pharmacological inhibitors of equilibrative nucleoside transporters. identification of novel potent and selective inhibitors of the adenosine transporter function of human equilibrative nucleoside transporter 4 (HENT4). Biochem. Pharmacol. 2013, 86. [Google Scholar] [CrossRef]
- Vultaggio-Poma, V.; Sarti, A.C.; Di Virgilio, F. Extracellular ATP: A feasible target for cancer therapy. Cells 2020, 9, 2496. [Google Scholar] [CrossRef]
- Yaguchi, T.; Saito, M.; Yasuda, Y.; Kanno, T.; Nakano, T.; Nishizaki, T. Higher concentrations of extracellular ATP suppress proliferation of Caco-2 human colonic cancer cells via an unknown receptor involving PKC inhibition. Cell Physiol. Biochem. 2010, 26, 125–134. [Google Scholar] [CrossRef]
- Roger, S.; Jelassi, B.; Couillin, I.; Pelegrin, P.; Besson, P.; Jiang, L.-H. Understanding the roles of the P2X7 receptor in solid tumour progression and therapeutic perspectives. Biochim. Biophys. Acta 2015, 1848, 2584–2602. [Google Scholar] [CrossRef]
- Escargueil, A.E.; Prado, S.; Dezaire, A.; Clairambault, J.; Larsen, A.K.; Soares, D.G. Genotype- or phenotype-targeting anticancer therapies? Lessons from tumor evolutionary biology. Curr. Pharm. Des. 2016, 22, 6625–6644. [Google Scholar] [CrossRef] [PubMed]
- Zhao, H.; Wu, L.; Yan, G.; Chen, Y.; Zhou, M.; Wu, Y.; Li, Y. Inflammation and tumor progression: Signaling pathways and targeted intervention. Signal. Transduct. Target. Ther. 2021, 6, 263. [Google Scholar] [CrossRef]
- Pelegrin, P.; Surprenant, A. Pannexin-1 mediates large pore formation and interleukin-1beta release by the ATP-Gated P2X7 receptor. EMBO J. 2006, 25, 5071–5082. [Google Scholar] [CrossRef] [PubMed]
- Crespo Yanguas, S.; Willebrords, J.; Johnstone, S.R.; Maes, M.; Decrock, E.; De Bock, M.; Leybaert, L.; Cogliati, B.; Vinken, M. Pannexin1 as mediator of inflammation and cell death. Biochim. Biophys. Acta Mol. Cell Res. 2017, 1864, 51–61. [Google Scholar] [CrossRef] [PubMed]
- Dong, X.F.; Berthois, Y.; Martin, P.M. Effect of epidermal growth factor on the proliferation of human epithelial cancer cell lines: Correlation with the level of occupied EGF receptor. Anticancer Res. 1991, 11, 737–743. [Google Scholar]
- Silvy, M.; Martin, P.M.; Chajry, N.; Berthois, Y. Differential dose-dependent effects of epidermal growth factor on gene expression in A431 cells: Evidence for a signal transduction pathway that can bypass Raf-1 activation. Endocrinology 1998, 139, 2382–2391. [Google Scholar] [CrossRef][Green Version]
- Bellefeuille, S.D.; Molle, C.M.; Gendron, F.-P. Reviewing the role of P2Y receptors in specific gastrointestinal cancers. Purinergic Signal. 2019, 15, 451–463. [Google Scholar] [CrossRef] [PubMed]
- Woods, L.T.; Forti, K.M.; Shanbhag, V.C.; Camden, J.M.; Weisman, G.A. P2Y receptors for extracellular nucleotides: Contributions to cancer progression and therapeutic implications. Biochem. Pharmacol. 2021, 187, 114406. [Google Scholar] [CrossRef] [PubMed]
- Tang, Z.; Kang, B.; Li, C.; Chen, T.; Zhang, Z. GEPIA2: An enhanced web server for large-scale expression profiling and interactive analysis. Nucleic Acids Res. 2019, 47, W556–W560. [Google Scholar] [CrossRef] [PubMed]
- Gendron, F.-P.; Placet, M.; Arguin, G. P2Y2 receptor functions in cancer: A perspective in the context of colorectal cancer. Adv. Exp. Med. Biol. 2017, 1051, 91–106. [Google Scholar] [CrossRef]
- Woods, L.T.; Jasmer, K.J.; Muñoz Forti, K.; Shanbhag, V.C.; Camden, J.M.; Erb, L.; Petris, M.J.; Weisman, G.A. P2Y2 receptors mediate nucleotide-induced EGFR phosphorylation and stimulate proliferation and tumorigenesis of head and neck squamous cell carcinoma cell lines. Oral. Oncol. 2020, 109, 104808. [Google Scholar] [CrossRef] [PubMed]
- Zhang, Y.; Gong, L.; Zhang, H.; Du, Q.; You, J.; Tian, X.; Fang, W. Extracellular ATP enhances in vitro invasion of prostate cancer cells by activating Rho GTPase and upregulating MMPs expression. Cancer Lett. 2010, 293, 189–197. [Google Scholar] [CrossRef]
- Bong, A.H.L.; Monteith, G.R. Calcium signaling and the therapeutic targeting of cancer cells. Biochim. Biophys. Acta Mol. Cell Res. 2018, 1865, 1786–1794. [Google Scholar] [CrossRef]
- Xu, M.; Seas, A.; Kiyani, M.; Ji, K.S.Y.; Bell, H.N. A temporal examination of calcium signaling in cancer- from tumorigenesis, to immune evasion, and metastasis. Cell Biosci. 2018, 8, 25. [Google Scholar] [CrossRef]
- Cao, Y.; Wang, X.; Li, Y.; Evers, M.; Zhang, H.; Chen, X. Extracellular and macropinocytosis internalized ATP work together to induce epithelial-mesenchymal transition and other early metastatic activities in lung cancer. Cancer Cell Int. 2019, 19, 254. [Google Scholar] [CrossRef] [PubMed]
- Alharbi, A.; Zhang, Y.; Parrington, J. Deciphering the role of Ca2+ signalling in cancer metastasis: From the bench to the bedside. Cancers 2021, 13, 179. [Google Scholar] [CrossRef]
- Wang, M.-X.; Ren, L.-M. Growth inhibitory effect and apoptosis induced by extracellular ATP and adenosine on human gastric carcinoma cells: Involvement of intracellular uptake of adenosine. Acta Pharmacol. Sin. 2006, 27, 1085–1092. [Google Scholar] [CrossRef] [PubMed][Green Version]
- Halls, M.L.; Cooper, D.M.F. Regulation by Ca2+-signaling pathways of adenylyl cyclases. Cold Spring Harb. Perspect. Biol. 2011, 3, a004143. [Google Scholar] [CrossRef]
- Ben-David, U.; Siranosian, B.; Ha, G.; Tang, H.; Oren, Y.; Hinohara, K.; Strathdee, C.A.; Dempster, J.; Lyons, N.J.; Burns, R.; et al. Genetic and transcriptional evolution alters cancer cell line drug response. Nature 2018, 560, 325–330. [Google Scholar] [CrossRef] [PubMed]
- Löffler, I.; Grün, M.; Böhmer, F.D.; Rubio, I. Role of CAMP in the promotion of colorectal. cancer cell growth by prostaglandin E2. BMC Cancer 2008, 8, 380. [Google Scholar] [CrossRef]
- Zhang, H.; Kong, Q.; Wang, J.; Jiang, Y.; Hua, H. Complex roles of CAMP-PKA-CREB signaling in cancer. Exp. Hematol. Oncol. 2020, 9, 32. [Google Scholar] [CrossRef]
- Chakrabarti, S.; Freedman, J.E. Dipyridamole, cerebrovascular disease, and the vasculature. Vascular Pharmacology 2008, 48, 143–149. [Google Scholar] [CrossRef]
- Schneider, C.; Wiendl, H.; Ogilvie, A. Biphasic cytotoxic mechanism of extracellular ATP on U-937 human histiocytic leukemia cells: Involvement of adenosine generation. Biochim. Biophys. Acta 2001, 1538, 190–205. [Google Scholar] [CrossRef]
- Fajardo, A.M.; Piazza, G.A.; Tinsley, H.N. The role of cyclic nucleotide signaling pathways in cancer: Targets for prevention and treatment. Cancers 2014, 6, 436–458. [Google Scholar] [CrossRef]
- Harada, N. Role of nitric oxide on purinergic signalling in the cochlea. Purinergic Signal. 2010, 6, 211–220. [Google Scholar] [CrossRef] [PubMed][Green Version]
- Zimmermann, H. Extracellular ATP and other nucleotides-ubiquitous triggers of intercellular messenger release. Purinergic Signal. 2016, 12, 25–57. [Google Scholar] [CrossRef]
- Jourdren, L.; Bernard, M.; Dillies, M.-A.; Le Crom, S. Eoulsan: A cloud computing-based framework facilitating high throughput sequencing analyses. Bioinformatics 2012, 28, 1542–1543. [Google Scholar] [CrossRef] [PubMed]
- Dobin, A.; Davis, C.A.; Schlesinger, F.; Drenkow, J.; Zaleski, C.; Jha, S.; Batut, P.; Chaisson, M.; Gingeras, T.R. STAR: Ultrafast universal RNA-Seq aligner. Bioinformatics 2013, 29, 15–21. [Google Scholar] [CrossRef]
- Li, H.; Handsaker, B.; Wysoker, A.; Fennell, T.; Ruan, J.; Homer, N.; Marth, G.; Abecasis, G.; Durbin, R. 1000 genome project data processing subgroup the sequence alignment/map format and SAMtools. Bioinformatics 2009, 25, 2078–2079. [Google Scholar] [CrossRef]
- Anders, S.; Pyl, P.T.; Huber, W. HTSeq--a python framework to work with high-throughput sequencing data. Bioinformatics 2015, 31, 166–169. [Google Scholar] [CrossRef]
- Love, M.I.; Huber, W.; Anders, S. Moderated estimation of fold change and dispersion for RNA-Seq data with DESeq2. Genome Biol. 2014, 15, 550. [Google Scholar] [CrossRef] [PubMed]
- Livak, K.J.; Schmittgen, T.D. Analysis of relative gene expression data using real-time quantitative PCR and the 2(-Delta Delta C(T)) method. Methods 2001, 25. [Google Scholar] [CrossRef]


Publisher’s Note: MDPI stays neutral with regard to jurisdictional claims in published maps and institutional affiliations. |
© 2021 by the authors. Licensee MDPI, Basel, Switzerland. This article is an open access article distributed under the terms and conditions of the Creative Commons Attribution (CC BY) license (https://creativecommons.org/licenses/by/4.0/).
Share and Cite
Dillard, C.; Borde, C.; Mohammad, A.; Puchois, V.; Jourdren, L.; Larsen, A.K.; Sabbah, M.; Maréchal, V.; Escargueil, A.E.; Pramil, E. Expression Pattern of Purinergic Signaling Components in Colorectal Cancer Cells and Differential Cellular Outcomes Induced by Extracellular ATP and Adenosine. Int. J. Mol. Sci. 2021, 22, 11472. https://doi.org/10.3390/ijms222111472
Dillard C, Borde C, Mohammad A, Puchois V, Jourdren L, Larsen AK, Sabbah M, Maréchal V, Escargueil AE, Pramil E. Expression Pattern of Purinergic Signaling Components in Colorectal Cancer Cells and Differential Cellular Outcomes Induced by Extracellular ATP and Adenosine. International Journal of Molecular Sciences. 2021; 22(21):11472. https://doi.org/10.3390/ijms222111472
Chicago/Turabian StyleDillard, Clémentine, Chloé Borde, Ammara Mohammad, Virginie Puchois, Laurent Jourdren, Annette K. Larsen, Michèle Sabbah, Vincent Maréchal, Alexandre E. Escargueil, and Elodie Pramil. 2021. "Expression Pattern of Purinergic Signaling Components in Colorectal Cancer Cells and Differential Cellular Outcomes Induced by Extracellular ATP and Adenosine" International Journal of Molecular Sciences 22, no. 21: 11472. https://doi.org/10.3390/ijms222111472
APA StyleDillard, C., Borde, C., Mohammad, A., Puchois, V., Jourdren, L., Larsen, A. K., Sabbah, M., Maréchal, V., Escargueil, A. E., & Pramil, E. (2021). Expression Pattern of Purinergic Signaling Components in Colorectal Cancer Cells and Differential Cellular Outcomes Induced by Extracellular ATP and Adenosine. International Journal of Molecular Sciences, 22(21), 11472. https://doi.org/10.3390/ijms222111472