Article

Adaptive Thermogenesis in a Mouse Model Lacking Selenoprotein Biosynthesis in Brown Adipocytes

1
Department of Cell and Molecular Biology, John A. Burns School of Medicine, University of Hawaii at Manoa, Honolulu, HI 96813, USA
2
Pacific Biomedical Research Center, School of Ocean and Earth Science and Technology, University of Hawaii at Manoa, Honolulu, HI 96822, USA
3
Department of Quantitative Health Sciences, John A. Burns School of Medicine, University of Hawaii at Manoa, Honolulu, HI 96822, USA
4
Molecular Biology of Selenium Section, Mouse Genetics Program, National Cancer Institute, National Institutes of Health, Bethesda, MD 20892, USA
*
Author to whom correspondence should be addressed.
Current address: Department of Internal Medicine, Ribeirão Preto Medical School, University of São Paulo—FMRP/USP, São Paulo 14049-900, Brazil.
Int. J. Mol. Sci. 2021, 22(2), 611; https://doi.org/10.3390/ijms22020611
Submission received: 8 November 2020 / Revised: 6 January 2021 / Accepted: 6 January 2021 / Published: 9 January 2021
(This article belongs to the Special Issue Transgenic Mice in Human Diseases: Insights from Molecular Research)

Abstract

:
Selenoproteins are a class of proteins with the selenium-containing amino acid selenocysteine (Sec) in their primary structure. Sec is incorporated into selenoproteins via recoding of the stop codon UGA, with specific cis and trans factors required during translation to avoid UGA recognition as a stop codon, including a Sec-specific tRNA, tRNA[Ser]Sec, encoded in mice by the gene Trsp. Whole-body deletion of Trsp in mouse is embryonically lethal, while targeted deletion of Trsp in mice has been used to understand the role of selenoproteins in the health and physiology of various tissues. We developed a mouse model with the targeted deletion of Trsp in brown adipocytes (Trspf/f-Ucp1-Cre+/−), a cell type predominant in brown adipose tissue (BAT) controlling energy expenditure via activation of adaptive thermogenesis, mostly using uncoupling protein 1 (Ucp1). At room temperature, Trspf/f-Ucp1-Cre+/− mice maintain oxygen consumption and Ucp1 expression, with male Trspf/f-Ucp1-Cre+/− mice accumulating more triglycerides in BAT than both female Trspf/f-Ucp1-Cre+/− mice or Trspf/f controls. Acute cold exposure neither reduced core body temperature nor changed the expression of selenoprotein iodothyronine deiodinase type II (Dio2), a marker of adaptive thermogenesis, in Trspf/f-Ucp1-Cre+/− mice. Microarray analysis of BAT from Trspf/f-Ucp1-Cre+/− mice revealed glutathione S-transferase alpha 3 (Gsta3) and ELMO domain containing 2 (Elmod2) as the transcripts most affected by the loss of Trsp. Male Trspf/f-Ucp1-Cre+/− mice showed mild hypothyroidism while downregulating thyroid hormone-responsive genes Thrsp and Tshr in their BATs. In summary, modest changes in the BAT of Trspf/f-Ucp1-Cre +/− mice implicate a mild thyroid hormone dysfunction in brown adipocytes.

1. Introduction

Selenoproteins are a small group of proteins containing the micronutrient selenium in their molecule. These proteins are involved in redox reactions that can reduce oxidative stress, activate thyroid hormones, and act on endoplasmic reticulum-associated degradation of misfolded proteins. There are only 24 and 25 selenoproteins in mice and humans, respectively. Nevertheless, selenoproteins exert a profound effect in several aspects of health, including the pathophysiology of different types of cancer [1,2,3], autoimmune diseases [4], irritable bowel syndrome [5], type 2 diabetes [6,7], and thyroid disorders [8,9].
A hallmark feature of selenoproteins is the incorporation of selenium as the amino acid selenocysteine (Sec) in their primary structure. Sec is encoded by the UGA codon, also recognized as a stop codon. Circumvention of the stop recognition occurs due to a combination of cis and trans factors that have been extensively reviewed elsewhere [10,11,12,13,14,15,16,17,18]. Notably, one of the key factors is the specific tRNA[Ser]Sec, required for successful insertion of Sec during translation of selenoproteins, and encoded by the gene Trsp.
Total loss of Trsp in mice is embryonically lethal [19], a finding that highlights how essential selenoproteins are for life. To demonstrate the role of selenoproteins in various organs, tissues and cell types, targeted deletion of Trsp in specific cell types has been carried out for decades, with surprising consequences [10,20,21]. However, the targeted deletion of Trsp in brown adipocytes, a cell type critical for thermoregulation and energy expenditure in mammals, had not been attempted.
Brown adipocytes are the most abundant cell type found in the brown adipose tissue (BAT), the main site for adaptive thermogenesis in rodents, and subpopulations of brown adipocytes present distinct thermogenic potential [22,23]. Mammalian adaptive thermogenesis is classically activated upon exposure to cold or after caloric overload. BAT cold-induced adaptive thermogenesis relies primarily on the actions of uncoupling protein 1 (Ucp1), a proton pump localized in the inner membrane of mitochondria of brown adipocytes that dissipates energy from ATP synthesis as heat [24,25]. Ucp1 expression is synergistically upregulated after activation of beta-adrenergic signaling and by thyroid hormone 3,3′,5-triiodothyronine (T3) [26]. Interestingly, T3 is mostly produced locally in cells, after the removal of one iodine from thyroxine (T4), the main prohormone from the thyroid gland. Conversion of T4 into active T3 in brown adipocytes is catalyzed by iodothyronine deiodinase type 2 (Dio2). Dio2 is a selenoprotein highly expressed in activated brown adipocytes and essential for cold-induced thermogenesis [27], allowing for the increased Ucp1 expression [28,29]. Mice with a disruption of Dio2 cannot properly carry out adaptive thermogenesis, either by cold exposure or caloric overload at room temperature [28,30,31]. Besides Dio2, glutathione peroxidases 1, 3, and 4 (Gpx1, Gpx3, and Gpx4, respectively), thioredoxin reductases 1, 2 and 3 (Txnrd1, Txnrd2, and Txnrd3, respectively), selenoproteins H, O, T and P (SelenoH, SelenoO, SelenoT, and SelenoP, respectively), and selenophosphate synthetase 2 (Sephs2) have also been found in BAT using a proteomics analysis [32], but the role of these selenoproteins in BAT function is unknown.
We report the generation of a mouse model with a targeted deletion of the gene for Trsp in brown adipocytes, the Trspf/f-Ucp1-Cre+/− mice, to characterize the influence of selenoproteins in BAT function. These mice thermoregulate without changes in energy expenditure or Ucp1 expression, and surprisingly respond to acute cold exposure adequately. We also observed novel genes that respond to the lack of Trsp in brown adipocytes both at room temperature and after acute cold exposure, particularly those involved in methylation pathways and response to thyroid hormone levels.

2. Results

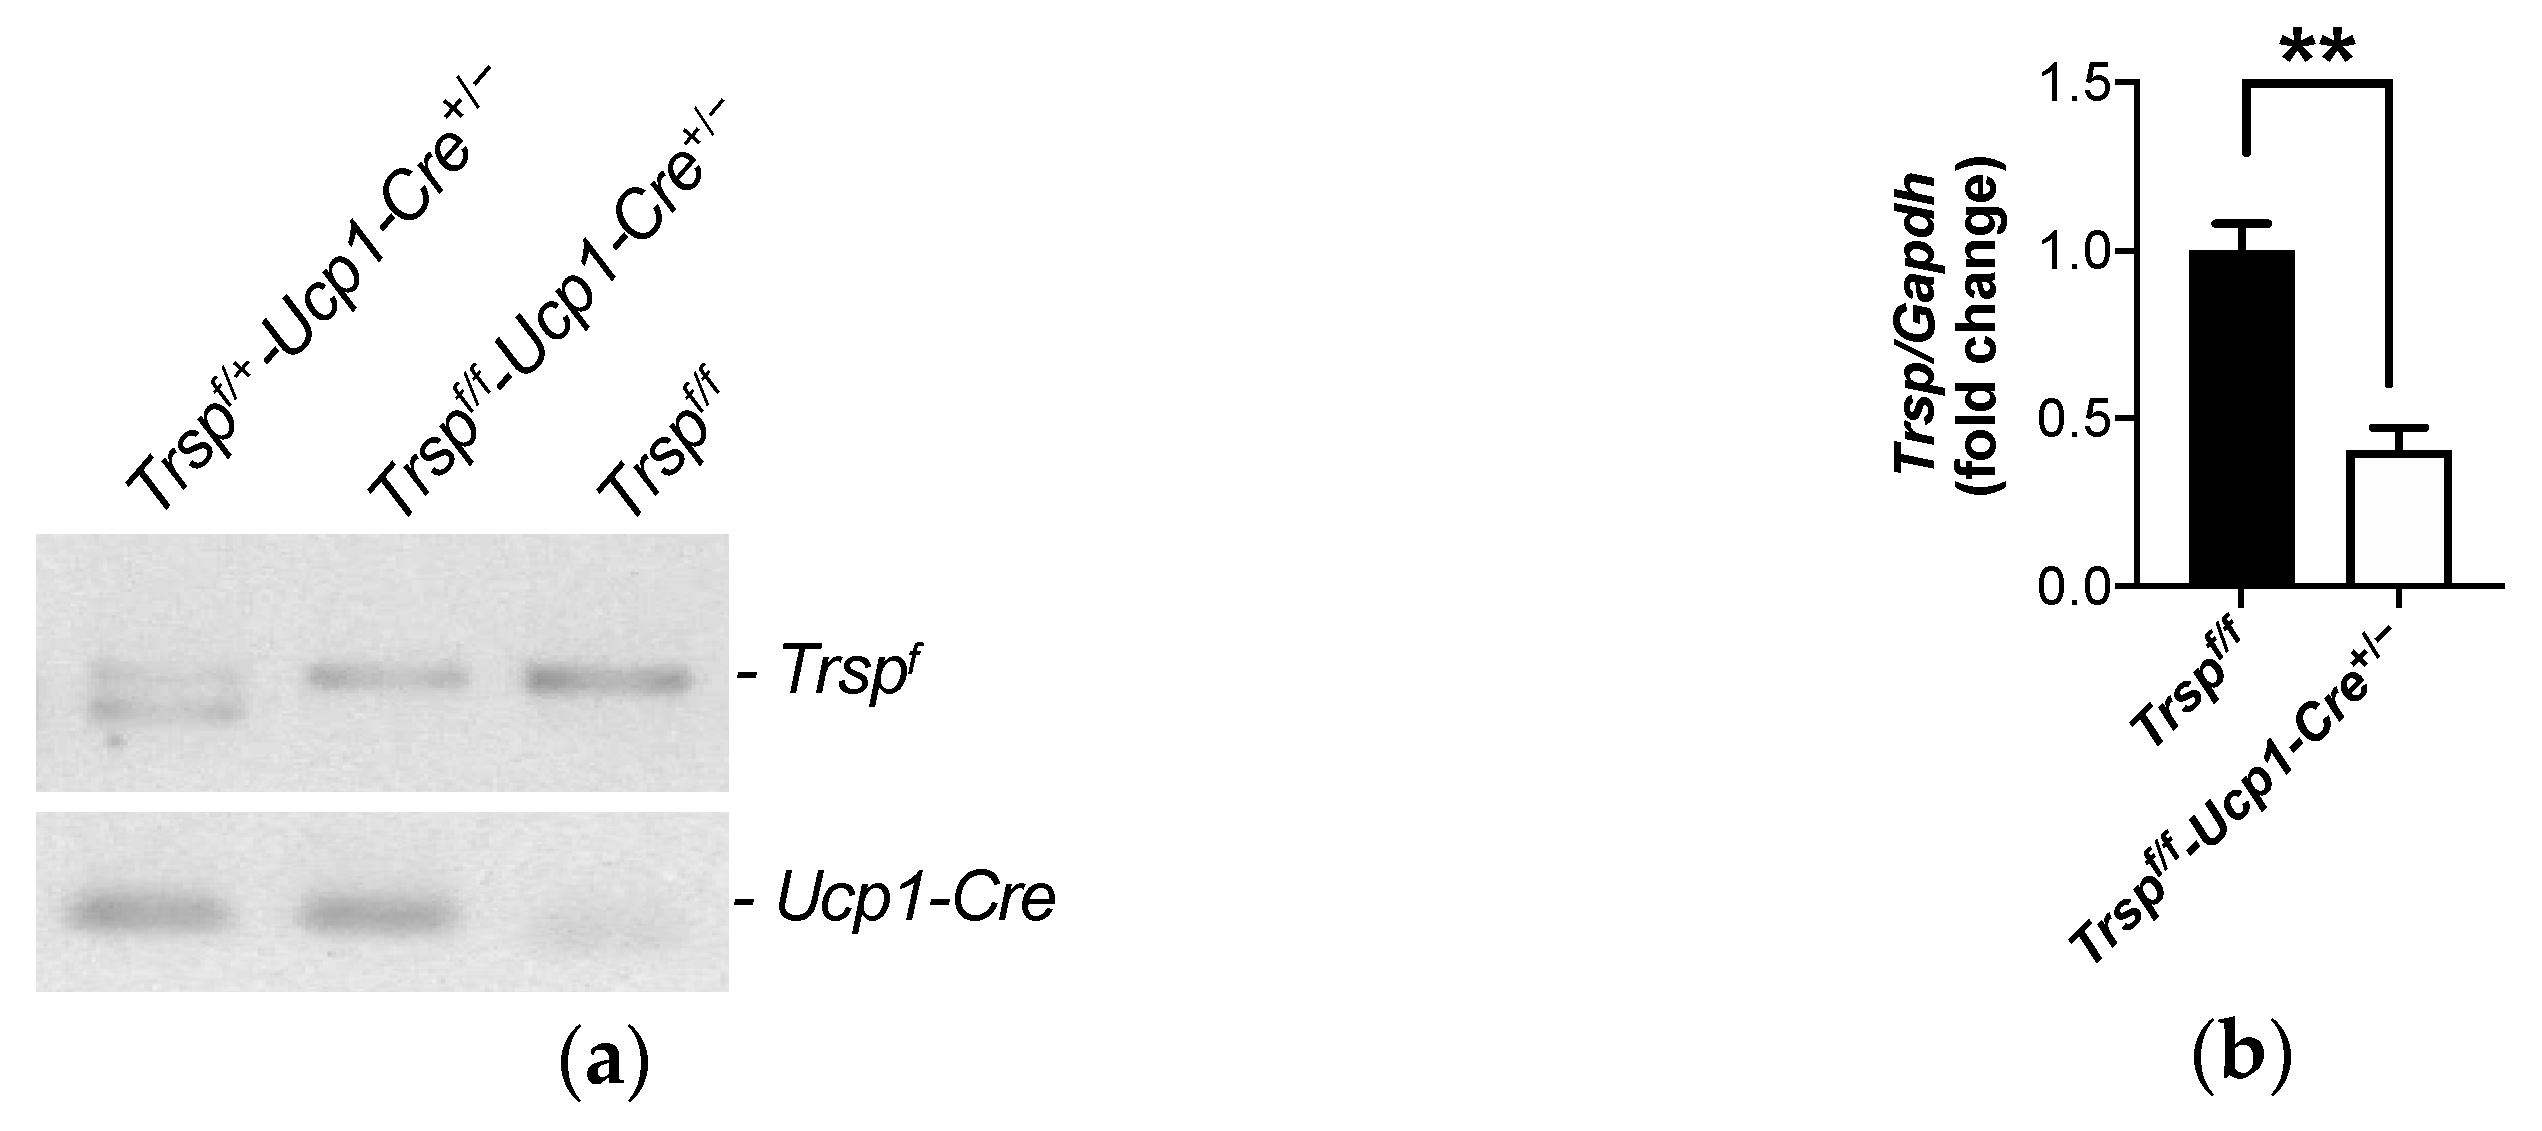
2.1. Generation of the Trspf/f-Ucp1-Cre+/− Mice

We developed a transgenic mouse lacking the Trsp gene in brown adipocytes, Trspf/f-Ucp1-Cre+/−. At room temperature, the Ucp1-Cre system has been previously shown to specifically express Cre recombinase only in brown adipocytes of the interscapular BAT [33], which assured specific Trsp deletion in this cell type. Deletion of the Trsp gene was confirmed by genotyping for both the floxed gene and for the presence of the Ucp1-Cre sequence (Figure 1a). BAT expression of the Trsp tRNA was reduced by ~60% (Figure 1b), with remaining Trsp expression possibly reflecting its presence in other cell types within the tissue.

2.2. Trspf/f-Ucp1-Cre+/− Mice Maintain Energy Expenditure

Trspf/f-Ucp1-Cre+/− male mice showed no significant weight gain differences over time compared to Trspf/f littermate control males (Figure 2a), while female Trspf/f-Ucp1-Cre+/− were modestly heavier (Figure 2b) at 12 weeks of age compared to Trspf/f littermate controls (p = 0.08). Brown adipocytes are the main site of adaptive thermogenesis in mice; hence, accounting for energy expenditure, we assessed the VO2 consumption and total energy expenditure of male and female Trspf/f-Ucp1-Cre+/− mice, after placing mice in metabolic chambers for 24 h. We determined that neither VO2 consumption (Figure 2c,d) nor their total energy expenditure (Figure 2e,f) were altered in Trspf/f-Ucp1-Cre+/- mice at room temperature, as calculated by the average of the area under the curve (AUC) for each mouse’s curve. Energy expenditures were not altered in either sex at room temperature. Interestingly, probing for impact on glucose homeostasis in the gonadal white adipose tissue (gWAT) revealed that Trspf/f-Ucp1-Cre+/− mice had a reduction in the activation of Akt, as assessed by levels of phosphorylated Akt at serine 473 (pAkt-Ser473) residue (Figure 2g). Reduced activation occurred in male but not female Trspf/f-Ucp1-Cre+/− mice, even though both sexes had reduced total Akt levels.
Despite unaltered energy expenditure, observation of brown adipocytes from the male Trspf/f-Ucp1-Cre+/− mice revealed increased lipid deposition compared to either control or female Trspf/f-Ucp1-Cre+/− mice as indicated by hematoxylin-stained histology (Figure 3a) and measurement of triglyceride content in BAT (Figure 3b). BAT adaptive thermogenesis is conducted by the actions of Ucp1, therefore we examined its gene expression (Figure 3c) and protein levels using both immunohistochemistry (Figure 3d) and Western blotting (Figure 3e). In all analyses, Ucp1 expression and levels were unchanged in Trspf/f-Ucp1-Cre+/− mice.

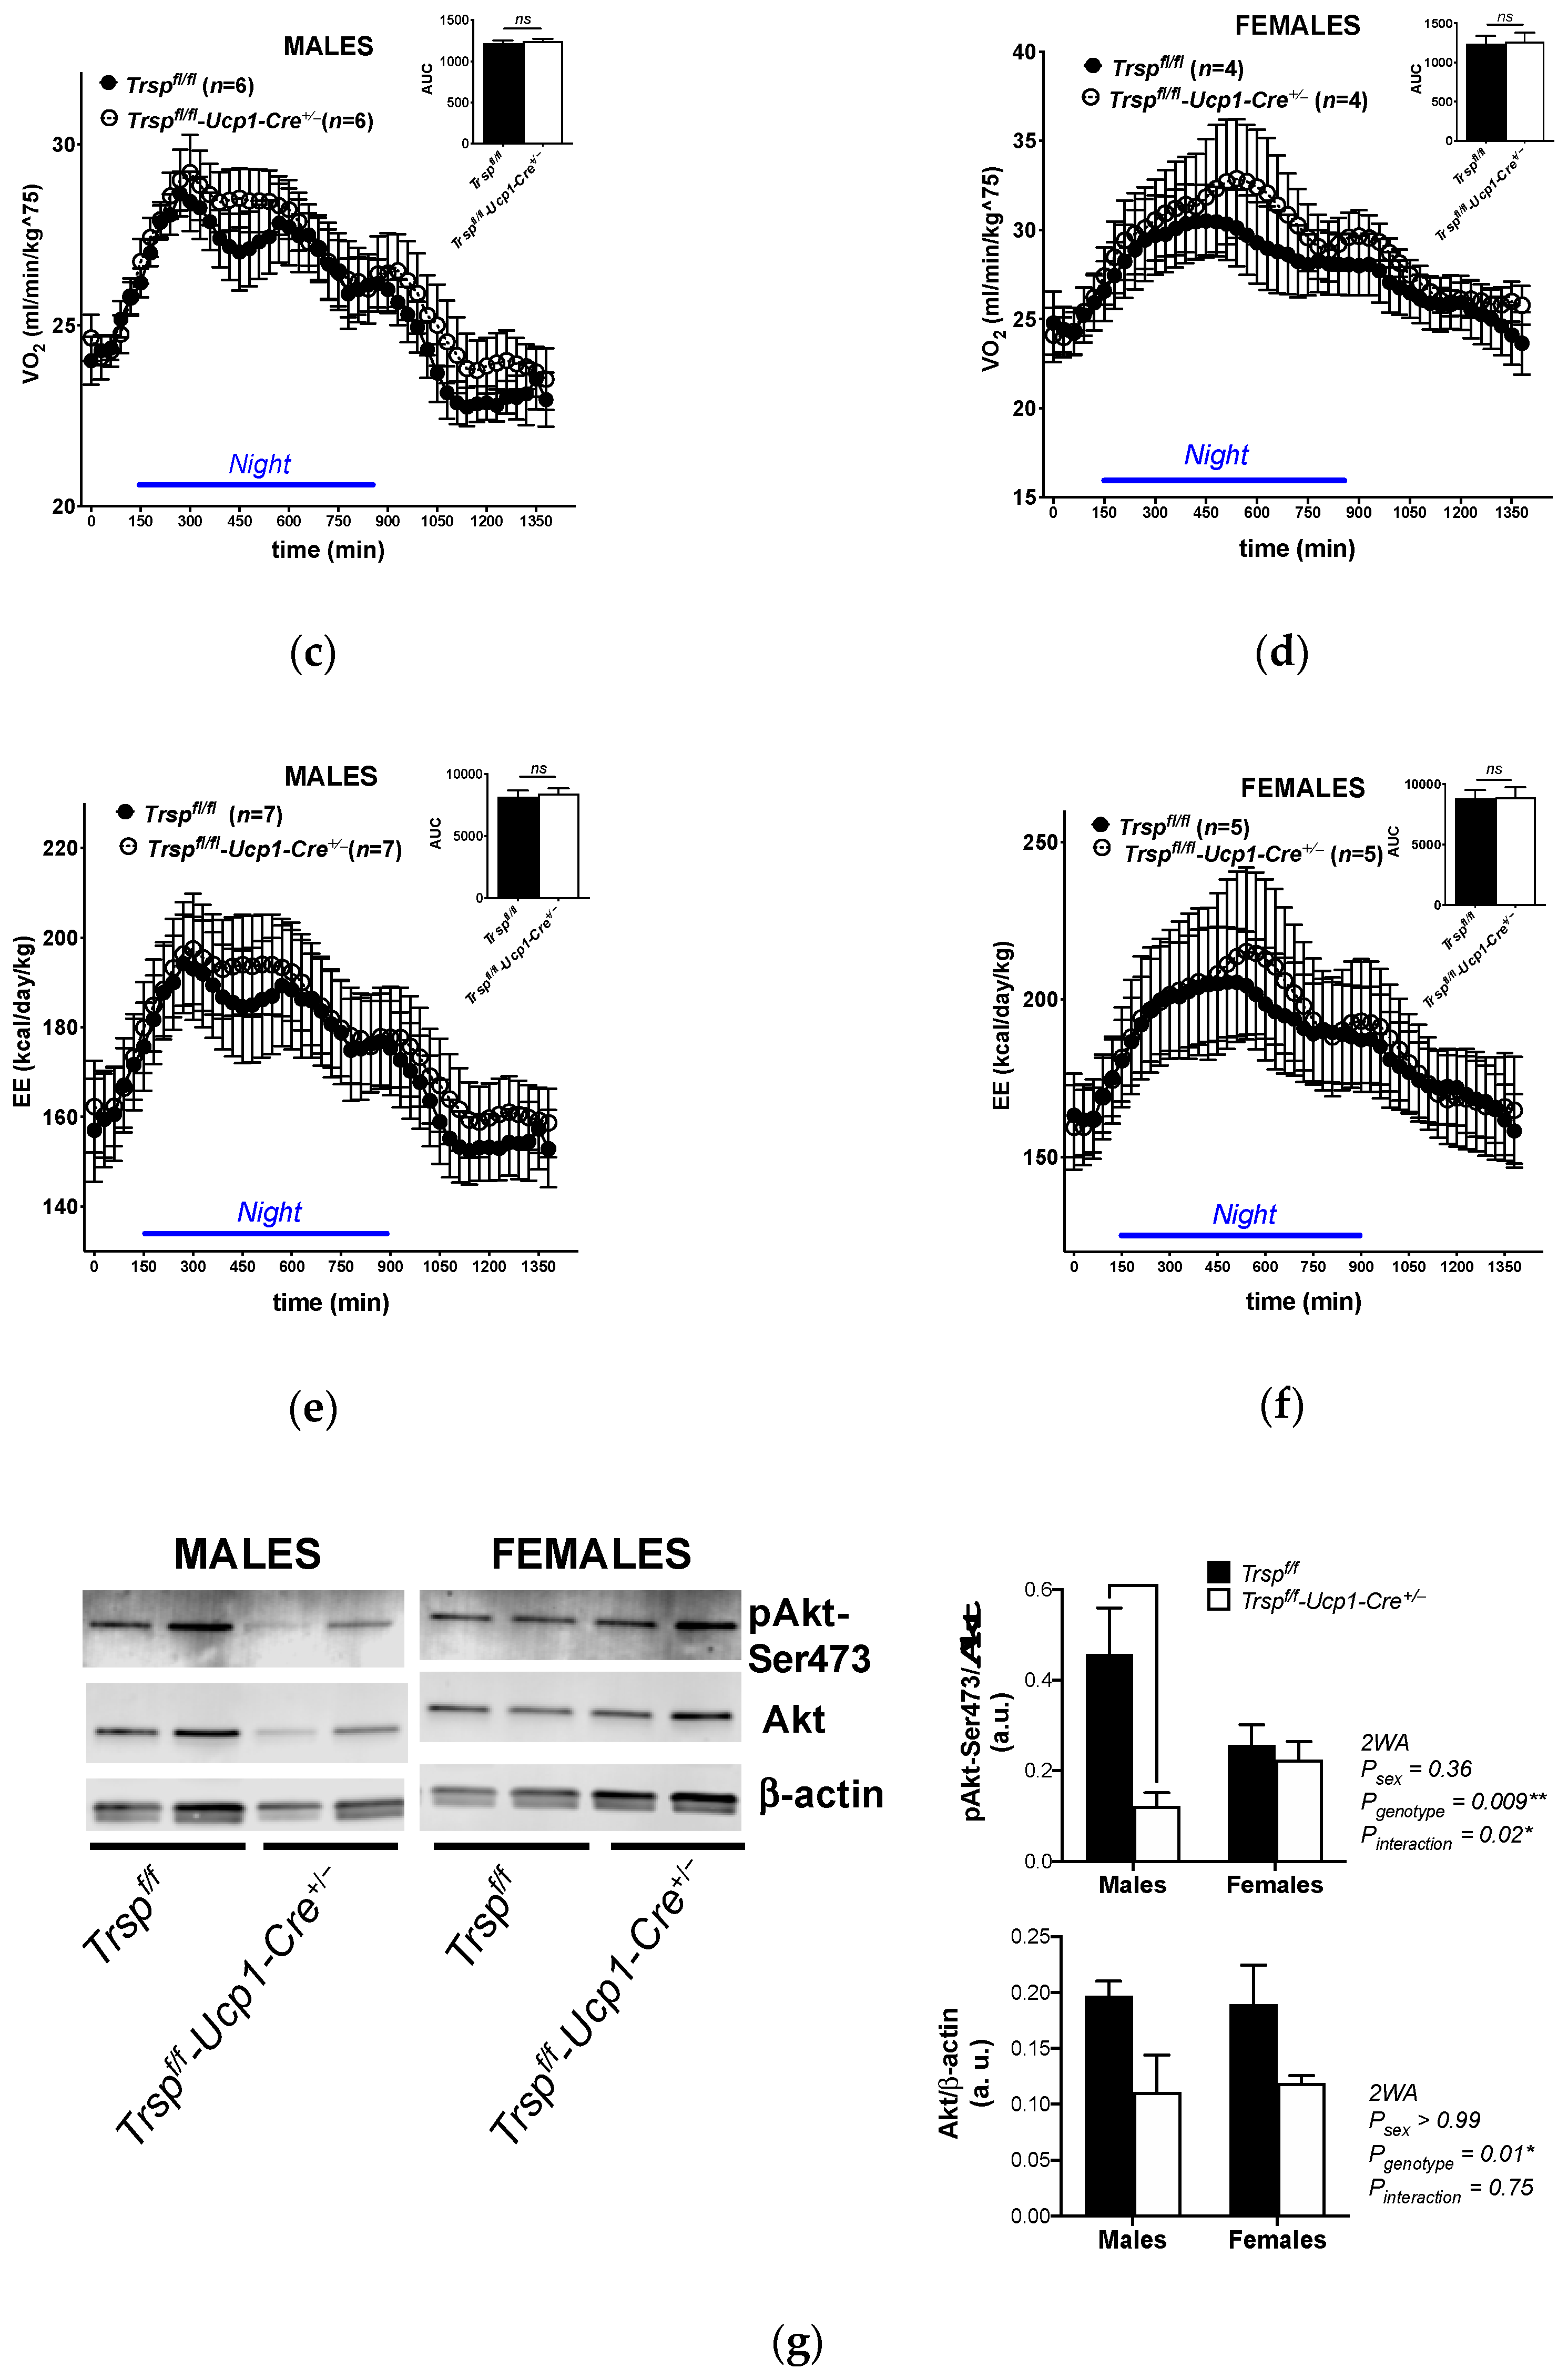
2.3. Mitochondrial Content in BAT of Trspf/f-Ucp1-Cre+/− Mice

We next investigated whether unchanged Ucp1 reflected similar mitochondrial content in BAT of Trspf/f-Ucp1-Cre+/− mice. We employed levels of peroxisome proliferator-activated receptor gamma-coactivator 1-alpha (PGC-1α) and ATP synthase subunit beta (ATPB) as proxies for mitochondrial content and function. PGC-1α is a transcriptional coactivator and central inducer of mitochondrial biogenesis [34], while ATPB is a member of the complex V of the electron transport chain in the inner membrane of the mitochondria and commonly used as a mitochondrial marker. Interestingly, BAT of female Trspf/f-Ucp1-Cre+/− mice presented increased levels of both PGC-1α (Figure 4a) and ATPB (Figure 4b), while male Trspf/f-Ucp1-Cre+/− mice kept similar expression levels of both markers.

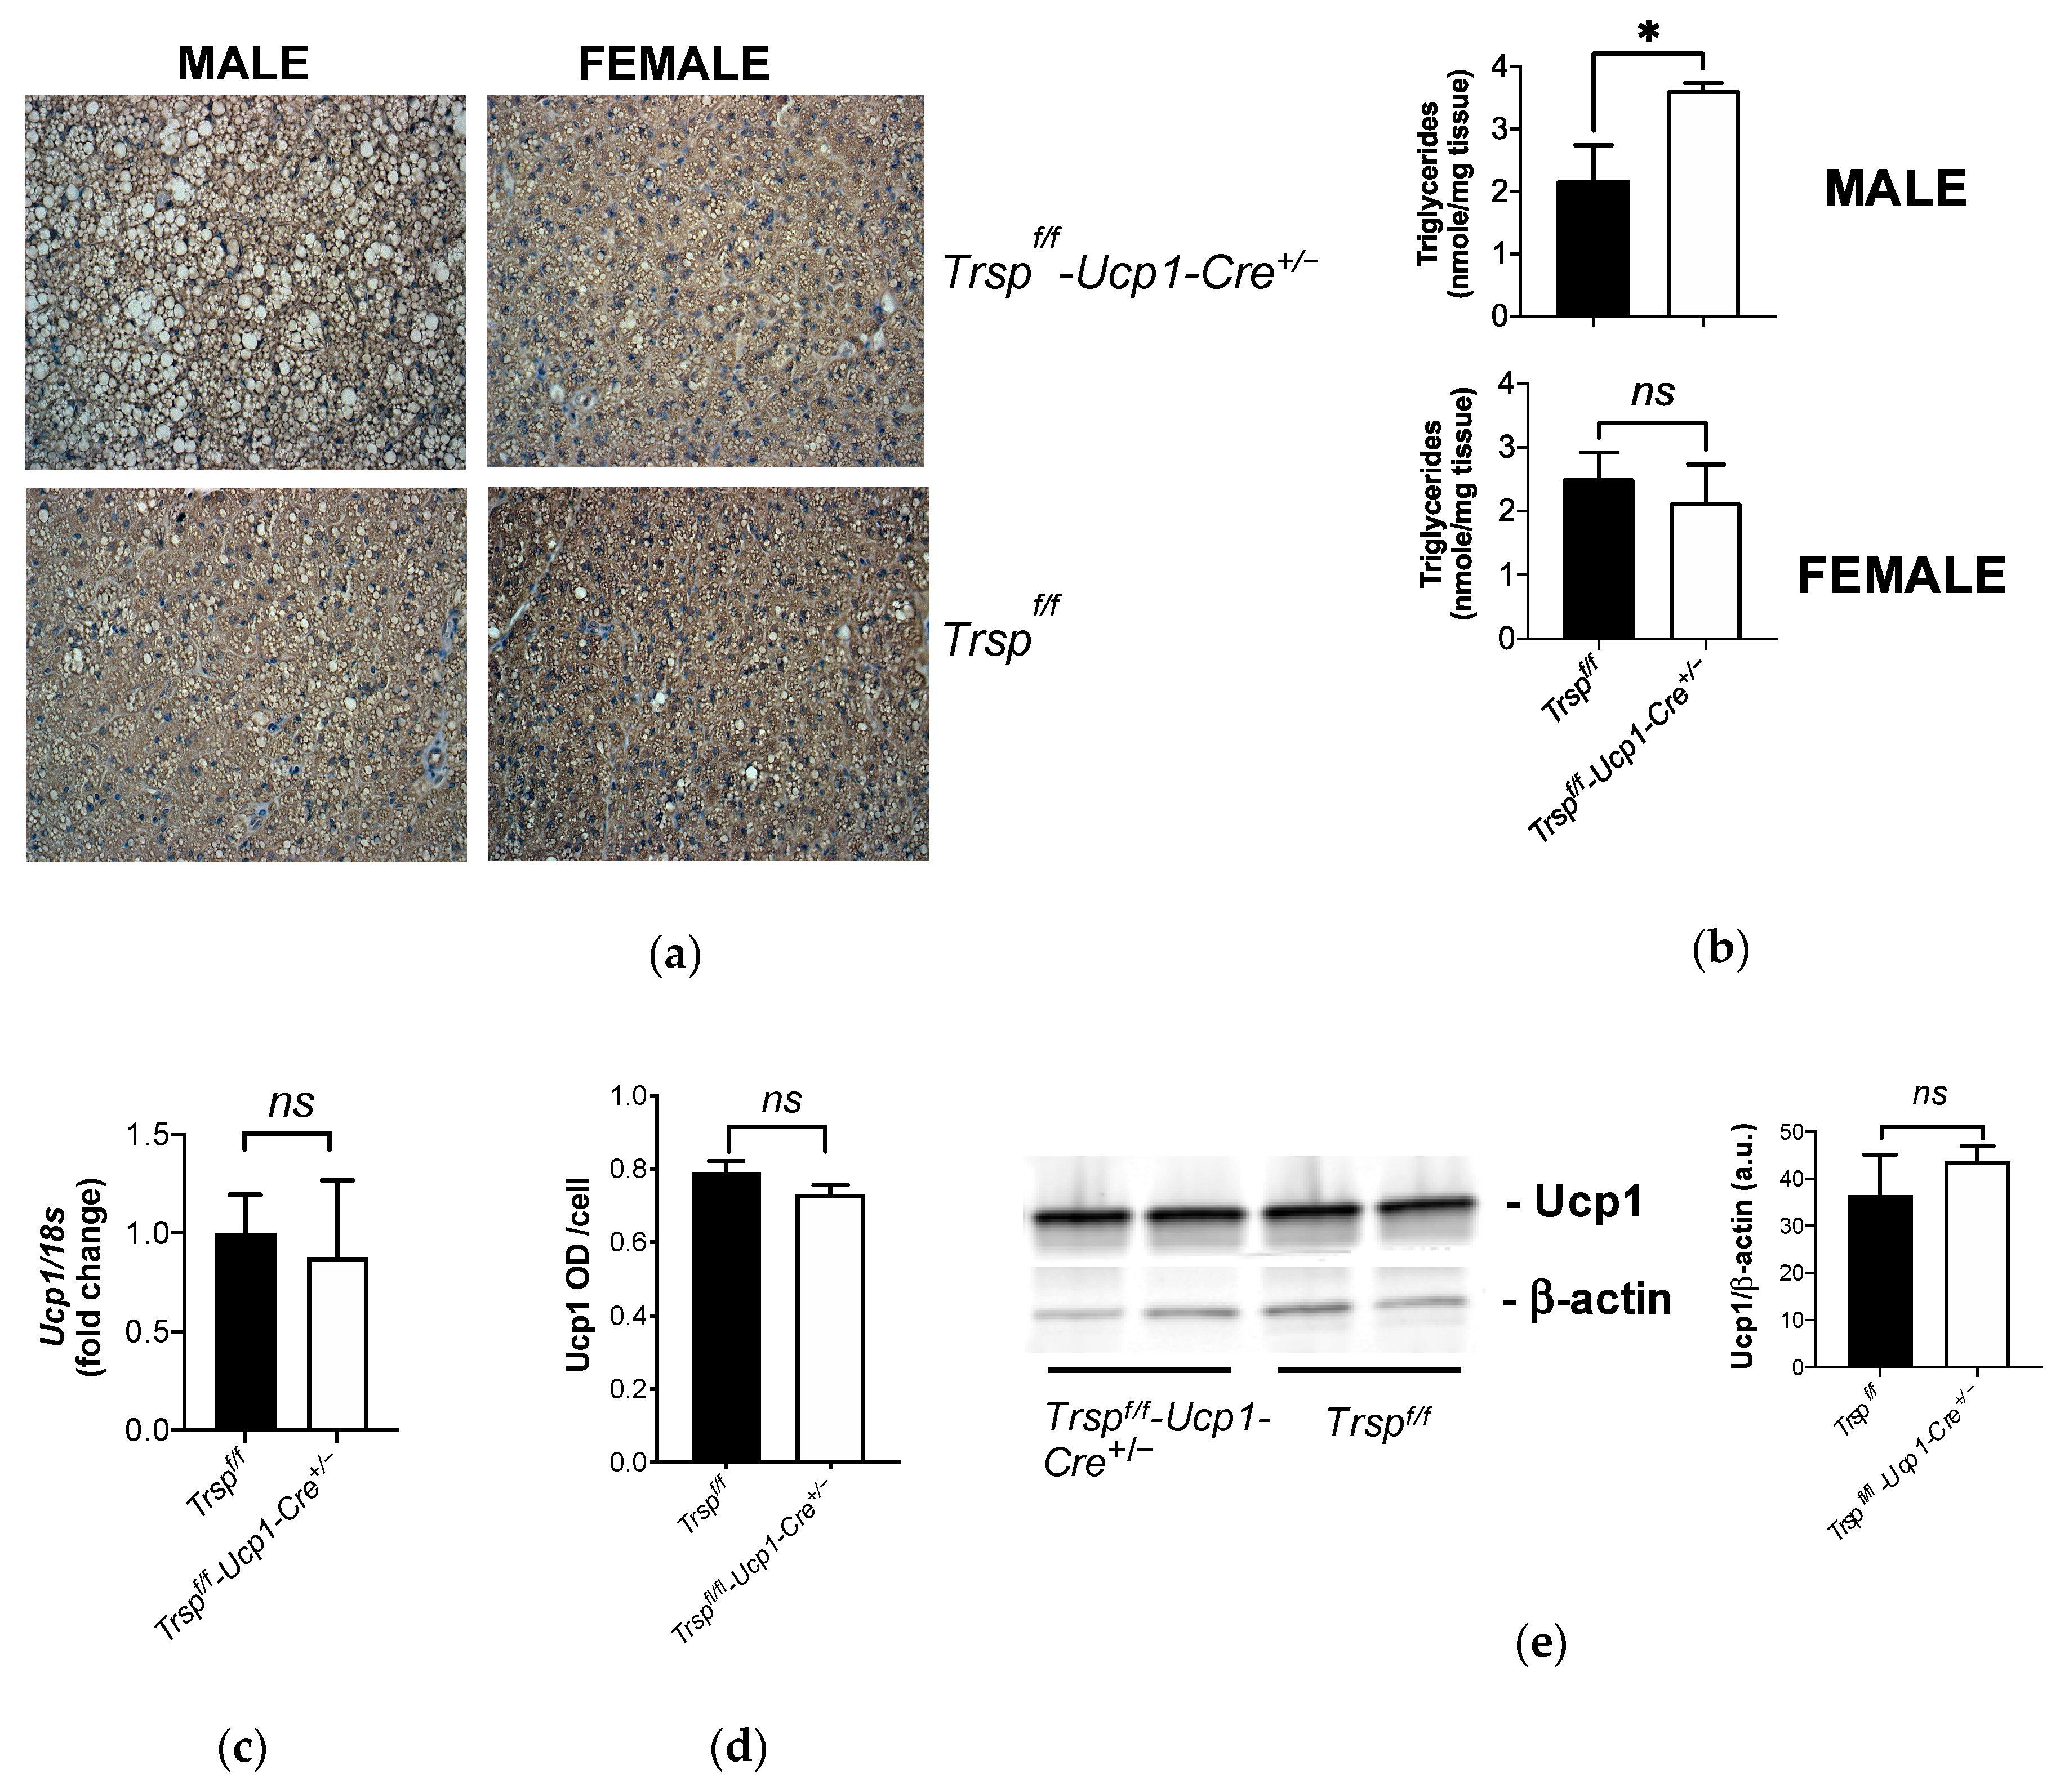
2.4. Changes in Gene Expression and Pathways in BAT of Trspf/f-Ucp1-Cre+/− Mice at Room Temperature

Maintenance of Ucp1 expression in Trspf/f-Ucp1-Cre+/− mice led us to seek genes and pathways that were either up- or down-regulated in BAT of male Trspf/f-Ucp1-Cre+/− mice at room temperature. We performed microarray analysis and found 183 genes with at least a 2-fold of change in expression between the two genotypes (Supplementary Table S1). Table 1 shows the top 10 differentially expressed genes in these mice. At room temperature, no genes for selenoproteins were affected by the loss of Trsp.
Pathway analysis revealed that, at room temperature, nicotine degradation, antigen presentation, glycerol degradation, LPS/IL-1 mediated inhibition of RXR function, and myo-inositol biosynthesis were the pathways most affected in BAT of Trspf/f-Ucp1-Cre+/− mice (Table 2 and Supplementary Table S1 for the full list).

2.5. Body Temperature in the Trspf/f-Ucp1-Cre+/− Mice after Acute Cold Exposure

The phenotype observed in the Trspf/f-Ucp1-Cre+/− mice at room temperature led us to consider that the effects of Trsp loss in brown adipocytes might be revealed to a greater extent after activation of adaptive thermogenesis. Hence, we acutely exposed Trspf/f-Ucp1-Cre+/− and Trspf/f mice to 4 °C for 4 h. Both male and female Trspf/f-Ucp1-Cre+/− mice reduced their core body temperature at the same rate as corresponding controls (Figure 5). An interaction effect of genotype and time was observed in males (Figure 5a), but not in females (Figure 5b).

2.6. Changes in Gene Expression and Pathways in BAT of Trspf/f-Ucp1-Cre+/− Mice after Acute Cold Exposure

Slight differences in core body temperature during acute cold exposure in male Trspf/f-Ucp1-Cre+/− mice led us to investigate whether male Trspf/f and Trspf/f-Ucp1-Cre+/− mice showed similar changes in gene expression in BAT as when the mice were at room temperature. Interestingly, microarray analyses of BAT from Trspf/f and Trspf/f-Ucp1-Cre+/− mice exposed to cold revealed only 65 differentially expressed genes compared to the 183 differentially expressed genes observed at room temperature (Supplementary Table S2), i.e., one-third of the number of gene expression changes. Table 3 shows the top up- and down-regulated genes in the BAT of Trspf/f-Ucp1-Cre+/− mice after cold exposure.
Pathway analysis revealed that the autophagy pathway was the most affected pathway of those examined by cold exposure in the Trspf/f-Ucp1-Cre+/− mice compared to their controls, followed by histidine degradation III (Table 4 and Supplementary Table S2 for the full list). Nevertheless, levels of scaffold protein p62 (sequestosome 1; p62-SQSTM1), an autophagy marker implicated in the control of BAT thermogenesis [35], remained unchanged in the Trspf/f-Ucp1-Cre+/− mice, as revealed by Western blot analysis (Figure 6a). Quantitation of the Western blot is shown in Figure 6b.
To pinpoint BAT genes that were most heavily affected by the loss of Trsp in brown adipocytes, we combined and compared the microarray results from mice maintained at room temperature and mice acutely exposed to cold. Figure 7a shows a Venn diagram built with the differentially expressed genes obtained from the microarray analyses. Our results showed two genes at the main intersection of the diagram, glutathione S-transferase alpha-3 (Gsta3) and ELMO domain containing 2 (Elmod2). Gsta3 is a gene regulated by the thyroid hormone in the liver [36] that catalyzes the conjugation of glutathione to several electrophiles, and it was upregulated in the Trspf/f-Ucp1-Cre+/− mice, regardless of environmental temperature (Figure 7b). On the other hand, Elmod2, a GTPase activating protein which regulates adipocyte triglyceride lipase recruitment [37], was found to be significantly upregulated after cold exposure in both genotypes. However, the upregulation occurred with a further ~40% increase in BAT in Trspf/f-Ucp1-Cre+/− mice (Figure 7c). Loss of Trsp also affected the transcription of Trappc4 (trafficking protein particle complex 4), an interactor of ERK2 implicated in vesicle transport in colorectal carcinoma cells, which was diminished in Trspf/f-Ucp1-Cre+/− mice (Figure 7d) [38].

2.7. Thyroid Function in the Trspf/f-Ucp1-Cre+/− Mice

Activation of adaptive thermogenesis is critically dependent on thyroid hormone availability. We assessed thyroid function in Trspf/f-Ucp1-Cre+/− mice at room temperature and after acute cold exposure. We found male mice to have unchanged circulating total T4 levels but diminished total T3 levels. Cold exposure reduced total T4 levels but increased total T3 levels in female mice of both genotypes. Interestingly, male Trspf/f-Ucp1-Cre+/− mice at room temperature had modest elevation of circulating thyroid-stimulating hormone (TSH), a sign of mild hypothyroidism, in comparison to their Trspf/f counterparts. Upon acute cold exposure, male mice of both genotypes reduced circulating TSH levels, however a greater reduction was observed in the Trspf/f-Ucp1-Cre+/− mice (Table 5).
In BAT, thyroid hormone activation is catalyzed by selenoprotein Dio2, and upregulation of Dio2 is considered a classic marker of BAT activation. Interestingly, we observed that in BAT of Trspf/f-Ucp1-Cre+/− mice, which had histological changes suggestive of physiological impairment, Dio2 expression was higher after cold exposure. However, this increase occurred at the same levels in both genotypes (Figure 8a).
Using our microarray dataset, we next validated by qPCR other thyroid hormone-regulated genes that were differentially expressed in BAT of Trspf/f-Ucp1-Cre+/− mice. Thrsp (thyroid hormone-inducible hepatic protein, also known as Spot14), a classic T3-responsive gene that regulates lipogenesis [39,40] and acts as a transcriptional coactivator with thyroid hormone receptor beta [41], was downregulated in Trspf/f-Ucp1-Cre+/− mice according to both temperature and genotype (Figure 8b). Moreover, the TSH receptor gene, Tshr, also presented a non-significant trend (p = 0.057) towards downregulation in the Trspf/f-Ucp1-Cre+/− mice. However, when acutely exposed to cold, both genotypes showed the same expression levels (Figure 8c).

2.8. Methylation Genes in the Trspf/f-Ucp1-Cre+/− Mice

Surprisingly, we found that two genes involved in methylation in cancer cells were altered in our BAT microarray analysis and were selected for validation by qPCR. Mthfd2, which encodes for methylenetetrahydrofolate dehydrogenase (NADP+ dependent) 2, participates in one-carbon metabolism. This enzyme also controls RNA methylation, particularly N6-methyladenosine (m6a) in mRNAs, in renal cell carcinoma [42]. Mthfd2 expression was upregulated in the Trspf/f-Ucp1-Cre+/- mice, and further enhanced after acute cold exposure (Figure 9a). On the other hand, Nnmt, which encodes nicotinamide N-methyl transferase, is an enzyme that inhibits autophagy in breast cancer cells [43]. It showed a dramatic ~24-fold upregulation in BAT of Trspf/f-Ucp1-Cre+/− mice after cold exposure compared to corresponding controls (Supplementary Table S2). Our qPCR validation revealed an upregulation dependent solely on cold exposure, without a genotype effect, in BAT of these mice (Figure 9b).

3. Discussion

We have reported the development of a novel transgenic mouse model, the Trspf/f-Ucp1-Cre+/− mice. Our model was characterized by targeted deletion of the gene Trsp in brown adipocytes, which are the primary cell type of BAT. The product of the Trsp gene, tRNA[Ser}Sec, is responsible for carrying out the synthesis of selenoproteins, including Dio2, a regulator of cold-induced adaptive thermogenesis in BAT.
Dio2 upregulation is promoted by thyroid hormone and is considered a primary indicator of activation of adaptive thermogenesis in cold exposure [44]. In males, Dio2 expression was unchanged between Trspf/f and Trspf/f-Ucp1-Cre+/− mice, despite a reduction in circulating T3. In addition, circulating T4, the substrate used by Dio2 to generate T3 that, in turn, activates thermogenesis, was unchanged. In BAT, Ucp1 levels were also unchanged. Nevertheless, BAT of male Trspf/f-Ucp1-Cre+/− mice had a distinct tissue morphology resembling more a white adipocyte with increased lipid accumulation, typical of under-stimulated brown adipocytes [45]. Together, these results suggest that, despite T4 levels not being affected by the loss of Trsp in male Trspf/f-Ucp1-Cre+/− mice, the physiology of their brown adipocytes are indeed impaired. This impairment in the morphology of BAT in males possibly occurs since early development, because mice lacking Dio2 show permanent defect in adaptive thermogenesis in the embryonic BAT [46].
Murine selenoproteins are expressed in a sexually dimorphic manner in other organs, such as liver and kidneys [47,48]. A possible explanation for the sexual dimorphism we observed in BAT of male Trspf/f-Ucp1-Cre+/− mice could be alterations in the sympathetic tone in our mouse model. However, one of the regulators of the sympathetic tone of BAT is T4 via central and peripheral mechanisms [49]. However, the Dio2 knockout mouse model does not present sexual dimorphism in their thermogenic responses after a caloric overload at room temperature [31]. Moreover, T4 is not altered in males, making it unlikely that the sympathetic tone is diminished in BAT of these mice. An alternative to be explored in future studies is whether another selenoprotein, another factor involved in selenium metabolism, or another selenium-related mechanism plays a role in regulating the sympathetic tone in BAT according to sex.
Interestingly, elevated circulating TSH levels in male Trspf/f-Ucp1-Cre+/− mice at room temperature suggest either impaired thyroid stimulation to produce T4—which does not occur as T4 levels are maintained—or a direct effect of TSH via its receptor TSHR in brown adipocytes, which could explain the morphological changes of BAT. Such direct effect of TSH has been demonstrated in rats to positively modulate oxygen consumption and inversely regulate Dio2 mRNA [50]. However, this observation is discrepant with our results herein in the male Trspf/f-Ucp1-Cre+/− mice, as circulating TSH were higher but effects on neither oxygen consumption nor Dio2 mRNA were observed. It is possible that other mechanisms modulated by TSH alone, such as activation of Erk or Akt phosphorylation, are recruited [50], reducing the expected responses cited above.
Acute cold exposure leads to intense lipolysis, adipocyte autophagy, and remodeling of BAT, using the lipid deposits available to increase the mitochondrial oxidative cycle. This, in turn, could produce heat, maintaining the animal’s core body temperature and avoiding hypothermia. Extensive use of lipid deposits leads to activation of a lipogenic phase with enhanced lipid uptake in brown adipocytes, guaranteeing fuel for thermogenesis maintenance as cold exposure continues [51]. Despite BAT undergoing intense remodeling in the first hours of cold exposure, it is intriguing that male Trspf/f-Ucp1-Cre+/− mice do not present alterations in the autophagy flux; levels of autophagy factor p62/SQSTM1 were sustained in male Trspf/f-Ucp1-Cre+/− mice, while autophagy genes were upregulated in our microarray analysis. This discrepancy suggests either a reduction in translational efficiency of autophagic transcripts or a temporal dissonance in autophagy activation in male Trspf/f-Ucp1-Cre+/− mice acutely exposed to cold. The varying length of cold exposure has been considered as a source of conflicting data for autophagy response in adaptive thermogenesis ([52] citing [53,54,55]). These studies did not expose mice for 4 h in the cold; therefore, it is also possible that we uncovered a transitional moment for autophagy. However, male Trspf/f-Ucp1-Cre+/− mice accumulated more triglycerides than control mice, despite similar levels of mitochondrial markers at room temperature. These combined findings suggest that male Trspf/f-Ucp1-Cre+/− mice maintained mitochondrial capacity with excess resources for the initial lipolytic phase of adaptive thermogenesis. It is possible that during cold exposure, as brown adipocytes switch from lipolysis to lipogenesis, the advantage provided by additional fuel is counteracted by deficiencies in thermogenic responses that are dependent on other factors, such as thyroid hormone activation or sympathetic tone [56].
It is puzzling that the loss of Trsp, i.e., selenoprotein synthesis capacity, does not lead to a more dramatic impact in gene expression, particularly of selenoproteins after acute cold exposure. As mentioned in the previous paragraph, the late lipogenic phase of chronic cold exposure depends on the proper transcriptional activation of T3-responsive genes encoding key proteins involved in lipogenesis early on, which will later allow for withstanding the constant temperature stress. Our finding that the Thrsp transcript, which encodes a coactivator of lipogenic genes via interaction with the thyroid hormone receptor [40,41], was downregulated in Trspf/f-Ucp1-Cre+/− mice suggests lower availability of thyroid hormones locally in the early stages of cold exposure. It is plausible to infer that these mice, upon chronic exposure to cold, may diminish their thermogenic capacity due to impaired lipid uptake, because the proteins required for lipogenesis could be at lower levels. Prospective studies examining the chronic activation of BAT adaptive thermogenesis, either in a more physiological manner after chronic cold exposure or in a pathological context, after a high-fat diet, may consolidate whether observed changes in thyroid hormone response of the Trspf/f-Ucp1-Cre+/− mice are sustained. Moreover, the participation of additional gut hormones in concert with the sympathetic response may mediate chronic thermogenic responses. A chronic paradigm for adaptive thermogenesis activation, particularly in a pathological context after a hypercaloric overload, may allow for display of a worsened metabolic dysfunction. We have observed a moderate impairment of Akt activation, i.e., in insulin response, in the gWAT of Trspf/f-Ucp1-Cre+/− mice. Therefore, it is likely that the feeding of a high-fat diet will accelerate the development of a metabolic dysfunction in a Trspf/f-Ucp1-Cre+/− mouse.
An interesting aspect found by our microarray analysis was the upregulation of genes involved in methylation. As occurs with other tRNAs [57], a portion of the tRNA[Ser]Sec population is methylated at the uridine position 34 (Um34) yielding a specific subpopulation [58]. In fact, differential methylation of Um34 leads to the existence of two possible molecular conformations in relation to the anticodon sequence [59]. Consequently, two subsets of selenoproteins, deemed stress-related and housekeeping, occur, with tRNA[Ser]Sec with Um34 supporting primarily translation of stress-related selenoproteins. Members of this class of selenoproteins are sensitive to selenium status [20,21], which is likely the case for Dio2 in the activated BAT. The specific methyltransferase responsible for the methylation of Um34 has not been identified, although one that is sensitive to S-adenosyl-homocysteine accumulation has been indicated as a promising candidate [60]. In our mouse model, loss of tRNA[Ser]Sec in brown adipocytes led to upregulation of Mthfd2, which encodes an enzyme from folate one-carbon metabolism. This enzyme also binds to several ribonucleoproteins and is involved in protein translation [61], controlling the methylation of N6-methyladenosine (m6a) of mRNAs [42]. It is tempting, at this point, to suggest that this enzyme may be an additional promising candidate for at least controlling the Um34 methylation of tRNA[Ser]Sec.
Considering the impairment of selenoprotein synthesis in the brown adipocyte, it is intriguing that a general decline in selenoprotein gene expression, particularly Dio2, is not observed. Stress-related selenoprotein mRNAs, such as Dio2, are primary targets for nonsense-mediated decay (NMD) degradation, a mechanism that misreads the in-frame UGA codon of selenoproteins as a nonsense codon [62]. Selenium deficiency further activates the NMD machinery to target selenoprotein mRNAs for degradation [63]. Trspf/f-Ucp1-Cre+/− mice were fed diets with adequate selenium, which likely provided enough selenium to inhibit NMD machinery, allowing selenoprotein mRNAs to circumvent NMD degradation.
Moderate dietary selenium intake in Trspf/f-Ucp1-Cre+/− mice also raises a striking possibility regarding the fate of selenium in brown adipocytes. With the impairment of selenoprotein synthesis, available selenium may be either released back into circulation or to neighboring cell types, or redirected within the brown adipocyte for use in additional pathways. Jedrychowski et al. [32] have demonstrated that excess selenium in brown adipocytes impacts adaptive thermogenesis via incorporation of Sec in the place of cysteine in several non-selenoproteins, i.e., facultative selenation. Notably, cysteine residue 253 of Ucp1 was identified to be selenated. Selenation of Ucp1 increases its redox sensitivity, enhancing energy expenditure, activating adaptive thermogenic responses, and protecting from high-fat diet-induced obesity. It is possible that selenium not used in selenoprotein synthesis by the Trspf/f-Ucp1-Cre+/− mice enhances facultative selenation. Enhanced facultative selenation, particularly of Ucp1, could explain the mild effects of acute cold exposure observed in our mouse model, with the lack of Trsp and consequent selenoprotein synthesis freeing selenium to be redirected towards selenation in brown adipocytes. It is unknown whether facultative selenation in brown adipocytes requires tRNA[Ser]Sec. We believe that the Trspf/f-Ucp1-Cre+/− mouse model may be fitting to test this hypothesis in the future.
A limitation of this study encompasses the inability to breed or maintain mice at their thermoneutrality (~28–30 °C) due to the lack of this capacity at our animal facilities. Mice maintenance at temperatures slightly lower than thermoneutrality could have primed their BAT to activate thermogenic mechanisms. Such prior activation could diminish the impact of acute cold exposure, and this effect was observed in a mouse model lacking Dio2 [64]. Despite this limitation, we still observed subtle changes at the transcriptional level after acute cold exposure, particularly in genes responding to thyroid hormone and involved in methylation pathways. The fact that we unveiled changes in gene expression between the Trspf/f-Ucp1-Cre+/− and Trspf/f control mice indicates that the effects of this temperature priming were potentially minimized.
In summary, we developed a novel mouse model lacking the Trsp gene in brown adipocytes and demonstrated that loss of Trsp in these cells leads to a modest impairment of acute cold exposure responses in male Trspf/f-Ucp1-Cre+/− mice, but not in females. We also observed subtle changes in thyroid hormone responsiveness and genes involved in methylation pathways. Future studies moving towards a chronic cold exposure may help refine our knowledge of the role of selenoproteins in rodent adaptive thermogenesis.

4. Materials and Methods

4.1. Chemicals and Antibodies

All chemicals used in experiments were from Fisher Scientific (Hampton, NH, USA) or Sigma-Aldrich (St. Louis, MO, USA), unless specified. Primary antibodies included anti-β-actin (1:3000; cat. #A2228; Sigma-Aldrich), anti-Ucp1 (1:1000; cat. #ab10983, Abcam; Cambridge, MA, USA), anti-PGC1α (1:750; cat. #AB3242, MilliporeSigma; Burlington, MA, USA), anti-ATPB (1:1000; cat. #ab14730; Abcam), anti-Akt (1:1000; cat. #9272, Cell Signaling Technology, Beverly, MA, USA); anti-phospho-Akt-Ser473 (1:750; cat#9271, Cell Signaling Technology), and anti-p62/SQSTM1 (1:750; cat. #5114T, Cell Signaling Technology).

4.2. Animals

Animal procedures were approved by the University of Hawaii Office of Research Compliance Animal Welfare Program, protocol #17-2521, first approved by the Institutional Animal Care and Use Committee on 19 October 2017. Mice were held in our vivarium and used for experiments in minimal numbers needed to provide significant results. B6.FVB-Tg(Ucp1-cre)1Evdr/J (MGI J:206508; shortened here as Ucp1-Cre) mice on a C57BL6/J background were purchased from The Jackson Laboratory (cat. #024670; Bar Harbor, ME, USA). Trsp-LoxP were generated as previously described [65]. To generate a strain with a targeted deletion of Trsp in brown adipocytes, the Trspf/f-Ucp1-Cre+/− mice, Trspf/+ mice were crossed with Ucp1-Cre mice. Homozygote Trspf/f littermate controls were used to compare with Trspf/f-Ucp1-Cre+/− mice after genotyping confirmation by PCR. Mice were in a 12 h light–dark cycle, fed ad libitum with chow containing ~0.25 ppm sodium selenite, and group-caged until exposure to cold. Euthanasia occurred at 12-weeks old by CO2 asphyxiation, and all mice were euthanized ~2 pm, to avoid circadian influences in results. After euthanasia, blood and interscapular BAT, which comprises approximately 60% of all BAT depots and considered the most significant in mice [66], were removed immediately, snap-frozen into liquid nitrogen, perfused with formalin, or incubated in RNALater Stabilization Solution (Thermo Fisher Scientific; Waltham, MA, USA).

4.3. Energy Expenditure Assessment

Oxygen consumption (VO2), respiratory quotient (RQ) and energy expenditure (EE) were assessed for 24 h with the PanLab OxyLetProTM System (Harvard Apparatus, Barcelona, Spain) in 11-week-old mice. Mice were habituated in individual cages for 24 h prior to running experiments, as previously described [67]. Data were analyzed using PanLab Metabolism (Prague, Czech Republic) software.

4.4. Cold Exposure and Core Body Temperature Assessment

A G2 emitter thermal probe (Starr Life Sciences Corp.; Oakmont, PA, USA) was surgically inserted into the peritoneal cavity of mice one week prior to exposure to cold. Only mice that adequately recovered from survival surgery were used in experiments. On the day of experiment, 12-week-old mice were transferred to individual cages with only water and minimal bedding, transported to a cold room set at 4 °C between 09:00 and 10:00 a.m., and each cage placed on a receiver telemetry platform (Starr Life Sciences Corp.). Mice remained in the cold room uninterrupted for 4 h and were euthanized ~2 pm. Core body temperature was recorded every 5 min by the receiver using Vital View Legacy Version 5.1 software (Starr Life Sciences Corp.).

4.5. Triglyceride Content

Triglyceride content of BAT was measured using the Triglyceride Quantification Assay Kit (Abcam) for colorimetric detection, following the manufacturer’s protocol.

4.6. RNA Extraction

Mouse interscapular BAT was collected at time of euthanasia (~2pm) either in RNALater (Thermo Fisher Scientific) or snap-frozen, according to final use. For quantitative PCR (qPCR), total RNA was extracted from snap-frozen tissues using a TissueRuptor (Qiagen; Germantown, MD, USA) with disposable probes, and isolated using the EZNA total RNA kit I (Omega Biotek; Norcross, GA, USA). For microarray, total RNA was extracted from tissues in RNALater, processed with TissueRuptor and isolated using the Qiagen RNA extraction kit (Qiagen).

4.7. Microarray Analysis

RNA quality was assessed in an Agilent 2100 BioAnalyzer (Agilent Technologies; Santa Clara, CA, USA) and samples with RIN > 5.5 were deemed satisfactory for microarray. Mouse ClariomS Array gene hybridization (Affymetrix—Thermo Fisher Scientific) was carried out with 100 ng of total RNA, run and scanned in GeneChip Fluidics Station 450 and a GeneChip Scanner (Affymetrix—Thermo Fisher Scientific) in the Genomics and Bioinformatics Shared Resource facility at the University of Hawaii Cancer Center. The CEL files were processed and analyzed using the Transcriptome Analysis Console (TAC) 4.0 from Thermo Fisher Scientific. Genes with a fold change greater than 2 and p-value less than 0.05 were considered differentially expressed. Canonical pathway and network analysis of differentially expressed genes was performed using Qiagen’s Ingenuity Pathway Analysis (IPA; Qiagen; https://www.qiagenbioinformatics.com/products/ingenuity-pathway-analysis).

4.8. Real-Time qPCR

One microgram of total RNA extracted from the interscapular BAT was reverse transcribed using the High Capacity kit (Applied Biosystems—Thermo Fisher Scientific). 10 ng of cDNA were used in real-time qPCR reactions with the PerfeCTa SYBR Green SuperMix (Quantabio; Beverly, MA) and specific primers, listed in Supplementary Table S4. Relative quantification of target gene expression was calculated based on the ΔCt method, normalized to the expression of housekeeping genes for 18s or Gapdh, and plotted as fold change relative to Trspf/f at room temperature values.

4.9. Immunohistochemistry

Mice acclimated to room temperature had their BAT extracted after perfusion with formalin and were paraffin-embedded for histological analysis. Immunohistochemistry was performed in slides using citrate buffer in a pressure cooker. Slides were labeled with primary antibody (anti-Ucp1; 1:100), Mouse on Mouse Basic kits with Vectastain ABC, and diaminobenzidine peroxidase substrate kits (Vector Labs; Burlingame, CA, USA) as previously described [68]. Slides were counter-stained with hematoxylin to visualize adipocyte nuclei.
Four brightfield images were acquired from a single section of BAT from each subject at 40× magnification using the simple random sampling workflow in Stereo Investigator (MBF Bioscience; Williston, VT, USA). To compare Ucp1 immunoreactivity, the optical density of each image was quantified using ImageJ (public domain) and averaged for each subject. To calculate Ucp1 optical density, images were converted to black-and-white, inverted, and the mean pixel value for the entire image recorded. Total nuclei were counted using ImageJ Cell Counter plugin (public domain) and used to normalize the mean pixel value for each image.

4.10. Western Blot

BAT and gWAT protein were extracted using RIPA Lysis and Extraction buffer containing protease and phosphatase inhibitors (Thermo Scientific) followed by sonication and two rounds of centrifugation. 10–20 μg of total protein was loaded into 4–20% TGX SDS-PAGE (Bio-Rad; Hercules, CA, USA) and wet-transferred overnight in Tris-glycine buffer containing 9% methanol to an Immobilon-FL® membrane (MilliporeSigma) using the Criterion Blotter (Bio-Rad) apparatus. Primary and secondary antibodies were incubated for 1 h at room temperature with rotation, and secondary antibodies were IRDyes (Li-Cor Biosciences; Lincoln, NE) for use at an Odyssey CTx infra-red scanner (Li-Cor Biosciences). All blots were used only once, except the measurement of phosphorylated Akt, performed on the same membrane after confirmation of complete stripping of previous antibodies using NewBlot PVDF Stripping Buffer (Li-Cor Biosciences). Analysis of the Western blot was conducted with the Image Studio Lite version 5.2.5. software (Li-Cor Biosciences).

4.11. Thyroid Function

Thyroid function was inferred from analyses of total T4, total T3, and TSH levels in the serum. Twenty microliters of serum were used to assay for TSH with a Milliplex MAP Mouse Pituitary Magnetic Bead Panel (Millipore-Sigma) on a Luminex 200 platform (Luminex; Austin, TX, USA). Twenty-five microliters of serum were used to assay for total T4 and total T3 using the AccuDiagTM ELISA—T4 kit (Diagnostic Automation; Woodland Hills, CA, USA) and the T3 (Total) ELISA kit (Abnova; Taipei, Taiwan), respectively, according to the manufacturer’s instructions.

4.12. Statistical Analysis

Results were plotted and graphed using Graphpad Prism v. 8.0 (San Diego, CA), and an alpha value of 0.05 was adopted. Unpaired Student’s t-test or two-way analysis of variance (2WA) with Bonferroni’s ad hoc post-test were used according to the number of variables analyzed in each experiment.

Supplementary Materials

The following are available online at https://www.mdpi.com/1422-0067/22/2/611/s1, Table S1: Differentially expressed genes, networks, and pathways in BAT of Trspf/f-Ucp1-Cre+/− mice at room temperature obtained by microarray analysis. Supplementary Table S2: Differentially expressed genes, networks, and pathways in BAT of Trspf/f-Ucp1-Cre+/− mice after acute cold exposure obtained by microarray analysis. Supplementary Table S3: All comparisons between differentially expressed genes of microarray analysis. Supplementary Table S4: Mouse primer sequences used in this study. Original gel images are also uploaded within Supplementary Materials.

Author Contributions

Conceptualization, L.A.S. and M.J.B.; methodology, L.A.S., A.N.O.-W., L.M.W., and D.J.T.; resources, B.A.C. and D.L.H.; formal analysis and data curation, L.A.S., A.N.O.-W., L.M.W., D.J.T., V.S.K. and M.M.; visualization, V.S.K. and M.M.; writing—original draft preparation, L.A.S.; writing—review and editing, all authors.; supervision, L.A.S.; project administration, L.A.S. and M.J.B.; funding acquisition, L.A.S., L.M.W., and M.J.B. All authors have read and agreed to the published version of the manuscript.

Funding

Research in our laboratory is funded by the National Institutes of Health (NIH) grants R01DK047320, R01DK047320-23S1 and R01DK047320-22S2 to M.J.B., F32DK124963-01 to D.J.T., and U54MD007601—subproject 5544; Hawaii Community Foundation grant 20ADVC-102166, and start-up funds from the JABSOM Office of the Associate Dean of Research to L.A.S., and fellowship 2018/09478-4 from Fundação de Amparo à Pesquisa do Estado de São Paulo (FAPESP) to L.M.W. The Core Facilities used to conduct some of the assays are funded by NIH grants U54MD007601, P30CA071789, P20GM103466 and P30GM114737.

Institutional Review Board Statement

Animal procedures were approved by the University of Hawaii Office of Research Compliance Animal Welfare Program, protocol #17-2521, first approved by the Institutional Animal Care and Use Committee on 19 October 2017.

Informed Consent Statement

Not applicable.

Data Availability Statement

The data presented in this study are available upon request to the corresponding author.

Acknowledgments

We are grateful to Ann C. Hashimoto for excellent technical support in mouse husbandry; Miyoko Bellinger and Kristen Ewell from the Histopathology Core Facility for assistance with histological sample preparation; Maarit Tiirikainen and Karolina Peplowska from the Genomics and Bioinformatics Shared Resource for the microarray run; and Alexandra Gurary and Jourdan Posner from the Molecular and Cellular Immunology Core Facility, for help with the Luminex assay.

Conflicts of Interest

The authors declare no conflict of interest. The funders had no role in the design of the study; in the collection, analyses, or interpretation of data; in the writing of the manuscript, or in the decision to publish the results.

Abbreviations

BATBrown adipose tissue
Dio2Iodothyronine deiodinase type 2
qPCRQuantitative PCR
SecSelenocysteine
T33,3′,5-triiodothyronine
T4Thyroxine
TSHThyroid-stimulating hormone
Ucp1Uncoupling protein 1

References

  1. Carlisle, A.E.; Lee, N.; Matthew-Onabanjo, A.N.; Spears, M.E.; Park, S.J.; Youkana, D.; Doshi, M.B.; Peppers, A.; Li, R.; Joseph, A.B.; et al. Selenium detoxification is required for cancer-cell survival. Nat. Metab. 2020, 2, 603–611. [Google Scholar] [CrossRef] [PubMed]
  2. Diamond, A.M. Selenoproteins of the Human Prostate: Unusual Properties and Role in Cancer Etiology. Biol. Trace Elem. Res. 2019, 192, 51–59. [Google Scholar] [CrossRef] [PubMed]
  3. Kadkol, S.; Diamond, A.M. The Interaction between Dietary Selenium Intake and Genetics in Determining Cancer Risk and Outcome. Nutrients 2020, 12, 2424. [Google Scholar] [CrossRef]
  4. Duntas, L. Efficacy of selenium treatment in autoimmune thyroiditis demands an intact selenoprotein transport network. Thyroid Off. J. Am. Thyroid Assoc. 2007, 17, 83. [Google Scholar]
  5. Seiderer, J.; Dambacher, J.; Kuhnlein, B.; Pfennig, S.; Konrad, A.; Torok, H.P.; Haller, D.; Goke, B.; Ochsenkuhn, T.; Lohse, P.; et al. The role of the selenoprotein S (SELS) gene -105G>A promoter polymorphism in inflammatory bowel disease and regulation of SELS gene expression in intestinal inflammation. Tissue Antigens 2007, 70, 238–246. [Google Scholar]
  6. Misu, H.; Takamura, T.; Takayama, H.; Hayashi, H.; Matsuzawa-Nagata, N.; Kurita, S.; Ishikura, K.; Ando, H.; Takeshita, Y.; Ota, T.; et al. A liver-derived secretory protein, selenoprotein P, causes insulin resistance. Cell Metab. 2010, 12, 483–495. [Google Scholar] [CrossRef] [Green Version]
  7. Ogawa-Wong, A.N.; Berry, M.J.; Seale, L.A. Selenium and metabolic disorders: An emphasis on type 2 diabetes risk. Nutrients 2016, 8, 80. [Google Scholar] [CrossRef] [Green Version]
  8. Luongo, C.; Dentice, M.; Salvatore, D. Deiodinases and their intricate role in thyroid hormone homeostasis. Nat. Rev. Endocrinol. 2019, 15, 479–488. [Google Scholar] [CrossRef]
  9. Negro, R. Selenium and thyroid autoimmunity. Biologics 2008, 2, 265–273. [Google Scholar]
  10. Carlson, B.A.; Lee, B.J.; Tsuji, P.A.; Copeland, P.R.; Schweizer, U.; Gladyshev, V.N.; Hatfield, D.L. Selenocysteine tRNA([Ser]Sec), the Central Component of Selenoprotein Biosynthesis: Isolation, Identification, Modification, and Sequencing. Methods Mol. Biol. 2018, 1661, 43–60. [Google Scholar] [CrossRef] [Green Version]
  11. Driscoll, D.M.; Copeland, P.R. Mechanism and regulation of selenoprotein synthesis. Annu. Rev. Nutr. 2003, 23, 17–40. [Google Scholar] [PubMed]
  12. Fixsen, S.M.; Howard, M.T. Processive selenocysteine incorporation during synthesis of eukaryotic selenoproteins. J. Mol. Biol. 2010, 399, 385–396. [Google Scholar] [PubMed] [Green Version]
  13. Gursinsky, T.; Grobe, D.; Schierhorn, A.; Jager, J.; Andreesen, J.R.; Sohling, B. Factors and selenocysteine insertion sequence requirements for the synthesis of selenoproteins from a gram-positive anaerobe in Escherichia coli. Appl. Environ. Microbiol. 2008, 74, 1385–1393. [Google Scholar] [PubMed] [Green Version]
  14. Howard, M.T.; Copeland, P.R. New Directions for Understanding the Codon Redefinition Required for Selenocysteine Incorporation. Biol. Trace Elem. Res. 2019. [Google Scholar] [CrossRef]
  15. Shetty, S.P.; Shah, R.; Copeland, P.R. Regulation of selenocysteine incorporation into the selenium transport protein, selenoprotein P. J. Biol. Chem. 2014, 289, 25317–25326. [Google Scholar] [CrossRef] [Green Version]
  16. Simonovic, M.; Puppala, A.K. On elongation factor eEFSec, its role and mechanism during selenium incorporation into nascent selenoproteins. Biochim. Biophys. Acta Gen. Subj. 2018, 1862, 2463–2472. [Google Scholar] [CrossRef] [PubMed]
  17. Squires, J.E.; Berry, M.J. Eukaryotic selenoprotein synthesis: Mechanistic insight incorporating new factors and new functions for old factors. IUBMB Life 2008, 60, 232–235. [Google Scholar]
  18. Stock, T.; Selzer, M.; Connery, S.; Seyhan, D.; Resch, A.; Rother, M. Disruption and complementation of the selenocysteine biosynthesis pathway reveals a hierarchy of selenoprotein gene expression in the archaeon Methanococcus maripaludis. Mol. Microbiol. 2011, 82, 734–747. [Google Scholar] [CrossRef]
  19. Bosl, M.R.; Takaku, K.; Oshima, M.; Nishimura, S.; Taketo, M.M. Early embryonic lethality caused by targeted disruption of the mouse selenocysteine tRNA gene (Trsp). Proc. Natl. Acad. Sci. USA 1997, 94, 5531–5534. [Google Scholar]
  20. Carlson, B.A. Selenocysteine tRNA[Ser]Sec mouse models for elucidating roles of selenoproteins in health and development. In Selenium: Its Molecular Biology and Role in Human Health, 4th ed.; Hatfield, D.L., Schweizer, U., Tsuji, P.A., Gladyshev, V.N., Eds.; Springer Science+Business Media, LLC: New York, NY, USA, 2016; pp. 555–566. [Google Scholar]
  21. Carlson, B.A.; Yoo, M.H.; Tsuji, P.A.; Gladyshev, V.N.; Hatfield, D.L. Mouse models targeting selenocysteine tRNA expression for elucidating the role of selenoproteins in health and development. Molecules 2009, 14, 3509–3527. [Google Scholar]
  22. Oguri, Y.; Kajimura, S. Cellular heterogeneity in brown adipose tissue. J. Clin. Investig. 2020, 130, 65–67. [Google Scholar] [CrossRef] [PubMed]
  23. Song, A.; Dai, W.; Jang, M.J.; Medrano, L.; Li, Z.; Zhao, H.; Shao, M.; Tan, J.; Li, A.; Ning, T.; et al. Low- and high-thermogenic brown adipocyte subpopulations coexist in murine adipose tissue. J. Clin. Investig. 2020, 130, 247–257. [Google Scholar] [CrossRef] [PubMed] [Green Version]
  24. Chouchani, E.T.; Kazak, L.; Spiegelman, B.M. New Advances in Adaptive Thermogenesis: UCP1 and Beyond. Cell Metab. 2019, 29, 27–37. [Google Scholar] [CrossRef] [PubMed]
  25. Ricquier, D. UCP1, the mitochondrial uncoupling protein of brown adipocyte: A personal contribution and a historical perspective. Biochimie 2017, 134, 3–8. [Google Scholar] [CrossRef] [PubMed]
  26. Silva, J.E. Full expression of uncoupling protein gene requires the concurrence of norepinephrine and triiodothyronine. Mol. Endocrinol. 1988, 2, 706–713. [Google Scholar] [CrossRef] [PubMed] [Green Version]
  27. Marsili, A.; Zavacki, A.M.; Harney, J.W.; Larsen, P.R. Physiological role and regulation of iodothyronine deiodinases: A 2011 update. J. Endocrinol. Investig. 2011, 34, 395–407. [Google Scholar] [CrossRef] [Green Version]
  28. Christoffolete, M.A.; Linardi, C.C.; de Jesus, L.; Ebina, K.N.; Carvalho, S.D.; Ribeiro, M.O.; Rabelo, R.; Curcio, C.; Martins, L.; Kimura, E.T.; et al. Mice with targeted disruption of the Dio2 gene have cold-induced overexpression of the uncoupling protein 1 gene but fail to increase brown adipose tissue lipogenesis and adaptive thermogenesis. Diabetes 2004, 53, 577–584. [Google Scholar] [CrossRef] [Green Version]
  29. Rehnmark, S.; Bianco, A.C.; Kieffer, J.D.; Silva, J.E. Transcriptional and posttranscriptional mechanisms in uncoupling protein mRNA response to cold. Am. J. Physiol. 1992, 262, E58–E67. [Google Scholar] [CrossRef]
  30. de Jesus, L.A.; Carvalho, S.D.; Ribeiro, M.O.; Schneider, M.; Kim, S.W.; Harney, J.W.; Larsen, P.R.; Bianco, A.C. The type 2 iodothyronine deiodinase is essential for adaptive thermogenesis in brown adipose tissue. J. Clin. Investig. 2001, 108, 1379–1385. [Google Scholar] [CrossRef]
  31. Marsili, A.; Aguayo-Mazzucato, C.; Chen, T.; Kumar, A.; Chung, M.; Lunsford, E.P.; Harney, J.W.; Van-Tran, T.; Gianetti, E.; Ramadan, W.; et al. Mice with a targeted deletion of the type 2 deiodinase are insulin resistant and susceptible to diet induced obesity. PLoS ONE 2011, 6, e20832. [Google Scholar] [CrossRef]
  32. Jedrychowski, M.P.; Lu, G.Z.; Szpyt, J.; Mariotti, M.; Garrity, R.; Paulo, J.A.; Schweppe, D.K.; Laznik-Bogoslavski, D.; Kazak, L.; Murphy, M.P.; et al. Facultative protein selenation regulates redox sensitivity, adipose tissue thermogenesis, and obesity. Proc. Natl. Acad. Sci. USA 2020, 117, 10789–10796. [Google Scholar] [CrossRef] [PubMed]
  33. Wolfrum, C.; Straub, L.G. Lessons from Cre-Mice and Indicator Mice. In Brown Adipose Tissue; Pfeifer, A., Klingenspor, M., Herzig, S., Eds.; Springer: Cham, Switzerland, 2018; pp. 37–54. [Google Scholar]
  34. Popov, L.D. Mitochondrial biogenesis: An update. J. Cell Mol. Med. 2020, 24, 4892–4899. [Google Scholar] [CrossRef] [PubMed] [Green Version]
  35. Muller, T.D.; Lee, S.J.; Jastroch, M.; Kabra, D.; Stemmer, K.; Aichler, M.; Abplanalp, B.; Ananthakrishnan, G.; Bhardwaj, N.; Collins, S.; et al. p62 links beta-adrenergic input to mitochondrial function and thermogenesis. J. Clin. Investig. 2013, 123, 469–478. [Google Scholar] [CrossRef] [PubMed]
  36. Miller, I.; Renaut, J.; Cambier, S.; Murk, A.J.; Gutleb, A.C.; Serchi, T. Dataset of liver proteins of eu- and hypothyroid rats affected in abundance by any of three factors: In vivo exposure to hexabromocyclododecane (HBCD), thyroid status, gender differences. Data Brief 2016, 8, 1344–1347. [Google Scholar] [CrossRef] [PubMed]
  37. Suzuki, M.; Murakami, T.; Cheng, J.; Kano, H.; Fukata, M.; Fujimoto, T. ELMOD2 is anchored to lipid droplets by palmitoylation and regulates adipocyte triglyceride lipase recruitment. Mol. Biol. Cell 2015, 26, 2333–2342. [Google Scholar] [CrossRef]
  38. Zhao, S.L.; Hong, J.; Xie, Z.Q.; Tang, J.T.; Su, W.Y.; Du, W.; Chen, Y.X.; Lu, R.; Sun, D.F.; Fang, J.Y. TRAPPC4-ERK2 interaction activates ERK1/2, modulates its nuclear localization and regulates proliferation and apoptosis of colorectal cancer cells. PLoS ONE 2011, 6, e23262. [Google Scholar] [CrossRef]
  39. Kinlaw, W.B.; Church, J.L.; Harmon, J.; Mariash, C.N. Direct evidence for a role of the “spot 14” protein in the regulation of lipid synthesis. J. Biol. Chem. 1995, 270, 16615–16618. [Google Scholar] [CrossRef] [Green Version]
  40. LaFave, L.T.; Augustin, L.B.; Mariash, C.N. S14: Insights from knockout mice. Endocrinology 2006, 147, 4044–4047. [Google Scholar] [CrossRef] [Green Version]
  41. Chou, W.Y.; Cheng, Y.S.; Ho, C.L.; Liu, S.T.; Liu, P.Y.; Kuo, C.C.; Chang, H.P.; Chen, Y.H.; Chang, G.G.; Huang, S.M. Human spot 14 protein interacts physically and functionally with the thyroid receptor. Biochem. Biophys. Res. Commun. 2007, 357, 133–138. [Google Scholar] [CrossRef]
  42. Green, N.H.; Galvan, D.L.; Badal, S.S.; Chang, B.H.; LeBleu, V.S.; Long, J.; Jonasch, E.; Danesh, F.R. MTHFD2 links RNA methylation to metabolic reprogramming in renal cell carcinoma. Oncogene 2019, 38, 6211–6225. [Google Scholar] [CrossRef]
  43. Yu, H.; Zhou, X.; Wang, Y.; Huang, X.; Yang, J.; Zeng, J.; Li, G.; Xie, X.; Zhang, J. Nicotinamide N-methyltransferase inhibits autophagy induced by oxidative stress through suppressing the AMPK pathway in breast cancer cells. Cancer Cell Int. 2020, 20, 191. [Google Scholar] [CrossRef] [PubMed]
  44. Martinez-deMena, R.; Hernandez, A.; Obregon, M.J. Triiodothyronine is required for the stimulation of type II 5’-deiodinase mRNA in rat brown adipocytes. Am. J. Physiol. Endocrinol. Metab. 2002, 282, E1119–E1127. [Google Scholar] [CrossRef] [PubMed] [Green Version]
  45. Cinti, S. Between brown and white: Novel aspects of adipocyte differentiation. Ann. Med. 2011, 43, 104–115. [Google Scholar] [CrossRef] [PubMed]
  46. Hall, J.A.; Ribich, S.; Christoffolete, M.A.; Simovic, G.; Correa-Medina, M.; Patti, M.E.; Bianco, A.C. Absence of thyroid hormone activation during development underlies a permanent defect in adaptive thermogenesis. Endocrinology 2010, 151, 4573–4582. [Google Scholar] [CrossRef] [PubMed] [Green Version]
  47. Riese, C.; Michaelis, M.; Mentrup, B.; Gotz, F.; Kohrle, J.; Schweizer, U.; Schomburg, L. Selenium-dependent pre- and posttranscriptional mechanisms are responsible for sexual dimorphic expression of selenoproteins in murine tissues. Endocrinology 2006, 147, 5883–5892. [Google Scholar] [CrossRef] [Green Version]
  48. Seale, L.A.; Ogawa-Wong, A.N.; Berry, M.J. Sexual Dimorphism in Selenium Metabolism and Selenoproteins. Free Radic. Biol. Med. 2018, 127, 198–205. [Google Scholar] [CrossRef]
  49. Nedergaard, J.; Dicker, A.; Cannon, B. The interaction between thyroid and brown-fat thermogenesis. Central or peripheral effects? Ann. N. Y. Acad. Sci. 1997, 813, 712–717. [Google Scholar] [CrossRef]
  50. Martinez-deMena, R.; Anedda, A.; Cadenas, S.; Obregon, M.J. TSH effects on thermogenesis in rat brown adipocytes. Mol. Cell Endocrinol. 2015, 404, 151–158. [Google Scholar] [CrossRef]
  51. Choe, S.S.; Huh, J.Y.; Hwang, I.J.; Kim, J.I.; Kim, J.B. Adipose Tissue Remodeling: Its Role in Energy Metabolism and Metabolic Disorders. Front. Endocrinol. 2016, 7, 30. [Google Scholar] [CrossRef] [Green Version]
  52. Ferhat, M.; Funai, K.; Boudina, S. Autophagy in Adipose Tissue Physiology and Pathophysiology. Antioxid. Redox Signal. 2019, 31, 487–501. [Google Scholar] [CrossRef]
  53. Cairo, M.; Villarroya, J.; Cereijo, R.; Campderros, L.; Giralt, M.; Villarroya, F. Thermogenic activation represses autophagy in brown adipose tissue. Int. J. Obes. 2016, 40, 1591–1599. [Google Scholar] [CrossRef] [PubMed]
  54. Martinez-Lopez, N.; Garcia-Macia, M.; Sahu, S.; Athonvarangkul, D.; Liebling, E.; Merlo, P.; Cecconi, F.; Schwartz, G.J.; Singh, R. Autophagy in the CNS and Periphery Coordinate Lipophagy and Lipolysis in the Brown Adipose Tissue and Liver. Cell Metab. 2016, 23, 113–127. [Google Scholar] [CrossRef] [PubMed] [Green Version]
  55. Lu, Y.; Fujioka, H.; Joshi, D.; Li, Q.; Sangwung, P.; Hsieh, P.; Zhu, J.; Torio, J.; Sweet, D.; Wang, L.; et al. Mitophagy is required for brown adipose tissue mitochondrial homeostasis during cold challenge. Sci. Rep. 2018, 8, 8251. [Google Scholar] [CrossRef] [PubMed]
  56. Obregon, M.J. Adipose tissues and thyroid hormones. Front. Physiol. 2014, 5, 479. [Google Scholar] [CrossRef] [PubMed] [Green Version]
  57. Hori, H. Methylated nucleosides in tRNA and tRNA methyltransferases. Front. Genet. 2014, 5, 144. [Google Scholar] [CrossRef] [Green Version]
  58. Diamond, A.M.; Choi, I.S.; Crain, P.F.; Hashizume, T.; Pomerantz, S.C.; Cruz, R.; Steer, C.J.; Hill, K.E.; Burk, R.F.; McCloskey, J.A.; et al. Dietary selenium affects methylation of the wobble nucleoside in the anticodon of selenocysteine tRNA([Ser]Sec). J. Biol. Chem. 1993, 268, 14215–14223. [Google Scholar] [CrossRef]
  59. Ganichkin, O.M.; Anedchenko, E.A.; Wahl, M.C. Crystal structure analysis reveals functional flexibility in the selenocysteine-specific tRNA from mouse. PLoS ONE 2011, 6, e20032. [Google Scholar] [CrossRef] [Green Version]
  60. Barroso, M.; Florindo, C.; Kalwa, H.; Silva, Z.; Turanov, A.A.; Carlson, B.A.; de Almeida, I.T.; Blom, H.J.; Gladyshev, V.N.; Hatfield, D.L.; et al. Inhibition of cellular methyltransferases promotes endothelial cell activation by suppressing glutathione peroxidase 1 protein expression. J. Biol. Chem. 2014, 289, 15350–15362. [Google Scholar] [CrossRef] [Green Version]
  61. Koufaris, C.; Nilsson, R. Protein interaction and functional data indicate MTHFD2 involvement in RNA processing and translation. Cancer Metab. 2018, 6, 12. [Google Scholar] [CrossRef]
  62. Sun, X.; Maquat, L.E. Nonsense-mediated decay: Assaying for effects on selenoprotein mRNAs. Methods Enzymol. 2002, 347, 49–57. [Google Scholar]
  63. Seyedali, A.; Berry, M.J. Nonsense-mediated decay factors are involved in the regulation of selenoprotein mRNA levels during selenium deficiency. Rna 2014, 20, 1248–1256. [Google Scholar] [CrossRef] [PubMed] [Green Version]
  64. Castillo, M.; Hall, J.A.; Correa-Medina, M.; Ueta, C.; Kang, H.W.; Cohen, D.E.; Bianco, A.C. Disruption of thyroid hormone activation in type 2 deiodinase knockout mice causes obesity with glucose intolerance and liver steatosis only at thermoneutrality. Diabetes 2011, 60, 1082–1089. [Google Scholar] [CrossRef] [PubMed] [Green Version]
  65. Kumaraswamy, E.; Carlson, B.A.; Morgan, F.; Miyoshi, K.; Robinson, G.W.; Su, D.; Wang, S.; Southon, E.; Tessarollo, L.; Lee, B.J.; et al. Selective removal of the selenocysteine tRNA [Ser]Sec gene (Trsp) in mouse mammary epithelium. Mol. Cell. Biol. 2003, 23, 1477–1488. [Google Scholar] [CrossRef] [PubMed] [Green Version]
  66. Oelkrug, R.; Polymeropoulos, E.T.; Jastroch, M. Brown adipose tissue: Physiological function and evolutionary significance. J. Comp. Physiol. B 2015, 185, 587–606. [Google Scholar] [CrossRef] [PubMed]
  67. Ogawa-Wong, A.N.; Hashimoto, A.C.; Ha, H.; Pitts, M.W.; Seale, L.A.; Berry, M.J. Sexual Dimorphism in the Selenocysteine Lyase Knockout Mouse. Nutrients 2018, 10, 159. [Google Scholar] [CrossRef] [PubMed] [Green Version]
  68. Seale, L.A.; Hashimoto, A.C.; Kurokawa, S.; Gilman, C.L.; Seyedali, A.; Bellinger, F.P.; Raman, A.V.; Berry, M.J. Disruption of the selenocysteine lyase-mediated selenium recycling pathway leads to metabolic syndrome in mice. Mol. Cell. Biol. 2012, 32, 4141–4154. [Google Scholar] [CrossRef] [Green Version]
Figure 1. Genotype confirmation of Trspf/f-Ucp1-Cre+/− after breeding. (a) PCR result of genotyping, showing the heterozygote mouse DNA with the doublet (1.1 and 0.9 kb) for Trspf and Trsp+ in the first lane, the Trspf/f-Ucp1-Cre+/− mice in the second lane, and the Trspf/f used as controls in the third lane. Trspf/+-Ucp1-Cre+/− heterozygote mice were not used in experiments. (b) Trsp expression as measured by qPCR of whole brown adipose tissue (BAT). Values are means ± SD, n = 7. ** represents p < 0.01 after unpaired Student’s t-test.
Ijms 22 00611 g001
Figure 2. Metabolic overview of Trspf/f-Ucp1-Cre+/− mice. Body weight assessment of male (a) and female (b) Trspf/f-Ucp1-Cre+/− mice over 8 weeks after weaning. (c,d) VO2 consumption in male and female in the Trspf/f-Ucp1-Cre+/− mice, respectively. (e,f) Energy expenditure calculations of male and female mice, respectively, considering VCO2 as well (VCO2 not shown). (g) Phosphorylated Akt at the Ser473 residue (pAkt-Ser473) and Akt levels in the gonadal WAT of male and female mice. Values are means ± SD. p-values were calculated in (a,b,g) after two-way ANOVA (2WA) followed by Bonferroni’s post-test, while for (cf), p-values for the area under the curve (AUC) were calculated using Student’s t-test. The sample size is displayed in graphs, except in (g), where n = 6/sex. * p < 0.05, ** p < 0.01, and ns, non-significant. Black bars are Trspf/f mice, and white bars are Trspf/f-Ucp1-Cre+/− mice.
Ijms 22 00611 g002aIjms 22 00611 g002b
Figure 3. BAT morphology and Ucp1 expression in Trspf/f-Ucp1-Cre+/− mice. (a) Representative images of BAT histology after hematoxylin staining, n = 11. (b) BAT triglyceride content of Trspf/f-Ucp1-Cre+/− mice (n = 7 per sex). (c) Ucp1 mRNA expression in male Trspf/f-Ucp1-Cre+/− mice. (d) Ucp1 levels as assessed by optical densitometry after Ucp1 immunohistochemistry of male samples in (a). (e) Western blot (n = 11) image of Ucp1 levels and graph with band densitometry calculation. Values are mean ± SD, and p-values were calculated using unpaired Student’s t-test. ns, non-significant; * p < 0.05.
Ijms 22 00611 g003
Figure 4. BAT mitochondrial markers in Trspf/f-Ucp1-Cre+/− mice. Levels of mitochondrial markers (a) PGC-1α and (b) ATPB in BAT of male and female Trspf/f-Ucp1-Cre+/− mice were assessed by Western blot (n = 8 per sex). Values are mean ± SD and p-values were calculated using unpaired Student’s t-test. ns, non-significant, ** p < 0.01.
Ijms 22 00611 g004
Figure 5. Core body temperature in Trspf/f and Trspf/f-Ucp1-Cre+/− male (a) and female (b) mice during acute cold exposure. Data are mean ± SD; two-way ANOVA (2WA) with Bonferroni’s post-test was performed, and p-values are displayed in graphs, as well as sample sizes.
Ijms 22 00611 g005
Figure 6. Autophagy in the cold-exposed male Trspf/f-Ucp1-Cre+/− mice. Levels of autophagy marker p62-SQSTM1 in the BAT of cold-exposed male Trspf/f-Ucp1-Cre+/− mice were obtained by (a) Western blot; (b) graph displays quantification analysis. Values are expressed as mean + SD, n = 11. Student’s unpaired t-test was performed; ns, non-significant.
Ijms 22 00611 g006
Figure 7. Gene expression changes in Trspf/f-Ucp1-Cre+/− mice at room temperature and after acute cold exposure. (a) Venn diagram of microarray data sets, showing the number of genes differentially expressed between Trspf/f-Ucp1-Cre+/− and Trspf/f mice at room temperature and after cold exposure. (bd) Validation of microarray results by qPCR analysis of the expression of Gsta3, Elmod2 and Trappc4, respectively. Data are mean ± SD. p-values are shown in graphs and were calculated by two-way ANOVA (2WA) followed by Bonferroni’s post test analysis. * p < 0.05,** p < 0.01, and *** p < 0.001. RT, room temperature.
Ijms 22 00611 g007
Figure 8. Gene expression of thyroid hormone responsive transcripts in male Trspf/f and Trspf/f-Ucp1-Cre+/− mice. Expression levels of (a) Dio2, (b) Thrsp (i.e., Spot14), and (c) Tshr were assessed by qPCR. RT, room temperature. Data are mean + SD; n = 8–10 per genotype. p-values are displayed in graphs and calculated by two-way ANOVA followed by Bonferroni’s post-test. * p < 0.05, ** p < 0.01 and *** p < 0.001.
Ijms 22 00611 g008
Figure 9. Gene expression of transcripts involved in methylation pathways in male Trspf/f and Trspf/f-Ucp1-Cre+/− mice. Expression of (a) Mthfd2 and (b) Nnmt were assessed by qPCR. RT, room temperature. Data are mean + SD; n = 8–10 per genotype. p-values are displayed in graphs and were calculated by two-way ANOVA (2WA) followed by Bonferroni’s post test; * p < 0.05, ** p < 0.01.
Ijms 22 00611 g009
Table 1. Top differentially expressed genes in BAT of Trspf/f-Ucp1-Cre+/− mice at room temperature.
Top Upregulated
Gene SymbolGene NameFold Changep-Value
Plekhm2pleckstrin homology and RUN domain containing M24.590.0361
Sntb2syntrophin beta 24.020.0008
Phf20PHD finger protein 203.780.0271
Vps4avacuolar protein sorting 4 homolog A3.330.0296
Fads3fatty acid desaturase 33.30.0119
S100pbpS100P binding protein3.260.0005
Lcp1lymphocyte cytosolic protein 13.170.0453
Fxyd5FXYD domain containing ion transport regulator 53.070.0334
Elmod2ELMO domain containing 22.790.003
Kpna2karyopherin subunit alpha 22.720.0061
Top Downregulated
Gene SymbolGene NameFold Changep-Value
Tmsb4xthymosin, beta 4, X chromosome−4.240.0172
Trappc4trafficking protein particle complex 4−3.630.0183
HscbHscB mitochondrial iron-sulfur cluster cochaperone−3.120.0196
Ccdc85acoiled-coil domain containing 85A−2.980.003
SkilSKI-like proto-oncogene−2.870.0297
Sorl1sortilin related receptor 1−2.80.0299
Gkglycerol kinase−2.660.0094
Nbeaneurobeachin−2.460.0228
Tmx4thioredoxin related transmembrane protein 4−2.430.0234
Per2period circadian regulator 2−2.420.0481
Table 2. Top 5 pathways affected in BAT of Trspf/f-Ucp1-Cre+/− mice at room temperature.
Canonical Pathways−log(p-Value)Molecules
Nicotine Degradation II1.85FMO2,FMO5
Antigen Presentation Pathway1.78HLA-DMB,MR1
Glycerol Degradation I1.59Gk
LPS/IL-1 Mediated Inhibition of RXR Function1.58GSTA3,FMO2,SCARB1,FMO5
Myo-inositol Biosynthesis1.47IMPAD1
Table 3. Top differentially expressed genes in BAT of Trspf/f-Ucp1-Cre+/− mice acutely exposed to cold.
Top Upregulated
Gene SymbolGene NameFold Changep-Value
Nnmtnicotinamide N-methyltransferase24.070.0012
Elmod2ELMO domain containing 24.10.0018
Gsta3glutathione S-transferase alpha 34.050.0038
Laptm5lysosomal protein transmembrane 53.150.0029
Lyzlysozyme3.150.0087
Ear2eosinophil-associated, ribonuclease A family, member 22.740.0013
Mthfd2methylenetetrahydrofolate dehydrogenase (NADP+ dependent) 22.690.0126
Rab3aRAB3A, member RAS oncogene family2.60.0131
Sorl1sortilin related receptor 12.440.0467
Ctsscathepsin S2.410.0376
Top Downregulated
Gene SymbolGene NameFold Changep-Value
Mbpmyelin basic protein−3.170.0408
Gucd1guanylyl cyclase domain containing 1−2.860.0375
Rnf149ring finger protein 149−2.560.0272
Rnf125ring finger protein 125−2.540.0276
Thrspthyroid hormone responsive (Spot14)−2.470.0044
Tshrthyroid stimulating hormone receptor−2.460.0266
Insig1insulin induced gene 1−2.430.0413
Art3ADP-ribosyltransferase 3−2.390.0255
Il18interleukin 18−2.360.0035
Akap12A-kinase anchoring protein 12−2.350.0085
Table 4. Top 5 pathways affected in BAT of Trspf/f-Ucp1-Cre+/− mice after acute cold exposure.
Canonical Pathways−log(p-Value)Molecules
autophagy2.13WDFY3,CTSS
Histidine Degradation III1.94MTHFD2
Tetrahydrofolate Salvage from 5,10-methenyltetrahydrofolate1.81MTHFD2
Folate Transformations I1.72MTHFD2
LXR/RXR Activation1.58IL18,LYZ
Table 5. Thyroid function of the Trspf/f-Ucp1-Cre+/- mice.
Room TemperatureCold ExposureTwo-Way ANOVA
Trspf/fTrspf/f-Ucp1-Cre+/−Trspf/fTrspf/f-Ucp1-Cre+/−PgPtPi
TSH (pg/mL)
Males1895.2 ± 86.02036 ± 46.05 a1312 ± 112.91161 ± 211.7 b0.861<0.00010.031
Females710.3 ± 75.4541.1 ± 282.8363.7 ± 107.2503.8 ± 149.40.0430.8680.094
T4 (μg/dl)
Males3.768 ± 1.184.06 ± 1.013.447 ± 0.463.16 ± 0.610.9940.1540.487
Females3.661 ± 0.653.421 ± 0.423.082 ± 0.583.009 ± 0.190.4880.0380.712
T3 (ng/mL)
Males1.02 ±0.190.79 ± 0.341.08 ± 0.240.87 ± 0.210.010.420.9
Females0.62 ± 0.240.58 ± 0.10.86 ± 0.220.75 ± 0.040.360.010.62
Results are expressed as mean ± SD, n = 9–10 per genotype. Bold indicates significant p-values calculated by two-way ANOVA. a p < 0.05 Trspf/f vs. Trspf/f-Ucp1-Cre+/− mice at room temperature; and b p< 0.05 room temperature vs. cold exposure for Trspf/f-Ucp1-Cre+/− mice, after Bonferroni’s post-test. Pg, p-value for the genotype factor; Pt, p-value for the temperature factor; Pi, p-value for interaction of both factors; TSH, thyroid-stimulating hormone.
Publisher’s Note: MDPI stays neutral with regard to jurisdictional claims in published maps and institutional affiliations.

