Article

Hyperglycemia Altered DNA Methylation Status and Impaired Pancreatic Differentiation from Embryonic Stem Cells

1
Shenzhen Key Laboratory of Fertility Regulation, Reproductive Medicine Center, The University of Hong Kong, Shenzhen Hospital, Shenzhen 518000, China
2
Department of Obstetrics and Gynaecology, Li Ka Shing Faculty of Medicine, The University of Hong Kong, 21 Sassoon Road, Hong Kong
*
Authors to whom correspondence should be addressed.
Int. J. Mol. Sci. 2021, 22(19), 10729; https://doi.org/10.3390/ijms221910729
Submission received: 30 August 2021 / Revised: 27 September 2021 / Accepted: 30 September 2021 / Published: 3 October 2021
(This article belongs to the Special Issue Nuclear Architecture in Differentiation and Diseases)

Abstract

:
The prevalence of type 2 diabetes (T2D) is rapidly increasing across the globe. Fetal exposure to maternal diabetes was correlated with higher prevalence of impaired glucose tolerance and T2D later in life. Previous studies showed aberrant DNA methylation patterns in pancreas of T2D patients. However, the underlying mechanisms remained largely unknown. We utilized human embryonic stem cells (hESC) as the in vitro model for studying the effects of hyperglycemia on DNA methylome and early pancreatic differentiation. Culture in hyperglycemic conditions disturbed the pancreatic lineage potential of hESC, leading to the downregulation of expression of pancreatic markers PDX1, NKX6−1 and NKX6−2 after in vitro differentiation. Genome-wide DNA methylome profiling revealed over 2000 differentially methylated CpG sites in hESC cultured in hyperglycemic condition when compared with those in control glucose condition. Gene ontology analysis also revealed that the hypermethylated genes were enriched in cell fate commitment. Among them, NKX6−2 was validated and its hypermethylation status was maintained upon differentiation into pancreatic progenitor cells. We also established mouse ESC lines at both physiological glucose level (PG-mESC) and conventional hyperglycemia glucose level (HG-mESC). Concordantly, DNA methylome analysis revealed the enrichment of hypermethylated genes related to cell differentiation in HG-mESC, including Nkx6−1. Our results suggested that hyperglycemia dysregulated the epigenome at early fetal development, possibly leading to impaired pancreatic development.

1. Introduction

Diabetes is a global health concern. In a recent report, it was estimated that over 400 million patients were suffering from diabetes and the global prevalence of diabetes and impaired glucose tolerance would reach over 500 million in 20 years [1]. Type 2 diabetes (T2D) accounts for around 90% of the diabetic cases. Lifestyle and genetics are the two major risk factors leading to the disease. In addition, the in-utero environment, which plays a pivotal role in fetal development, is considered as another risk factor for T2D development in offspring. In fact, the concept of “Developmental origins of health and disease” has long been proposed, stating that alterations in the fetal environment had consequences in postnatal life, including later onset of non-communicable diseases [2,3]. Consistently, early studies demonstrated a strong association between fetal exposure to maternal diabetes and later occurrence of metabolic disorders such as obesity, glucose intolerance, and T2D in offspring [4,5,6].
T2D has been heavily linked with epigenetic dysregulation such as changes in the DNA methylome. For instance, several studies reported DNA methylome changes in pancreatic islets of T2D patients [7,8]. Upon onset of diabetes, Pdx1, an important transcription factor for pancreas development, is DNA hypermethylated in rats [9]. Igf2 and H19 are also hypermethylated in the pancreatic islets of adult offspring born from intrauterine hyperglycemic condition in mice [10]. More importantly, in vitro studies showed that pre-implantation embryos were vulnerable to epigenetic changes upon challenges by external stimuli. Hyperglycemic conditions reduce cell proliferation and blastocyst formation rates in animals [11,12]. In fact, there is a dynamic change in the DNA methylome during early embryogenesis from zygotic to post-implantation stages [13]. The early embryos are therefore susceptible to epigenetic changes induced by the intrauterine environment [14,15]. However, the exact mechanisms on how the changes in epigenetic regulation affect development of diseases remains largely unknown.
We have previously utilized human embryonic stem cell (hESC) as an in vitro model and demonstrated that hyperglycemic conditions dysregulated the histone methylation patterns, linking to impaired differentiation of definitive endoderm (DE), a progenitor of the pancreatic development process [16]. Here, we further showed that hyperglycemic conditions dysregulated the DNA methylome pattern in undifferentiated hESC. The hypermethylated genes were enriched in cell fate commitment, insulin secretion and glucose transport. More importantly, the dysregulated DNA methylome was concordant with gene expression patterns and impairment of early pancreatic differentiation. Our study provided insight on the impact of environmental insults on early developmental events, possibly leading to adult onset of diseases.

2. Results

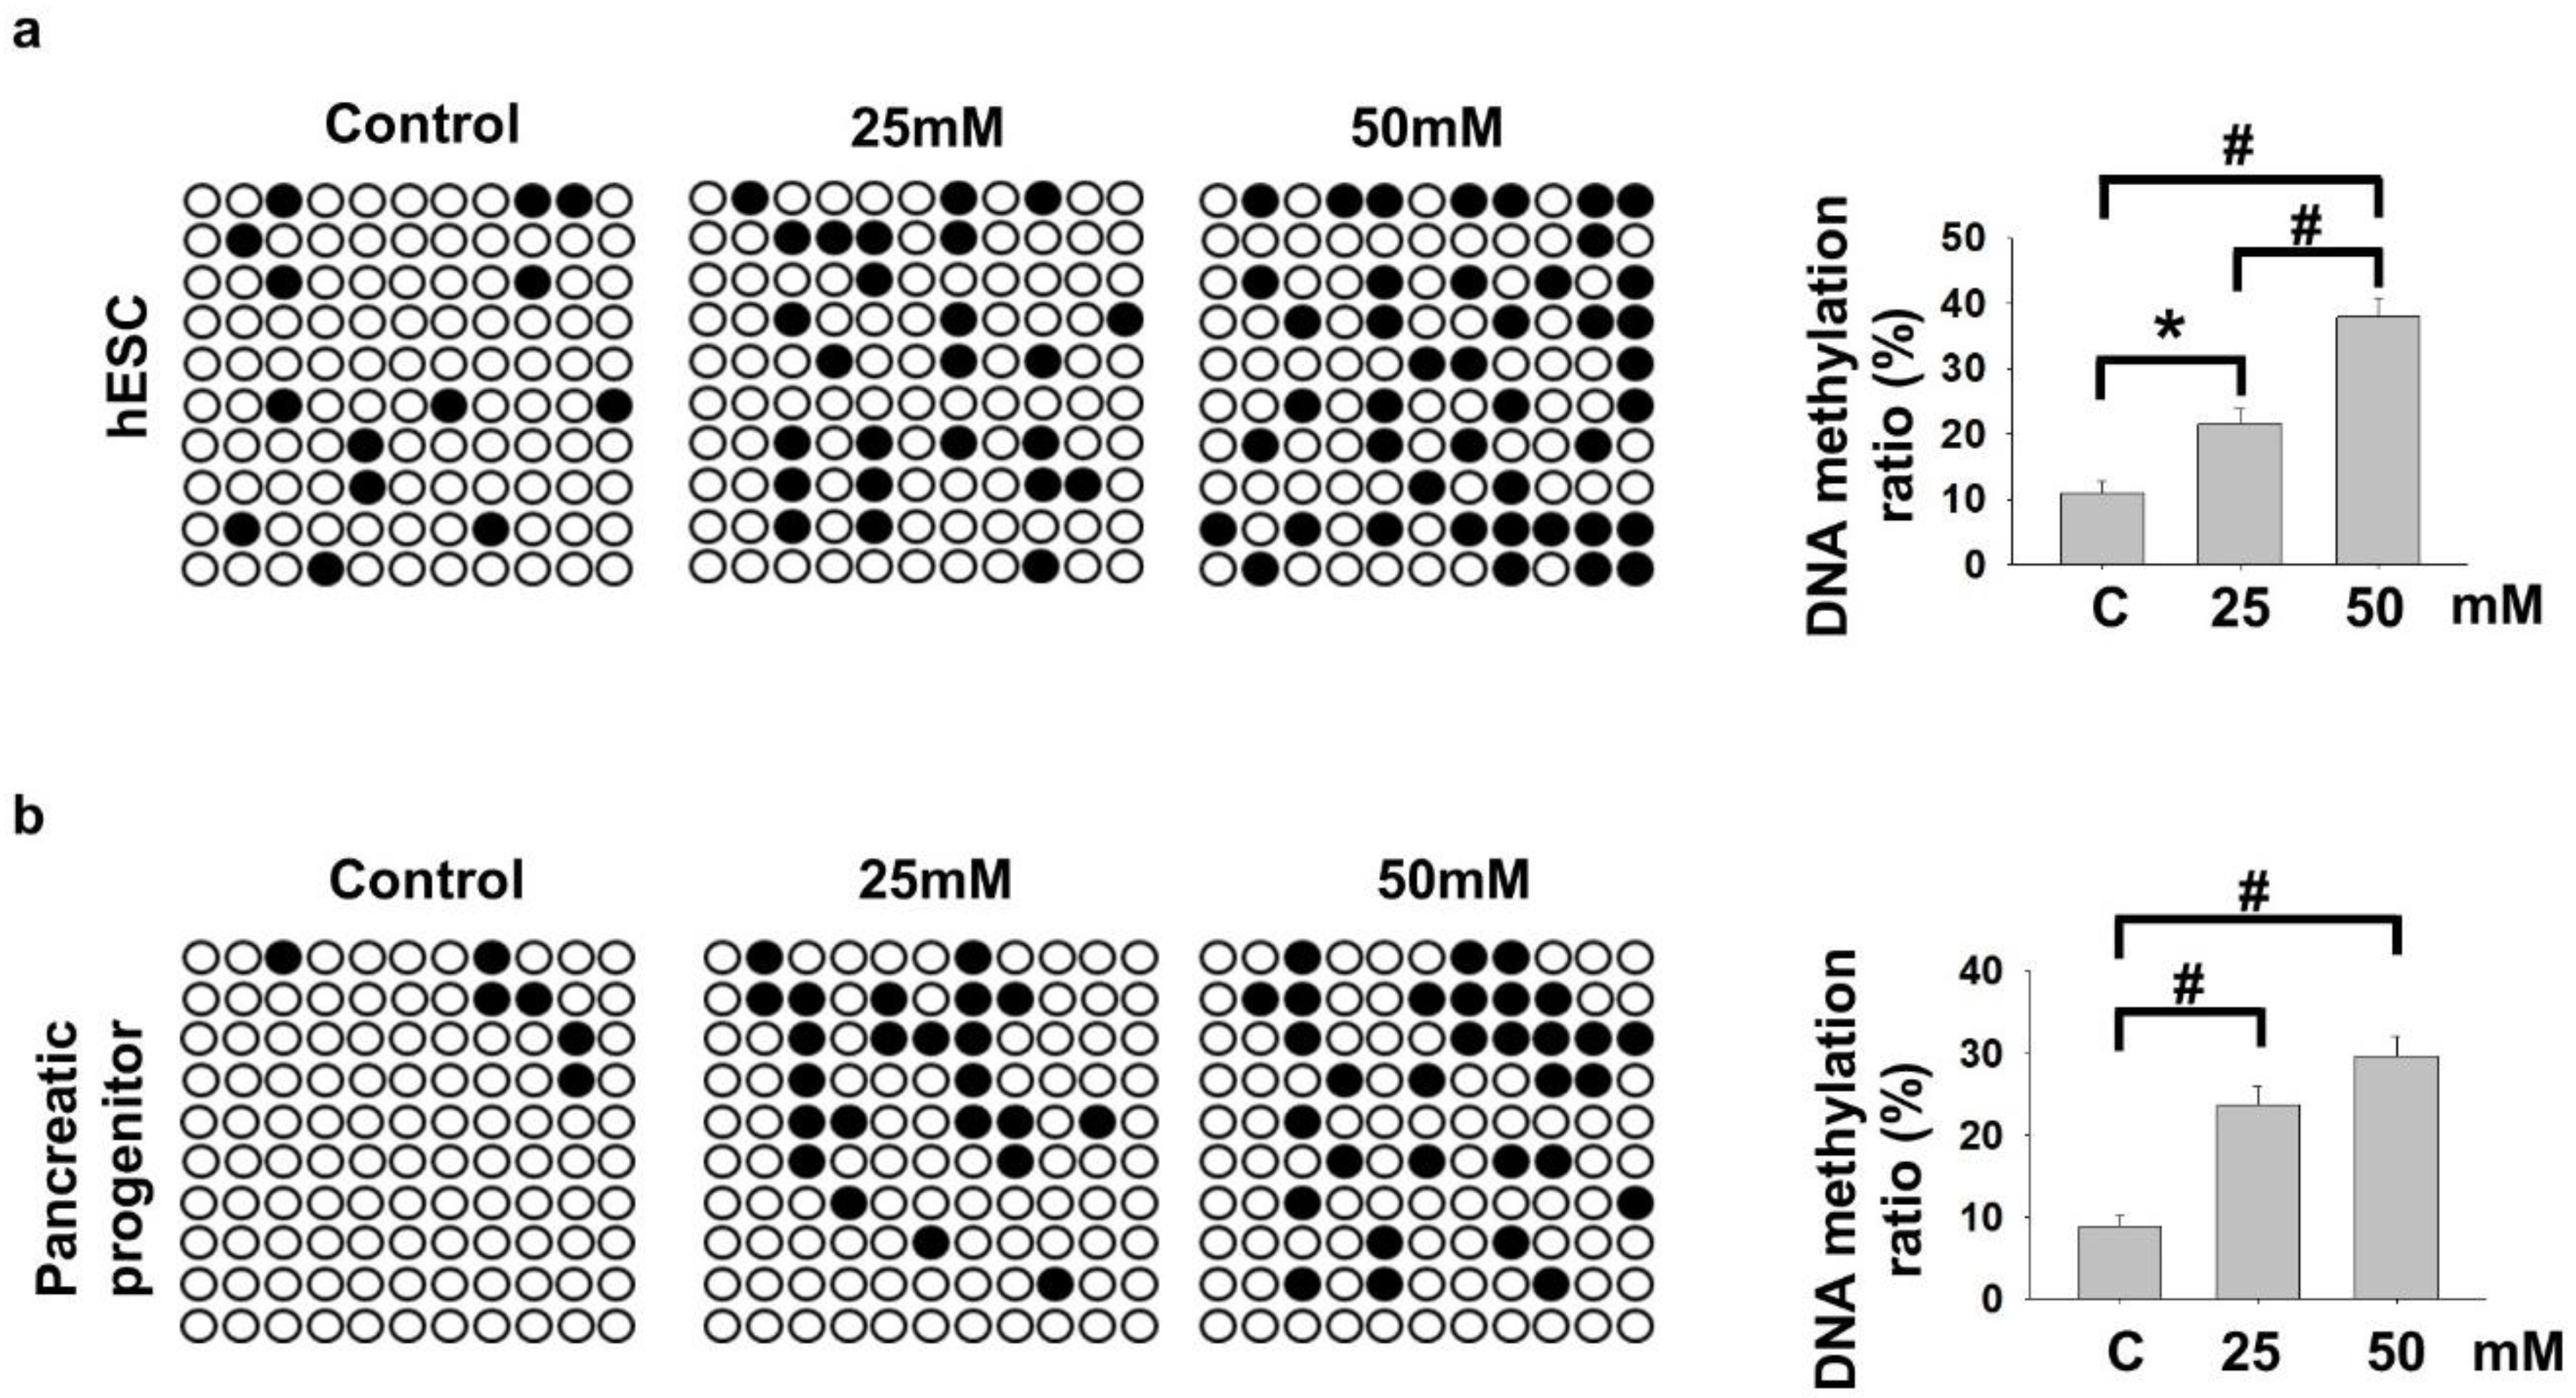
2.1. Pancreatic Differentiation Potential from Human Embryonic Stem Cell (hESC) Was Disrupted in Hyperglycemic Culture Conditions

We showed previously that hyperglycemic conditions retained the repressive H3K27me3 marks on the promoters of pancreatic genes (SOX17, FOXA2, CXCR4 and EOMES), leading to downregulation of their mRNA expression during DE differentiation from hESC [16]. By adopting our established hESC pancreatic progenitor cell differentiation model, we cultured a hESC line, VAL3 [17] in hyperglycemic conditions (25 mM and 50 mM D-glucose, 13.7 mM as control) for 5 passages. RT-qPCR analyses showed that the mRNA expression levels of pluripotent markers (OCT4, NANOG and SOX2) of the cells in these conditions were comparable (Figure 1a). The treated cells were then subjected to early pancreatic differentiation into DE and pancreatic progenitor (PP) cells under control glucose level. The 25 and 50 mM glucose-treated VAL3 had significantly lower expressions of DE markers (SOX17, FOXA2, CXCR4 and EOMES) after 5 days of DE induction when compared to the control (Figure 1b). The effect was extended to the PP stage, with significantly lower expressions of PP markers (PDX1, NKX6−1 and NKX6−2) in the hyperglycemia-treated group than the control (Figure 1c). We further examined the histone bivalency of the undifferentiated VAL3 cultured in the three conditions. Chromatin immunoprecipitation (ChIP)-PCR analyses revealed the presence of repressive H3K27me3 marks on the promoter of the DE markers, SOX17, FOXA2 and CXCR4 but the levels of the histone methylation were not affected (Figure 1d).

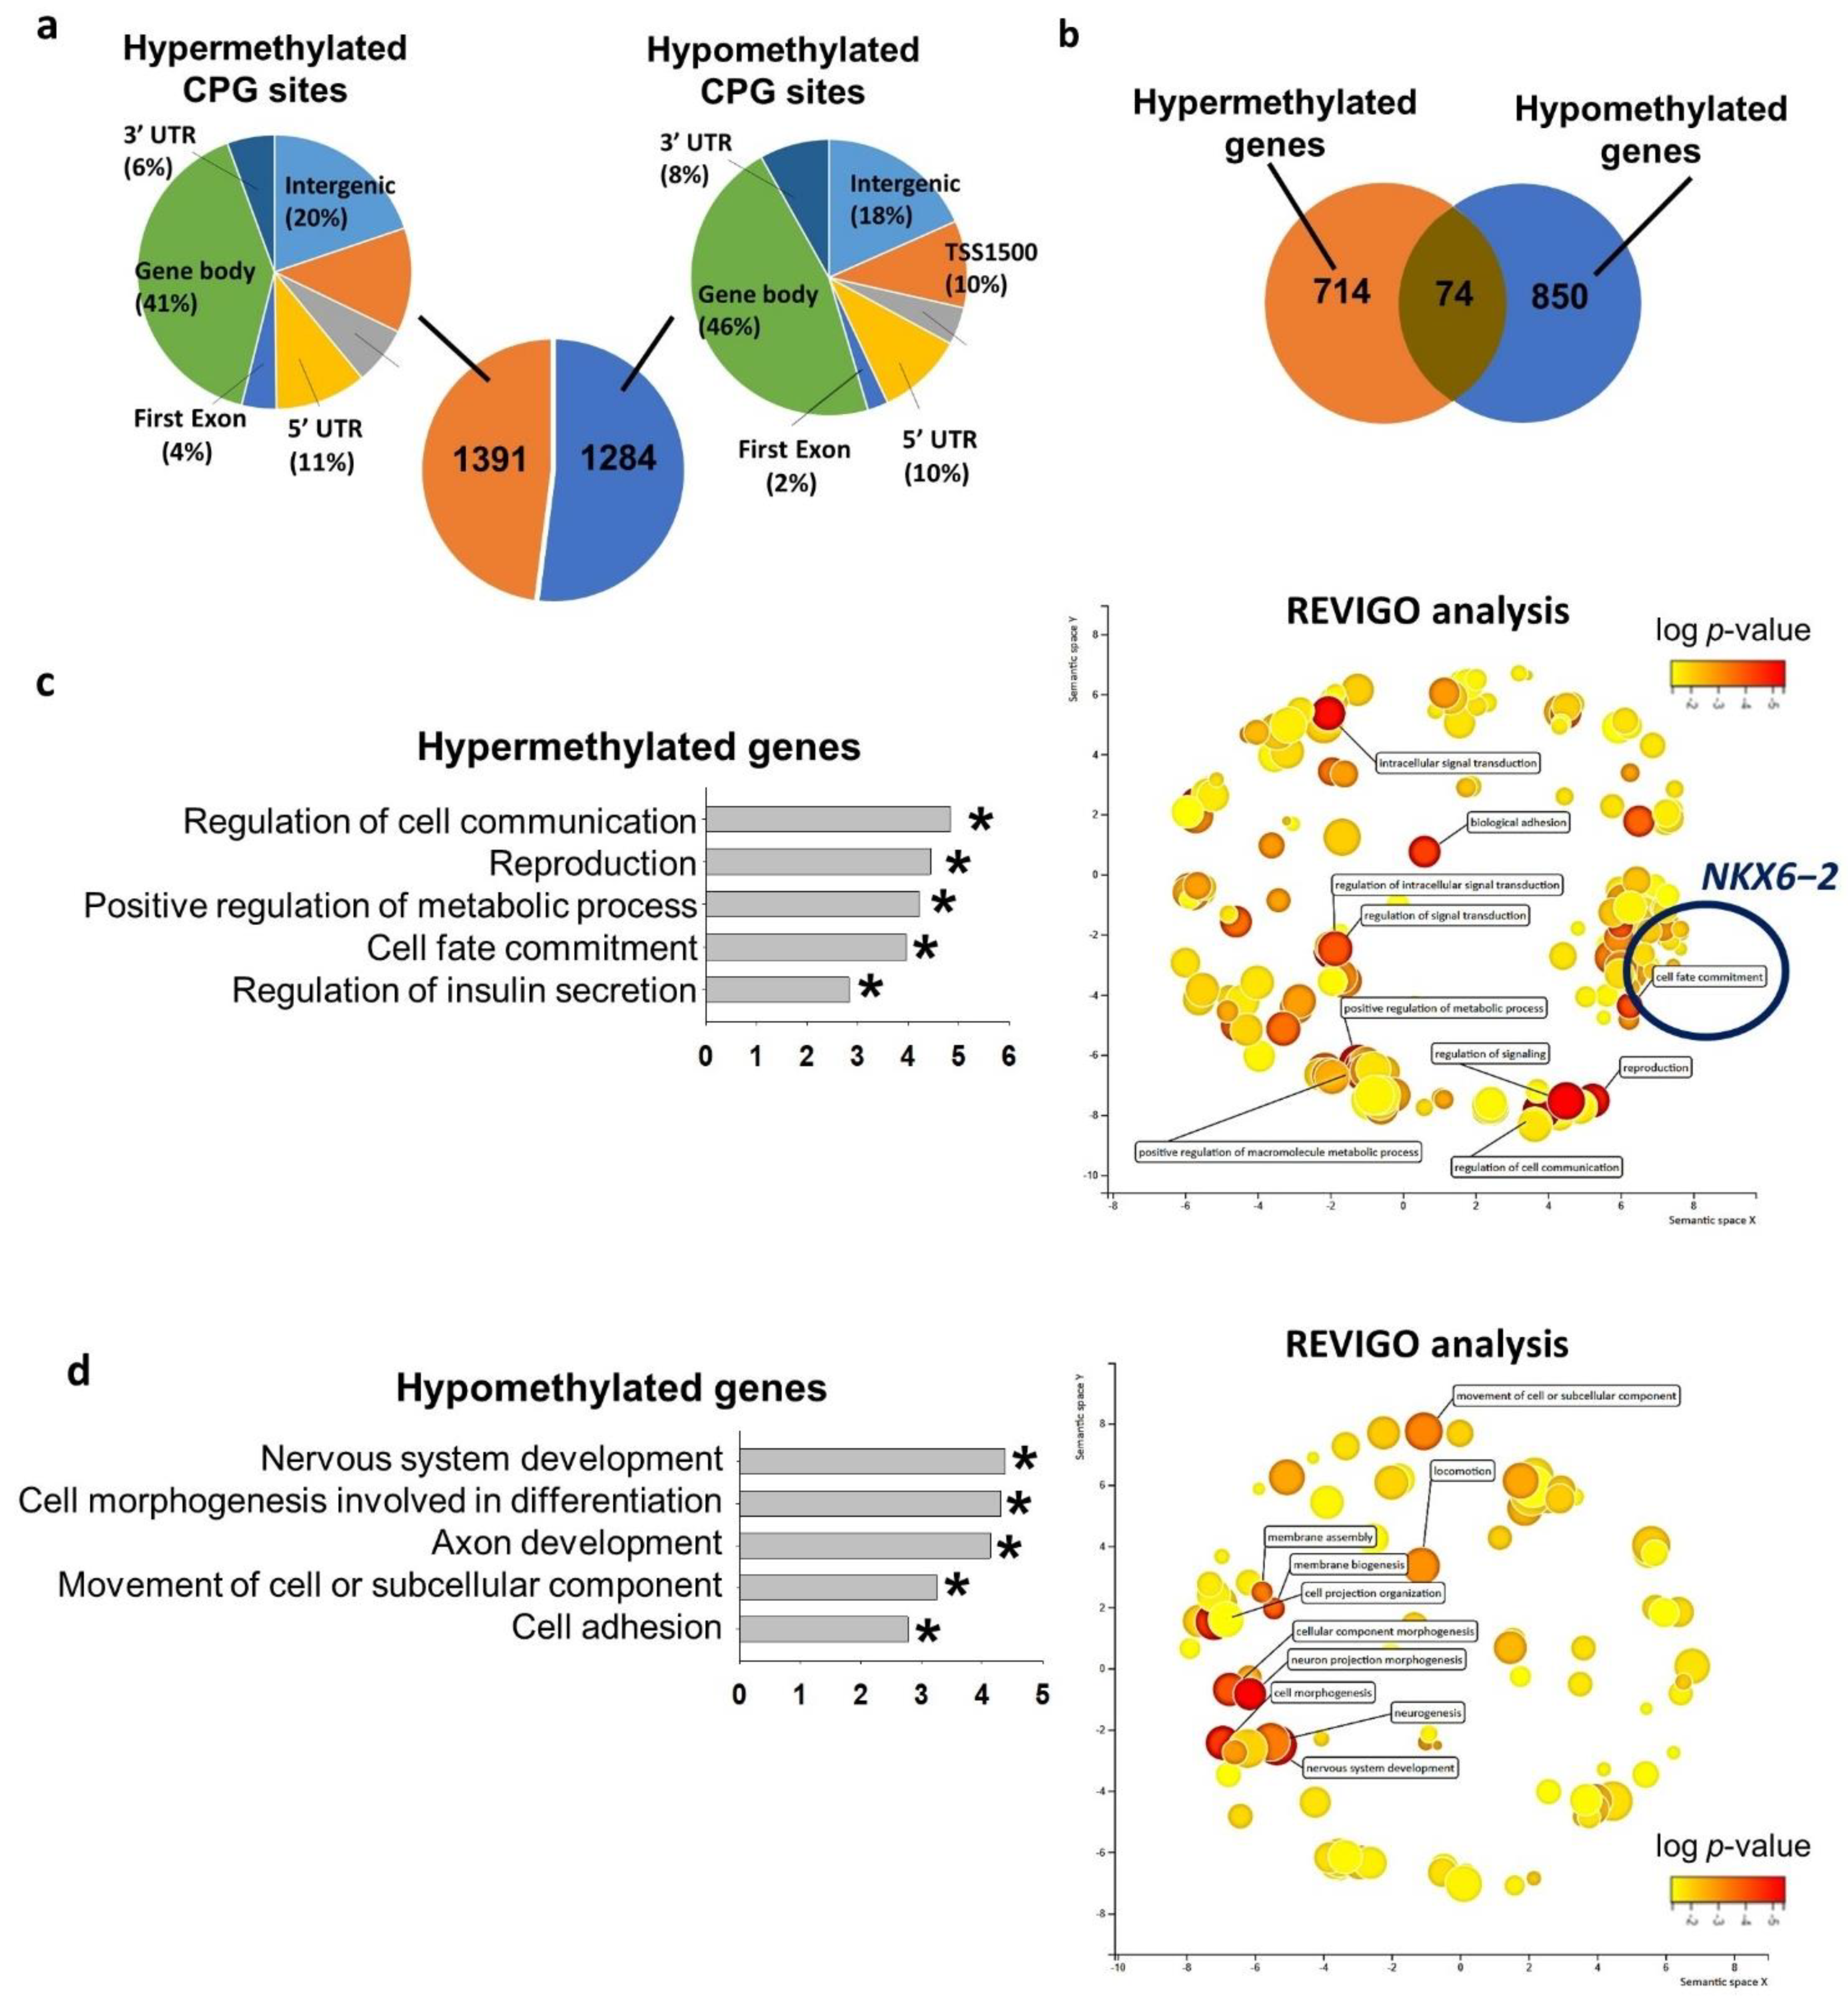
2.2. Hyperglycemia Altered Global DNA Methylome in hESC

We next studied the genome-wide DNA methylomes of VAL3 cultured in control glucose (13.7 mM) and hyperglycemic (50 mM) conditions using the Infinium HumanMethylation450 BeadChip array. The analysis revealed 1391 hypermethylated cytosines followed by guanine residues (CpG) sites and 1284 hypomethylated CpG sites in the hyperglycemia-treated VAL3 when compared to the control. The distribution of the CpG sites in different genomic regions were similar between hypermethylated and the hypomethylated regions (Figure 2a). The CpG sites were annotated to 714 hypermethylated and 850 hypomethylated genes induced by the hyperglycemic condition (Figure 2b). Gene ontology analyses revealed that the hypermethylated genes were related to cell communication, reproduction, regulation of metabolic process, cell fate commitment and regulation of insulin secretion (Figure 2c and Table S1). We subjected all significant gene ontology terms for REduce and Visualize Gene Ontology (REVIGO) analysis which grouped and clustered the biological terms based on nature of similarity [18]. The results confirmed that the most significant terms were intracellular signal transduction, reproduction, regulation of metabolic process, cell fate commitment (Figure 2c and Table 1). Among the genes clustered in the cell fate commitment term, NKX6−2 was significantly downregulated during differentiation of the hyperglycemia-treated VAL3. On the other hand, the hypomethylated genes were enriched in nervous system development, cell morphogenesis involved in differentiation, axon development, cell movement and cell adhesion (Figure 2d and Table S1). REVIGO analysis revealed the enrichment of clustered Gene ontology (GO) terms such as neurogenesis, cellular component morphogenesis and movement of cell (Figure 2d and Table 1).

2.3. NKX6−2 Was Hypermethylated under Hyperglycemic Condition

We and others [16,19] have demonstrated the importance of NKX6−2 in regulating pancreatic progenitor differentiations. It was among the hypermethylated genes enriched in cell fate commitment and was down-regulated in PP cells differentiated from hyperglycemia-treated VAL3 (Figure 1c), suggesting potential epigenetic regulation of the gene during pancreatic differentiation. Using conventional bisulfite PCR, it was found that 25 mM and 50 mM glucose culture significantly induced DNA methylation levels of NKX6−2 in the treated undifferentiated VAL3 (Figure 3a). More importantly, the hypermethylation status of NKX6−2 in VAL3 with prior hyperglycemia (25 mM and 50 mM) treatment was maintained after induction of PP differentiation at a glucose level of 13.7 mM (Figure 3b).

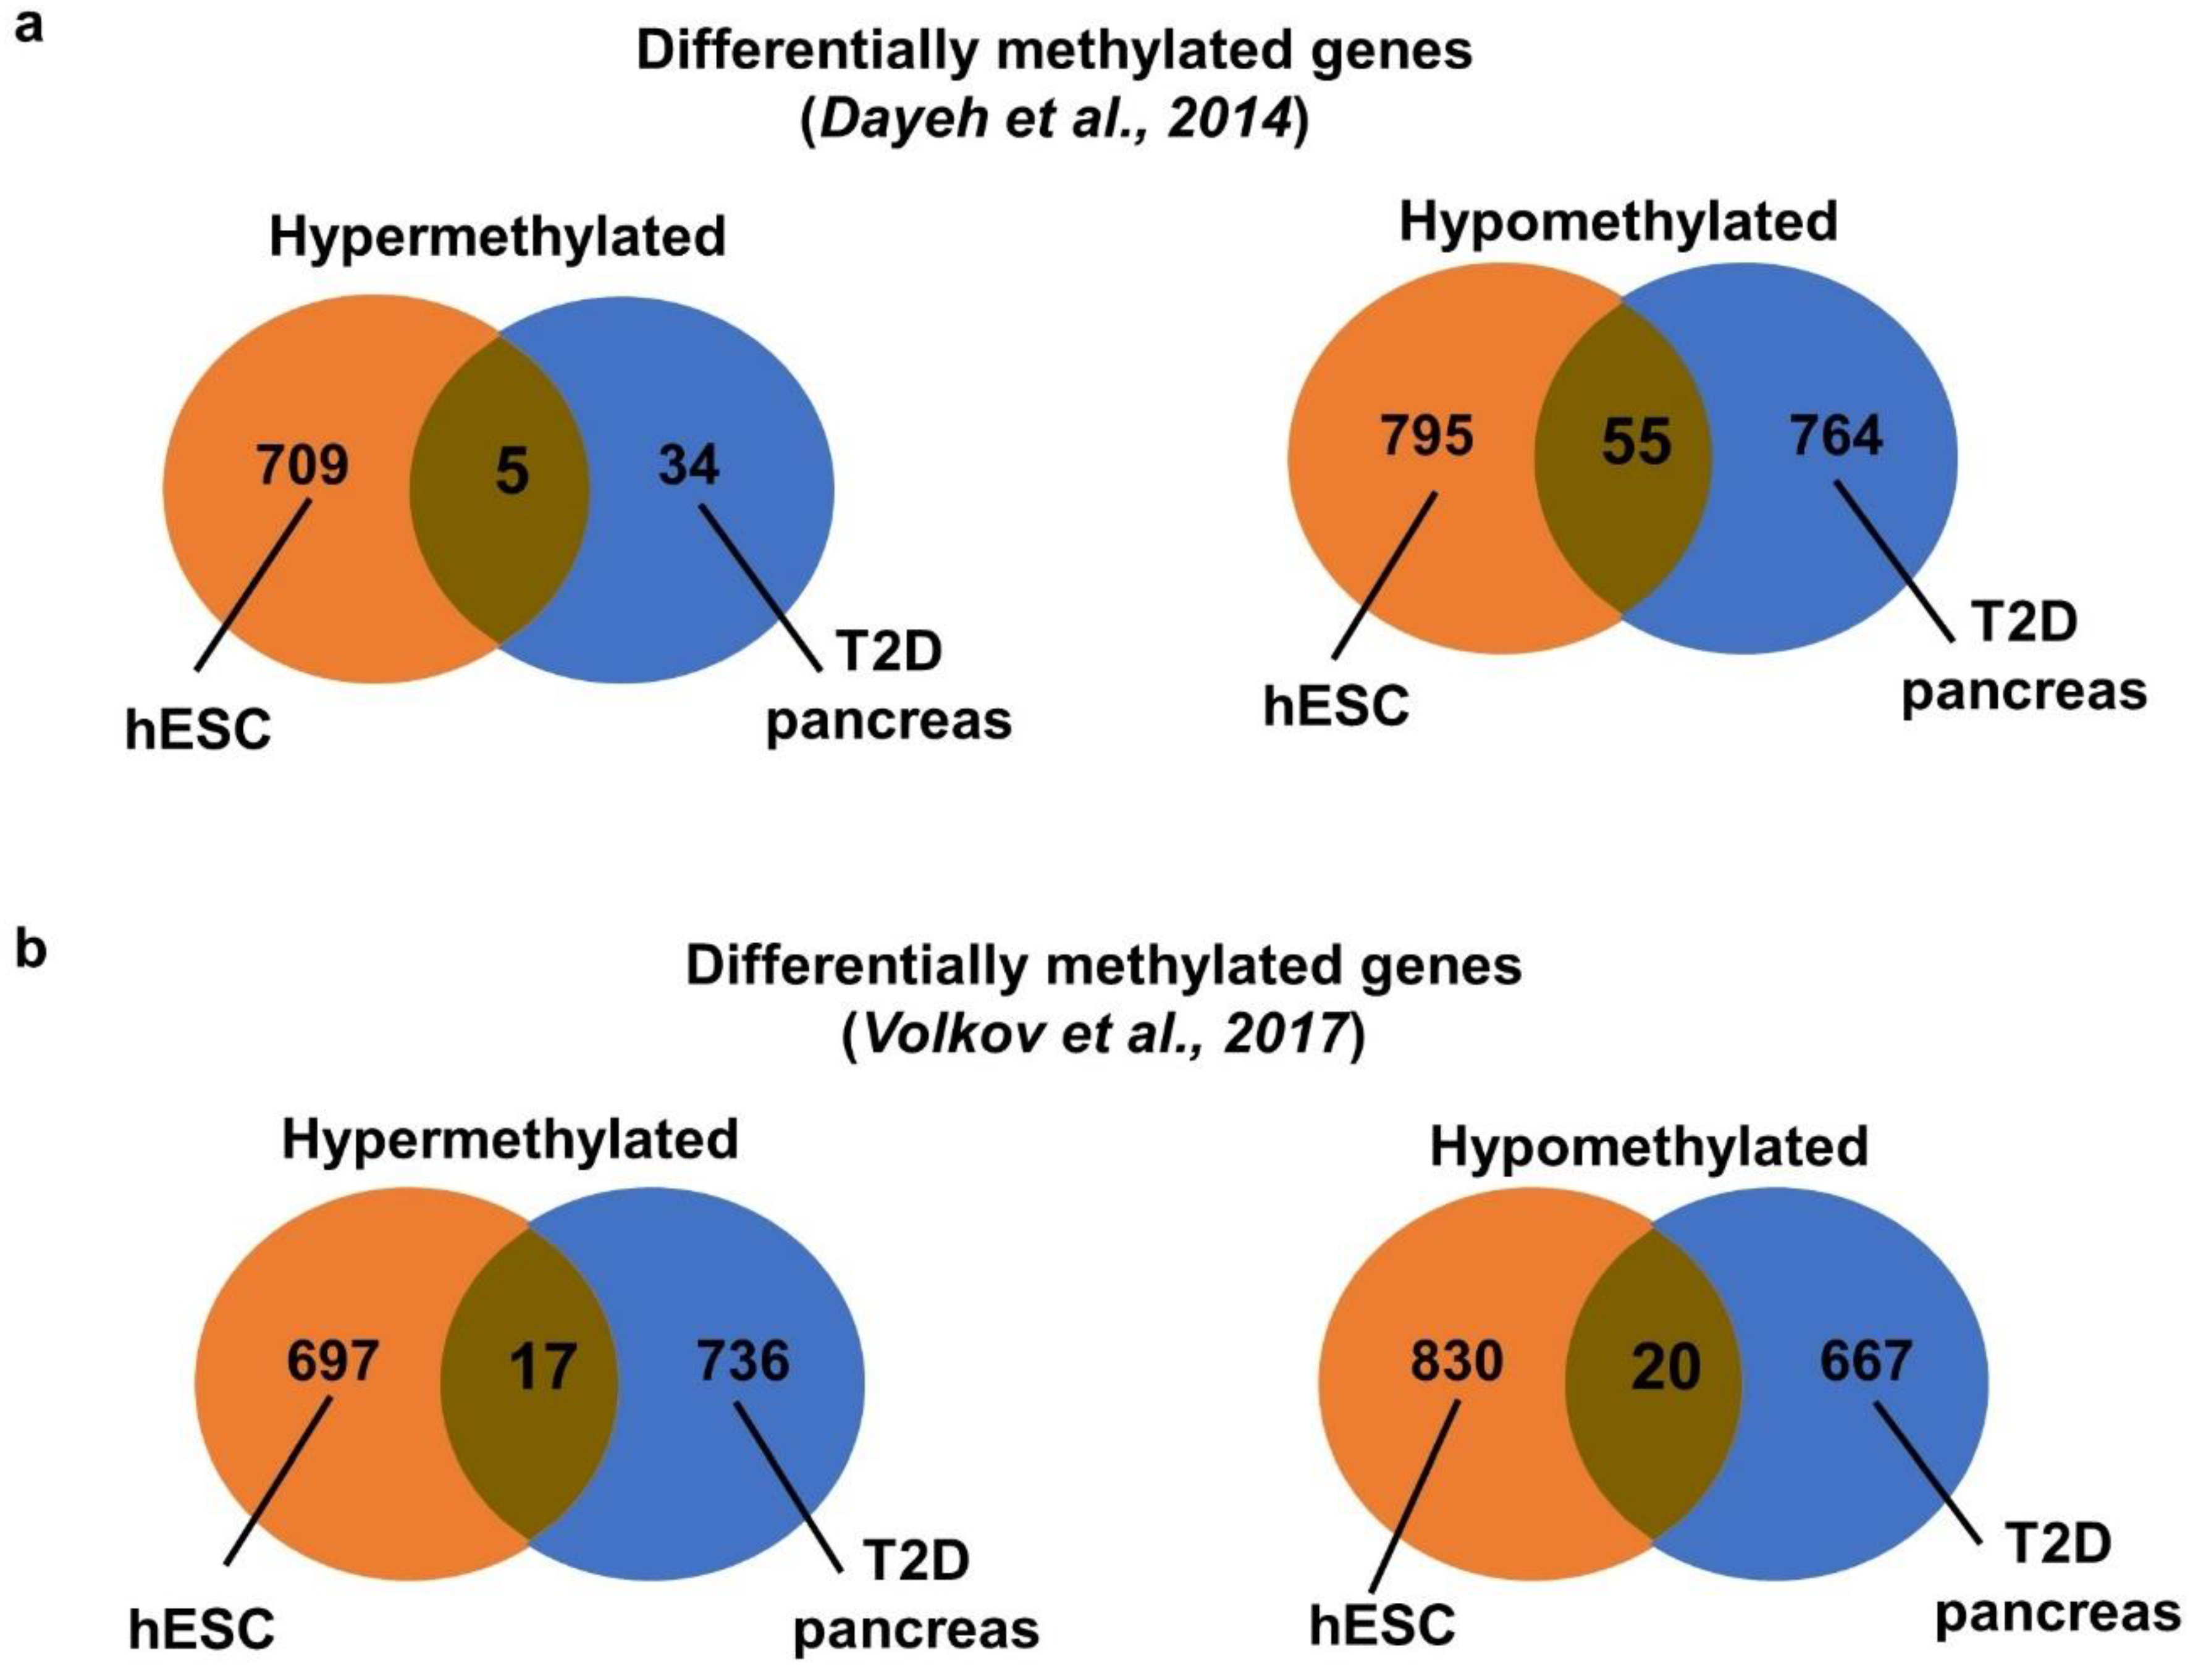
2.4. Meta-Analysis of DNA Methylomes of Hyperglycemia Treated VAL3 with Dysregulated Methylomes of Human Pancreatic Islets from T2D Patients

We further compared our methylome data with two published methylome datasets of human pancreatic islets from T2D patients. One dataset was conducted with DNA methylation array [7] while the other with whole genome bisulfite sequencing [20]. The 2 studies shared only 1 hypermethylated (CACNA1H) and 23 hypomethylated genes (Table S2). We compared our methylome data with these datasets. The study of Dayeh and coworkers [7] identified mainly hypomethylated genes. We found five common hypermethylated and 55 hypomethylated genes in the hyperglycemia-treated VAL3 and the T2D pancreas (Figure 4a, Table S3). Interestingly, among the hypomethylated genes, HDAC4 and KCNQ1 were reported as T2D candidate genes. In contrast, the other dataset found similar numbers of differentially hypermethylated and hypomethylated genes in the T2D and the control pancreas [20]. We found 17 commonly hypermethylated and 20 hypomethylated genes in the hyperglycemia-treated VAL3 and the T2D pancreas (Figure 4b, Table S3). We next compared the gene ontology terms in the 3 datasets. Interestingly, similar hypermethylated terms, including secretion, regulation of transport and positive regulation of cell differentiation were identified in our hESC and Volkov’s datasets. On the other hand, similar hypomethylated terms, including cell adhesion, cell mobility and nervous system development, were identified in all 3 datasets (Tables S1 and S4). Only 1 hypermethylated (CACNA1H) and 1 hypomethylated (S100A2) gene were commonly identified in the 3 datasets (Table S3).

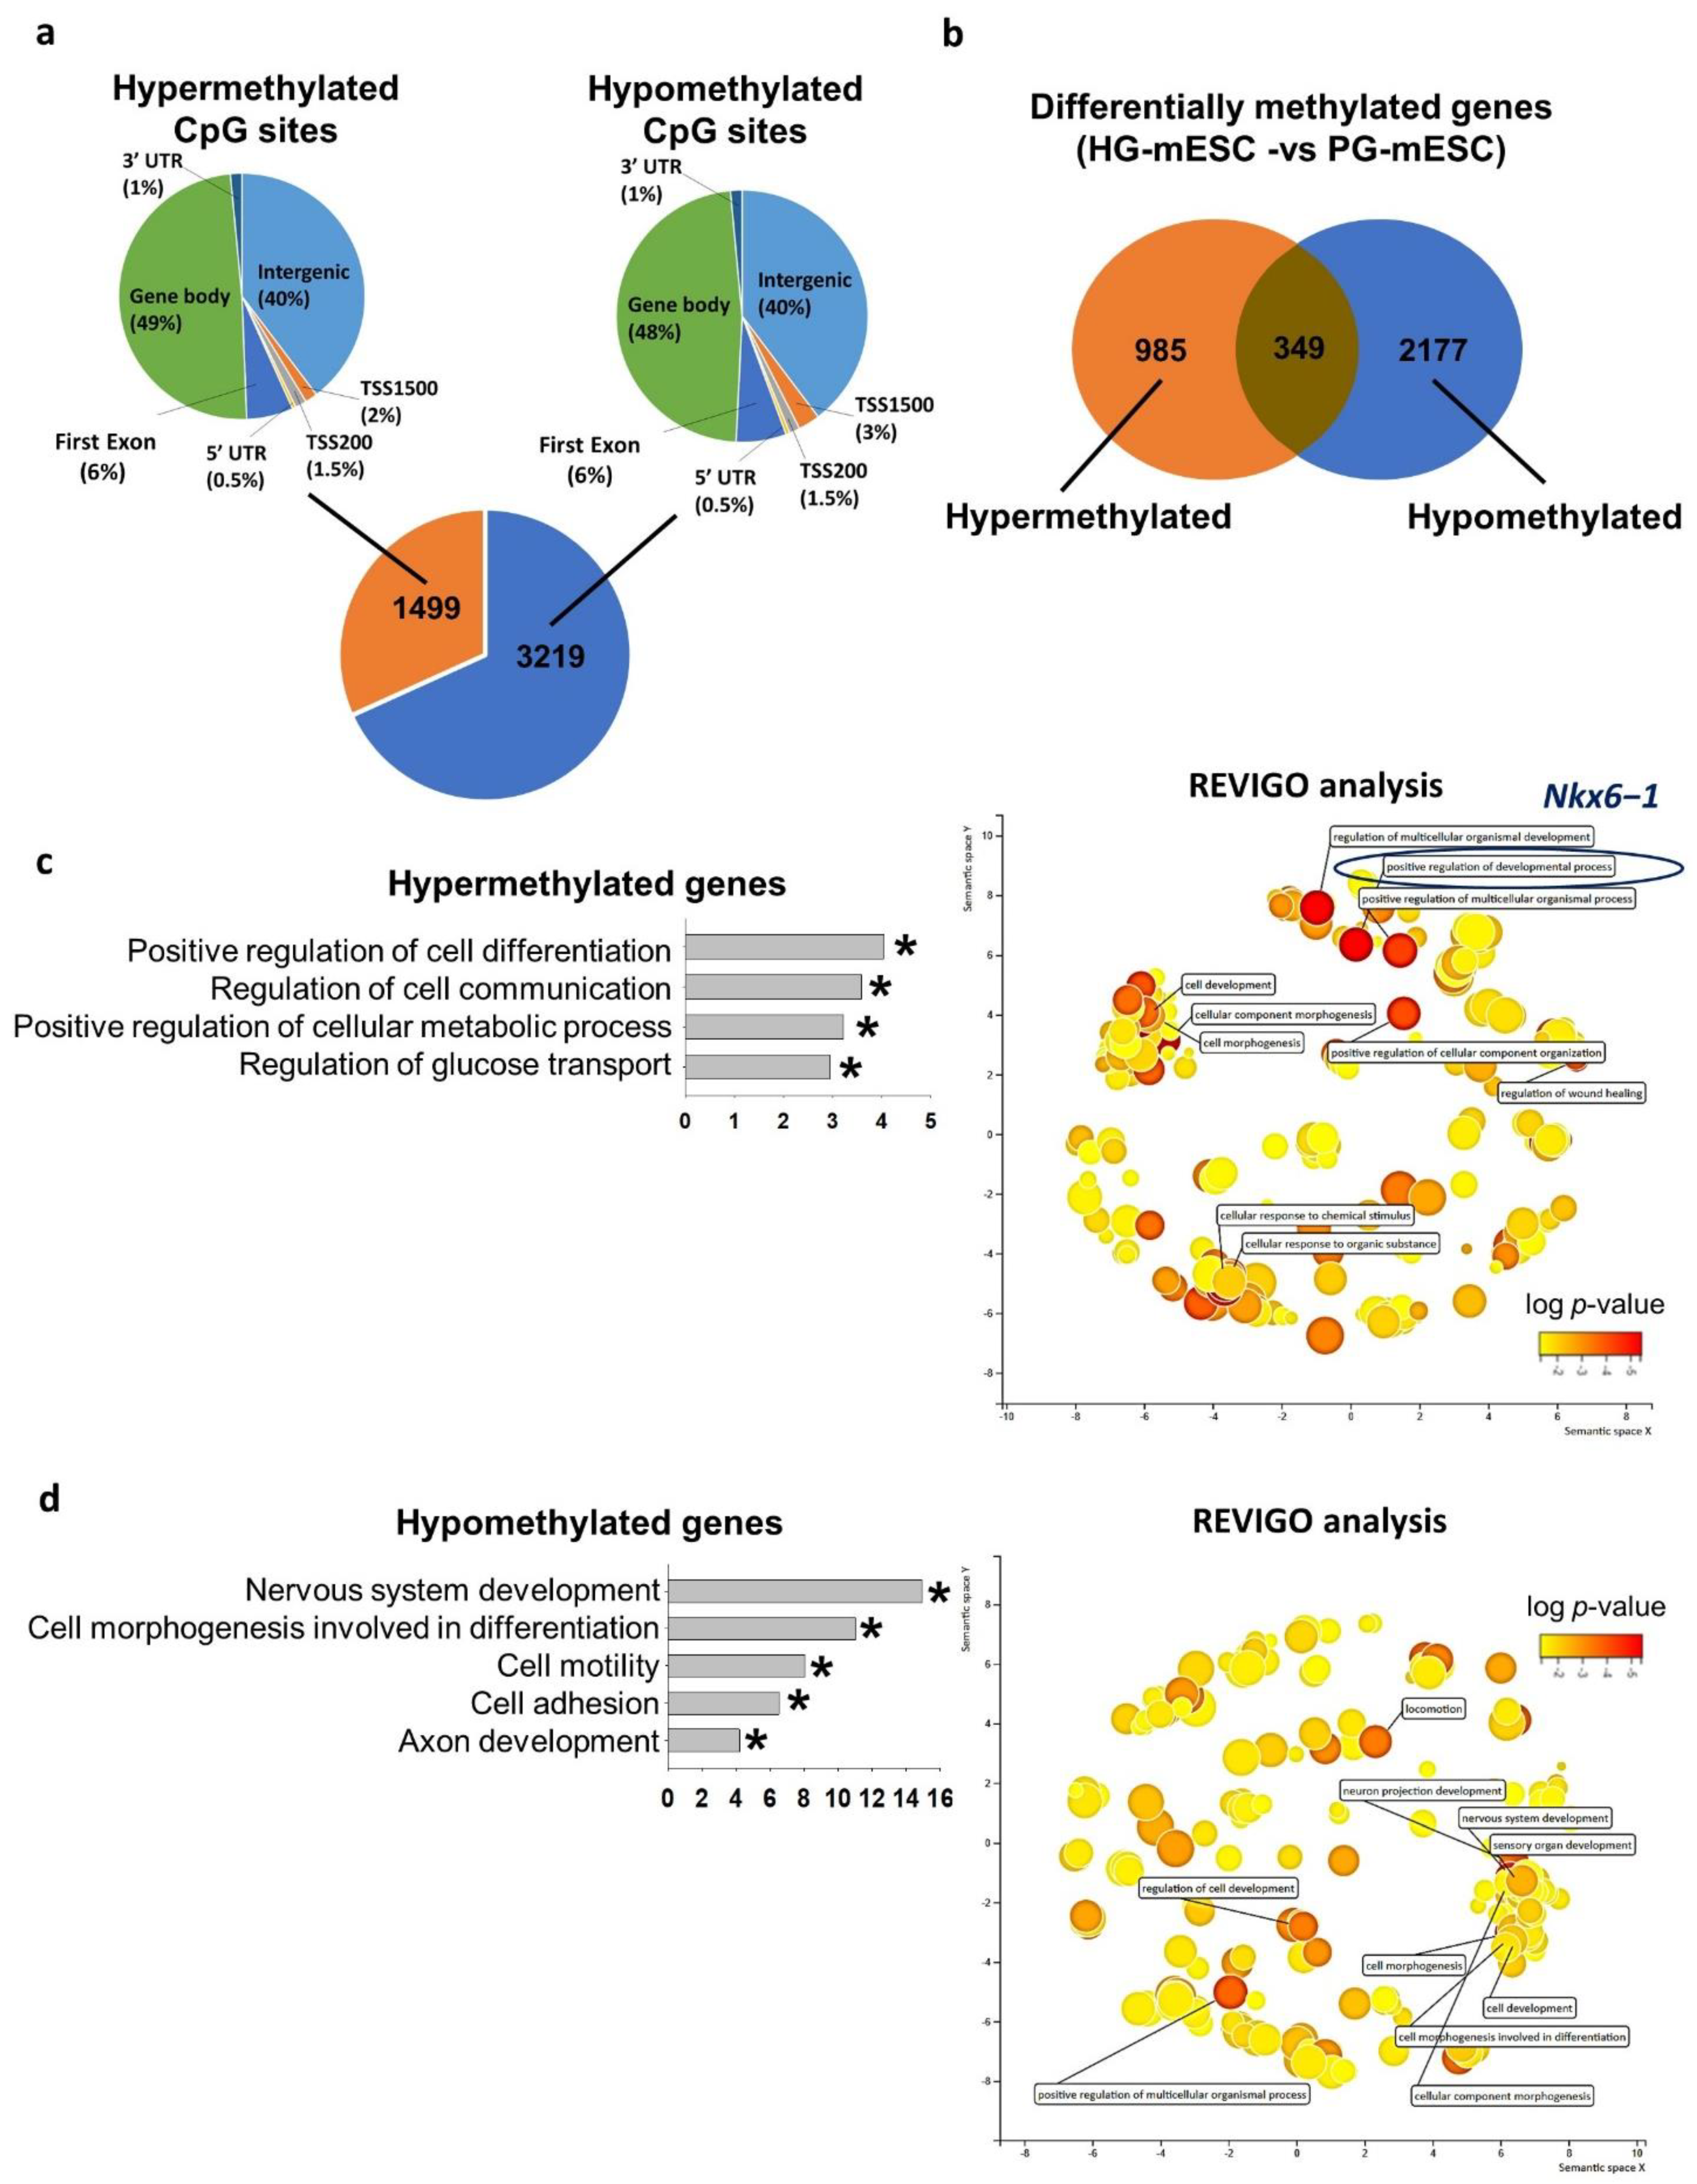
2.5. Conventional Hyperglycemic Culture Condition Dysregulated Mouse ESC DNA Methylome of Genes Related to Metabolism and Glucose Transport

The commonly used culture media for hESC and mESC contain supra-physiological glucose levels. For instance, the glucose levels in mTeSR1 (13.7 mM) [16], mouse embryonic fibroblast conditioned medium (25 mM) for hESC culture [21], and 2i/leukemia inhibitory factor (LIF) medium (25 mM) for mESC culture [22] are higher than the physiological level (around 5 mM) [23]. We therefore attempted to derive mESC line at physiological glucose level. The pluripotency of the physiological glucose (5.5 mM) derived mESC (PG-mESC) and the conventional hyperglycemic (25 mM) derived mESC (HG-mESC) were confirmed by spontaneous differentiation through embryoid body (EB) formation. RT-qPCR results showed that the differentiated PG-mESC and HG-mESC exhibited upregulation of ectoderm (Sox1) [24], mesoderm (T) [25] and endoderm (Cdx2) marker [26] expressions, and down-regulation of pluripotent markers (Oct4 and Nanog) expressions. No difference was found in the expression of Sox1, T and Cdx2 in EBs between the PG-mESC and the HG-mESC (Figure S1a). The two types of mESC expressed immunoreactivity of mesoderm (muscle actin), endoderm (Cdx2) and ectoderm (beta-3 tubulin) markers in their EBs (Figure S1b) and had similar proportion of cardiac cells with rhythmic beating in the differentiating EBs (Figure S1c). These results demonstrated that the pluripotency of mESC derived at physiological glucose level (5.5 mM) was similar to those conventionally derived with supra-physiological glucose concentrations.
We next compared the genome-wide DNA methylome status of PG-mESC and HG-mESC using reduced representation bisulfite sequencing (RRBS). When compared to PG-mESC, ~70% of the CpG sites were hypomethylated (3219) and ~30% of the sites were hypermethylated (1499) in the HG-mESC. Similar to hESC, the distribution of CpG sites in different genomic regions were similar between hypermethylated and hypomethylated CpG sties (Figure 5a). Concordantly, the number of hypomethylated genes (2177) were higher than that of hypermethylated (985) in the HG-mESC (Figure 5b). We subjected the differentially methylated genes to gene ontology analysis. The hypermethylated genes were enriched for cell differentiation, cell communication, regulation of metabolism and glucose transport (Table 2). REVIGO analysis indicated that the top biological terms clustered were regulation of developmental process and cellular response to organic substance. More importantly, Nkx6−1, the paralog of Nkx6−2 was also found to be hypermethylated in the HG-mESC related to positive regulation of differentiation process (Figure 5c and Table 2). On the other hand, the hypomethylated genes were enriched in nervous system development, cell morphogenesis, cell motility, cell adhesion and axon development (Table 2). REVIGO analysis showed enrichment of terms including nervous system development, cell morphogenesis and locomotion (Figure 5d and Table 2).
We next compared the human and mouse methylome datasets. Interestingly, both datasets had high similarity in the gene ontology terms enriched. For instance, positive regulation of cell differentiation, metabolism and cell communication were commonly hypermethylated. Nervous system development, cell motility and cell adhesion were commonly hypomethylated (Table S1 and Table 2).

3. Discussion

In our previous study, we demonstrated that hyperglycemia during early pancreatic differentiation of hESC disrupted the histone methylation of key pancreatic markers, leading to the impairment of pancreatic progenitor differentiation [16]. In this study, hESC with prior exposure to hyperglycemic conditions also exhibited disrupted pancreatic differentiation even when differentiation was induced at a conventional glucose level. The results revealed a critical concept that transient high glucose exposure in embryos was sufficient for epigenetic dysregulation, thus pre-disposing to defects in subsequent pancreatic differentiation and development.
Hyperglycemic treatment of mouse zygotes at glucose level (28 mM) found in diabetes significantly reduced the number of live pups [27]. However, the windows of exposure causing the detrimental effects to development remains to be elucidated. Early pre-implantation embryos are vulnerable to external stimuli and are genetically [28] and epigenetically [29] unstable. In vitro fertilization was reported to increase the change of genomic imprinting defects such as Beckwith–Weidemann syndrome (BWS) through altered DNA methylation [29]. We previously demonstrated that hyperglycemia altered histone bivalency in the differentiating cells during DE formation [16]. The present data suggested that such a change in histone bivalency was absent in hyperglycemic-treated undifferentiated hESC. However, DNA methylome was dysregulated in hESC under hyperglycemic culture conditions and linked to the impaired pancreatic differentiation. The discrepancy could be due to the fact that most of the lineage-specific genes were already bivalently marked at an undifferentiated state. The repressive H3K27me3 marks were only removed from the pancreatic gene promoters during the differentiation process and, therefore, affected by hyperglycemia treatment in our previous study [30]. On the other hand, DNA methylation status varied from unmethylated to fully methylated states in hESC [31]. Whether hypeglycemia interrupted the interplay between DNA methylation and histone bivalency during early developmental process requires further study.
Gene ontology analysis identified hypermethylation of genes related to cell fate commitment and regulation of insulin secretion in the hyperglycemia-treated VAL3. Coincidently, the expression of NKX6−2 was also significantly reduced upon differentiation in such condition. Nkx6−2 can partially compensate for Nkx6−1 function in the formation of mouse pancreatic α cells [32] important for glucose homeostasis. Upon stimuli such as tissue injury or diseased state, the α cells can be transdifferentiated as a new source of pancreatic β cells [33,34]. It was thus postulated that the silencing of NKX6−2 might result in pancreas malfunction [32]. The persistent maintenance of NKX6−2 hypermethylation status from undifferentiated VAL3 to differentiated pancreatic progenitor cells suggests that early dysregulated DNA methylation may be maintained during development, possibly linking to future T2D development.
Comparisons of DNA methylome between normal and T2D islets [7,20] provide valuable information on the pathogenesis of the disease. In an attempt to identify epigenetic regulators linking to the etiology of T2D, we cross-compared our DNA methylome data with the published datasets. Interestingly, the DNA methylome of T2D pancreatic islets were mainly hypomethylated which contributed to 96–97% of the differentially methylated CpG sites [7,8]. However, the proportion of hypermethylated and hypomethylated genes were similar in another study [20], which was in line with our methylome data utilizing hESC. One reason for the discrepancy might be attributed to the fact that T2D islets were already in a diseased state with extensive epigenetic dysregulation, while hESC were in an early and non-differentiated state. Another reason could be the differences in sequencing depth, as whole genome bisulfite sequencing (WGBS) assayed 50 times more CpG sites than DNA methylation arrays. It would be worthwhile to opt for WGBS in the future to identify more potential candidate genes affected by hyperglycemia during development.
We identified only 1 hypermethylated (CACNA1H) and 1 hypomethylated (S100A2) gene shared in the three studied datasets. CACNA1H encodes the voltage-dependent T-type calcium channel alpha-1H subunit. The mutation of CACNA1H increases aldosterone production and is heavily associated with primary aldosteronism [35,36]. Since primary aldosteronism is one of the reported complications of T2D patients with resistant hypertension [37], we speculate the changes in methylation of CACNA1H in pancreatic cells is the outcome of T2D. Overexpression of S100A2 promotes glycolysis and proliferation of colorectal cancer cells [38]. Its function is mainly reported in epithelial cells such as keratinocytes [39] and melanoma cells [40], but its role in pancreatic differentiation is not known. In comparison with individual datasets, 2 hypomethylated genes (HDAC4 and KCNQ1) were commonly found in the hyperglycemia-treated VAL3 and the Dayeh’s study. Both genes have been associated with T2D. HDAC4 mutation induces pancreatic β-cell loss and decrease in insulin secretion, leading to diabetic phenotype in mice [41]. KCNQ mutation is positively correlated with T2D susceptibility [42] via an unknown mechanism. Since DNA hypomethylation is usually correlated with an increase in gene expression [43], the hypomethylated states of the two genes in both datasets might suggest their roles in disease etiology. The low number of common genes identified in our methylomes and the patients’ islets suggested that hyperglycemia-induced hypermethylation in undifferentiated hESC might not be maintained in terminally differentiated T2D islets. The roles of hyperglycemia-induced methylation changes during the differentiation of pancreatic progenitor and their association with the onset on T2D later in life warrant future study.
The conventional human and mouse ESC culture conditions involved the utilization of culture medium in supra-physiological glucose levels. Several studies attempted to compare the effects of physiological and hyperglyecmia conditions on ESC maintenance and differentiation potency. For instance, one study reported hyperglycemic culture conditions (25 mM and 55 mM) induced reactive oxygen species (ROS), leading to reduced proliferation of mESC when compared to physiological conditions (1.1 and 5.5 mM) [44]. Another study also demonstrated mESC had reduced cardiac differentiation potency in hyperglyecmic condition (25 mM) relative to those in physiological level (5 mM) [45]. However, since the ESC used in these studies were derived and cultured in conventional high glucose condition (25 mM) for long periods of time, the epigenome including the DNA methylome might have already been modified when the ESC was adapted to culture in such conditions. In view of that, an earlier study derived mESC at physiological and conventional high glucose conditions. It was found that mESC derived in physiological glucose levels expressed glucose transporter Glut2 similar to that in pre- and early post-implantation mouse embryos, and the expression was higher than those derived in high glucose [46]. Since Glut2 is one of the glucose transporters expressed during early embryo stage, they suggested that mESC derived in physiological glucose levels had similar metabolic mechanism as pre-implantation embryos. However, they did not characterize both mESC extensively.
In this study, we also derived PG-mESC and HG-mESC from mouse blastocysts at physiological (5.5 mM) and conventional (25 mM) glucose levels, respectively. This is the first study to extensively characterize these mESC. To our surprise, the two mESC lines showed distinct DNA methylation patterns; HG-mESC had 1499 differentially hypermethylated and 3219 hypomethylated CpG sites when compared to PG-mESC. Importantly, gene ontology analyses revealed that genes related to cellular differentiation and glucose transport were hypermethylated in the HG-mESC. Among the enriched terms, cellular differentiation was both hypermethylated in our human and mouse datasets. In fact, an important pancreatic transcription factor Nkx6−1 was found to be hypermethylated in the HG-mESC. As mentioned above, Nkx6−1 works together with its paralog Nkx6−2 during pancreas organogenesis. Nkx6−1 depleted mouse embryos exhibited a remarkable reduction in the number of insulin-expressing cells [47]. The hypermethylation of Nkx6−1 in HG-mESC further supported the epigenetic impairment imposed by hyperglycemia in the human model. We found only a small proportion of overlapping genes (5%) between our hyperglycemia-treated VAL3 and HG-mESC data, possibly because the metabolic pathways and expressions of glucose transporters were different between hESC and mESC.
Due to ethical issues, the study on the effects of maternal hyperglycemia on the epigenetic alteration in peri-implantation embryos is very difficult. Although hESC is a valuable experimental model for studying early pancreatic development in the current study, it suffered from some limitations. First, hESCs were derived and maintained in glucose levels higher than that of physiological levels. Human ESC derivation from human embryos in a normal physiological range of glucose might be a future approach to confirm the current findings in humans. Second, the pancreatic progenitors differentiated from hESC only represent very early progenitor cells. Whether the detrimental effects of early hyperglycemia exposure affect the pancreatic function, including the production of insulin producing cells, is lacking in the current study model. From this study, several pathways were identified in both hESC and mESC that were hypermethylated in hyperglyecmia conditions. Those pathways included cell fate commitment, cell communication and glucose transport. Further studies are required to uncover the candidate genes involved in those pathways and investigate the causal relationship between hypermethylation and T2D development. Several studies have reported the gene-specific DNA methylation or de-methylation through CRISPR/Cas9 approach [48,49]. The functional roles of the candidate genes on pancreatic differentiation can also be investigated by gene knockout approach in hESC or mESC. The roles of maternal hyperglycemia conditions leading to later development of T2D can also be explored in vivo by establishing chimeric mouse models using PG-mESC and HG-mESC, where differentiated mESC can be traced and isolated from the pancreatic islets for further molecular and functional analysis.
In conclusion, this study demonstrated that hyperglycemia extensively dysregulated the DNA methylomes of hESC and mESC. The hypermethylated genes were enriched for the processes of pancreas differentiation, insulin secretion and glucose transport. More importantly, we demonstrated that NKX6−2, an important pancreatic progenitor marker, to be persistently hypermethylated even after differentiation. Our methylome pattern at the early undifferentiated stage may provide insights into how the dysregulated epigenome at early development may lead to the outcome of T2D development in the future.

4. Materials and Methods

4.1. Human Embryonic Stem Cells (ESC) Culture and Hyperglycemic Conditions

Human ESC line, VAL3 [17] was obtained from the Centro de Investigación Príncipe Felipe (CIPF) in Valencia, Spain. VAL3 was cultured in mTeSR1 medium (Stemcell Technologies, Vancouver, VC, Canada) as described [16]. The glucose level of mTeSR1 medium was 13.7 mM. For hyperglycemic conditions, D-glucose (Sigma-Aldrich, Burlington, MA, USA) was supplemented into the mTeSR1 medium to levels of 25 mM and 50 mM.

4.2. Differentiation of hESC into Definitive Endoderm and Pancreatic Progenitor Cells

VAL3 was differentiated into DE cells using the STEMdiff Definitive Endoderm Kit (Stemcell Technologies) according to manufacturer’s instructions with slight modifications. Briefly, VAL3 was seeded at 2.1 × 10⁵ cells/cm2 on Matrigel-coated plate in mTeSR1 medium supplemented with 10 µM Y-27632 (Stemcell Technologies). The medium was replaced with the differentiation medium on the next day. Medium was changed daily for 5 days. VAL3 was then further differentiated into pancreatic progenitor cells according to our published protocol [16].

4.3. Bisulfite Sequencing

Bisulfite sequencing was conducted as described [50]. Briefly, extracted DNA samples were bisulfite converted using the Epitect Bisulfite Kit Protocol (Qiagen, Düsseldorf, Germany). The sequencing service was provided by Tech Dragon Ltd., Hong Kong. The PCR primers were listed as follows: NKX6−2 forward: GGTTTGGAAAAGTTATTTG; NKX6−2 reverse: AAACTACACCTCAATAAAACC.

4.4. Derivation of Mouse Embryonic Stem Cell (mESC) Lines

Mouse ESC lines were derived from blastocysts of ICR mice. Female ICR mice at 6–8 weeks old were super-ovulated by injection with 5 IU of pregnant mare serum gonadotropin (PMSG) and 5 IU of human chorionic gonadotropin (hCG; Sigma-Aldrich) at 48 h interval. Pregnant mice were selected after successful mating. The blastocysts were flushed from the uterus on 3.5 dpc using M2 medium (Sigma-Aldrich). The zona pellucida of the blastocysts were removed with acid tyrode solution (Sigma-Aldrich). The zona-free blastocysts were then placed in mouse embryonic fibroblast (MEF) feeder cells previously inactivated by mitomycin-c treatment. The culture medium was 2i/LIF medium consisted of DMEM low glucose (5.5 mM, Thermo Fisher Scientific, Waltham, MA, USA) supplemented with 3 µM CHIR99021 (R&D Systems, Minneapolis, MN, USA), 1 µM PD0325901 (R&D Systems), 1000 units/mL leukemia inhibitory factor (LIF), 15% Knockout serum replacement, 1 × penicillin and streptomycin, 1 × L-glutamine, 1 × non-essential amino acids, 1 × B27 supplement, 1 × N2 supplement (all from Thermo Fisher Scientific), 1 mM sodium pyruvate (Sigma-Aldrich) and 0.1 mM β-mercaptoethanol (Sigma-Aldrich). The culture was maintained until outgrowths were observed 6–8 days after seeding. The animal experiments were performed in accordance with the Committee on the Use of Live Animals in Teaching and Research, The University of Hong Kong (CULATR, HKU). The established cell line was cultured in 2i/LIF medium as described [16]. For hyperglycemic conditions, DMEM high glucose (25 mM, Thermo Fisher Scientific) in 2i/LIF medium was used for the cell culture.

4.5. Embryoid Body (EB) Formation from mESC

mESC was differentiated into embryoid bodies (EBs) using our modified hanging drop method [51]. PG- and HG-mESC were seeded at a density of 500 cells/20 µL drop on the lid of the Petri dish. After 2 days aggregation in the inverted lid, the EBs were transferred to 96-well ultra-low attachment plates (Corning, New York, NY, USA) in EB medium (DMEM high glucose supplemented with 15% FBS, 1 × penicillin and streptomycin, 1 × non-essential amino acids and 0.1 mM β-mercaptoethanol). After 3 days, the EBs were transferred to 48-well plates pre-coated with 0.1% gelatin for attachment and continued culture.

4.6. Genome-Wide Methylation Analysis

Genome-wide methylation analysis was conducted on VAL3 using the Infinium HumanMethylation450 BeadChip array for detecting human methylome (Illumina, San, Diego, CA, USA). Briefly, 750 ng of genomic DNA was hybridized to the BeadChips, followed by single base extension and staining of BeadChips. The data were then analyzed by GenomeStudio (Illumina). A differential score of >13 or <−13 was considered as significantly hypermethylated or hypomethylated, respectively. The genome-wide methylation analysis was conducted on mESC using reduced representation bisulfite sequencing (RRBS). Briefly, 2.5 µg of genomic DNA was digested overnight with restriction enzyme MspI (New England Biolabs, Ipswich, MA, USA). The digested DNA samples were used to construct libraries, followed by bisulfite conversion with the EZ DNA Methylation-Lightning Kit (Zymo Research, Irvine, CA, USA). The Illumina HiSeq SBS Kit v4 (Illumina) was used for paired-end 101 bp sequencing. Sequence reads were trimmed by the Trim Galore, followed by alignment to the mouse genome mm10 by Bismark, and annotation of methylation sites by HOMER. The differentially methylation analysis was conducted using methylKit [52]. A methylation difference of >25% with p-value of <0.05 was considered statistically significant. The sequencing and data analysis services were provided by the Centre for PanorOmic Sciences, the University of Hong Kong. The downstream gene ontology analysis for both hyperglycemia-treated VAL3 and HG-mESC were performed by the Database for Annotation, Visualization and Integrated Discovery (DAVID) platform (version 6.8, National Institutes of Health (NIH), Bethesda, MD, USA). In addition, REduce and Visualize Gene Ontology (REVIGO, Rudjer Boskovic Institute, Zagreb, Croatia) was used for condensation and clustering of gene ontology terms [18].

4.7. Quantitative Polymerase Chain Reaction (qPCR)

Total RNAs were extracted by the mirVana Protein and RNA Isolation System (PARIS) Kit (Thermo Fisher Scientific) and cDNA conversion was performed by the TaqMan Reverse Transcription kit (Thermo Fisher Scientific). Real time qPCR using the TaqMan Gene Expression Assay was performed in an Applied Biosystems 7500 Real-Time PCR System (Thermo Fisher Scientific). Quantification of gene expression levels were determined by the 2−ΔΔCt method. The following probes were used: OCT4 (assay ID: Hs04260367_gH, Mm03053917_g1), NANOG (assay ID: Hs02387400_g1, Mm02019550_s1), SOX2 (Hs01053049_s1), SOX17 (Hs00751752_s1, Mm00488363_m1), FOXA2 (Hs05036278_s1), CXCR4 (Hs00607978_s1), EOMES (Hs00172872_m1), PDX1 (Hs00236830_m1), NKX6−2 (Hs00752986_s1), Sox1 (Mm00486299_s1), T (Mm00436877_m1).

4.8. Chromatin Immunoprecipitation (ChIP)

Chromatin immunoprecipitation (ChIP) was performed as previously described [16]. The primers used were as follows: SOX17 forward: GAATGGACGCTCGGTATGTT, SOX17 reverse: GAGACTCGAAAAGCCGTCTG, FOXA2 forward: GAGCCTCCACATCCAAACAC, FOXA2 reverse: CAGCAGCTCTTGGGTTCAA, CXCR4 forward: TCCACTTTAGCAAGGATGGAC, CXCR4 reverse: TCCCAGAGGCATTTCCTAAG. The antibodies used were mouse anti-H3K27me3 (ab6002, Abcam, Cambridge, UK), rabbit anti-H3K4me3 (ab8580, Abcam), normal mouse IgG (sc2025, Santa Cruz) and normal rabbit IgG (12370, Millipore, Burlington, MA, USA).

4.9. Immunofluorescent Staining

Cells were fixed in 4% PFA and permeabilized with 0.1% Triton X-100 (Sigma-Aldrich). The antibodies against muscle actin (M0635, Agilent, Santa Clara, CA, USA), beta-3 tubulin (MA1-118, Thermo Fisher Scientific), CDX2 (12306, Cell Signaling Technology, Danvers, MA, USA), goat anti-mouse IgG, Alexa Fluor 568 (H + L) (A-11019, Thermo Fisher Scientific), goat anti-rabbit IgG, Alexa Fluor 568 (H + L) (A-11036, Thermo Fisher Scientific) were used. The nuclei were stained with Hoechst 33,258 (Thermo Fisher Scientific). Images of the stained cells were captured by using a confocal microscope (LSM 700, Carl Zeiss AG, Oberkochen, Germany) at the Centre for PanorOmic Sciences, the University of Hong Kong.

4.10. Statistical Analysis

Statistical analysis was conducted using the SigmaPlot 12.0 software (Systat Software, San Jose, CA, USA). The statistical tests used included t-test, one-way ANOVA followed by Student–Newman–Keuls, Mann–Whitney Rank Sum test or Chi-square test where appropriate. The data in the plots were represented as the mean ± standard error of mean (SEM). A p-value < 0.05 was considered statistically significant.

Supplementary Materials

The following are available online at https://www.mdpi.com/article/10.3390/ijms221910729/s1.

Author Contributions

Conceptualization, A.C.H.C., W.S.B.Y. and Y.L.L.; methodology, A.C.H.C., W.H., S.W.F., C.C. and K.C.L.; investigation, A.C.H.C., W.H., S.W.F., C.C. and K.C.L.; writing—original draft preparation, A.C.H.C. and Y.L.L.; writing—review and editing, W.S.B.Y. and Y.L.L.; supervision, W.S.B.Y. and Y.L.L. All authors have read and agreed to the published version of the manuscript.

Funding

This research was funded by Sanming Project of Medicine in Shenzhen, China (No. SZSM201612083) and HKU-SZH Fund for Shenzhen Key Medical Discipline (No. SZXK2020089).

Institutional Review Board Statement

The study was conducted according to the guidelines and approved by the Committee on the Use of Live Animals in Teaching and Research of The University of Hong Kong (CULATR, protocol code 3503-14 and date of approval: 14 January 2015).

Informed Consent Statement

Not applicable.

Data Availability Statement

All data are contained within this manuscript.

Conflicts of Interest

The authors declare no conflict of interest.

References

  1. Saeedi, P.; Petersohn, I.; Salpea, P.; Malanda, B.; Karuranga, S.; Unwin, N.; Colagiuri, S.; Guariguata, L.; Motala, A.A.; Ogurtsova, K.; et al. Global and regional diabetes prevalence estimates for 2019 and projections for 2030 and 2045: Results from the International Diabetes Federation Diabetes Atlas, 9th edition. Diabetes Res. Clin. Pract. 2019, 157, 107843. [Google Scholar] [CrossRef] [PubMed] [Green Version]
  2. Barker, D.J.; Osmond, C. Infant mortality, childhood nutrition, and ischaemic heart disease in England and Wales. Lancet 1986, 327, 1077–1081. [Google Scholar] [CrossRef]
  3. Barker, D.J.; Winter, P.D.; Osmond, C.; Margetts, B.; Simmonds, S.J. Weight in infancy and death from ischaemic heart disease. Lancet 1989, 334, 577–580. [Google Scholar] [CrossRef]
  4. Franks, P.W.; Looker, H.C.; Kobes, S.; Touger, L.; Tataranni, P.A.; Hanson, R.; Knowler, W.C. Gestational glucose tolerance and risk of type 2 diabetes in young pima indian offspring. Diabetes 2006, 55, 460–465. [Google Scholar] [CrossRef] [PubMed] [Green Version]
  5. Dabelea, D. The predisposition to obesity and diabetes in offspring of diabetic mothers. Diabetes Care 2007, 30, S169–S174. [Google Scholar] [CrossRef] [Green Version]
  6. Marco, L.J.; McCloskey, K.; Vuillermin, P.J.; Burgner, D.; Said, J.; Ponsonby, A.-L. Cardiovascular disease risk in the offspring of diabetic women: The impact of the intrauterine environment. Exp. Diabetes Res. 2012, 2012, 1–10. [Google Scholar] [CrossRef]
  7. Dayeh, T.; Volkov, P.; Salö, S.; Hall, E.; Nilsson, E.; Olsson, A.H.; Kirkpatrick, C.; Wollheim, C.B.; Eliasson, L.; Rönn, T.; et al. Genome-wide DNA methylation analysis of human pancreatic islets from type 2 diabetic and non-diabetic donors identifies candidate genes that influence insulin secretion. PLoS Genet. 2014, 10, e1004160. [Google Scholar] [CrossRef]
  8. Volkmar, M.; Dedeurwaerder, S.; Da Cunha, D.A.; Ndlovu, M.N.; Defrance, M.; Deplus, R.; Calonne, E.; Volkmar, U.; Igoillo-Esteve, M.; Naamane, N.; et al. DNA methylation profiling identifies epigenetic dysregulation in pancreatic islets from type 2 diabetic patients. EMBO J. 2012, 31, 1405–1426. [Google Scholar] [CrossRef] [Green Version]
  9. Park, J.H.; Stoffers, D.A.; Nicholls, R.D.; Simmons, R.A. Development of type 2 diabetes following intrauterine growth retardation in rats is associated with progressive epigenetic silencing of Pdx1. J. Clin. Investig. 2008, 118, 2316–2324. [Google Scholar] [CrossRef] [PubMed] [Green Version]
  10. Ding, G.L.; Wang, F.-F.; Shu, J.; Tian, S.; Jiang, Y.; Zhang, D.; Wang, N.; Luo, Q.; Zhang, Y.; Jin, F.; et al. Transgenerational glucose intolerance with Igf2/H19 epigenetic alterations in mouse islet induced by intrauterine hyperglycemia. Diabetes 2012, 61, 1133–1142. [Google Scholar] [CrossRef] [PubMed] [Green Version]
  11. Fraser, R.B.; Waite, S.L.; Wood, K.A.; Martin, K.L. Impact of hyperglycemia on early embryo development and embryopathy: In vitro experiments using a mouse model. Hum. Reprod. 2007, 22, 3059–3068. [Google Scholar] [CrossRef] [PubMed] [Green Version]
  12. Scott-Drechsel, D.E.; Rugonyi, S.; Marks, D.L.; Thornburg, K.L.; Hinds, M.T. Hyperglycemia slows embryonic growth and suppresses cell cycle via cyclin D1 and p21. Diabetes 2013, 62, 234–242. [Google Scholar] [CrossRef] [PubMed] [Green Version]
  13. Guo, H.; Zhu, P.; Yan, L.; Li, R.; Hu, B.; Lian, Y.; Yan, J.; Ren, X.; Lin, S.; Li, J.; et al. The DNA methylation landscape of human early embryos. Nature 2014, 511, 606–610. [Google Scholar] [CrossRef] [PubMed]
  14. Palanza, P.; Gioiosa, L.; Saal, F.S.V.; Parmigiani, S. Effects of developmental exposure to bisphenol A on brain and behavior in mice. Environ. Res. 2008, 108, 150–157. [Google Scholar] [CrossRef]
  15. Kaminen-Ahola, N.; Ahola, A.; Maga, M.; Mallitt, K.-A.; Fahey, P.; Cox, T.C.; Whitelaw, E.; Chong, S. Maternal ethanol consumption alters the epigenotype and the phenotype of offspring in a mouse model. PLoS Genet. 2010, 6, e1000811. [Google Scholar] [CrossRef] [Green Version]
  16. Chen, A.C.H.; Lee, Y.L.; Fong, S.W.; Wong, C.C.Y.; Ng, E.; Yeung, S.B.W. Hyperglycemia impedes definitive endoderm differentiation of human embryonic stem cells by modulating histone methylation patterns. Cell Tissue Res. 2017, 368, 563–578. [Google Scholar] [CrossRef]
  17. Valbuena, D.; Galán, A.; Sánchez, E.; Poo, M.E.; Gómez, E.; Sánchez-Luengo, S.; Melguizo, D.; García, A.; Ruiz, V.; Moreno, R.; et al. Derivation and characterization of three new Spanish human embryonic stem cell lines (VAL −3 −4 −5) on human feeder and in serum-free conditions. Reprod. Biomed. Online 2006, 13, 875–886. [Google Scholar] [CrossRef]
  18. Supek, F.; Bošnjak, M.; Škunca, N.; Smuc, T. REVIGO summarizes and visualizes long lists of gene ontology terms. PLoS ONE 2011, 6, e21800. [Google Scholar] [CrossRef] [Green Version]
  19. Nelson, S.B.; Schaffer, A.; Sander, M. The transcription factors Nkx6.1 and Nkx6.2 possess equivalent activities in promoting beta-cell fate specification in Pdx1+ pancreatic progenitor cells. Development 2007, 134, 2491–2500. [Google Scholar] [CrossRef] [Green Version]
  20. Volkov, P.; Bacos, K.; Ofori, J.K.; Esguerra, J.L.S.; Eliasson, L.; Rönn, T.; Ling, C. Whole-genome bisulfite sequencing of human pancreatic islets reveals novel differentially methylated regions in type 2 diabetes pathogenesis. Diabetes 2017, 66, 1074–1085. [Google Scholar] [CrossRef] [PubMed] [Green Version]
  21. Braam, S.R.; Denning, C.; Matsa, E.; E Young, L.; Passier, R.; Mummery, C.L. Feeder-free culture of human embryonic stem cells in conditioned medium for efficient genetic modification. Nat. Protoc. 2008, 3, 1435–1443. [Google Scholar] [CrossRef]
  22. Marks, H.; Kalkan, T.; Menafra, R.; Denissov, S.; Jones, K.; Hofemeister, H.; Nichols, J.; Kranz, A.; Stewart, A.F.; Smith, A.; et al. The transcriptional and epigenomic foundations of ground state pluripotency. Cell 2012, 149, 590–604. [Google Scholar] [CrossRef] [PubMed] [Green Version]
  23. Güemes, M.; A Rahman, S.; Hussain, K. What is a normal blood glucose? Arch. Dis. Child. 2015, 101, 569–574. [Google Scholar] [CrossRef] [PubMed]
  24. Pevny, L.H.; Sockanathan, S.; Placzek, M.; Lovell-Badge, R. A role for SOX1 in neural determination. Development 1998, 125, 1967–1978. [Google Scholar] [CrossRef]
  25. Wilson, V.; Manson, L.; Skarnes, W.C.; Beddington, R.S. The T gene is necessary for normal mesodermal morphogenetic cell movements during gastrulation. Development 1995, 121, 877–886. [Google Scholar] [CrossRef]
  26. Stringer, E.J.; Duluc, I.; Saandi, T.; Davidson, I.; Bialecka, M.; Sato, T.; Barker, N.; Clevers, H.; Pritchard, C.; Winton, D.J.; et al. Cdx2 determines the fate of postnatal intestinal endoderm. Development 2012, 139, 465–474. [Google Scholar] [CrossRef] [Green Version]
  27. Bermejo-Alvarez, P.; Roberts, R.; Rosenfeld, C. Effect of glucose concentration during in vitro culture of mouse embryos on development to blastocyst, success of embryo transfer, and litter sex ratio. Mol. Reprod. Dev. 2012, 79, 329–336. [Google Scholar] [CrossRef] [Green Version]
  28. Vanneste, E.; Voet, T.; Le Caignec, C.; Ampe, M.; Konings, P.; Melotte, C.; Debrock, S.; Amyere, M.; Vikkula, M.; Schuit, F.; et al. Chromosome instability is common in human cleavage-stage embryos. Nat. Med. 2009, 15, 577–583. [Google Scholar] [CrossRef] [PubMed]
  29. DeBaun, M.R.; Niemitz, E.L.; Feinberg, A.P. Association of in vitro fertilization with beckwith-wiedemann syndrome and epigenetic alterations of LIT1 and H19. Am. J. Hum. Genet. 2003, 72, 156–160. [Google Scholar] [CrossRef] [PubMed] [Green Version]
  30. Xie, R.; Everett, L.J.; Lim, H.-W.; Patel, N.A.; Schug, J.; Kroon, E.; Kelly, O.G.; Wang, A.; D’Amour, K.A.; Robins, A.J.; et al. Dynamic chromatin remodeling mediated by polycomb proteins orchestrates pancreatic differentiation of human embryonic stem cells. Cell Stem Cell 2013, 12, 224–237. [Google Scholar] [CrossRef] [PubMed] [Green Version]
  31. Li, J.; Wu, X.; Zhou, Y.; Lee, M.; Guo, L.; Han, W.; Mo, W.; Cao, W.-M.; Sun, D.; Xie, R.; et al. Decoding the dynamic DNA methylation and hydroxymethylation landscapes in endodermal lineage intermediates during pancreatic differentiation of hESC. Nucleic Acids Res. 2018, 46, 2883–2900. [Google Scholar] [CrossRef]
  32. Henseleit, K.D.; Nelson, S.B.; Kuhlbrodt, K.; Hennings, J.C.; Ericson, J.; Sander, M. NKX6 transcription factor activity is required for α- andβ-cell development in the pancreas. Development 2005, 132, 3139–3149. [Google Scholar] [CrossRef] [Green Version]
  33. Lu, J.; Jaafer, R.; Bonnavion, R.; Bertolino, P.; Zhang, C.-X. Transdifferentiation of pancreatic α-cells into insulin-secreting cells: From experimental models to underlying mechanisms. World J. Diabetes 2014, 5, 847–853. [Google Scholar] [CrossRef]
  34. Watada, H. New role for alpha cells as a source for new beta cells. J. Diabetes Investig. 2010, 2, 43–44. [Google Scholar] [CrossRef] [Green Version]
  35. Daniil, G.; Fernandes-Rosa, F.L.; Chemin, J.; Blesneac, I.; Beltrand, J.; Polak, M.; Jeunemaitre, X.; Boulkroun, S.; Amar, L.; Strom, T.M.; et al. CACNA1H mutations are associated with different forms of primary aldosteronism. EBioMedicine 2016, 13, 225–236. [Google Scholar] [CrossRef] [Green Version]
  36. Nanba, K.; Blinder, A.R.; Rege, J.; Hattangady, N.G.; Else, T.; Liu, C.-J.; Tomlins, S.A.; Vats, P.; Kumar-Sinha, C.; Giordano, T.J.; et al. Somatic CACNA1H mutation as a cause of aldosterone-producing adenoma. Hypertension 2020, 75, 645–649. [Google Scholar] [CrossRef] [PubMed]
  37. Umpierrez, G.E.; Cantey, P.; Smiley, D.; Palacio, A.; Temponi, D.; Luster, K.; Chapman, A. Primary aldosteronism in diabetic subjects with resistant hypertension. Diabetes Care 2007, 30, 1699–1703. [Google Scholar] [CrossRef] [PubMed] [Green Version]
  38. Li, C.; Chen, Q.; Zhou, Y.; Niu, Y.; Wang, X.; Li, X.; Zheng, H.; Wei, T.; Zhao, L.; Gao, H. S100A2 promotes glycolysis and proliferation via GLUT1 regulation in colorectal cancer. FASEB J. 2020, 34, 13333–13344. [Google Scholar] [CrossRef]
  39. Pan, S.-C.; Li, C.-Y.; Kuo, C.-Y.; Kuo, Y.-Z.; Fang, W.-Y.; Huang, Y.-H.; Hsieh, T.-C.; Kao, H.-Y.; Kuo, Y.; Kang, Y.-R.; et al. The p53-S100A2 positive feedback loop negatively regulates epithelialization in cutaneous wound healing. Sci. Rep. 2018, 8, 5458. [Google Scholar] [CrossRef] [PubMed] [Green Version]
  40. Klopper, J.P.; Sharma, V.; Bissonnette, R.; Haugen, B.R. Combination PPARγand RXR agonist treatment in melanoma cells: Functional importance of S100A2. PPAR Res. 2009, 2010, 1–8. [Google Scholar] [CrossRef] [Green Version]
  41. Gong, M.; Yu, Y.; Liang, L.; Vuralli, D.; Froehler, S.; Kuehnen, P.; Du Bois, P.; Zhang, J.; Cao, A.; Liu, Y.; et al. HDAC4 mutations cause diabetes and induce β-cell FoxO1 nuclear exclusion. Mol. Genet. Genom. Med. 2019, 7, e602. [Google Scholar] [CrossRef] [PubMed] [Green Version]
  42. Yasuda, K.; Miyake, K.; Horikawa, Y.; Hara, K.; Osawa, H.; Furuta, H.; Hirota, Y.; Mori, H.; Jonsson, A.; Sato, Y.; et al. Variants in KCNQ1 are associated with susceptibility to type 2 diabetes mellitus. Nat. Genet. 2008, 40, 1092–1097. [Google Scholar] [CrossRef] [PubMed]
  43. Anastasiadi, D.; Esteve-Codina, A.; Piferrer, F. Consistent inverse correlation between DNA methylation of the first intron and gene expression across tissues and species. Epigenetics Chromatin 2018, 11, 1–17. [Google Scholar] [CrossRef] [PubMed]
  44. Descalzo, D.L.M.; Satoorian, T.S.; Walker, L.M.; Sparks, N.R.; Pulyanina, P.Y.; Nieden, N.I.Z. Glucose-induced oxidative stress reduces proliferation in embryonic stem cells via FOXO3A/β-catenin-dependent transcription of p21cip1. Stem Cell Rep. 2016, 7, 55–68. [Google Scholar] [CrossRef] [Green Version]
  45. Yang, P.; Chen, X.; Kaushal, S.; Reece, E.A.; Yang, P. High glucose suppresses embryonic stem cell differentiation into cardiomyocytes. Stem Cell Res. Ther. 2016, 7, 187. [Google Scholar] [CrossRef] [PubMed] [Green Version]
  46. Jung, J.H.; Wang, X.D.; Loeken, M.R. Mouse embryonic stem cells established in physiological-glucose media express the HighKMGlut2 glucose transporter expressed by normal embryos. Stem Cells Transl. Med. 2013, 2, 929–934. [Google Scholar] [CrossRef] [PubMed]
  47. Sander, M.; Sussel, L.; Conners, J.; Scheel, D.; Kalamaras, J.; Cruz, F.D.; Schwitzgebel, V.; Hayes-Jordan, A.; German, M. Homeobox gene Nkx6.1 lies downstream of Nkx2.2 in the major pathway of beta-cell formation in the pancreas. Development 2000, 127, 5533–5540. [Google Scholar] [CrossRef] [PubMed]
  48. Kubi, J.A.; Chen, A.C.; Fong, S.W.; Lai, K.P.; Wong, C.K.; Yeung, W.S.; Lee, K.F.; Lee, Y.L. Effects of 2,3,7,8-tetrachlorodibenzo-p-dioxin (TCDD) on the differentiation of embryonic stem cells towards pancreatic lineage and pancreatic beta cell function. Environ. Int. 2019, 130, 104885. [Google Scholar] [CrossRef] [PubMed]
  49. Kang, J.G.; Park, J.S.; Ko, J.-H.; Kim, Y.-S. Regulation of gene expression by altered promoter methylation using a CRISPR/Cas9-mediated epigenetic editing system. Sci. Rep. 2019, 9, 11960. [Google Scholar] [CrossRef] [Green Version]
  50. Liu, X.S.; Wu, H.; Ji, X.; Stelzer, Y.; Wu, X.; Czauderna, S.; Shu, J.; Dadon, D.; Young, R.A.; Jaenisch, R. Editing DNA methylation in the mammalian genome. Cell 2016, 167, 233–247.e17. [Google Scholar] [CrossRef] [Green Version]
  51. Lee, Y.L.; Peng, Q.; Fong, S.W.; Chen, A.C.H.; Lee, K.F.; Ng, E.; Nagy, A.; Yeung, W.S.B. Sirtuin 1 Facilitates generation of induced pluripotent stem cells from mouse embryonic fibroblasts through the miR-34a and p53 pathways. PLoS ONE 2012, 7, e45633. [Google Scholar] [CrossRef] [PubMed] [Green Version]
  52. Akalin, A.; Kormaksson, M.; Li, S.; E Garrett-Bakelman, F.; Figueroa, M.E.; Melnick, A.; E Mason, C. methylKit: A comprehensive R package for the analysis of genome-wide DNA methylation profiles. Genome Biol. 2012, 13, R87. [Google Scholar] [CrossRef] [PubMed] [Green Version]
Figure 1. Human embryonic stem cell (hESC) cultured in hyperglycemic conditions showed disrupted pancreatic differentiation potential. (a) The relative mRNA levels of pluripotent markers (OCT4, NANOG and SOX2) in undifferentiated VAL3 under hyperglycemic conditions (C: 13.7 mM D-glucose) (n = 4). (b) The relative mRNA levels of definitive endoderm (DE) markers (SOX17, FOXA2, CXCR4 and EOMES) in DE cells from different conditions of VAL3 (n = 4, * p < 0.05 compared to control, one-way ANOVA followed by Student–Newman–Keuls). (c) The relative mRNA levels of pancreatic progenitor (PP) markers (PDX1, NKX6−1 and NKX6−2) in PP cells from different conditions of VAL3 (n = 4, * p < 0.05 compared to control, one-way ANOVA followed by Student–Newman–Keuls). (d) The H3K27me3 binding levels on the promoters of DE markers in undifferentiated VAL3 under hyperglycemic conditions (n = 3).
Ijms 22 10729 g001
Figure 2. Hyperglycemia altered global DNA methylome in hESC. (a) Number of differentially methylated CpG sites in VAL3 under hyperglycemic condition (50 mM d-glucose; 13.7 mM basal level as control) and their genomic distribution. UTR: untranscribed region, TSS1500: 1500 bp upstream of transcription start site, TSS200: 200 bp upstream of transcription start site. (b) Number of differentially methylated genes in VAL3 under hyperglycemic condition. (c) (left) Gene ontology analysis of the hypermethylated genes. (* p < 0.05), (right) Cluster-plot of gene ontology terms processed with REVIGO analysis. Top 10 grouped gene ontology terms were shown. (d) (left) Gene ontology analysis of the hypomethylated genes. (* p < 0.05), (right) Cluster-plot of gene ontology terms processed with REVIGO analysis. Top 10 grouped gene ontology terms were shown.
Ijms 22 10729 g002
Figure 3. Hyperglycemia led to persistent hypermethylation of NKX6−2 promoter. (a) Bisulfite sequencing results showing the DNA methylation status of NKX6−2 promoter in undifferentiated VAL3 under different conditions. Black and white dots represented methylated and unmethylated CpG sites, respectively (n = 30, * p < 0.05, # p < 0.001, Chi-square test). (b) Bisulfite sequencing results showing the DNA methylation status of NKX6−2 promoter in PP cells differentiated from VAL3 cultured in different conditions (n = 30, # p < 0.001, Chi-square test).
Ijms 22 10729 g003
Figure 4. Meta-analysis with dysregulated methylome from pancreatic islets of T2D patients. Venn diagram showing the comparison of hypermethylated and hypomethylated genes between hyperglycemia-treated VAL3 and T2D pancreas from (a) Dayeh et al. [7] and (b) Volkov et al. [20].
Ijms 22 10729 g004
Figure 5. Conventional hyperglycemic culture condition dysregulated mouse ESC DNA methylome related to metabolism and glucose transport. (a) Number of differentially methylated CpG sites in mESC derived under hyperglycemic condition (HG-mESC: 25 mM), while the control was mESC derived under physiological glucose condition (PG-mESC: 5.5 mM) and their genomic distribution. UTR: untranscribed region, TSS1500: 1500 bp upstream of transcription start site, TSS200: 200 bp upstream of transcription start site. (b) Number of differentially methylated genes in HG-mESC. (c) (left) Gene ontology analysis of the hypermethylated genes. (* p < 0.05), (right) Cluster-plot of gene ontology terms processed with REVIGO analysis. Top 10 grouped gene ontology terms were shown. (d) (left) Gene ontology analysis of the hypomethylated genes. (* p < 0.05), (right) Cluster-plot of gene ontology terms processed with REVIGO analysis. Top 10 grouped gene ontology terms were shown.
Ijms 22 10729 g005
Table 1. Gene ontology and REVIGO terms of differentially methylated genes in hESC cultured in hyperglycemic (50 mM) condition compared to basal glucose (13.7 mM) condition.
Hypermethylated Genes
TermGene
Count
p-Value
GO termsGO:0010646-egulation of cell communication1361.49 × 10−5
GO:0000003-reproduction723.60442 × 10−5
GO:0009893-positive regulation of metabolic process1346.12 × 10−5
GO:0045165-cell fate commitment211.10 × 10−4
GO:0050796-regulation of insulin secretion150.001501577
REVIGOGO:0023051-regulation of signaling1390.006234194
GO:0009966-regulation of signal transduction1260.006947825
GO:0035556-intracellular signal transduction1230.007549951
GO:0010646-regulation of cell communication1360.008015438
GO:0000003-reproduction720.011758664
GO:0010604-positive regulation of macromolecule metabolic process1280.012049471
GO:0009893-positive regulation of metabolic process1340.014799489
GO:0022610-biological adhesion840.014802392
GO:0045165-cell fate commitment210.019097456
GO:1902531-regulation of intracellular signal transduction830.019839541
Hypomethylated genes
TermGene
Count
p-Value
GO termsGO:0007399-nervous system development1214.14929 × 10−5
GO:0000904-cell morphogenesis involved in differentiation534.89 × 10−5
GO:0061564-axon development367.21 × 10−5
GO:0006928-movement of cell or subcellular component985.51 × 10−4
GO:0007155-cell adhesion910.001670345
REVIGOGO:0048812-neuron projection morphogenesis1390.004559117
GO:0000902-cell morphogenesis1260.01148067
GO:0007399-nervous system development1230.012500011
GO:0030030-cell projection organization1360.014020097
GO:0032989-cellular component morphogenesis720.017652818
GO:0044091-membrane biogenesis1280.022253644
GO:0022008-neurogenesis1340.032864231
GO:0071709-membrane assembly840.033846
GO:0006928-movement of cell or subcellular component210.038433186
GO:0040011-locomotion830.046574919
Table 2. Gene ontology and REVIGO terms of differentially methylated genes in HG-mESC compared to PG-mESC.
Hypermethylated Genes
TermGene
Count
p-Value
GO termsGO:0045597-positive regulation of cell differentiation629.01 × 10−5
GO:0010646-regulation of cell communication1402.56 × 10−4
GO:0031325-positive regulation of cellular metabolic process1376.07 × 10−4
GO:0010827-regulation of glucose transport110.00112593
REVIGOGO:0051094-positive regulation of developmental process820.002840517
GO:2000026-regulation of multicellular organismal development1120.002906425
GO:0061041-regulation of wound healing180.006799059
GO:0071310-cellular response to organic substance1180.006814995
GO:0048468-cell development1250.007998872
GO:0051240-positive regulation of multicellular organismal process940.008416542
GO:0032989-cellular component morphogenesis840.008509034
GO:0070887-cellular response to chemical stimulus1390.008815601
GO:0051130-positive regulation of cellular component organization770.01068532
GO:0000902-cell morphogenesis780.011784721
Hypomethylated Genes
TermGene
Count
p-Value
GO termsGO:0007399-nervous system development2911.22096 × 10−15
GO:0000904-cell morphogenesis involved in differentiation1249.93 × 10−12
GO:0048870-cell motility1718.82 × 10−9
GO:0007155-cell adhesion1873.11 × 10−7
GO:0061564-axon development636.29 × 10−5
REVIGOGO:0007399-nervous system development2913.33609 × 10−7
GO:0048468-cell development2861.76681 × 10−6
GO:0000902-cell morphogenesis1771.27546 × 10−5
GO:0032989-cellular component morphogenesis1871.4186 × 10−5
GO:0000904-cell morphogenesis involved in differentiation1241.66519 × 10−5
GO:0051240-positive regulation of multicellular organismal process2044.87473 × 10−5
GO:0031175-neuron projection development1310.000104272
GO:0007423-sensory organ development950.000163232
GO:0040011-locomotion1920.00016505
GO:0060284-regulation of cell development1380.00018271
Publisher’s Note: MDPI stays neutral with regard to jurisdictional claims in published maps and institutional affiliations.

