Article

In Silico Study of the RSH (RelA/SpoT Homologs) Gene Family and Expression Analysis in Response to PGPR Bacteria and Salinity in Brassica napus

by
Grażyna B. Dąbrowska
,
Sena Turkan
,
Wioleta Tylman-Mojżeszek
and
Agnieszka Mierek-Adamska
*
Department of Genetics, Faculty of Biological and Veterinary Sciences, Nicolaus Copernicus University in Toruń, Lwowska 1, 87-100 Toruń, Poland
*
Author to whom correspondence should be addressed.
Int. J. Mol. Sci. 2021, 22(19), 10666; https://doi.org/10.3390/ijms221910666
Submission received: 19 August 2021 / Revised: 21 September 2021 / Accepted: 28 September 2021 / Published: 1 October 2021
(This article belongs to the Section Molecular Plant Sciences)

Abstract

:
Among several mechanisms involved in the plant stress response, synthesis of guanosine tetra and pentaphosphates (alarmones), homologous to the bacterial stringent response, is of crucial importance. Plant alarmones affect, among others, photosynthetic activity, metabolite accumulation, and nutrient remobilization, and thus regulate plant growth and development. The plant RSH (RelA/SpoT homolog) genes, that encode synthetases and/or hydrolases of alarmones, have been characterized in a limited number of plant species, e.g., Arabidopsis thaliana, Oryza sativa, and Ipomoea nil. Here, we used dry-to-wet laboratory research approaches to characterize RSH family genes in the polyploid plant Brassica napus. There are 12 RSH genes in the genome of rapeseed that belong to four types of RSH genes: 6 RSH1, 2 RSH2, 3 RSH3, and 1 CRSH. BnRSH genes contain 13–24 introns in RSH1, 2–6 introns in RSH2, 1–6 introns in RSH3, and 2–3 introns in the CRSH genes. In the promoter regions of the RSH genes, we showed the presence of regulatory elements of the response to light, plant hormones, plant development, and abiotic and biotic stresses. The wet-lab analysis showed that expression of BnRSH genes is generally not significantly affected by salt stress, but that the presence of PGPR bacteria, mostly of Serratia sp., increased the expression of BnRSH significantly. The obtained results show that BnRSH genes are differently affected by biotic and abiotic factors, which indicates their different functions in plants.

1. Introduction

Several species belonging to the Brassicaceae Burnett family are economically important plants, i.e., oil and fodder plants in agriculture, vegetables in horticulture including herbal species, and plants used in floriculture. The model plant A. thaliana also belongs to this plant family. The genus Brassica contains 37 species; the most extensively cultivated are B. rapa L., B. juncea L. Czernj & Cosson (mustard plant), B. napus L. (oilseed rape, rape, rapeseed, canola), and B. carinata A. Braun (Abyssinian cabbage) [1]. Rapeseed is a crop plant cultivated in temperate and subtropical regions, mainly for oil production purposes, as seeds of this plant are rich in fat (40–49%). The rapeseed oil is used in both the food industry, as it is one of the healthiest oils, and the energy industry, to produce biofuel. Rape oil by-products are utilised for the production of fodder due to their high protein content [2]. Rapeseed is cultivated all over the world, depending on climatic conditions and latitudes; three types, i.e., the winter, semi-winter, and spring types, are cultivated with varying intensity [3]. B. napus is an allopolyploid plant (ArArCoCo); its genome is a result of B. oleracea (Mediterranean cabbage, CoCo) and B. rapa (ArAr) genome hybridization, followed by duplication. The genome of B. napus has already been sequenced [4].
The crop yield depends strictly on the ability of plants to adapt to adverse and changeable environmental conditions, which is especially important during seed germination, and during the first stages of plant growth and development. Soil salinity is one of the crucial environmental stresses that have severely decreased crop productivity all over the world. It negatively affects plant physiology and metabolism, including photosynthesis, lipid metabolism, protein synthesis, and nitrogen fixation [5]. The abundance of Na+ and Cl inhibits absorption of other macronutrients causing nutritional imbalance. Moreover, salinity leads to water stress, increased reactive oxygen species production, and oxidative stress [6,7].
Plant growth-promoting rhizobacteria (PGPR) exert several beneficial effects on host plants by promoting plant growth and development, including in stress conditions, via varied mechanisms, such as the production of phytohormones, secondary metabolites, and antibiotics [8,9,10]. Plant growth promoting bacteria, especially halotolerant bacteria, could be a crucial factor for improving plant tolerance to salt stress in an environmentally friendly way [8,9]. PGPR isolated from the rice rhizosphere improved the growth of rice plants exposed to salt stress by lowering the level of ethylene [10]. Serratia liquefaciens KM4 increased the growth and biomass of maize grown in salt-stress conditions, and the increased expression of plant stress-related genes has been observed [6]. The inoculation of lettuce with Pseudomonas mendocina has a greater effect on plant growth in salt stress conditions than inoculation with arbuscular mycorrhizal fungi. In the presence of analysed PGPR the induction of a plant antioxidant system was observed, even in severe salinity conditions [11]. The inoculation of tomato with PGPR, especially Arthobacter sp. and Pseudomonas sp., under salinity stress outperformed chemical fertilization [12].
Organisms living in a fluctuating environment have evolved a range of mechanisms to respond to various stress conditions. Among several other mechanisms in bacteria, one of the most important is the stringent response. It was first described in Escherichia coli in response to the absence of amino acids [13]. The response is based on the synthesis of the atypical signalling nucleotides, guanosine tetraphosphates (ppGpp) and guanosine pentaphosphates (pppGpp), called alarmones. The increased amount of alarmones in response to stress conditions leads to the immediate arrest of rRNA, tRNA, and ribosomal protein gene expression, followed by the induction of expression of genes encoding proteins involved in adaptation to unfavourable conditions [14,15]. The metabolism of (p)ppGpp in E. coli is regulated by RelA and SpoT enzymes encoded by paralogous genes. RelA is a (p)ppGpp synthetase, whereas SpoT is mainly a (p)ppGpp hydrolase, however, in certain conditions it exhibits low activity of alarmone synthetase. Most bacteria possess only one bifunctional Rel enzyme [16,17,18,19].
The presence of (p)ppGpp in photosynthetic Eucaryota was first confirmed in the alga Chlamydomonas reinhardtii, where the accumulation of alarmones in response to amino acid starvation was observed [20]. Homologs of the bacterial genes RelA/SpoT called RSH (RelA/SpoT Homologs) were first identified in A. thaliana [21] and, in subsequent years, RSH genes have been identified in other plant species [22,23,24,25]. RSH proteins have been divided into three groups, i.e., RSH1, RSH2/3, and CRSH, based on their primary structure and domain structure [26]. In A. thaliana, there are four genes encoding RSH proteins, namely RSH1, RSH2, RSH3, and CRSH (Ca2+-activated RSH). RSH1 exhibits only (p)ppGpp hydrolytic activity due to the substitution, critical for (p)ppGpp synthase activity, of glycine by serine in the RSD domain. Proteins belonging to the RSH2/3 group (AtRSH2 and AtRSH3) can both synthesize and hydrolase alarmones, whereas CRSH proteins do not possess a functional hydrolytic domain (HD domain) and are (p)ppGpp synthases [26,27,30]. Members of the RSH1 group possess a TGS domain which has been proposed to play a regulatory role in ligand binding [27], and a role in establishing the RSH-ribosome interaction in chloroplasts [28,29,30]. Moreover, RSH1 as the only group of plant RSH proteins that possess the ACT domain [30], recently described as an RNA recognition motif (RRM) domain [28]. CRSH group proteins also contain the EF-hand motif at the C-terminus of the protein. Interestingly, this Ca2+-binding motif has not been identified in any bacterial or plant homolog [26,31]. It was confirmed in vitro that, for (p)ppGpp synthase activity, CRSH requires Ca2+ [32]. The plant stringent response has been implicated in the stress response, flowering, seed development, photosynthesis, plant senescence, and nutrient remobilization [27].
In animals, homologs of bacterial SpoT have been identified (Mesh1) with alarmone hydrolysing activity [33]. However, until quite recently, the existence of (p)ppGpp in metazoa has been questioned. Last year the presence of ppGpp in Drosophila and human cells was shown [34], opening a new chapter in the discussion about the origin and functions of alarmones.
In the present study, we attempt to answer the question about the complexity of the plant RSH groups in representatives of the Brassicaceae family via the in silico analysis of RSH genes and RSH proteins from selected species of this plant family. Inspired by the postulated role of RSH in the plant response to varied abiotic and biotic factors, we also examined B. napus RSH gene expression in response to salinity. Moreover, we analysed the expression of BnRSHs in the presence of Serratia liquefaciens, S. plymuthica, and Massilia timonae, PGPR bacteria for which the ability to promote the growth of rape has been confirmed. To pinpoint other potential regulators of RSH gene expression, we revealed the presence of multiple putative regulatory cis-elements in the promoter regions of BnRSH genes.

2. Results and Discussion

2.1. In Silico Analysis of RSH Genes and Proteins in B. napus and Selected Close Relatives from the Brassicaceae Family

Over 20 years ago, RelA/SpoT homologs (RSH) were discovered in plants [21], and the occurrence of the stringent response in plants was also proposed. Subsequently, RSH genes have been characterized in other plant species, and it has been shown that the stringent response plays a critical role in the regulation of plant growth and development, and in adaptation to different environmental niches [23,24]. The nature of the evolutionary basis of the stringent response raises questions regarding the complexity of plant RSH gene families including their number, and the structure of plant RSH proteins in various plant species. The plant RSH proteins have been divided into three groups (RSH1, RSH2/3, and CRSH), based mostly on protein primary structure. The members of these three groups of RSH proteins vary in their expression patterns and catalytic activities and, therefore, they probably fulfil distinct physiological roles. It seems that the diversification in plant RSH genes occurred when plants adapted to terrestrial conditions, and resulted either in the loss or acquisition of some structural and functional features [35,36]. Here, in order to reveal the complexity of the RSH gene family, and to further predict relations between sequence and function, we have analysed in silico RSH genes and RSH proteins in B. napus, and in selected relatives from the Brassicaceae family.

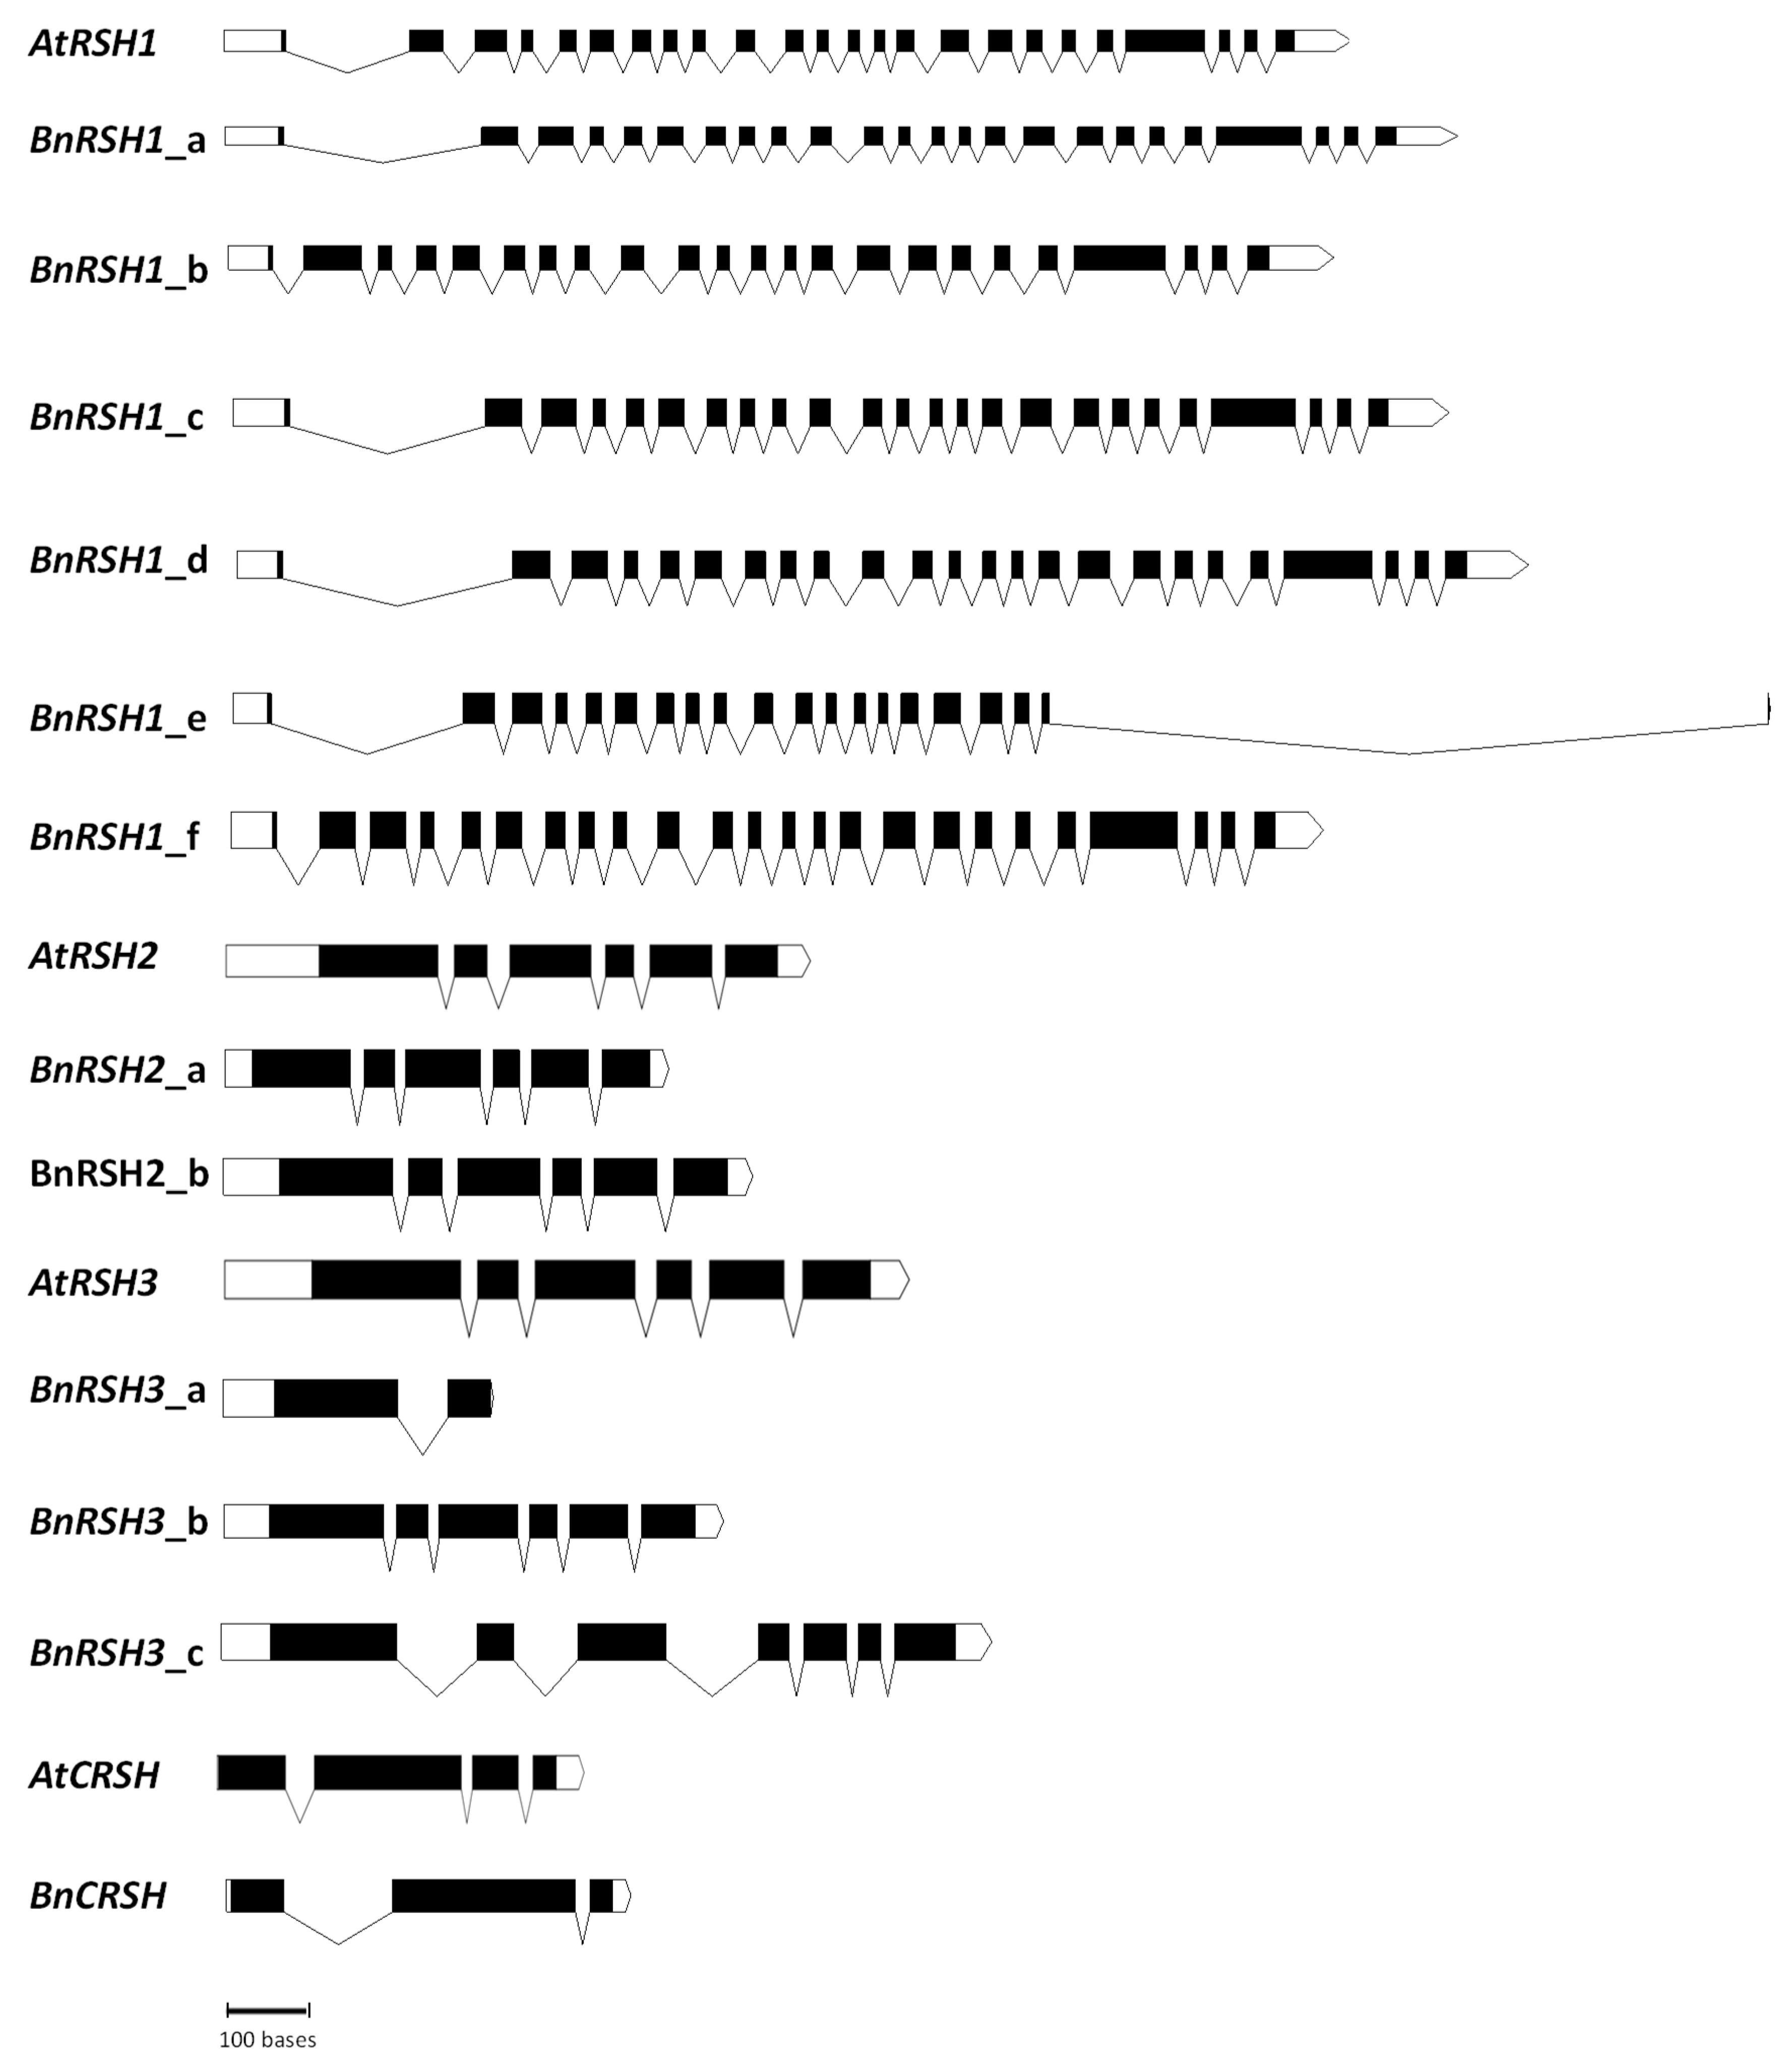
2.1.1. Characteristics of Selected Brassicaceae RSH Genes

In silico studies are often used as a preliminary means of analysis of plant gene families that enable the capturing of the phylogenetic relationships within a family of genes in one species, as well as between species [36,37,38,39,40]. A total of 45 RSH genes that were identified were selected for this study of Brassicaceae (B. napus, B. olearacea, B. rapa, Camelina sativa, and Raphanus sativus) plants are shown in Table 1. B. napus is an allotetraploid species and thus, as expected, has more RSH orthologous genes (14 in total, including 2 pseudogenes) than A. thaliana, where only 4 RSH genes have been described [35,41]. Four RSH genes are present also in the B. rapa genome, whereas in the genome of B. oleracea 6 RSH genes occur, and in the genome of R. sativus 8 RSH genes are present, though all these plants are diploids. In the allohexaploid genome of C. sativa 12 RSH genes are present, however, 3 of them are pseudogenes. In O. sativa, one gene in each of the RSH1, RSH2, and RSH3 subgroups, and three CRSH genes were identified [42]. In I. nil, five RSH genes were identified, i.e., 1 RSH1, 2 RSH2, 1 RSH3, and 1 CRSH [25]. Genes encoding RSH were described also in Capsicum annum [43], Nicotiana tabacum [44], and Suaeda japonica [45].
B. napus RSH genes are distributed in 9 out of 19 chromosomes (Figure 1), but one of the BnRSH1 genes has not yet been assigned to any chromosome. In B. oleracea, RSH genes are located on 5 out of 9 chromosomes, and in B. rapa the RSH genes are located on 4 out of 10 chromosomes. There are no differences between the number and the localization of RSH genes on chromosomes in B. oleracea and on C-genome chromosomes in B. napus. In the case of A-genome chromosomes, there are additional RSH1 genes on chromosome A5 and A9 in comparison with the genome of. B. rapa. Moreover, the CRSH gene located on chromosome A3 is a pseudogene in B. napus. The presence of an RSH3 pseudogene located on chromosome A6 could be caused by genome assembly errors since both genes lies in proximity and are separated by an unknown sequence.
Further in silico comparative analysis of the intron-exon organization of RSH genes in selected Brassicaceae species (Figure 2 and Supplementary Figure S1) showed that the number of exons and introns, and the location of introns in different types of RSH genes, was preserved in the plants analysed. Plant RSH1 genes are characterized by very complex structures, with over 20 introns and exons in each analysed gene, except for BnRSH1_e and RsRSH1_c (Table 1). The high number of introns and exons is a common feature of RSH1 genes from both mono- and di-cotyledonous plants [25] (data from the NCBI Gene Database). The average number of introns per gene in plants is about 4 [46,47], which raises a question about the possible role of such great complexity in the RSH1 gene. It is widely accepted that introns fulfil different roles, i.e., introns may contain regulatory elements, they may serve as alternative promoters, or they may be a template for synthesis of non-coding regulatory RNAs [46]. Moreover, introns are crucial for alternative splicing and, in plants, intron retention is a widely observed phenomenon [48]. The presence of introns enhances the expression of genes in varied organisms [49]; however, interestingly, in plants in contrast to animals, higher expression is observed for genes containing more and longer introns [50]. The highly complex structure of RSH1 genes in plants may suggest their high expression and important roles in many metabolic pathways. Other RSH genes in plants are much more compact than RSH1, containing approximately 5 introns in RSH2/3 genes, and 2–3 introns in CRSH genes (Table 1, Figure 2 and Supplementary Figure S1).

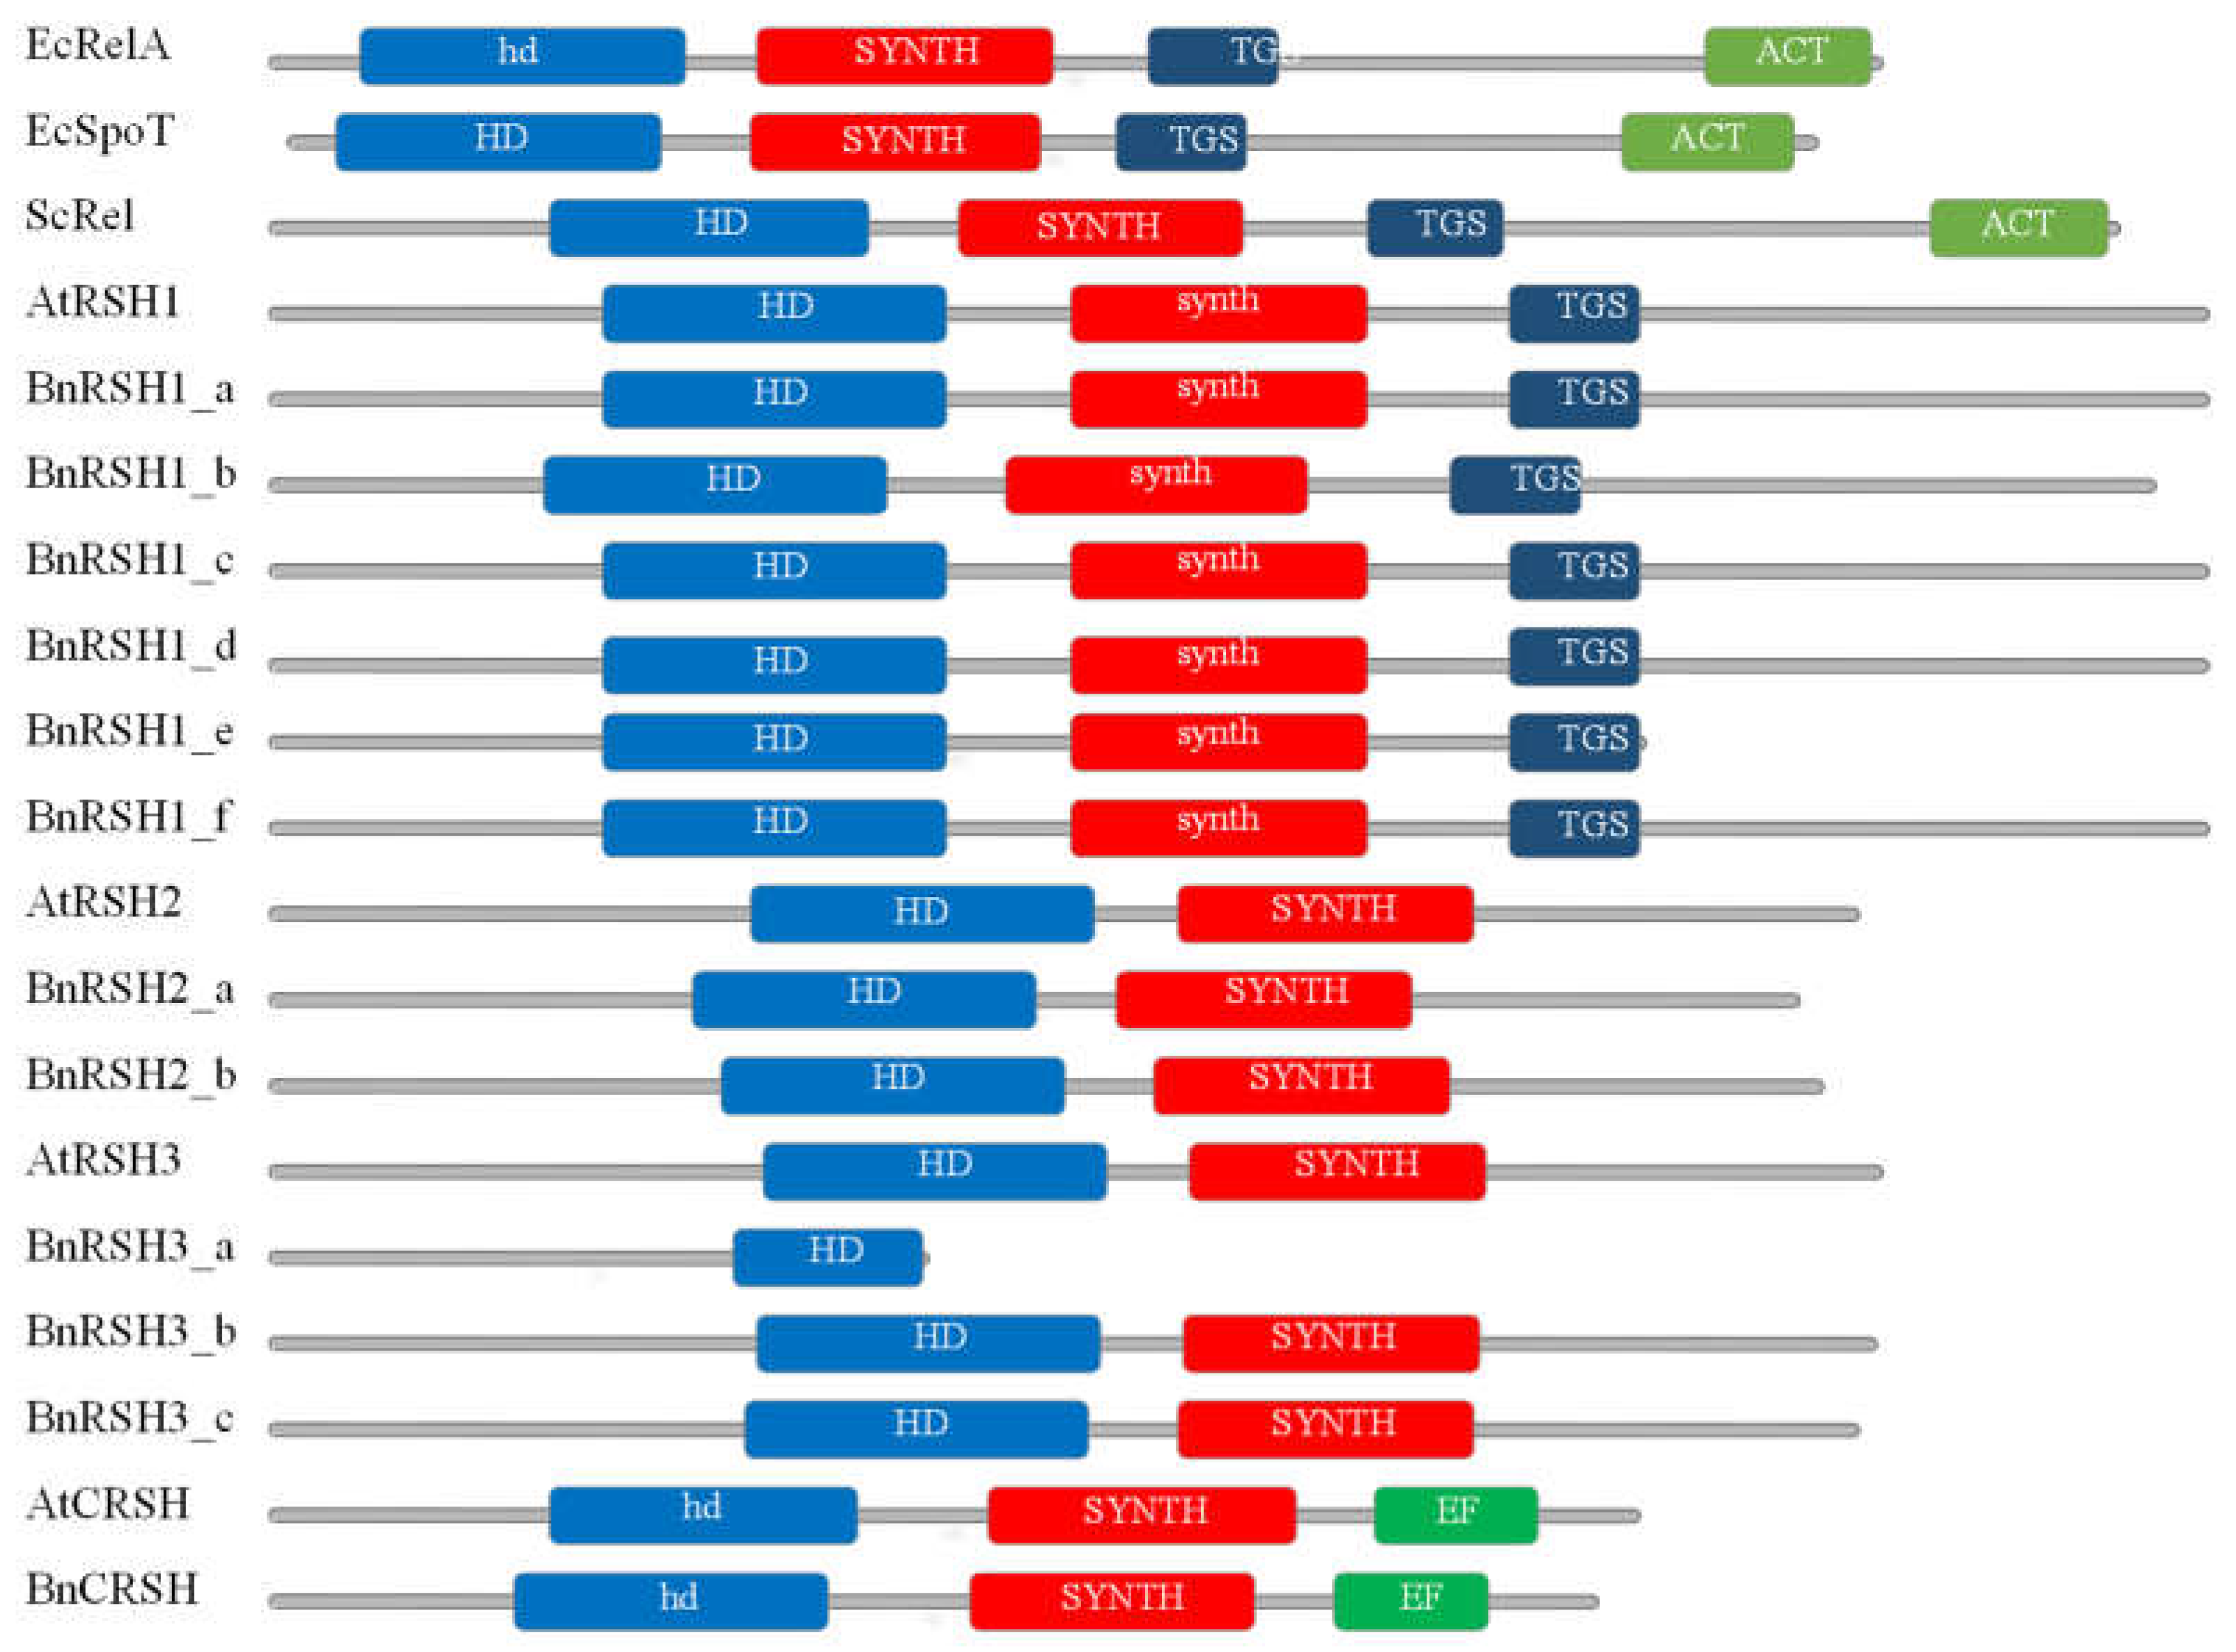
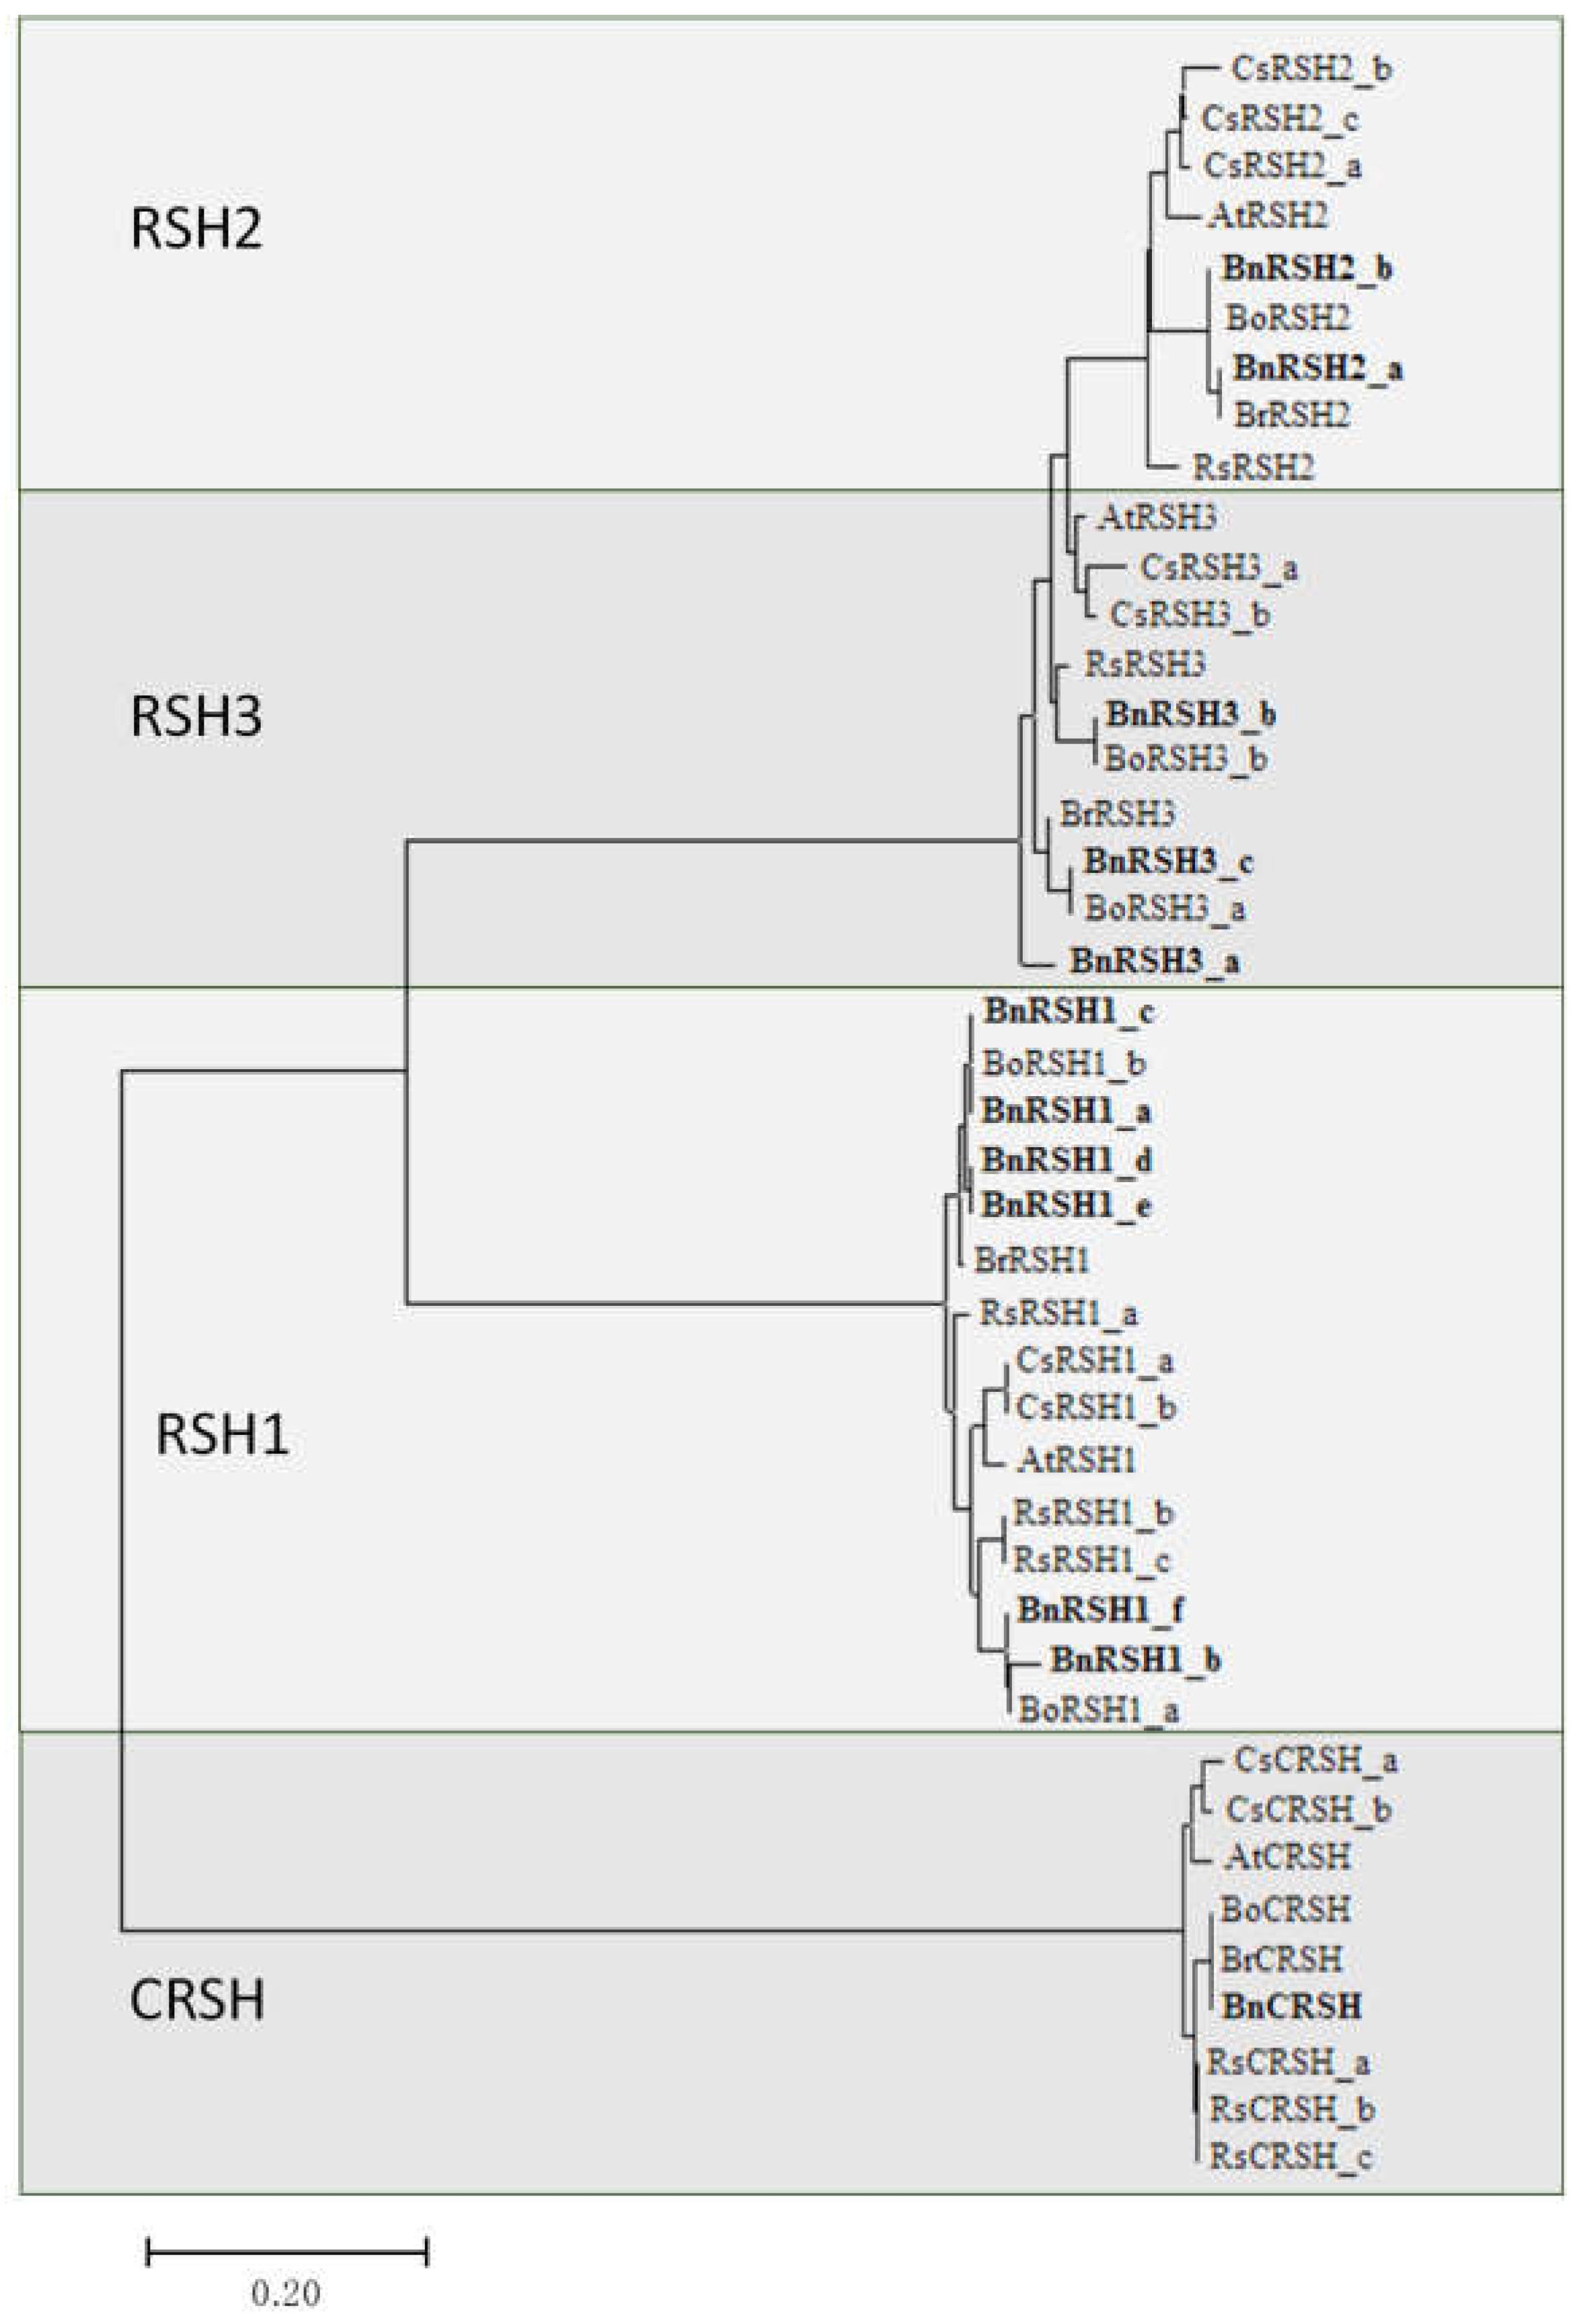
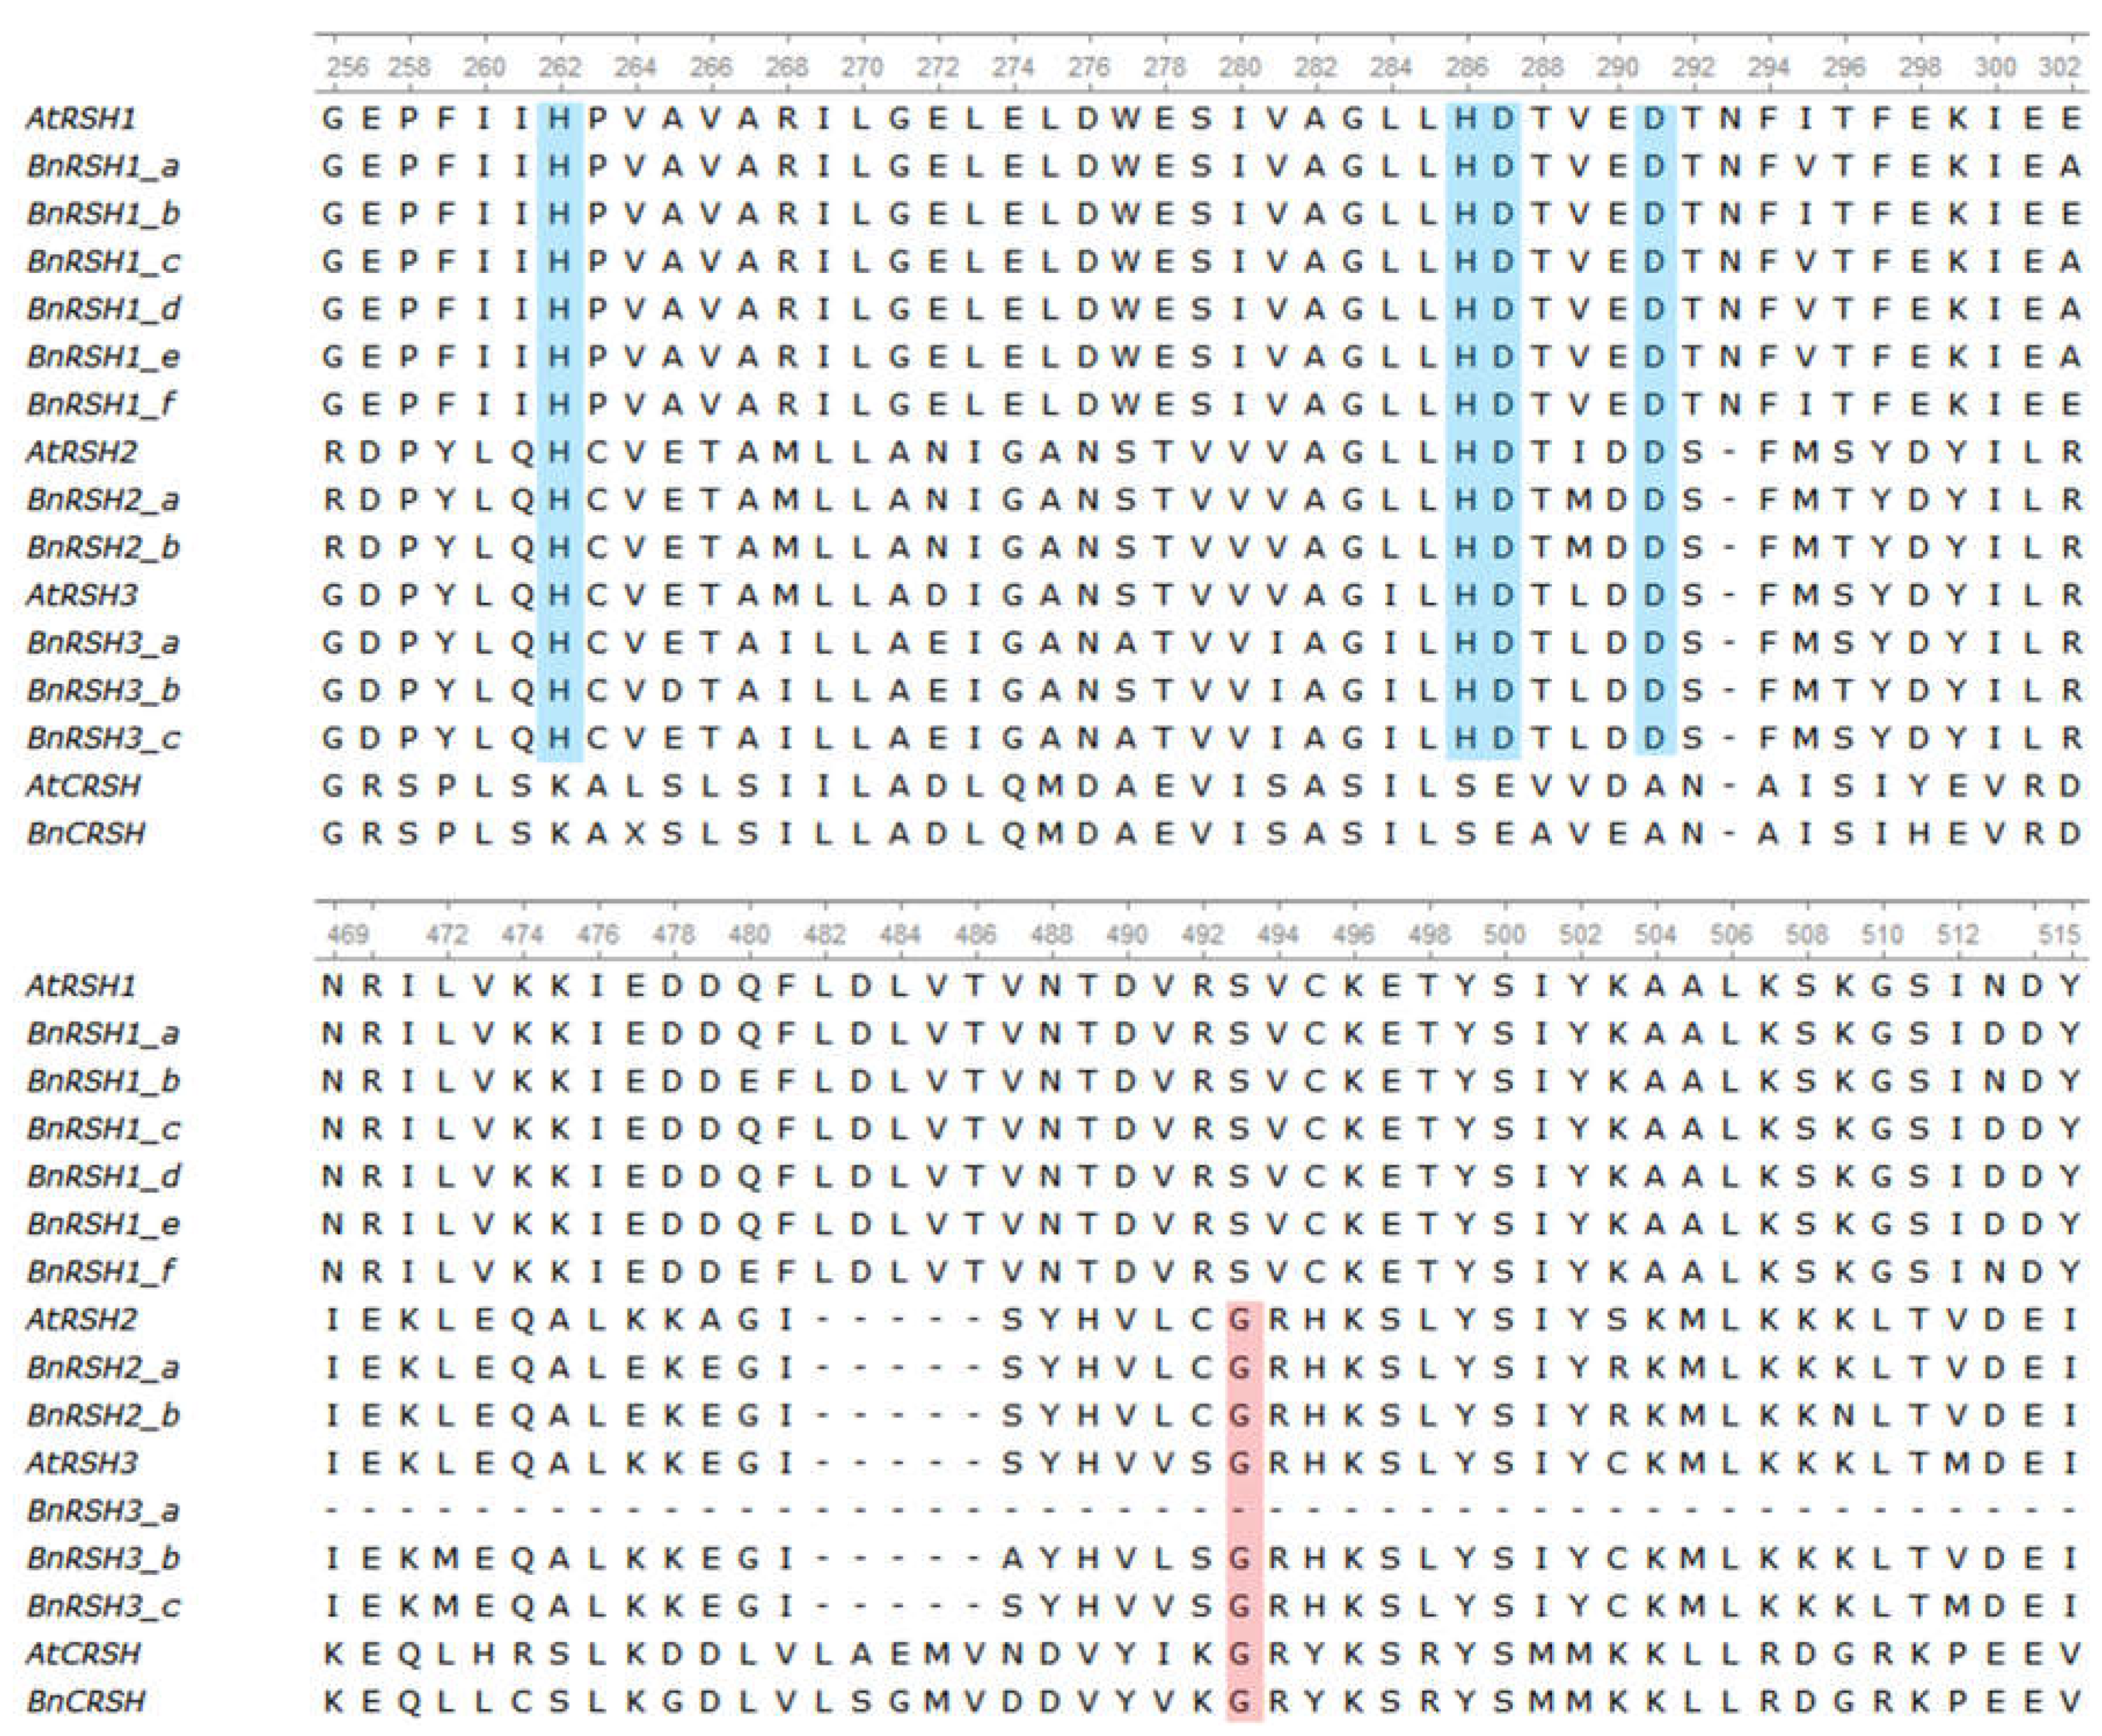
2.1.2. Characteristic of Selected Brassicaeae RSH Proteins

In silico studies have shown that all analysed RSH proteins contain the (p)ppGpp hydrolase (HD) and (p)ppGpp synthetase (SYNTH) domains (Figure 3 and Figure S2). RSH1 proteins also possess a TGS domain that is also present in bacterial stringent-response proteins. CRSH proteins contain an EF domain which is specific only for plant CRSH. On the other hand, bacterial RelA and SpoT proteins contain an ACT domain that is not present in any group of plant RSH proteins (Figure 3).
The analysed plant RSH1 proteins contain a functional HD domain, i.e., proteins belonging to this group possess alarmone hydrolytic activity, whereas they do not have a functional (p)ppGpp synthesis domain due to the substitution of functional glycine with serine (Figure 4 and Figure S3). The proteins belonging to RSH2/3 have both (p)ppGpp hydrolase and synthetase activity. CRSH has a functional SYNTH domain, but the hydrolytic domain has lost its activity because of the substitution, conserved in bacterial and plant proteins, of histidine (H) and aspartic acid (D) with serine and glutamic acid, respectively. The E. coli RelA protein is also characterized by the lack of a functional HD domain due to the substitution of His and Asp with phenylalanine and proline, respectively (Supplementary Figure S3). The catalytic activity of plant RSH proteins predicted by the in silico analysis of amino acid sequences could be confirmed by a complementation test in E. coli relA and relA/spoT mutants. It was shown that RSH1 proteins from A. thaliana and I. nil do not possess (p)ppGpp synthase activity, whereas AtRSH2, AtRSH3, and InRSH2, are able to synthesise and hydrolyse alarmones [25,26,41]. The (p)ppGpp synthesis activity was confirmed also for RSH2/3 from Suaeda japonica [45], and for Nicotiana tabacum RSH2 alarmone synthesis and hydrolysis activity was shown [44]. Interestingly, AtCSRH has only (p)ppGpp synthase activity, as expected based on amino acid sequence analysis [51], whereas InCRSH complements both mutations suggesting that this protein is able also to hydrolyse alarmones, despite the crucial His and Asp in HD domain in InCRSH being substituted with Arg and Gln [25].
Plant RSH proteins such as bacterial Rel, RelA, and SpoT proteins belong to the so-called “long RSH” group. However, there are also “short RSH” proteins containing either a SYNTH domain (SAS) or an HD domain (SAH), without any regulatory domains. SAS and SAH are present in some bacteria together with long RSH. It was hypothesised that “short RSH” proteins allow different lineages of bacteria to expeditiously adapt to fluctuating environments, increasing their chance to survive harsh environmental conditions [36]. In metazoa, SpoT homolog 1 (Mesh) is a class of SAH and contains only (p)ppGpp hydrolytic domains [34]. However, in plants no representatives of “short” RSH proteins have been identified. In some plant species the degradation of the HD domain has been shown, however mostly in algae species [36]. Interestingly, one of the RSH3 proteins in B. napus (Figure 3) contains only an HD domain that is an unprecedented feature of plant RSH. However, the functionality of this truncated protein remains to be confirmed. The degradation of the HD or SYNTH domains in plant RSH proteins suggests subfunctionalization similar to that found in bacteria specialised RSHs which may be needed to strengthen the stringent response [24].
Although plant RSHs are nuclear-encoded proteins they contain chloroplast transit peptides at their N-terminus [31]. In silico analysis of putative amino acid sequences of RSH proteins from the Brassicaceae family also showed that the chloroplast is the most probable subcellular localisation (Table 1). Interestingly, in the case of CRSH, the presence of a chloroplast signal peptide is less probable than for other types of RSH protein. In fact, the chloroplast localization has been shown for many of these proteins belonging to all types of plant RSH groups [26,31,44,51,52,53]. There is a paucity of reports of the direct measurement of (p)ppGpp in whole plants, and in particular, in isolated chloroplasts. Takahashi et al. [54] showed that the level of ppGpp in pea chloroplasts is 13 times higher than in shoots, which confirmed, that the majority of alarmones in plants are localized in chloroplasts. Later reports have determined the level of (p)ppGpp only in whole plants [41,56,57].
The phylogenetic analysis of RSH proteins from selected Brassicaceae species (Figure 5) showed the presence of three separate RSH groups. RSH2 and RSH3 could be distinguished but, due to sequence similarity, they are grouped on one branch of the phylogenetic tree. In A. thaliana, true RSH3 homologs are missing since AtRSH2 and AtRSH3 are the result of recent duplication of the ancestral RSH2 gene with a 75% amino acid sequence similarity [36]. True RSH3 homologs are, however, present in other plants. Interestingly, the amino acid sequence similarities between RSH2 and RSH3 in other plant species analysed in this study are very high (ranging from 74% to even 80%), which may suggest that, similar to A. thaliana, a true RSH3 homolog is also missing from other plants belonging to the Brassicaceae family.

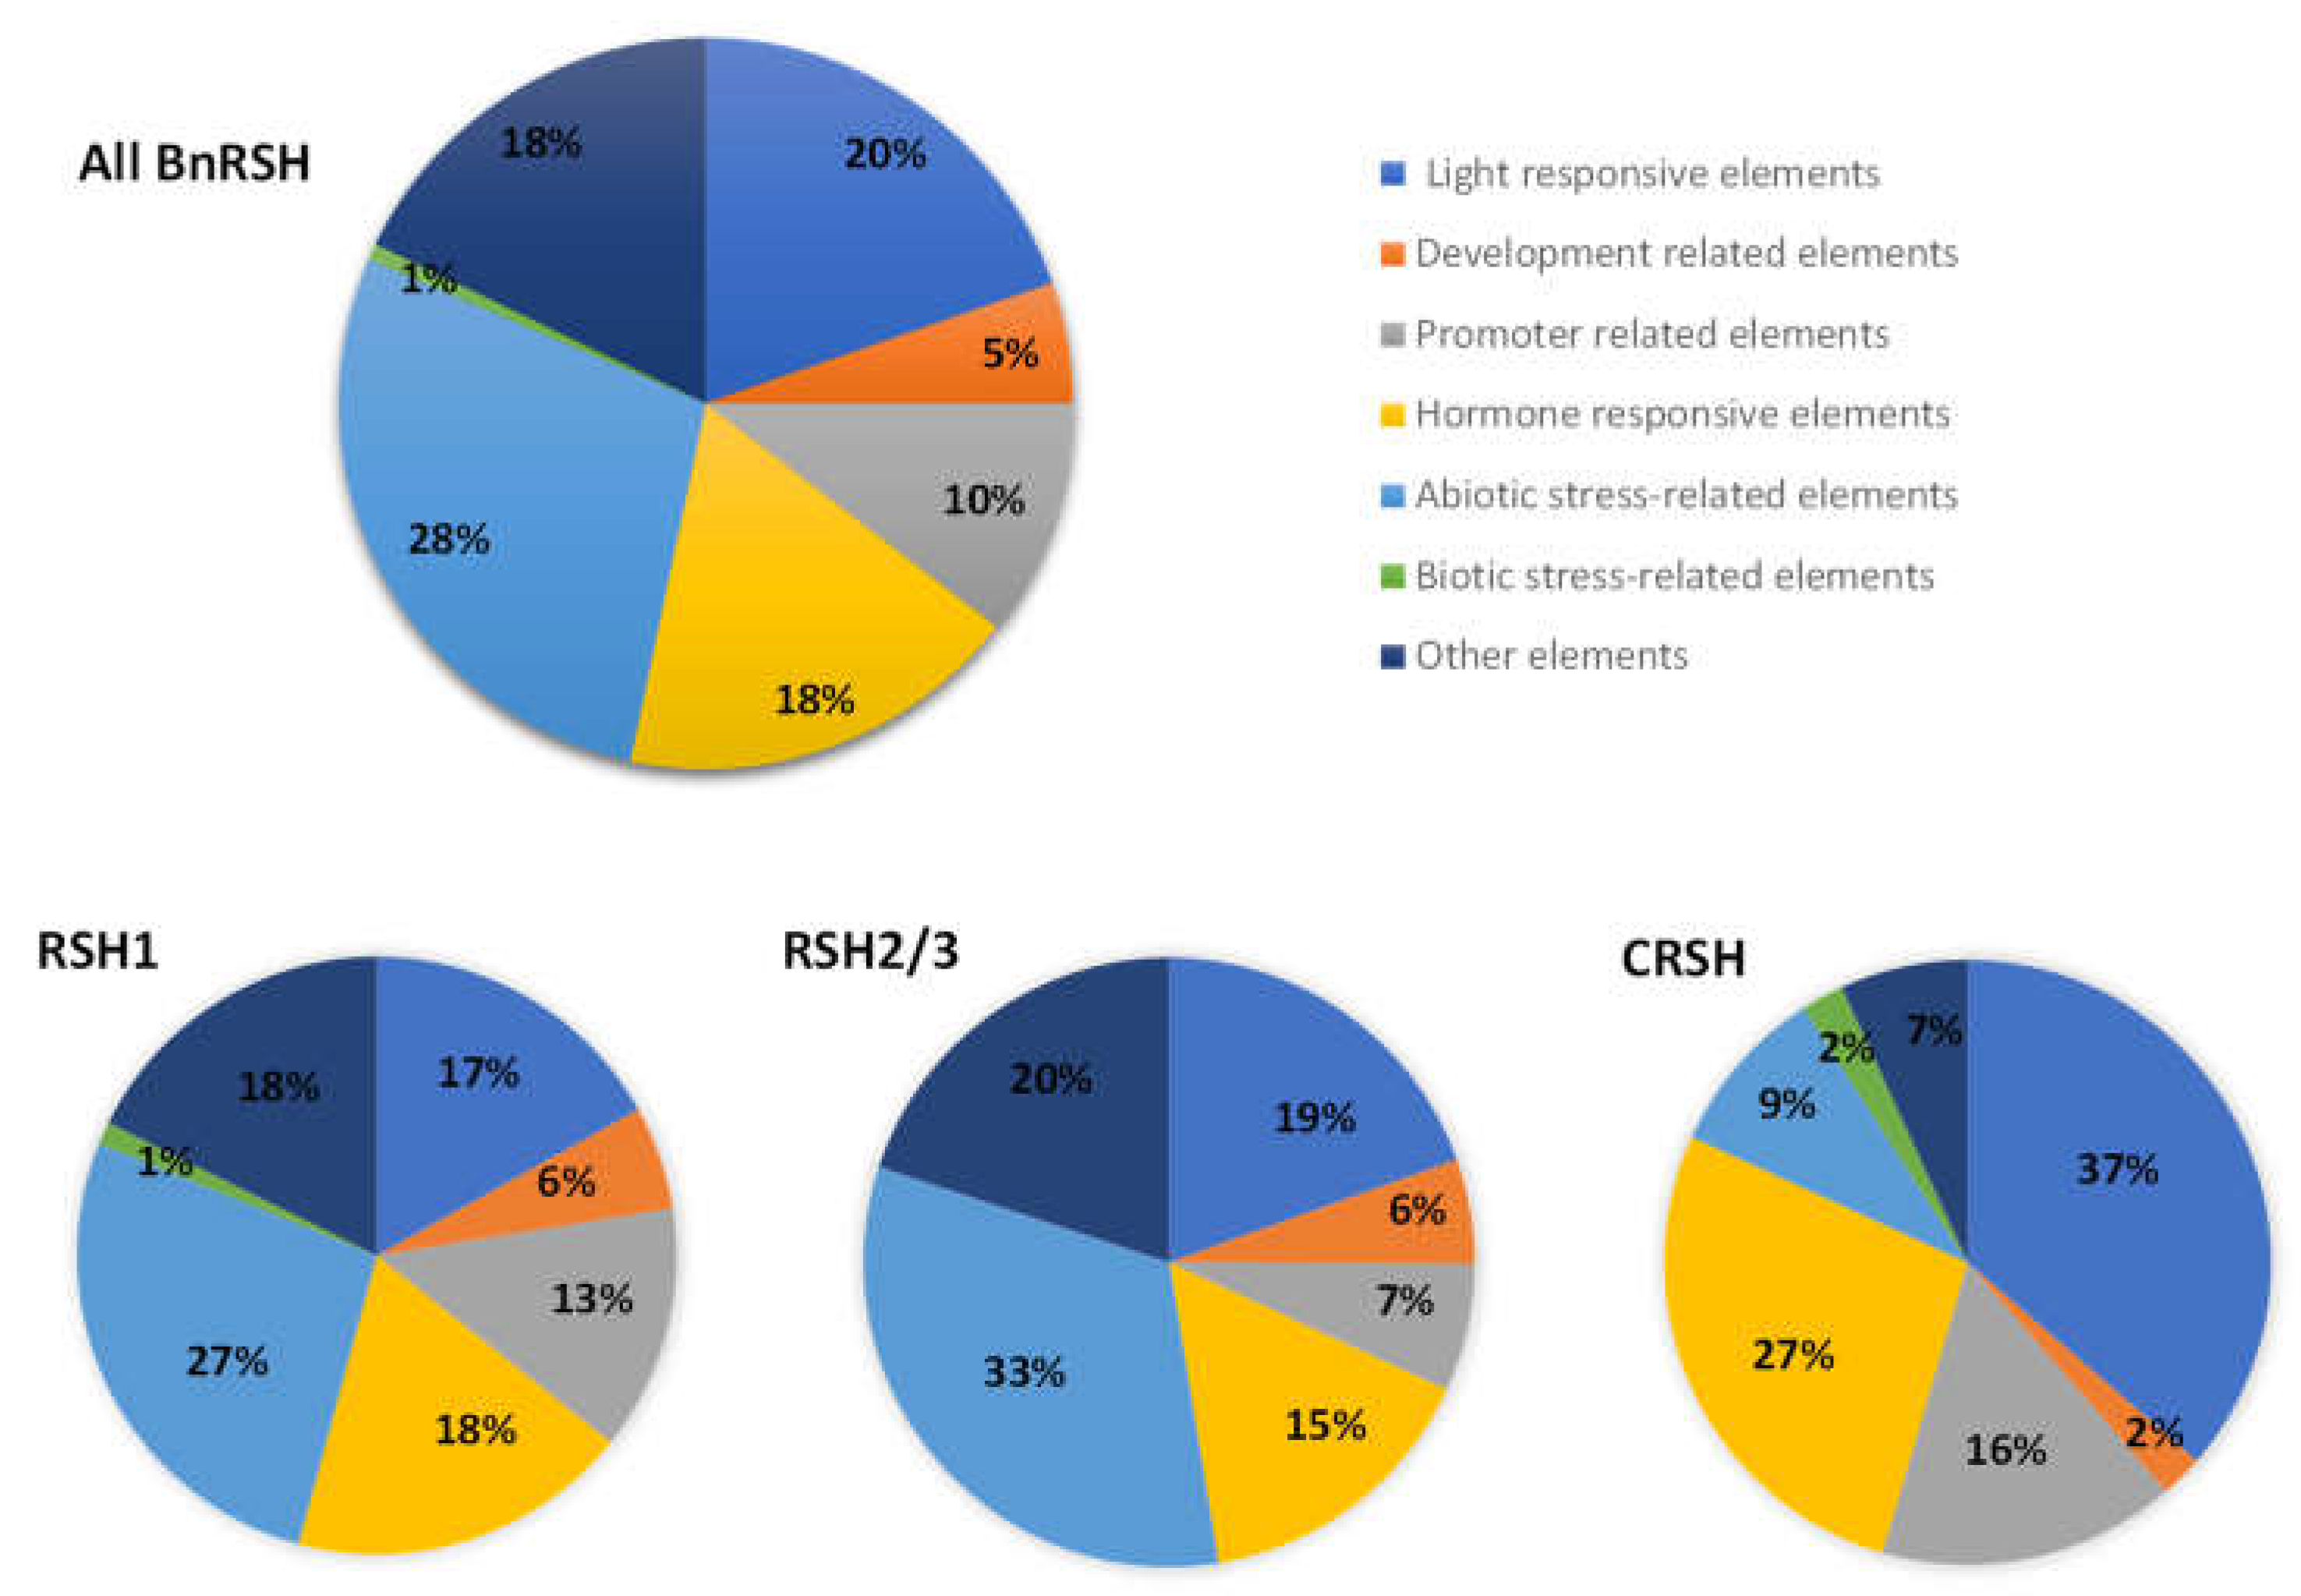
2.2. Regulatory Elements Present in Promoter Regions of B. napus RSH Genes

The expression of plant RSH genes is tissue/organ-dependent; it depends on the stage of development as well as on the type of the RSH gene. It is generally thought, that (p)ppGpp affects gene expression in chloroplasts at transcriptional, translational, and post-translational level, and thus alarmones regulate plant growth and development, and response to stress stimuli [55]. In fact, the expression of RSH genes, and thus the level of alarmones, is up-regulated by different factors, including abscisic acid [53,56], salt stress [5,25,26,59], oxidative stress [57], drought [25], and the presence of plant growth promoting bacteria [5]. Interestingly, it was also shown that the overaccumulation of (p)ppGpp in plants has some negative effects. For instance, Arabidopsis plants overexpressing RSH2 and RSH3 were smaller, contained less chlorophyll, and their seeds had lower vigour [41]. The increased level of (p)ppGpp in Arabidopsis led to dwarf chloroplasts, and reduction of metabolites, however, the mutant plants were more tolerant to nutrient-deficient conditions than wild-type plants [52]. Moreover, the increased level of alarmones increased the susceptibility of plants to turnip mosaic virus, whereas for plants with a decreased level of (p)ppGpp, reduced susceptibility was observed [58]. These results clearly show that the level of (p)ppGpp is tightly controlled, since alarmones are critical not only for plastid development and metabolism, but also for the fine-tuning of plant growth and development.
Promoters are responsible for controlling the efficiency, timing, and location of gene expression via clusters of short sequences, including cis-regulatory elements (CREs). CREs provide binding sites for transcription factors [37,62,63] and their presence may reflect multiple pathways of gene expression regulation. In order to gain some insight into the putative roles of BnRSH, in silico analysis of promoter regions, using the PlantCare database, was performed. This kind of bioinformatical analysis provides a background for further research [59,60,61,62]. A promoter analysis of the BnRSH genes revealed the presence of several putative cis-acting elements involved in light signalling, in plant development, in response to plant hormones, as well as in plant response to abiotic and biotic stress (Supplementary Table S1). The most abundant elements in all BnRSH genes were those related to the abiotic stress response, followed by light- and hormone-responsive elements. Only 1% of all identified CREs in BnRSH genes were related to the biotic stress response, and this kind of element was not identified in BnRSH2/3 genes (Figure 6 and Supplementary Table S2). The highest number of elements was identified in the BnRSH3_b gene (69), and the lowest in the BnRSH1_b gene (25) (Supplementary Table S1 and Supplementary Figure S4). The most abundant of the abiotic stress response elements were the drought and ABA response element MYB (41), followed by MYC (27), which is a drought, ABA, and cold response element, and the general stress-response element, STRE (22). Among hormone-responsive elements the ethylene response element was the most frequently occurring (36) (Supplementary Table S1). The frequencies of the types of CRE in BnCRSH genes were different from the frequencies observed in BnRSH1–3 genes. In the promoter region of BnCRSH, the most abundant elements were those related to response to light, followed by hormone responsive elements. Only 9% of CREs were abiotic stress response elements (Figure 6). This observation may imply that CRSH plays a significantly different physiological role than RSH1–3. In fact, the expression of CRSH was not changed by salt stress, osmotic stress, or drought in I. nil [25]. The expression of AtCRSH was also stable in response to wounding and NaCl, however, it was also not changed by hormones, even ABA [26], and the ABA-response element is the most abundant among hormone responsive elements in the BnCRSH gene promoter (Supplementary Table S1). Interestingly, the circadian rhythm of AtCRSH expression is also different to that of AtRSH1–3, i.e., the expression peak of AtCRSH is during darkness whereas AtRSH1–3 genes are mostly expressed in the light [26].
The presence of multiple putative regulatory elements involved in the light response in promoter regions of BnRSH genes suggests that the potential roles of corresponding proteins may not be restricted to the stress response but are also important for plant growth and developmental programs. Additionally, promoters of BnRSH1_a, BnRSH1_c, BnRSH1_d, BnRSH1_e, and BnCRSH genes contain motifs involved in the control of the circadian cycle (Supplementary Table S1). It was shown that the mRNA level of RSH genes and alarmone levels are light dependent. The expression of all RSH genes in Arabidopsis fluctuated during the diurnal time course [26]. Takahashi et al. [54] showed that prolonged darkness (12 h) reduced ppGpp levels, whereas abrupt changes to Pisum sativum plants, from prolonged light (12 h) to dark, caused a substantial elevation in ppGpp levels. Similarly, alarmone concentration altered in 12-h light/12-h dark cycling conditions, with increasing alarmone levels at the beginning, and its highest peak during the dark time period [63]. The functionality of the identified potential cis-elements needs to be further confirmed.

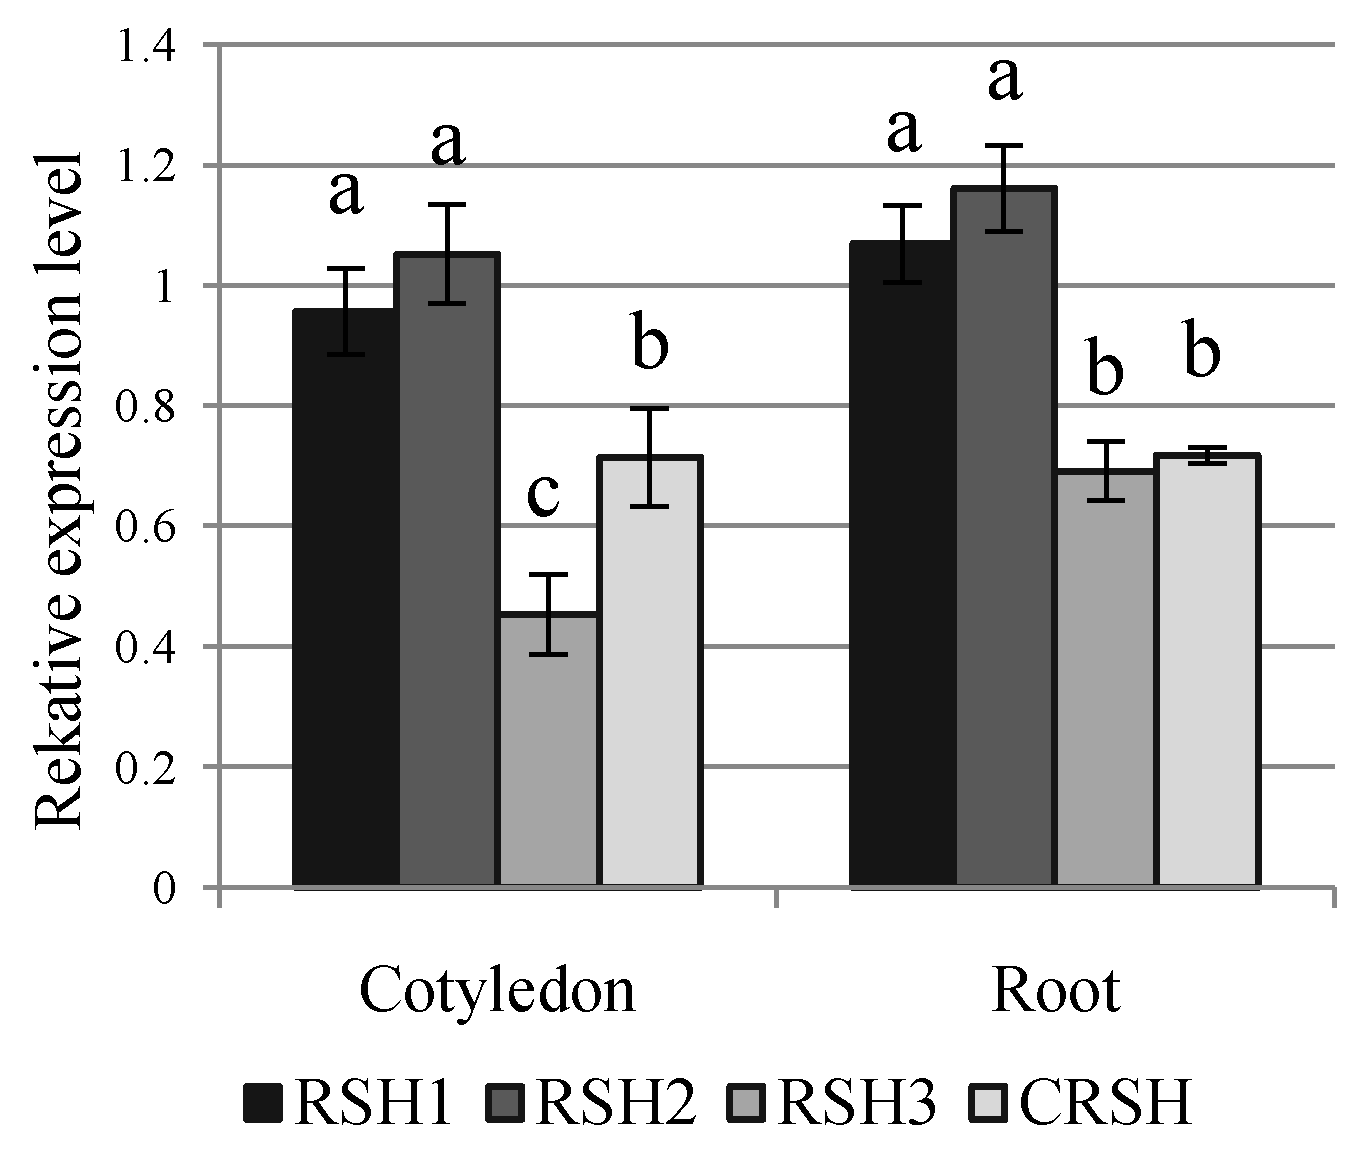
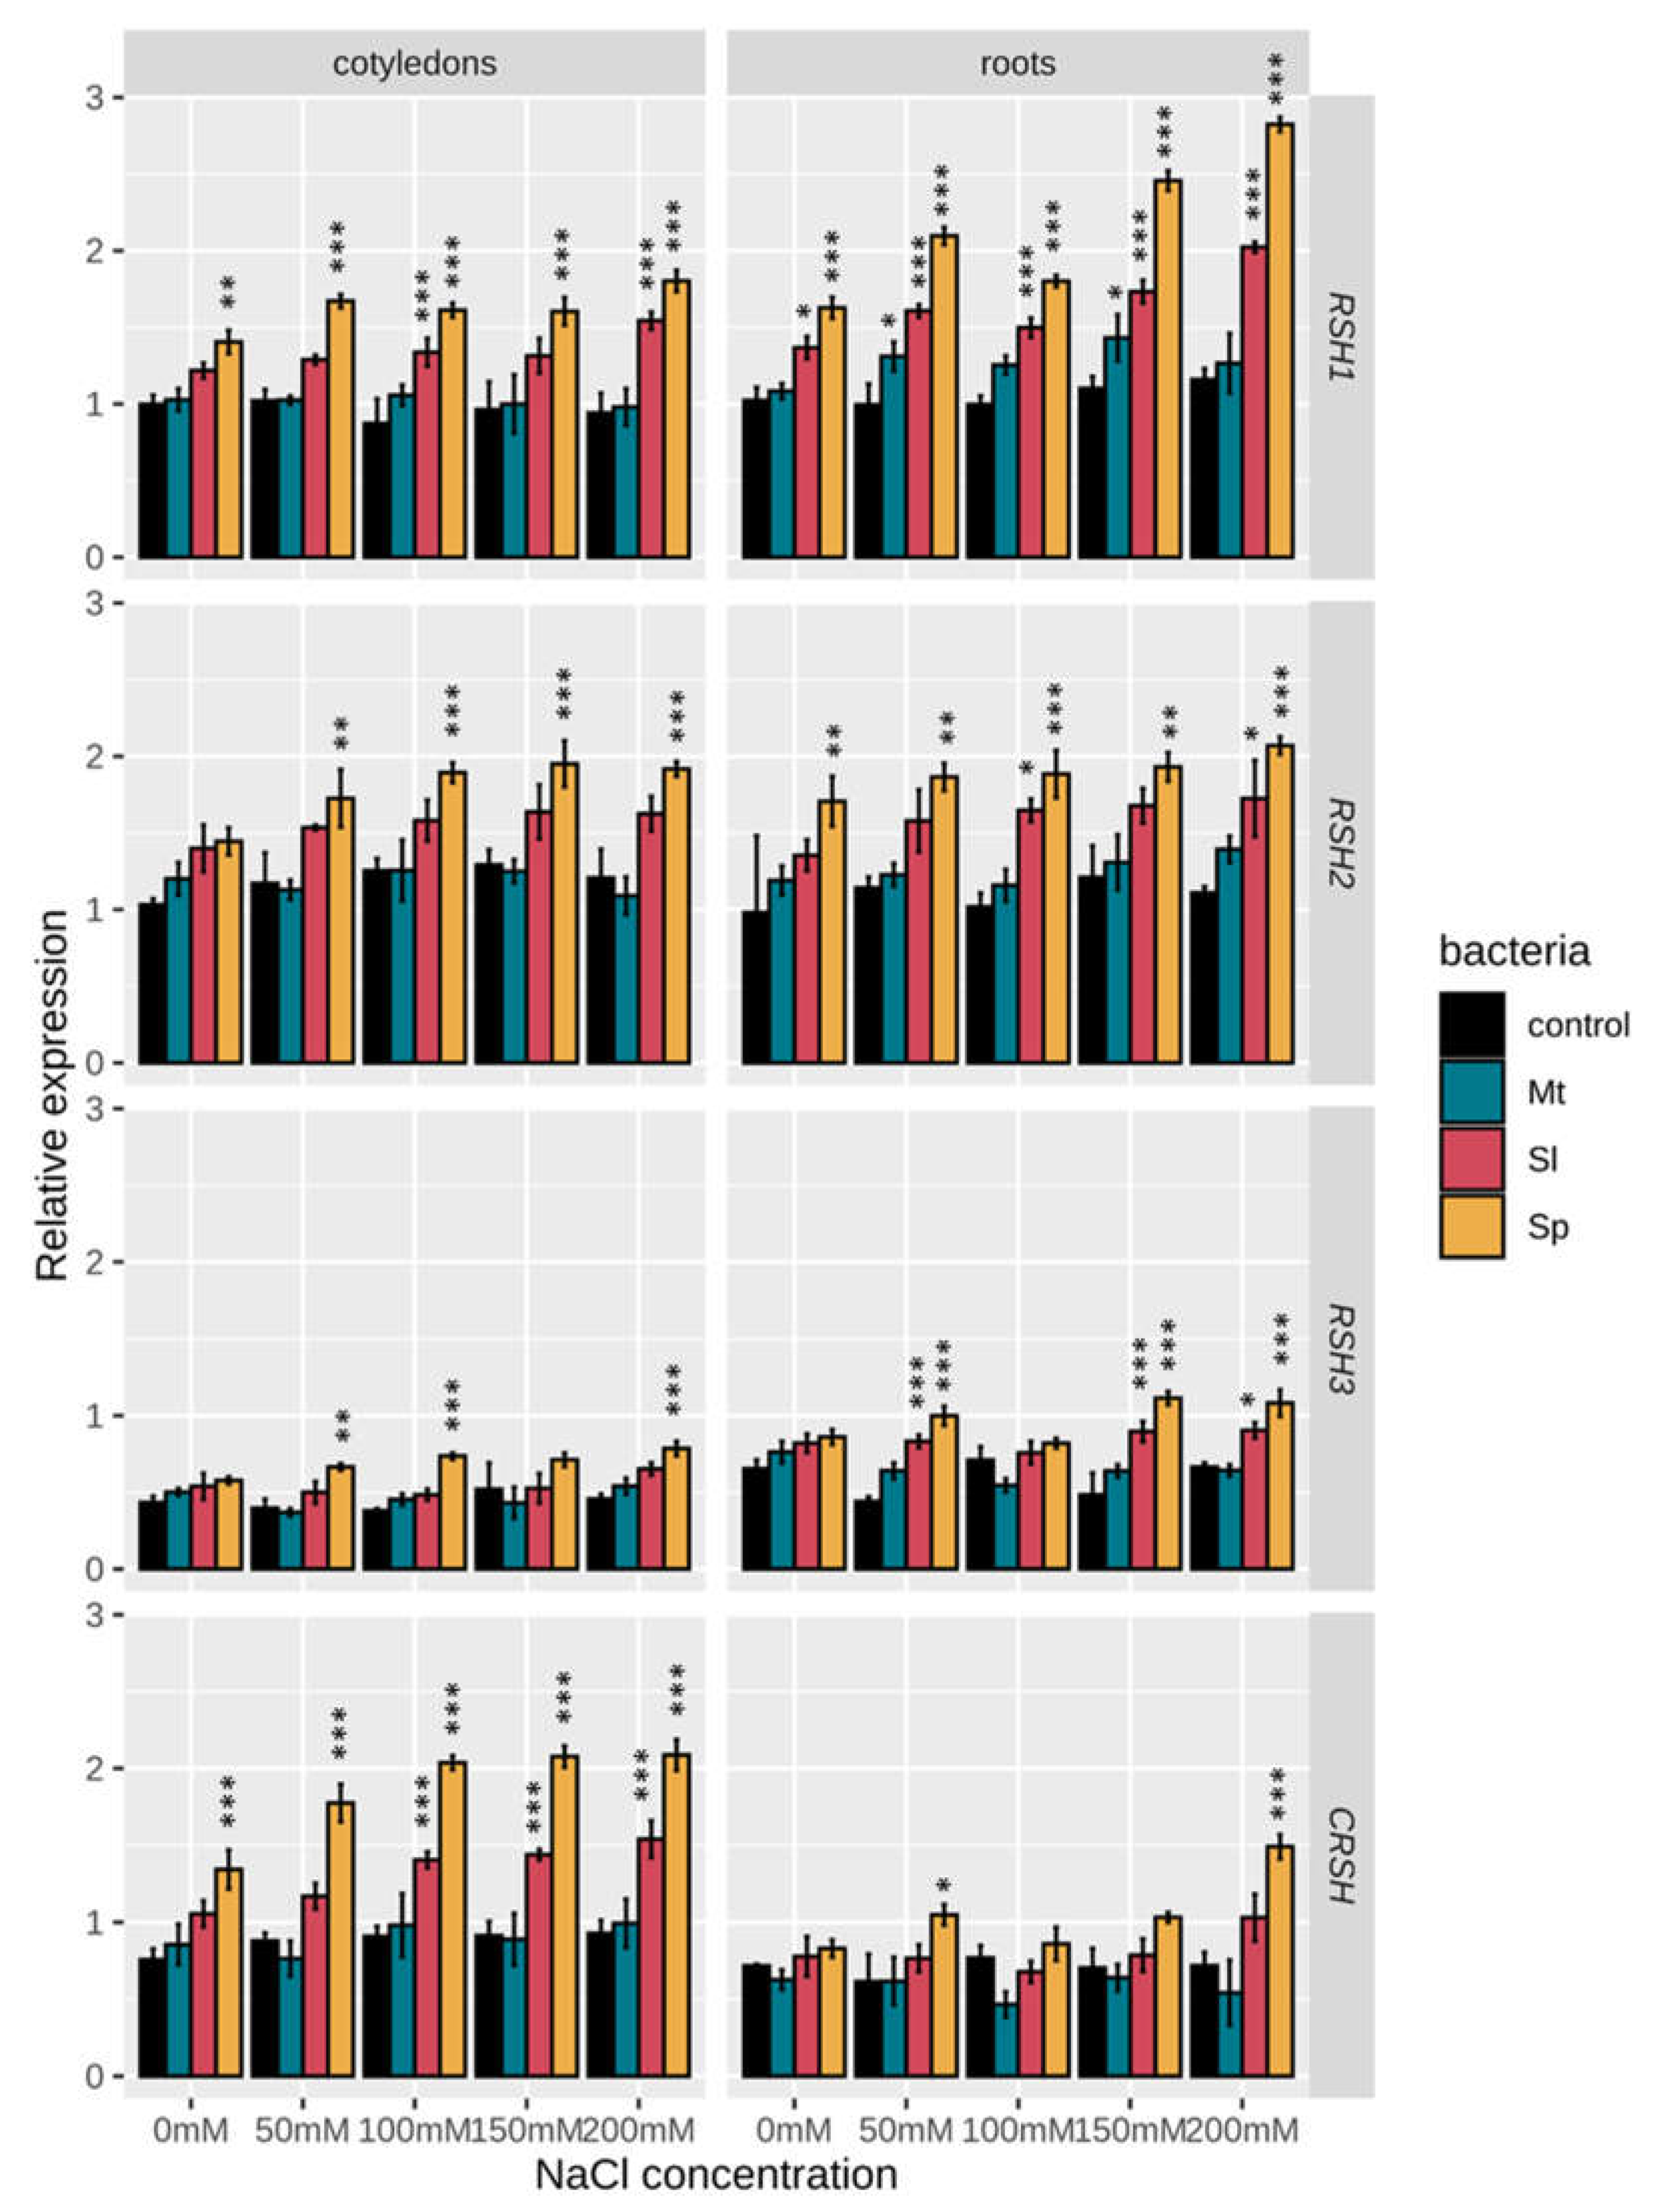
2.3. Effect of Salinity and Rhizobacteria on the Expression of BnRSH Genes

Soil salinity stress mitigates crop productivity and is an important challenge for global sustainable agriculture [64]. It affects several aspects of plant metabolism leading to significant decreases in plant growth and yield [6]. B. napus is considered one of the most saline-resistant species in the genus Brassica, being more tolerant not only than its diploid ancestors, but also than other polyploid species [65]. Salinity had a visible impact on B. napus seed germination (Supplementary Figure S5) and the growth of 6-day-old rapeseed seedlings (Supplementary Figure S6). The germination ratio was visibly decreased even in 50 mM NaCl whereas in the presence of 200 mM NaCl less than half of the seeds germinated in comparison to the control (seeds germinated in water). The length of root and hypocotyl, as well as the fresh and dry biomass of B. napus seedlings, significantly decreased in the presence of salt (Supplementary Figure S6) and the most affected by NaCl was hypocotyl growth (Supplementary Table S3).
The potential involvement of RSH genes and alarmones in the plant response to salt stress has been shown previously [26,43,44,60]. In order to gain more insight into the possible physiological roles of BnRSHs, the expression of four selected B. napus RSH genes (RSH1_b, RSH2_b, RSH3_a, CRSH) was analysed using sqRT-PCR in seedling organs (Figure 7) in response to salt stress, and in response to the presence of PGPR bacteria (Figure 8). BnRSH genes were differentially expressed in cotyledons and roots, i.e., BnRSH1 and BnRSH2 genes were highly expressed, while BnRSH3 and BnCRSH mRNAs were expressed at a lower level in both organs.
Using histochemical staining of GUS activity, it was shown that in Arabidopsis, AtRSH1 and AtRSH3 were highly expressed in hypocotyls and leaves, whereas AtRSH2 and AtCRSH were expressed in leaves. In the roots of seedlings only AtRSH2 was expressed, whereas in the roots of mature plants, AtRSH3 was also expressed [26]. Using RT-PCR, high expression of AtRSH1 and AtRSH3, and low expression of AtRSH2 in shoots, were also shown. In the roots, AtRSH2 and AtRSH3 were highly expressed, whereas AtRSH1 was expressed at a low level. AtCRSH was not tested in this study [66]. In rice, OsCRSH was expressed both in roots and shoots, however, in roots at a lower level than in shoots [31]. In contrast, in the cotyledons of I. nil seedlings, RSH1, RSH2, and CRSH were equally highly expressed, whereas in roots, RSH2 was highly expressed, RSH1 was expressed at the low level, and no expression of CRSH was detected [25].
In general, salinity stress had no significant effect on the expression of BnRSH genes in cotyledons and roots (Figure 8). The levels of BnRSH2 and BnCRSH transcripts in cotyledons, and the levels of BnRSH1 and BnCRSH in roots, slightly increased under salinity stress as compared with control plants, and the differences were statistically significant (Supplementary Tables S5, S6, S10 and S11). Interestingly, previous studies showed that A. thaliana treated with 250 mM NaCl exhibited increased AtRSH2 expression, but that salt had no impact on the expression of AtRSH1, AtRSH3, and AtCRSH [26], whereas, in another study, treatment with 250 mM NaCl significantly increased both AtRSH2 and AtRSH3 transcript levels, decreased the amount of AtCRSH mRNA, and had no impact on AtRSH1 expression [57]. Similarly, Prusińska et al. [25] showed that salt stress (300 mM NaCl) elevated the InRSH2 transcript level, whereas both InRSH1 and InCRSH did not show substantial changes in 5-day-old I. nil seedlings. Although, in promoters of BnRSH genes, several putative regulatory cis-elements involved in response to varied abiotic stresses, possibly including salinity stress, have been identified (Supplementary Table S1), the stable expression of BnRSHs in response to salt has been observed. This may be due to the concentrations of NaCl used in this study. Using an NaCl solution, up to 200 mM mimics non saline, slightly saline, and medium saline soils, whereas a concentration above 250 mM is typical for highly saline soils [67]. Moreover, the observed, almost changeless expression of BnRSH genes in response to NaCl, and the differences in expression of RSH genes response to salinity among plants, might be caused by the different developmental stages of the analysed plants, and/or varied sampling time points.
The effects of the rhizobacteria, S. plymuthica, S. liquefaciens, and M. timonae, on the expression of BnRSHs in leaves and roots was investigated (Figure 8). Using plant growth- promoting bacteria to improve plant tolerance to environmental stresses, including salt stress, in order to obtained a high yield even in adverse environmental conditions, is considered an economically and environmentally friendly approach [9]. Earlier reports have shown that PGPR bacteria mitigate salt stress via varied mechanisms including the production of indole acetic acid (IAA) [6], induction of potassium and calcium accumulation in plants, increased content of osmolytes including proline [68], and activation of plant antioxidant enzymes [69]. Using two-way ANOVA, significant interactions between salt concentration and species of bacteria for all analysed genes, besides BnRSH2 in roots, has been found (Supplementary Tables S4–S11). Therefore, we examined the bacteria simple main effect, i.e., the differences between the expression of BnRSHs in plants inoculated with different bacteria, for each salt concentration. Among all analysed bacteria S. plymuthica had the greatest impact on the expression of all BnRSH genes in all tested salt concentrations, both in cotyledons and roots. The expression of BnRSH1 was upregulated by S. plymuthica and S. liquefaciens in both cotyledons and roots, whereas M. timonae increased the expression of BnRSH1 in roots only (Figure 8). S. plymuthica increased the expression of BnRSH2 and BnRSH3 in cotyledons and roots, while S. liquefaciens increased the expression of BnRSH2 in roots only. The expression of BnCRSH in roots is mostly unaffected by PGPR bacteria, whereas S. plymuthica and S. liquefaciens induced the expression of BnCRSH in cotyledons (Figure 8). In response to salt stress, BnRSH gene expression is elevated in S. plymuthica and S. liquefaciens inoculated plants, whereas M. timonae inoculated plants did not show substantial changes as compared with control plants (without bacteria but treated with NaCl at the same concentration). For all BnRSH genes the highest level of expression was observed in plants inoculated with S. plymuthica (Figure 8). There is little data in the literature about the possible relation between (p)ppGpp and PGPR bacteria. Szymańska et al. [5] showed changes in the expression of BnRSH1 and BnRSH3 in roots of oilseed rape growing in the presence of the halotolerant PGPR bacterium Pseudomonas stutzeri ISE12 under salt stress. Increased expression of plant RSH genes was also demonstrated in response to pathogen attack. It was found that the infection of tobacco plants with the bacterial Erwinia carotovora pathogen leads to a 10-fold increase in the NtRSH2 protein level [44].
S. plymuthica used in this study is characterized by high metabolic activity; it is able to biodegrade plastic in compost and agricultural soil and stimulate the growth of B. napus, Miscanthus x giganteus, and Salix viminalis [70,71]. It was shown that several salt-tolerant strains of S. plymuthica improved cucumber biomass and yield via synthesis of IAA [72]. S. liquefaciens improved salt stress tolerance and plant growth in maize and rape [6]. M. timonae colonizes the rhizosphere, roots and leaves, and is a growth promoter via the production of IAA and siderophores in various plant species [73]. Our research clearly showed changes in mRNA levels of BnRSHs grown in the presence of the strains S. liquefaciens and S. plymuthica, but not in the presence of M. timonae which suggests that some PGPR bacteria might also improve plant growth under salt stress via the stringent response pathway.

3. Materials and Methods

3.1. In Silico Analysis of B. napus, B. olearacea, B. rapa, C. sativa, and R. sativus RSH Genes and Proteins

The RSH1, RSH2, RSH3, and CRSH in the plant genomes selected for this study from Brassicaceae family genes have been identified using A. thaliana RSH cDNA sequences (AtRSH1, AtRSH2, AtRSH3, and AtCRSH) as queries. A search was performed using BLASTN (Basic Local Alignment Search Tool) using the NCBI (ncbi.nlm.nih.gov, accessed on 10 May 2021) nucleotide database. The analysis of the intron-exon organisation was carried out using the CIWOG tool (http://peroxibase.toulouse.inra.fr/tools/ciwog_search_form, accessed on 15 May 2021) [74]. The putative amino acid sequences were then obtained from the NCBI protein database. For primary and secondary structure predictions of RSH proteins InterProScan (https://www.ebi.ac.uk/interpro/search/sequence/, accessed on 23 May 2021), Conserved Domain Search (https://www.ncbi.nlm.nih.gov/Structure/cdd/wrpsb.cgi, accessed on 23 May 2021), and PSIPRED (http://bioinf.cs.ucl.ac.uk/psipred/, accessed on 24 May 2021) were utilized. Clustal Omega was used for multiple sequence alignments (http://www.clustal.org/omega/, accessed on 27 May 2021) [75]. For calculation of molecular mass and pI of putative RSH proteins the Compute pI/Mw tool (https://web.expasy.org/compute_pi/, accessed on 13 June 2021) was utilised. TargetP (http://www.cbs.dtu.dk/services/TargetP/, accessed on 14 June 2021) [76,77] was used to predict subcellular localization of analysed RSH proteins. The phylogenetic analysis was caried out in MEGA7 software [78,79] using the neighbour-joining method [80].
The promoter regions of BnRSH genes were analysed using the PlantCARE database (http://bioinformatics.psb.ugent.be/webtools/plantcare/html/, accessed on 10 May 2021) [59]. For each BnRSH gene a 1500-bp long fragment including promoter and 5′UTR of genomic DNA was retrieved from the NCBI GenBank (http://www.ncbi.nlm.nih.gov/genbank/, accessed on 5 May 2021).

3.2. Bacterial Strains

Three bacterial strains: Massilia timonae [81], Serratia liquefaciens [82], and Serratia plymuthica [71,83], obtained from the collection of Professor Katarzyna Hrynkiewicz from the Department of Microbiology at the Nicolaus Copernicus University in Toruń, were used in the experiments. Bacteria were grown in R2A (Difco, Franklin Lakes, NJ, USA) liquid medium (18 g/L) at 24 °C for 24 h. The optical density of bacterial culture was checked spectrophotometrically at λ = 600 nm (SmartSpec Plus, BioRad, Hercules, CA, USA) and adjusted to the value of 5 × 10⁶ c.f.u./cm3 [8].

3.3. Plant Material

Seeds of the B. napus L. winter cultivar ‘Harry’ (Obrol Company, Kruszewnia, Poland) were surface sterilized with a mixture of 30% hydrogen peroxide and 96% ethanol (1:1, v/v) for 3 min and rinsed at least six times with sterile distilled water. The seeds were inoculated with a bacterial suspension, prepared as described above, and incubated for 10 min, with shaking, at room temperature. Non-inoculated (control) and inoculated seeds were placed in Petri dishes on filter paper moistened with 5 mL of sterile water (control) and 50, 100, 150, and 200 mM NaCl.
To analyse the impact of NaCl on B. napus seed germination and seedling growth, seeds were incubated in 16 h darkness/8 h light photoperiod at 24 °C for 6 days. The number of germinated seeds was checked after 14 h, 17 h, 20 h, 24 h, and 48 h of the start of experiment. The length of the hypocotyl and roots of 6-day-old seedlings were measured. Moreover, the fresh mass of 10 6-day-old seedlings was determined, and after drying (80 °C for 24 h) the dry mass of 10 seedlings was determined.
For BnRSH gene expression analysis, seeds were incubated for a 16 h darkness/8 h light photoperiod at 24 °C for 6 days. Cotyledons and roots of 6-day-old seedlings were frozen in liquid nitrogen and stored at −80 °C until RNA isolation was performed. The experiments were performed in triplicates.

3.4. Expression Analysis of BnRSH Genes

Total RNA was extracted from the B. napus organs using TRI Reagent (Sigma-Aldrich, Poznań, Poland), according to the manufacturer’s protocol. RNA was analysed by spectrophotometric measurement and gel electrophoresis in 1% agarose gel in 1x TAE (Tris-Acetate-EDTA) buffer stained with ethidium bromide. Prior cDNA synthesis from 1 μg of RNA genomic DNA was removed using RNAse free DNase I (Thermo Fisher Scientific, Waltham, MA, USA). Further oligo(dT)18 primer and RevertAid reverse transcriptase (Thermo Fisher Scientific, Waltham, MA, USA) were used for cDNA synthesis, in accordance with the protocol described in [84].
Semi-quantitative RT-PCR (sqRT-PCR) assays were performed to evaluate the effects of NaCl and/or the presence of PGPR on mRNA level of RSH genes. For each pair of primers, the PCR conditions, including the concentration of primers, DNA polymerase, and Mg2+, annealing temperature, and the number of cycles, were optimised according to [85]. The relative expression level of BnRSH1, BnRSH2, BnRSH3, and CRSH genes, was expressed as a ratio of the amount of PCR product for analysed gene to the amount of PCR product for the reference gene. B. napus actin-7 (BnAc, NCBI GenBank accession no. XM_013858992.2) was used as a reference gene. The PCR reaction mixture contained: 1.25 U of OptiTaq DNA polymerase (EURx, Gdańsk, Poland), 1.5 μL of cDNA as the template, 0.15 µM of each primer, and 1.5 mM MgCl2, in a total reaction volume of 20 μL. Primers are listed in Table 2. The thermal cycling conditions were as follows: 95 °C for 30 s, 54 °C (BnRSH2, BnRSH3), 52 °C (BnCRSH), or 58 °C (BnRSH1) for 40 s, and 72 °C for 40 s for 26 cycles (BnAc), 39xcycles (BnRSH1), 33 cycles (BnRSH2, BnRSH3), and 37 cycles (BnCRSH). Products of sqRT-PCR were separated on a 1.5% agarose gel with EtBr in TAE buffer and quantified by intensity using the ImageGauge 3.46. software (FujiFilm, Tokyo, Japan). Each reaction was repeated three times.

3.5. Statistical Analysis

Statistical differences of BnRSH gene expression data were assessed using one-way ANOVA followed by Tukey’s honest significance test (for comparison of BnRSHs expression in cotyledons and roots) or two-way ANOVA test followed by Scheffe post-hoc test (for comparison of BnRSHs expression in response to salt, and the presence of PGPR bacteria). Results are means ± SD. For one way ANOVA, a p-value < 0.05 was considered statistically significant. For two-way ANOVA, p-values < 0.05 (*), < 0.01 (**), and < 0.001 (***), were considered statistically significant. Statistical analyses were performed using R version 4.1.1 and packages DescTools and ggplot2 (r-project.org, accessed on 15 September 2021).

4. Conclusions

Our results suggest that in plants belonging to the Brassicaceae family the stringent response is coordinated by numerous isoforms of RSH proteins. There is a high level of conservancy between the respective orthologs of RSH genes and proteins analysed in the study plant species. Plants possess higher number of genes encoding synthetases and/or hydrolases of alarmones than bacteria, which is especially apparent for polyploid plants, e.g., B. napus. The presence of multiple isoforms that underwent subfunctionalization highlights the need of rigorous control of (p)ppGpp-dependent pathways in plants. The mechanisms of the plant stringent response are beginning to emerge, but the specific roles of RSH isoforms are still puzzling. An in silico promoter analysis of BnRSH genes revealed the presence of several putative regulatory elements, and indicated that, (i) RSH gene expression might be regulated by multiple abiotic and biotic factors, (ii) RSH proteins might be involved in varied metabolic pathways, (iii) the possible roles of RSH1, RSH2/3, and CRSH, seems to be diversified. The wet-lab expression analysis of selected B. napus RSH genes in response to salt stress supported the idea of different physiological roles of plant RSH isoforms. Moreover, we showed that the plant stringent response might be one of the pathways via which PGPR bacteria promote plant growth and development; however this seems to be bacteria species-dependent.

Supplementary Materials

The following are available online at https://www.mdpi.com/article/10.3390/ijms221910666/s1.

Author Contributions

Conceptualization, G.B.D.; formal analysis, W.T.-M., and A.M.-A.; investigation, S.T. and W.T.-M.; data curation, A.M.-A.; writing—original draft preparation, S.T. and A.M.-A.; writing—review and editing, A.M.-A. and G.B.D.; supervision, G.B.D.; funding acquisition, G.B.D. All authors have read and agreed to the published version of the manuscript.

Funding

This research was funded by the statutory operations of Nicolaus Copernicus University in Toruń.

Institutional Review Board Statement

Not applicable.

Informed Consent Statement

Not applicable.

Data Availability Statement

Not applicable.

Acknowledgments

The authors thank Milena Kulasek MSc for help with statistical analysis.

Conflicts of Interest

The authors declare no conflict of interest. The funders had no role in the design of the study, in the collection, analyses, or interpretation of data, in the writing of the manuscript, or in the decision to publish the results.

References

  1. Gupta, S.K. Breeding Oilseed Crops for Sustainable Production: Opportunities and Constraints; Elsevier Inc.: Amsterdam, The Netherlands, 2015; ISBN 9780128014691. [Google Scholar]
  2. Warner, D.J.; Lewis, K.A. Evaluation of the risks of contaminating low erucic acid rapeseed with high erucic rapeseed and identification of mitigation strategies. Agriculture 2019, 9, 190. [Google Scholar] [CrossRef] [Green Version]
  3. Wu, D.; Liang, Z.; Yan, T.; Xu, Y.; Xuan, L.; Tang, J.; Zhou, G.; Lohwasser, U.; Hua, S.; Wang, H.; et al. Whole-genome resequencing of a worldwide collection of rapeseed accessions reveals the genetic basis of ecotype divergence. Mol. Plant 2019, 12, 30–43. [Google Scholar] [CrossRef] [PubMed] [Green Version]
  4. Chalhoub, B.; Denoeud, F.; Liu, S.; Parkin, I.A.P.; Tang, H.; Wang, X.; Chiquet, J.; Belcram, H.; Tong, C.; Samans, B.; et al. Early allopolyploid evolution in the post-neolithic Brassica napus oilseed genome. Science 2014, 345, 950–953. [Google Scholar] [CrossRef] [PubMed] [Green Version]
  5. Szymańska, S.; Dąbrowska, G.B.; Tyburski, J.; Niedojadło, K.; Piernik, A.; Hrynkiewicz, K. Boosting the Brassica napus L. tolerance to salinity by the halotolerant strain Pseudomonas stutzeri ISE12. Environ. Exp. Bot. 2019, 163, 55–68. [Google Scholar] [CrossRef]
  6. El-Esawi, M.A.; Alaraidh, I.A.; Alsahli, A.A.; Alzahrani, S.M.; Ali, H.M.; Alayafi, A.A.; Ahmad, M. Serratia liquefaciens KM4 improves salt stress tolerance in maize by regulating redox potential, ion homeostasis, leaf gas exchange and stress-related gene expression. Int. J. Mol. Sci. 2018, 19, 3310. [Google Scholar] [CrossRef] [Green Version]
  7. Isayenkov, S.V.; Maathuis, F.J.M. Plant salinity stress: Many unanswered questions remain. Front. Plant Sci. 2019, 10, 80. [Google Scholar] [CrossRef] [Green Version]
  8. Dąbrowska, G.B.; Zdziechowska, E.; Hrynkiewicz, K. Evaluation of potential suitability of Rhizobacteria for phytodesalination of soils. Environ. Pollut. Control 2016, 38, 9–14. [Google Scholar]
  9. Shilev, S. Plant-growth-promoting bacteria mitigating soil salinity stress in plants. Appl. Sci. 2020, 10, 7326. [Google Scholar] [CrossRef]
  10. Bal, H.B.; Nayak, L.; Das, S.; Adhya, T.K. Isolation of ACC deaminase producing PGPR from rice rhizosphere and evaluating their plant growth promoting activity under salt stress. Plant Soil 2013, 366, 93–105. [Google Scholar] [CrossRef]
  11. Kohler, J.; Hernández, J.A.; Caravaca, F.; Roldán, A. Induction of antioxidant enzymes is involved in the greater effectiveness of a PGPR versus AM fungi with respect to increasing the tolerance of lettuce to severe salt stress. Environ. Exp. Bot. 2009, 65, 245–252. [Google Scholar] [CrossRef]
  12. Cordero, I.; Balaguer, L.; Rincón, A.; Pueyo, J.J. Inoculation of tomato plants with selected PGPR represents a feasible alternative to chemical fertilization under salt stress. J. Plant Nutr. Soil Sci. 2018, 181, 694–703. [Google Scholar] [CrossRef]
  13. Cashel, M.; Gallant, J. Two compounds implicated in the function of the RC gene of Escherichia coli. Nature 1969, 224, 177–178. [Google Scholar] [CrossRef]
  14. Cashel, M.; Gentry, D.; VJ, H.; Vinella, D. The stringent response in: Escherichia coli and Salmonella typhimurium. Cell. Mol. Biol. 1996, 2, 1458–1496. [Google Scholar]
  15. Dabrowska, G.; Prusinska, J.; Goc, A. The stringent response-the mechanism of bacterial adaptive response to stress conditions. Adv. Biochem. 2006, 52, 87–93. [Google Scholar]
  16. Xiao, H.; Kalman, M.; Ikehara, K.; Zemel, S.; Glaser, G.; Cashel, M. Residual guanosine 3′,5′-bispyrophosphate synthetic activity of relA null mutants can be eliminated by spoT null mutations. J. Biol. Chem. 1991, 266, 5980–5990. [Google Scholar] [CrossRef]
  17. Berdychowska, J.; Boniecka, J.; Dąbrowska, G.B. The stringent response and its involvement in the actions of bacterial cells to stress. Adv. Microbiol. 2019, 58, 127–142. [Google Scholar] [CrossRef] [Green Version]
  18. Irving, S.E.; Choudhury, N.R.; Corrigan, R.M. The stringent response and physiological roles of (pp)pGpp in bacteria. Nat. Rev. Microbiol. 2020, 19, 256–271. [Google Scholar] [CrossRef]
  19. Mittenhuber, G. Comparative genomics and evolution of genes encoding bacterial (p)ppGpp synthetases/hydrolases (the Rel, RelA and SpoT proteins). J. Mol. Microbiol. Biotechnol. 2001, 3, 585–600. [Google Scholar]
  20. Heizmann, P.; Howell, S.H. Synthesis of ppGpp and chloroplast ribosomal RNA in Chlamydomonas reinhardi. Biochim. Biophys. Acta Nucleic Acids Protein Synth. 1978, 517, 115–124. [Google Scholar] [CrossRef]
  21. Van der Biezen, E.A. Arabidopsis RelA/SpoT homologs implicate (p)ppGpp in plant signaling. Proc. Natl. Acad. Sci. USA 2000, 97, 3747–3752. [Google Scholar] [CrossRef]
  22. Dąbrowska, G.; Prusińska, J.; Goc, A. Identification of RSH gene cDNA (RelA/SpoT homolog) involved in Pharbitis nil response to stress condition. Adv. Agric. Sci. Probl. Issues 2006, 509, 333–341. [Google Scholar]
  23. Dabrowska, G.; Prusińska, J.; Goc, A. Plant mechanism of an adaptive stress response homologous to bacterial stringent response. Adv. Biochem. 2006, 52, 94–100. [Google Scholar]
  24. Boniecka, J.; Prusińska, J.; Dąbrowska, G.B.; Goc, A. Within and beyond the stringent response-RSH and (p)ppGpp in plants. Planta 2017, 246, 817–842. [Google Scholar] [CrossRef] [Green Version]
  25. Prusińska, J.M.; Boniecka, J.; Dąbrowska, G.B.; Goc, A. Identification and characterization of the Ipomoea nil RelA/SpoT Homologs (InRSHs) and potential directions of their transcriptional regulation. Plant Sci. 2019, 284, 161–176. [Google Scholar] [CrossRef]
  26. Mizusawa, K.; Masuda, S.; Ohta, H. Expression profiling of four RelA/SpoT-like proteins, homologues of bacterial stringent factors, in Arabidopsis thaliana. Planta 2008, 228, 553–562. [Google Scholar] [CrossRef]
  27. Wolf, Y.I.; Aravind, L.; Grishin, N.V.; Koonin, E.V. Evolution of aminoacyl-tRNA synthetases-analysis of unique domain architectures and phylogenetic trees reveals a complex history of horizontal gene transfer events. Genome Res. 1999, 9, 689–710. [Google Scholar] [CrossRef]
  28. Brown, A.; Fernández, I.S.; Gordiyenko, Y.; Ramakrishnan, V. Ribosome-dependent activation of stringent control. Nature 2016, 534, 277–280. [Google Scholar] [CrossRef] [Green Version]
  29. Loveland, A.B.; Bah, E.; Madireddy, R.; Zhang, Y.; Brilot, A.F.; Grigorieff, N.; Korostelev, A.A. Ribosome-RelA structures reveal the mechanism of stringent response activation. eLife 2016, 5, 1–23. [Google Scholar] [CrossRef]
  30. Ito, D.; Ihara, Y.; Nishihara, H.; Masuda, S. Phylogenetic analysis of proteins involved in the stringent response in plant cells. J. Plant Res. 2017, 130, 625–634. [Google Scholar] [CrossRef]
  31. Tozawa, Y.; Nozawa, A.; Kanno, T.; Narisawa, T.; Masuda, S.; Kasai, K.; Nanamiya, H. Calcium-activated (p)ppGpp synthetase in chloroplasts of land plants. J. Biol. Chem. 2007, 282, 35536–35545. [Google Scholar] [CrossRef] [Green Version]
  32. Ono, S.; Suzuki, S.; Ito, D.; Tagawa, S.; Shiina, T.; Masuda, S. Plastidial (p)ppGpp synthesis by the Ca2+-dependent RelA–SpoT homolog regulates the adaptation of chloroplast gene expression to darkness in Arabidopsis. Plant Cell Physiol. 2020, 61, 2077–2086. [Google Scholar] [CrossRef] [PubMed]
  33. Sun, D.; Lee, G.; Lee, J.; Kim, H.; Rhee, H.; Park, S.; Kim, K.; Kim, Y.; Kim, B.; Hong, J.; et al. A metazoan ortholog of SpoT hydrolyzes ppGpp and functions in starvation responses. Nat. Struct. Mol. Biol. 2010, 17, 1188–1194. [Google Scholar] [CrossRef] [PubMed]
  34. Ito, D.; Kawamura, H.; Oikawa, A.; Ihara, Y.; Shibata, T.; Nakamura, N.; Asano, T.; Kawabata, S.-I.; Suzuki, T.; Masuda, S. ppGpp functions as an alarmone in metazoa. Commun. Biol. 2020, 3, 1–11. [Google Scholar] [CrossRef] [PubMed]
  35. Masuda, S. The stringent response in phototrophs. In Advances in Photosynthesis—Fundamental Aspects.; Najfpour, M., Ed.; InTech: Shanghai, China, 2012; pp. 487–500. ISBN 978-953-307-928-8. [Google Scholar]
  36. Atkinson, G.C.; Tenson, T.; Hauryliuk, V. The RelA/SpoT Homolog (RSH) superfamily: Distribution and functional evolution of ppGpp synthetases and hydrolases across the tree of life. PLoS ONE 2011, 6, e23479. [Google Scholar] [CrossRef] [Green Version]
  37. Dabrowska, G.; Mierek-Adamska, A.; Goc, A. Plant metallothioneins: Putative functions identified by promoter analysis in silico. Acta Biol. Crac. Ser. Bot. 2012, 54, 109–120. [Google Scholar] [CrossRef]
  38. Pan, Y.; Zhu, M.; Wang, S.; Ma, G.; Huang, X.; Qiao, C.; Wang, R.; Xu, X.; Liang, Y.; Lu, K.; et al. Genome-wide characterization and analysis of metallothionein family genes that function in metal stress tolerance in Brassica napus L. Int. J. Mol. Sci. 2018, 19, 2181. [Google Scholar] [CrossRef] [Green Version]
  39. Chen, J.; Gao, T.; Wan, S.; Zhang, Y.; Yang, J.; Yu, Y.; Wang, W. Genome-wide identification, classification and expression analysis of the HSP gene superfamily in tea plant (Camellia sinensis). Int. J. Mol. Sci. 2018, 19, 2633. [Google Scholar] [CrossRef] [Green Version]
  40. Yuan, D.; Li, W.; Hua, Y.; King, G.J.; Xu, F.; Shi, L. Genome-wide identification and characterization of the aquaporin gene family and transcriptional responses to boron deficiency in Brassica napus. Front. Plant Sci. 2017, 8, 1336. [Google Scholar] [CrossRef] [Green Version]
  41. Sugliani, M.; Abdelkefi, H.; Ke, H.; Bouveret, E.; Robaglia, C.; Caffarri, S.; Field, B. An ancient bacterial signaling pathway regulates chloroplast function to influence growth and development in Arabidopsis. Plant Cell 2016, 28, 661–679. [Google Scholar] [CrossRef] [Green Version]
  42. Xiong, L.; Lee, M.W.; Qi, M.; Yang, Y. Identification of defense-related rice genes by suppression subtractive hybridization and differential screening. Mol. Plant Microbe Interact. 2001, 14, 685–692. [Google Scholar] [CrossRef] [Green Version]
  43. Kim, T.H.; Ok, S.H.; Kim, D.; Suh, S.C.; Byun, M.O.; Shin, J.S. Molecular characterization of a biotic and abiotic stress resistance-related gene RelA/SpoT homologue (PepRSH) from pepper. Plant Sci. 2009, 176, 635–642. [Google Scholar] [CrossRef]
  44. Givens, R.M.; Lin, M.H.; Taylor, D.J.; Mechold, U.; Berry, J.O.; Hernandez, V.J. Inducible expression, enzymatic activity, and origin of higher plant homologues of bacterial RelA/SpoT stress proteins in Nicotiana tabacum. J. Biol. Chem. 2004, 279, 7495–7504. [Google Scholar] [CrossRef] [Green Version]
  45. Yamada, A.; Tsutsumi, K.; Tanimoto, S.; Ozeki, Y. Plant RelA/SpoT homolog confers salt tolerance in Escherichia coli and Saccharomyces cerevisiae. Plant Cell Physiol. 2003, 44, 3–9. [Google Scholar] [CrossRef] [Green Version]
  46. Morello, L.; Breviario, D. Plant spliceosomal introns: Not only cut and paste. Curr. Genom. 2008, 9, 227–238. [Google Scholar] [CrossRef] [Green Version]
  47. Frey, K.; Pucker, B. Animal, fungi, and plant genome sequences harbor different non-canonical splice sites. Cells 2020, 9, 458. [Google Scholar] [CrossRef] [Green Version]
  48. Wang, B.-B.; Brendel, V. Genomewide comparative analysis of alternative splicing in plants. Proc. Natl. Acad. Sci. USA 2006, 103, 7175–7180. [Google Scholar] [CrossRef] [Green Version]
  49. Jo, B.-S.; Choi, S.S. Introns: The functional benefits of introns in genomes. Genom. Inform. 2015, 13, 112. [Google Scholar] [CrossRef] [Green Version]
  50. Ren, X.Y.; Vorst, O.; Fiers, M.W.; Stiekema, W.J.; Nap, J.P. In plants, highly expressed genes are the least compact. Trends Genet. 2006, 22, 528–532. [Google Scholar] [CrossRef]
  51. Masuda, S.; Mizusawa, K.; Narisawa, T.; Tozawa, Y.; Ohta, H.; Takamiya, K.I. The bacterial stringent response, conserved in chloroplasts, controls plant fertilization. Plant Cell Physiol. 2008, 49, 135–141. [Google Scholar] [CrossRef] [Green Version]
  52. Maekawa, M.; Honoki, R.; Ihara, Y.; Sato, R.; Oikawa, A.; Kanno, Y.; Ohta, H.; Seo, M.; Saito, K.; Masuda, S. Impact of the plastidial stringent response in plant growth and stress responses. Nat. Plants 2015, 1, 1–7. [Google Scholar] [CrossRef]
  53. Sato, M.; Takahashi, T.; Ochi, K.; Matsuura, H.; Nabeta, K.; Takahashi, K. Overexpression of RelA/SpoT homologs, PpRSH2a and PpRSH2b, induces the growth suppression of the moss Physcomitrella patens. Biosci. Biotechnol. Biochem. 2015, 79, 36–44. [Google Scholar] [CrossRef] [PubMed]
  54. Takahashi, K.; Kasai, K.; Ochi, K. Identification of the bacterial alarmone guanosine 5′-diphosphate 3′-diphosphate (ppGpp) in plants. Proc. Natl. Acad. Sci. USA 2004, 101, 4320–4324. [Google Scholar] [CrossRef] [PubMed] [Green Version]
  55. Field, B. Green magic: Regulation of the chloroplast stress response by (p)ppGpp in plants and algae. J. Exp. Bot. 2018, 69, 2797–2807. [Google Scholar] [CrossRef] [PubMed] [Green Version]
  56. Yamburenko, M.V.; Zubo, Y.O.; Börner, T. Abscisic acid affects transcription of chloroplast genes via protein phosphatase 2C-dependent activation of nuclear genes: Repression by guanosine-3′-5′-bisdiphosphate and activation by sigma factor 5. Plant J. 2015, 82, 1030–1041. [Google Scholar] [CrossRef]
  57. Ito, D.; Kato, T.; Maruta, T.; Tamoi, M.; Yoshimura, K.; Shigeoka, S. Enzymatic and molecular characterization of Arabidopsis ppGpp pyrophosphohydrolase, AtNUDX26. Biosci. Biotechnol. Biochem. 2012, 76, 2236–2241. [Google Scholar] [CrossRef] [Green Version]
  58. Abdelkefi, H.; Sugliani, M.; Ke, H.; Harchouni, S.; Soubigou-Taconnat, L.; Citerne, S.; Mouille, G.; Fakhfakh, H.; Robaglia, C.; Field, B. Guanosine tetraphosphate modulates salicylic acid signalling and the resistance of Arabidopsis thaliana to Turnip mosaic virus. Mol. Plant Pathol. 2018, 19, 634–646. [Google Scholar] [CrossRef] [Green Version]
  59. Lescot, M.; Déhais, P.; Thijs, G.; Marchal, K.; Moreau, Y.; Van De Peer, Y.; Rouzé, P.; Rombauts, S. PlantCARE, a database of plant cis-acting regulatory elements and a portal to tools for in silico analysis of promoter sequences. Nucleic Acids Res. 2002, 30, 325–327. [Google Scholar] [CrossRef]
  60. Hernandez-Garcia, C.M.; Finer, J.J. Identification and validation of promoters and cis-acting regulatory elements. Plant Sci. 2014, 217–218, 109–119. [Google Scholar] [CrossRef] [Green Version]
  61. Chang, W.-C.; Lee, T.-Y.; Huang, H.-D.; Huang, H.-Y.; Pan, R.-L. PlantPAN: Plant promoter analysis navigator, for identifying combinatorial cis-regulatory elements with distance constraint in plant gene groups. BMC Genom. 2008, 9, 1–14. [Google Scholar] [CrossRef] [Green Version]
  62. Yamaguchi-Shinozaki, K.; Shinozaki, K. Organization of cis-acting regulatory elements in osmotic- and cold-stress-responsive promoters. Trends Plant Sci. 2005, 10, 88–94. [Google Scholar] [CrossRef]
  63. Ihara, Y.; Ohta, H.; Masuda, S. A highly sensitive quantification method for the accumulation of alarmone ppGpp in Arabidopsis thaliana using UPLC-ESI-qMS/MS. J. Plant Res. 2015, 128, 511–518. [Google Scholar] [CrossRef]
  64. Etesami, H.; Noori, F. Soil Salinity as a Challenge for Sustainable Agriculture and Bacterial-Mediated Alleviation of Salinity Stress in Crop Plants BT-Saline Soil-based Agriculture by Halotolerant Microorganisms; Kumar, M., Etesami, H., Kumar, V., Eds.; Springer Singapore: Singapore, 2019; pp. 1–22. ISBN 978-981-13-8335-9. [Google Scholar]
  65. Ashraf, M.; McNeilly, T. Salinity tolerance in Brassica oilseeds. Crit. Rev. Plant Sci. 2004, 23, 157–174. [Google Scholar] [CrossRef]
  66. Chen, J.; Bang, W.Y.; Lee, Y.; Kim, S.; Lee, K.W.; Kim, S.W.; Son, Y.S.; Kim, D.W.; Akhter, S.; Bahk, J.D. AtObgC-AtRSH1 interaction may play a vital role in stress response signal transduction in Arabidopsis. Plant Physiol. Biochem. 2014, 74, 176–184. [Google Scholar] [CrossRef]
  67. Brouwer, C.; Goffeau, A.; Heibloem, M. Irrigation Water Management: Training Manual No. 1—Introduction to Irrigation; FAO: Rome, Italy, 1985. [Google Scholar]
  68. Nawaz, A.; Shahbaz, M.; Asadullah; Imran, A.; Marghoob, M.U.; Imtiaz, M.; Mubeen, F. Potential of salt tolerant PGPR in growth and yield augmentation of wheat (Triticum aestivum L.) under saline conditions. Front. Microbiol. 2020, 11, 2019. [Google Scholar] [CrossRef]
  69. Hashem, A.; Abd_Allah, E.F.; Alqarawi, A.A.; Al-Huqail, A.A.; Wirth, S.; Egamberdieva, D. The interaction between arbuscular mycorrhizal fungi and endophytic bacteria enhances plant growth of Acacia gerrardii under salt stress. Front. Microbiol. 2016, 7, 1089. [Google Scholar] [CrossRef] [Green Version]
  70. Janczak, K.; Hrynkiewicz, K.; Znajewska, Z.; Dąbrowska, G. Use of rhizosphere microorganisms in the biodegradation of PLA and PET polymers in compost soil. Int. Biodeterior. Biodegrad. 2018, 130, 65–75. [Google Scholar] [CrossRef]
  71. Janczak, K.; Dąbrowska, G.B.; Raszkowska-Kaczor, A.; Kaczor, D.; Hrynkiewicz, K.; Richert, A. Biodegradation of the plastics PLA and PET in cultivated soil with the participation of microorganisms and plants. Int. Biodeterior. Biodegrad. 2020, 155, 105087. [Google Scholar] [CrossRef]
  72. Egamberdieva, D.; Wirth, S.J.; Alqarawi, A.A.; Abd-Allah, E.F.; Hashem, A. Phytohormones and beneficial microbes: Essential components for plants to balance stress and fitness. Front. Microbiol. 2017, 8, 2104. [Google Scholar] [CrossRef]
  73. Miguel, P.S.B.; de Oliveira, M.N.V.; Delvaux, J.C.; de Jesus, G.L.; Borges, A.C.; Tótola, M.R.; Neves, J.C.L.; Costa, M.D. Diversity and distribution of the endophytic bacterial community at different stages of Eucalyptus growth. Antonie van Leeuwenhoek Int. J. Gen. Mol. Microbiol. 2016, 109, 755–771. [Google Scholar] [CrossRef]
  74. Wilkerson, M.D.; Ru, Y.; Brendel, V.P. Common introns within orthologous genes: Software and application to plants. Brief. Bioinform. 2009, 10, 631–644. [Google Scholar] [CrossRef] [Green Version]
  75. Sievers, F.; Wilm, A.; Dineen, D.; Gibson, T.J.; Karplus, K.; Li, W.; Lopez, R.; McWilliam, H.; Remmert, M.; Söding, J.; et al. Fast, scalable generation of high-quality protein multiple sequence alignments using Clustal Omega. Mol. Syst. Biol. 2011, 7. [Google Scholar] [CrossRef]
  76. Emanuelsson, O.; Nielsen, H.; Brunak, S.; Von Heijne, G. Predicting subcellular localization of proteins based on their N-terminal amino acid sequence. J. Mol. Biol. 2000, 300, 1005–1016. [Google Scholar] [CrossRef] [Green Version]
  77. Emanuelsson, O.; Brunak, S.; von Heijne, G.; Nielsen, H. Locating proteins in the cell using TargetP, SignalP and related tools. Nat. Protoc. 2007, 2, 953–971. [Google Scholar] [CrossRef]
  78. Tamura, K.; Dudley, J.; Nei, M.; Kumar, S. MEGA4: Molecular Evolutionary Genetics Analysis (MEGA) software version 4.0. Mol. Biol. Evol. 2007, 24, 1596–1599. [Google Scholar] [CrossRef]
  79. Kumar, S.; Nei, M.; Dudley, J.; Tamura, K. MEGA: A biologist-centric software for evolutionary analysis of DNA and protein sequences. Brief. Bioinform. 2008, 9, 299–306. [Google Scholar] [CrossRef] [Green Version]
  80. Saitou, N.; Nei, M. The neighbor-joining method: A new method for reconstructing phylogenetic trees. Mol. Biol. Evol. 1987, 4, 406–425. [Google Scholar] [CrossRef] [PubMed]
  81. Hrynkiewicz, K.; Złoch, M.; Kowalkowski, T.; Baum, C.; Niedojadło, K.; Buszewski, B. Strain-specific bioaccumulation and intracellular distribution of Cd2+ in bacteria isolated from the rhizosphere, ectomycorrhizae, and fruitbodies of ectomycorrhizal fungi. Environ. Sci. Pollut. Res. 2015, 22, 3055–3067. [Google Scholar] [CrossRef] [Green Version]
  82. Hrynkiewicz, K.; Baum, C.; Leinweber, P. Density, metabolic activity, and identity of cultivable rhizosphere bacteria on Salix viminalis in disturbed arable and landfill soils. J. Plant Nutr. Soil Sci. 2010, 173, 747–756. [Google Scholar] [CrossRef]
  83. Janczak, K.; Dąbrowska, G. Bacteria able to polylactide and polycaprolactone biodegradation. Przem. Chem. 2018, 97, 435–438. [Google Scholar] [CrossRef]
  84. Mierek-Adamska, A.; Kotowicz, K.; Goc, A.; Boniecka, J.; Berdychowska, J.; Dąbrowska, G.B. Potential involvement of rapeseed (Brassica napus L.) metallothioneins in the hydrogen peroxide-induced regulation of seed vigour. J. Agron. Crop Sci. 2019, 205, 598–607. [Google Scholar] [CrossRef]
  85. Marone, M.; Mozzetti, S.; De Ritis, D.; Pierelli, L.; Scambia, G. Semiquantitative RT-PCR analysis to assess the expression levels of multiple transcriptsfrom the same sample. Biol. Proced. Online 2001, 3, 19. [Google Scholar] [CrossRef] [PubMed] [Green Version]
Figure 1. Chromosomal localization of RSH genes in A. thaliana, B. napus, B. oleracea, B. rapa and C. sativa.
Ijms 22 10666 g001
Figure 2. Intron-exon structure of RSH genes in A. thaliana and B. napus. White rectangles indicate UTRs, and black rectangles indicate coding sequence. Intron positions are marked by lines. The analysis was performed using the CIWOG tool.
Ijms 22 10666 g002
Figure 3. Predicted primary structures of RSH1, RSH2/RSH3, and CRSH proteins from A. thaliana and B. napus. HD (hd contains HD-SE substitution) (p)ppGpp hydrolase domain; SYNTH (synth contains G-S substitution) (p)ppGpp synthase domain; ACT aspartate kinase chorismate mutase TyrA domain; EF Ca2+-binding domain; TGS: threonyl-tRNA synthetase, GTPase, SpoT domain.
Ijms 22 10666 g003
Figure 4. Amino acid alignments for the (p)ppGpp hydrolase HD (upper part) and synthetase SYNTH (lower part) domains of the RSH1, RSH2, RSH3, and CRSH proteins in A. thaliana and B. napus. In the HD domain the His (H) and Asp (D), important for its hydrolysis activity, are highlighted in blue. In the SYNTH domain the Gly (G), important for its synthetase activity, is highlighted in pink.
Ijms 22 10666 g004
Figure 5. The phylogenetic analysis of RSH proteins based on predicted amino acid sequences given in Table 1. The evolutionary history was inferred using the Neighbor–Joining method by MEGA7.0 software. The optimal tree, with the sum of branch length = 3.01054035, is shown. The tree is drawn to scale, with branch lengths in the same units as those of the evolutionary distances used to infer the phylogenetic tree. The evolutionary distances were computed using the Poisson-correction method and are in the units of the number of amino acid substitutions per site. All positions containing gaps and missing data were eliminated. B. napus RSH sequences are indicated in bold.
Ijms 22 10666 g005
Figure 6. Frequencies of putative cis-regulatory elements in B. napus RSH genes (upper pie chart), and in BnRSH1, BnRSH2/3, and CRSH genes (lower pie charts). Pie charts depict the cis-regulatory elements categorized in seven types according to their predicted functions.
Ijms 22 10666 g006
Figure 7. Expression analysis of BnRSH in the B. napus cotyledons and roots of 6-day-old seedlings. Chart shows the relative transcript level of analysed genes (BnRSH1_b, BnRSH2_b, BnRSH3_a, and BnCRSH) with respect to the expression of the reference gene (BnAc). Different letters indicate statistically significant changes according to one-way ANOVA test at p < 0.05. Bars represents means ± SD.
Ijms 22 10666 g007
Figure 8. Expression analysis of BnRSHs in salt stress and in the presence of PGPR bacteria using sqRT-PCR. Charts show the relative transcript level of BnRSH1_b, BnRSH2_b, BnRSH3_a, and BnCRSH genes with respect to the expression of a reference gene (BnAc). Bars represent means ± SD. Control (black bars) are plants grown in in different NaCl concentrations (0 mM, 50 mM, 100 mM, 150 mM, and 200 mM NaCl) but without inoculation with bacteria. Mt (green bars)—M. timonae, Sl (red bars)—S. liquefaciens, Sp (yellow bars)—S. plymuthica. Statistical analysis was performed using two-way ANOVA followed by Scheffe post-hoc test. Asterisks indicate statistically significant differences in comparison to the control (i.e., expression of a particular RSH gene in plants grown in the same concentration of salt but without bacteria—black bars) at p-value < 0.001 (***), p-value < 0.01 (**), and p-value < 0.05 (*). Full statistical analysis data are available as Supplementary Materials (Supplementary Tables S4–S11).
Ijms 22 10666 g008
Table 1. RSH genes present in the genomes of A. thaliana, B. napus, B. oleracea, B. rapa, C. sativa, and R. sativus. As a comparison, bacterial proteins of the stringent response for E. coli, RelA and SpoT, and for Streptomyces coelicolor, Rel, were included. The number of exons and introns, the length of CDS, the length, molecular weight, pI, and predicted subcellular localization of putative RSH proteins, are also given. Asterisks (*) indicate the B. napus (RSH1_b, RSH2_b, RSH3_a, and CRSH) genes that were further analysed for their expression level (vide infra).
SpeciesGenesGene IDTranscript IDCDS
(bp)
Chromosome LocationProtein IDAApIMw
(kD)
IntronsExonsPredicted Transfer Peptide (Probability)
A. thalianaRSH1828096NM_116459.426554NP_567226.18836.6598.582324cTP (0.455), mTP (0.0002), tlTP (0.0051), other (0.5393)
RSH2820619NM_112259.521303NP_188021.17096.8979.0556cTP (0.6081), mTP (0.0003), tlTP (0.0846), other (0.3047)
RSH3841853NM_104291.821481NP_564652.27156.6679.7256cTP (0.7887), mTP (0.0024), tlTP (0.0397), other (0.1669)
CRSH821012NM_001338291.117523NP_001327079.15986.1468.2834cTP (0.0708), mTP (0.1949), tlTP (0.0002), other (0.7341)
B. napusRSH1_a106345251XM_013784481.22652unknownXP_013639935.18836.6498.562324cTP (0.3786), mTP (0.0002), tlTP (0.0059), other (0.6149)
RSH1_b *106399012XM_013839498.22565A5XP_013694952.18546.6095.882223cTP (0.4978), mTP (0.0025), tlTP(0.004), other (0.4957)
RSH1_c106436227XM_013877186.22652A8XP_013732640.18836.6498.582324cTP (0.3786), mTP (0.0002), tlTP(0.0059), other (0.6149)
RSH1_d106365508XM_013804925.22652A9XP_013660379.18836.4898.552324cTP (0.5232), mTP (0.0005), tlTP(0.0171), other (0.459)
RSH1_e106362473XM_013802370.21860A9XP_013657824.16196.6269.261920cTP (0.5232), mTP (0.0005), tlTP(0.0171), other (0.459)
RSH1_f106381614XM_013821535.22640C2XP_013676989.18796.6098.442324cTP (0.2021), mTP (0.0011), tlTP(0.0043), other (0.7924)
RSH2_a106452255XM_013894318.22055A5XP_013749772.26846.6777.1356cTP (0.2425), mTP (0.0001), tlTP(0.0058), other (0.7498)
RSH2_b *111206471XM_022703426.12091C5XP_022559147.16966.5677.9856cTP (0.4948), mTP (0.0003), tlTP(0.0816), other (0.4229)
RSH3_a *106345829XM_013785013.2861A6XP_013640467.12866.0431.1112cTP (0.6255), mTP (0.0001), tlTP(0.0181), other (0.3557)
RSH3_b106431664XM_013872470.22133C6XP_013727924.17106.5078.7856cTP (0.7621), mTP (0.0005), tlTP(0.0889), other (0.1473)
RSH3_c106348454XM_022704818.12109C6XP_022560539.17026.7778.0767cTP (0.5288), mTP (0.0001), tlTP(0.0244), other (0.446)
RSH3
_pseudo
106345828--A6-------
CRSH *106389210XM_013829418.21743C3XP_013684872.15806.0365.8334cTP (0.2211), mTP (0.0648), tlTP(0.0095), other (0.7045)
CRSH
_pseudo
106439579--A3-------
B. oleraceaRSH1_a106327624XM_013765826.12628C2XP_013621280.18756.5297.872324cTP (0.1379), mTP (0.0016), tlTP(0.0142), other (0.8462)
RSH1_b106318815XM_013756949.12652C9XP_013612403.18836.6498.552324cTP (0.3786), mTP (0.0002), tlTP(0.0059), other (0.6149)
RSH2106295267XM_013731123.12091C5XP_0135865776966.5677.9856cTP (0.4948), mTP (0.0003), tlTP(0.0816), other (0.4229)
RSH3_a106300657XM_013736852.12109C6XP_013592306.17026.7778.0756cTP (0.5288), mTP (0.0001), tlTP(0.0244), other (0.446)
RSH3_b106300381XM_013736509.12133C6XP_013591963.17106.5078.7856cTP (0.7621), mTP (0.0005), tlTP(0.0889), other (0.1473)
CRSH106334911XM_013773298.11743C3XP_013628752.15806.1165.8823cTP (0.2263), mTP (0.0536), tlTP(0.0104), other (0.7096)
B. rapaRSH1103836764XM_033278751.12685A9XP_033134642.18946.38100.022324cTP (0.5255), mTP (0.0005), tlTP(0.0172), other (0.4566)
RSH2103870072XM_009148172.32064A5XP_009146420.16876.6777.356cTP (0.2318), mTP (0.0001), tlTP(0.0048), other (0.7612)
RSH3103871068XM_009149293.32091A6XP_009147541.16966.3077.8756cTP (0.6833), mTP (0.0001), tlTP(0.0135), other (0.3026)
CRSH103859710XM_009137283.31731A3XP_009135531.15765.9965.4723cTP (0.3013), mTP (0.0173), tlTP(0.0221), other (0.6593)
C. sativaRSH1_a104747094XM_010468670.226642XP_010466972.18876.6698.832425cTP (0.5423), mTP (0.0003), tlTP(0.0096), other (0.4475)
RSH1_b104737555XM_010457755.2265513XP_010456057.18846.5698.562526cTP (0.3518), mTP (0.0012), tlTP(0.0168), other (0.6298)
RSH1
_pseudo
104707874--8-------
RSH2_a104778842XM_010503267.221541XP_010501569.17176.5779.7767cTP (0.4377), mTP (0.0002), tlTP(0.0256), other (0.5339)
RSH2_b104788263XM_010513997.26305XP_010512299.12097.7223.5334cTP (0), mTP (0),
tlTP(0), other (0.9999)
RSH2_c104745674XM_010466982.2214815XP_010465284.17156.4279.5667cTP (0.3945), mTP (0.0001), tlTP(0.0761), other (0.5286)
RSH3_a104778355XM_010502782.221513XP_010501084.17166.1980.0956cTP (0.8885), mTP (0.002),
tlTP(0.0436), other (0.0634)
RSH3_b104758764XM_010481702.2215117XP_010480004.17166.7779.7556cTP (0.7837), mTP (0.0027), tlTP(0.0167), other (0.1939)
RSH3
_pseudo 1
104742935--14-------
RSH3
_pseudo 2
104761544--18-------
CRSH_a104782095XM_010506922.217641XP_010505224.15876.2066.9734cTP (0.2705), mTP (0.0903), tlTP(0.0037), other (0.6353)
CRSH_b104765592XM_010489335.2175819XP_010487637.15856.0766.8934cTP (0.0869), mTP (0.1501), tlTP(0.0008), other (0.7621)
R. sativusRSH1_a108828360XM_018602017.12640unknownXP_018457519.18796.7897.762324cTP (0.6503), mTP (0.0013), tlTP(0.0287), other (0.3196)
RSH1_b108843457XM_018616659.12601unknownXP_018472161.18666.96972324cTP (0.1051), mTP (0.0009), tlTP(0.0005), other (0.8934)
RSH1_c108834481XM_018607822.11290unknownXP_018463324.14297.5648.261314cTP (0.1051), mTP (0.0009), tlTP(0.0005), other (0.8934)
RSH2108863143XM_018637469.12037unknownXP_018492971.16786.5576.3156cTP (0.2086), mTP (0),
tlTP(0.0096), other (0.7815)
RSH3108862601XM_018636787.12121unknownXP_018492289.17066.4478.3667cTP (0.6764), mTP (0.0001), tlTP(0.1784), other (0.1413)
RSH3
_pseudo
108815328--unknown-------
CRSH_a108857634XM_018631638.11749unknownXP_018487140.15826.0666.1134cTP (0.1098), mTP (0.0301), tlTP(0.0031), other (0.857)
CRSH_b108857621XM_018631622.11749unknownXP_018487124.15826.0666.1134cTP (0.1098), mTP (0.0301), tlTP(0.0031), other (0.857)
CRSH_c108857284XM_018631245.11749unknownXP_018486747.15826.0666.0834cTP (0.1098), mTP (0.0301), tlTP(0.0031), other (0.857)
E. coliRelA947244-2235-NP_417264.17446.2983.89---
SpoT948159-2109-NP_418107.17028.8979.34---
S. coelicolorRel1096939-2544-WP_003977314.18479.3694.2---
Gene ID, transcript ID, protein ID—accession numbers from NCBI GenBank, cTP—chloroplast transit peptide, mTP—mitochondrial transit peptide, tlTP—tonoplast transit peptide, other—most probable cytoplasmic protein.
Table 2. Sequences of primers used for expression analysis of B. napus RSH genes.
Primer NameSequence of Primers
5′–3′
Analysed Gene and
Amplicon Length [bp]
BnRSH1_f
BnRSH1_r
GGAGGTTCAGATCAGAACGG
CCATTCACCTTCGCTGCTAC
BnRSH1
396
BnRSH2_f
BnRSH2_r
GCAAGATGTTGAAGAATCTAACG
GCACAGACATCTTGTCATTTTCG
BnRSH2
534
BnRSH3_f
BnRSH3_r
CCGAAACTTTCCGATTTCAA
TCGTAGTCAACGCACGAGTC
BnRSH3
524
BnCRSH_f
BnCRSH_r
AAGTGATGGAGGAGCTTGGA
CCATTTACTGGAACGCAACA
BnCRSH
263
BnAc_f
BnAc_r
CTCACGCTATCCTCCGTCTC
TTGATCTTCATGCTGCTTGG
BnAc
469
Publisher’s Note: MDPI stays neutral with regard to jurisdictional claims in published maps and institutional affiliations.

