
Pleiotropic Effects of Functional MUC1 Variants on Cardiometabolic, Renal, and Hematological Traits in the Taiwanese Population


Abstract
:1. Introduction
2. Results
2.1. Characteristics of Clinical, Biochemical, and Hematological Traits
2.2. Association of MUC1 Genotypes with Clinical, Metabolic, and Biochemical Phenotypes and Hematological Parameters
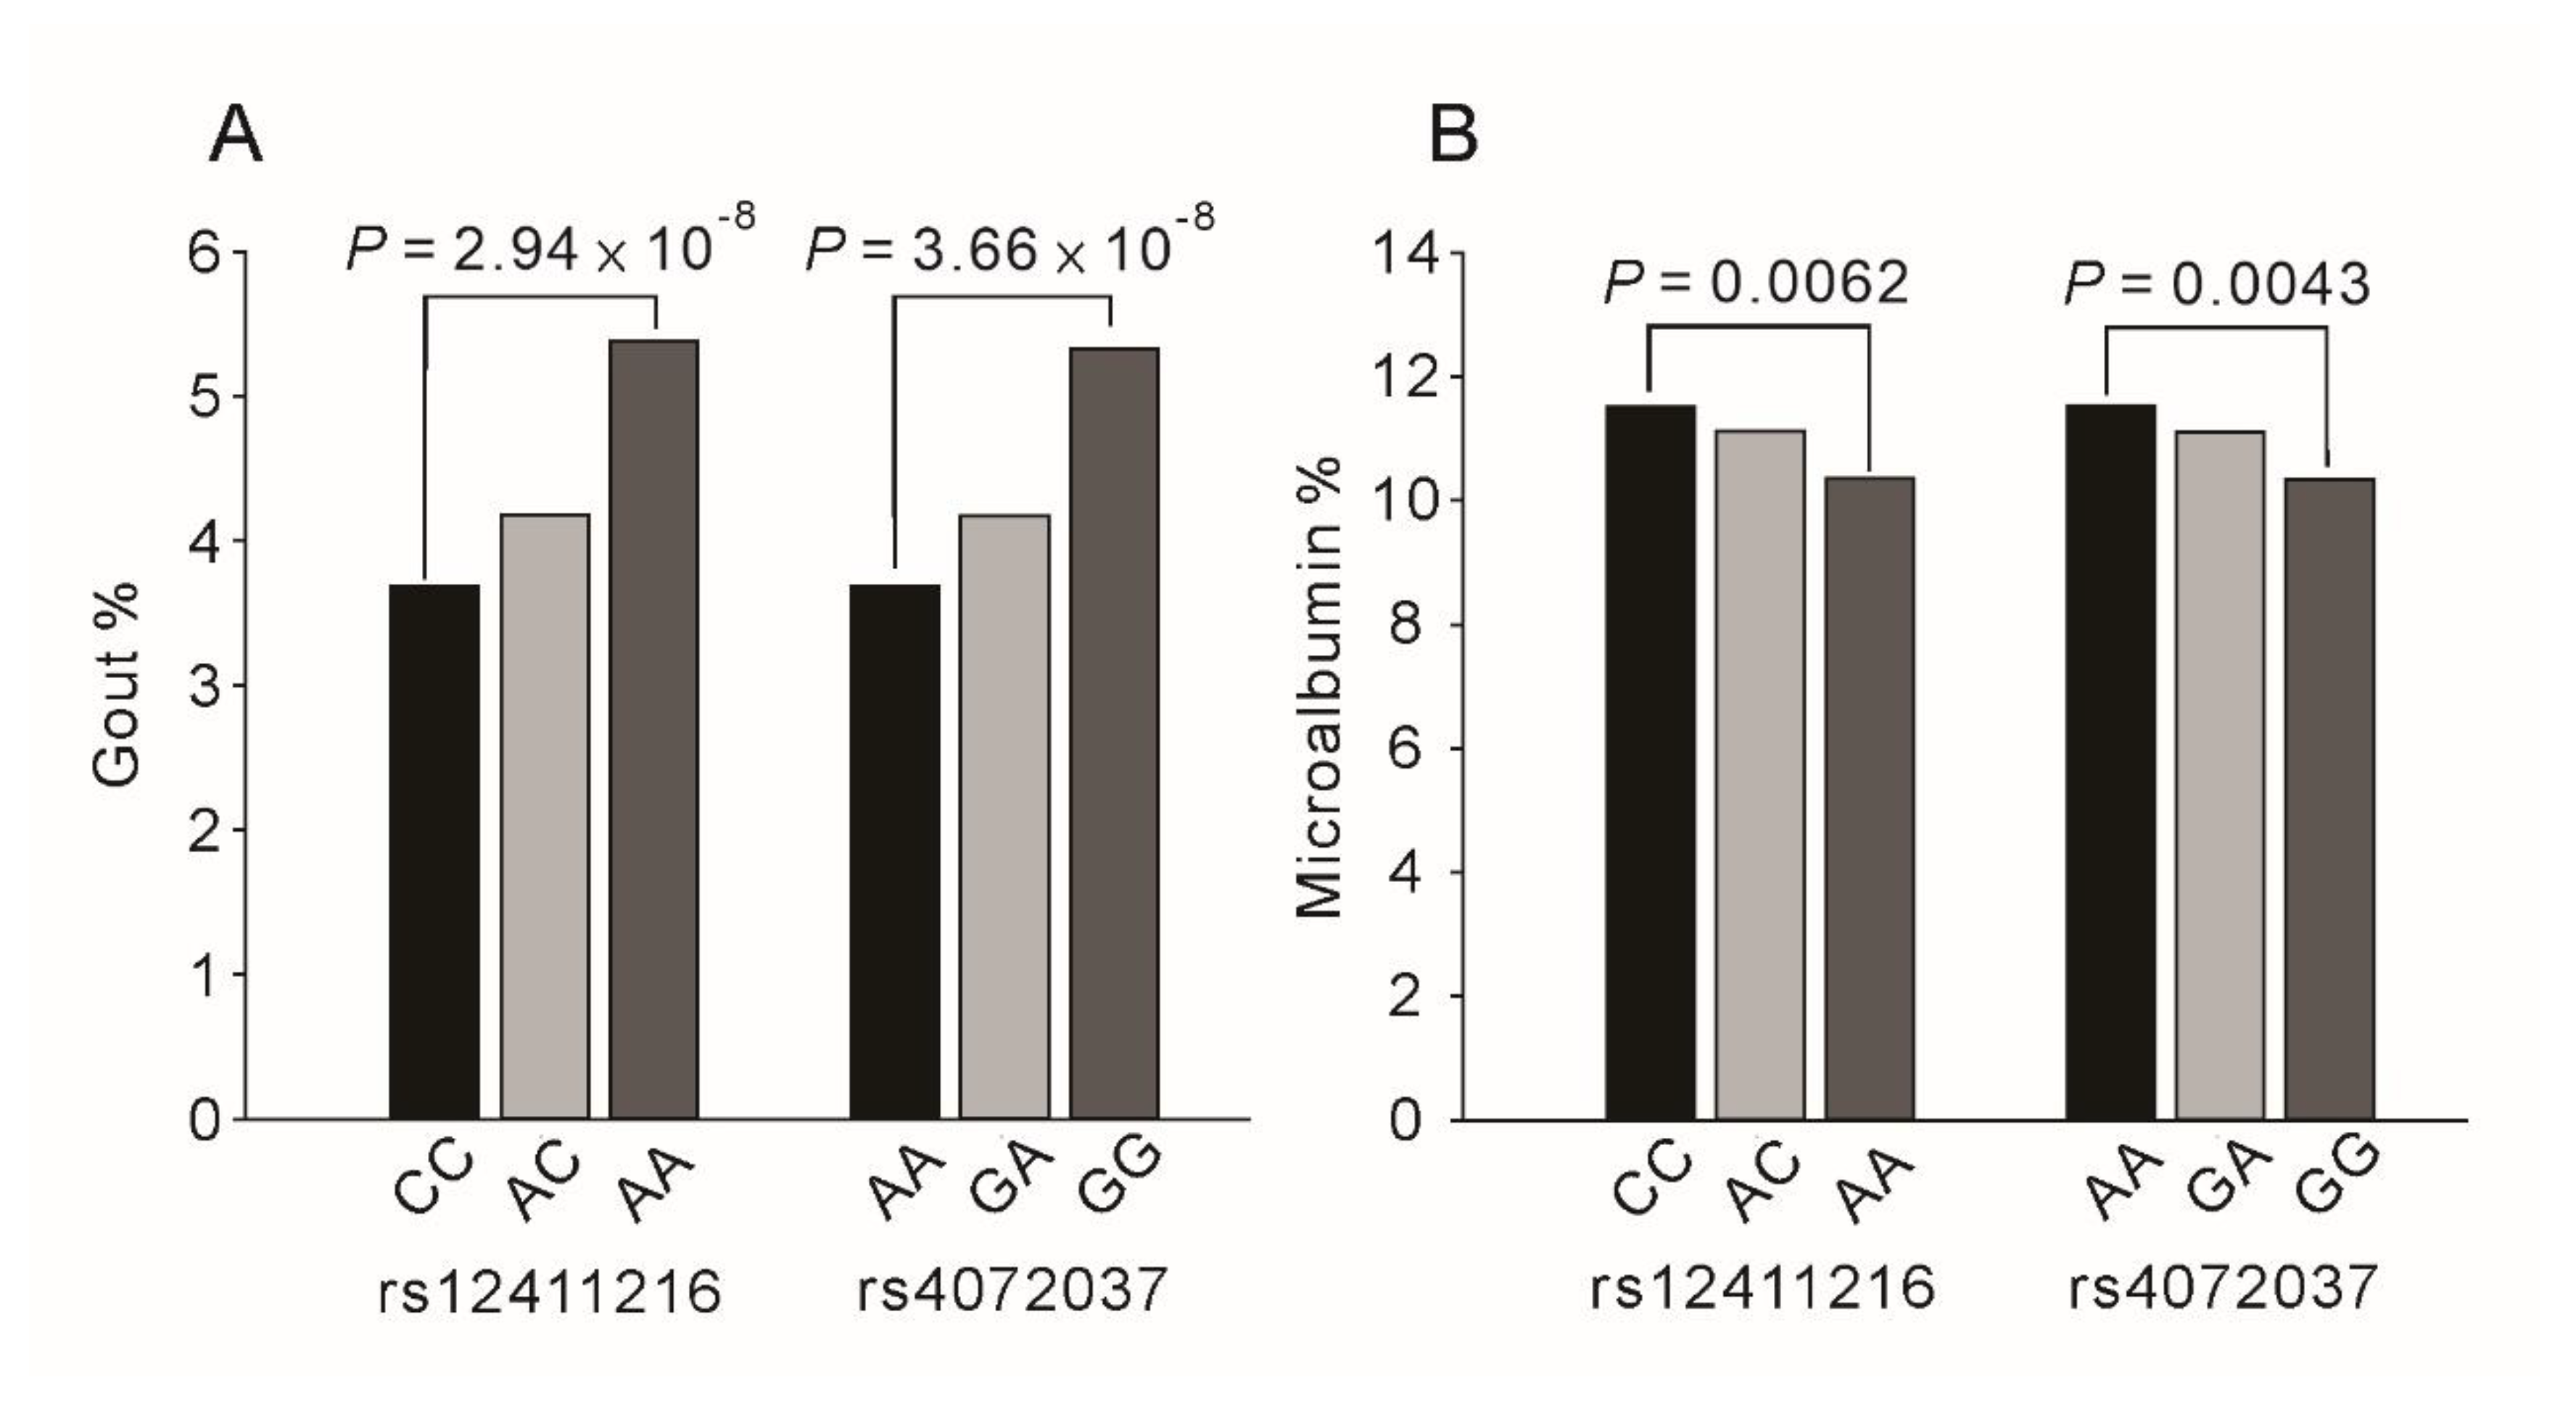
2.3. Association of MUC1 Genotypes with Risk Factors for Atherosclerosis
2.4. Subgroup Analysis of the Association of MUC1 Genotypes with Studied Parameters and Atherosclerotic Risk Factors
2.5. Mediational Analysis: MUC1 Genotypes and Various Phenotypes
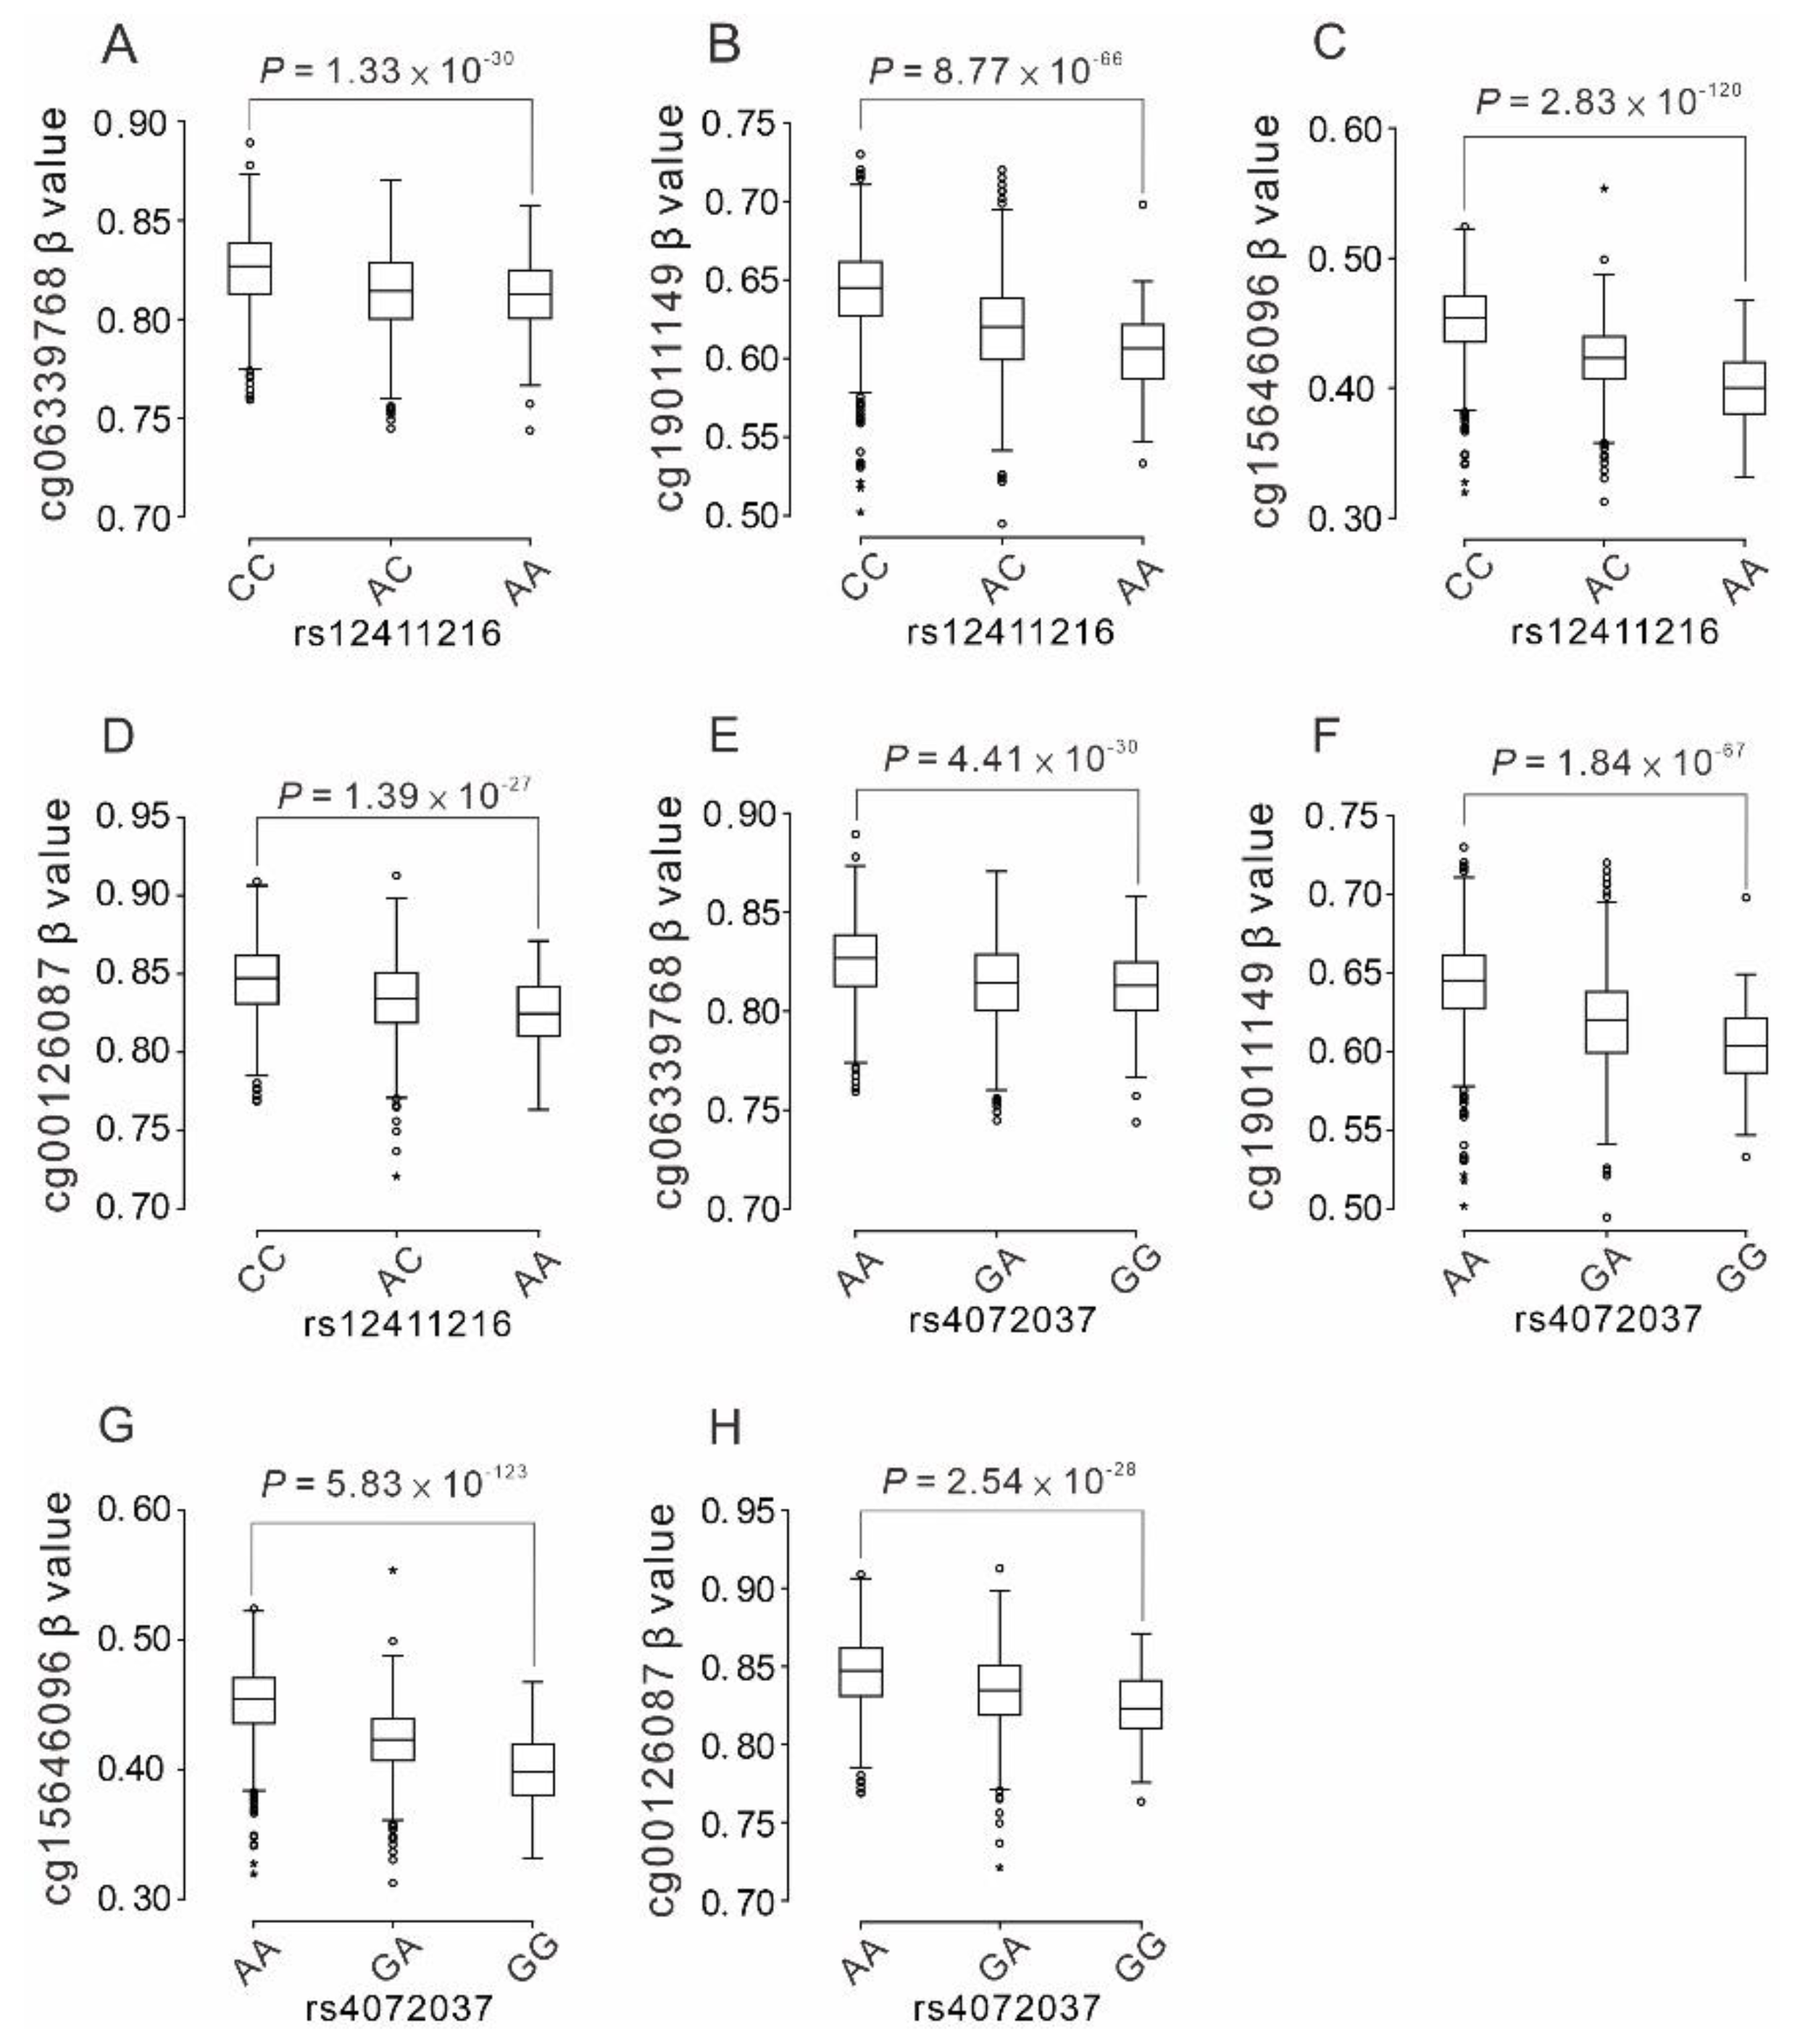
2.6. Association between the Functional Polymorphisms of the MUC1 Gene and the Nearby MUC1 DNA Methylation Status
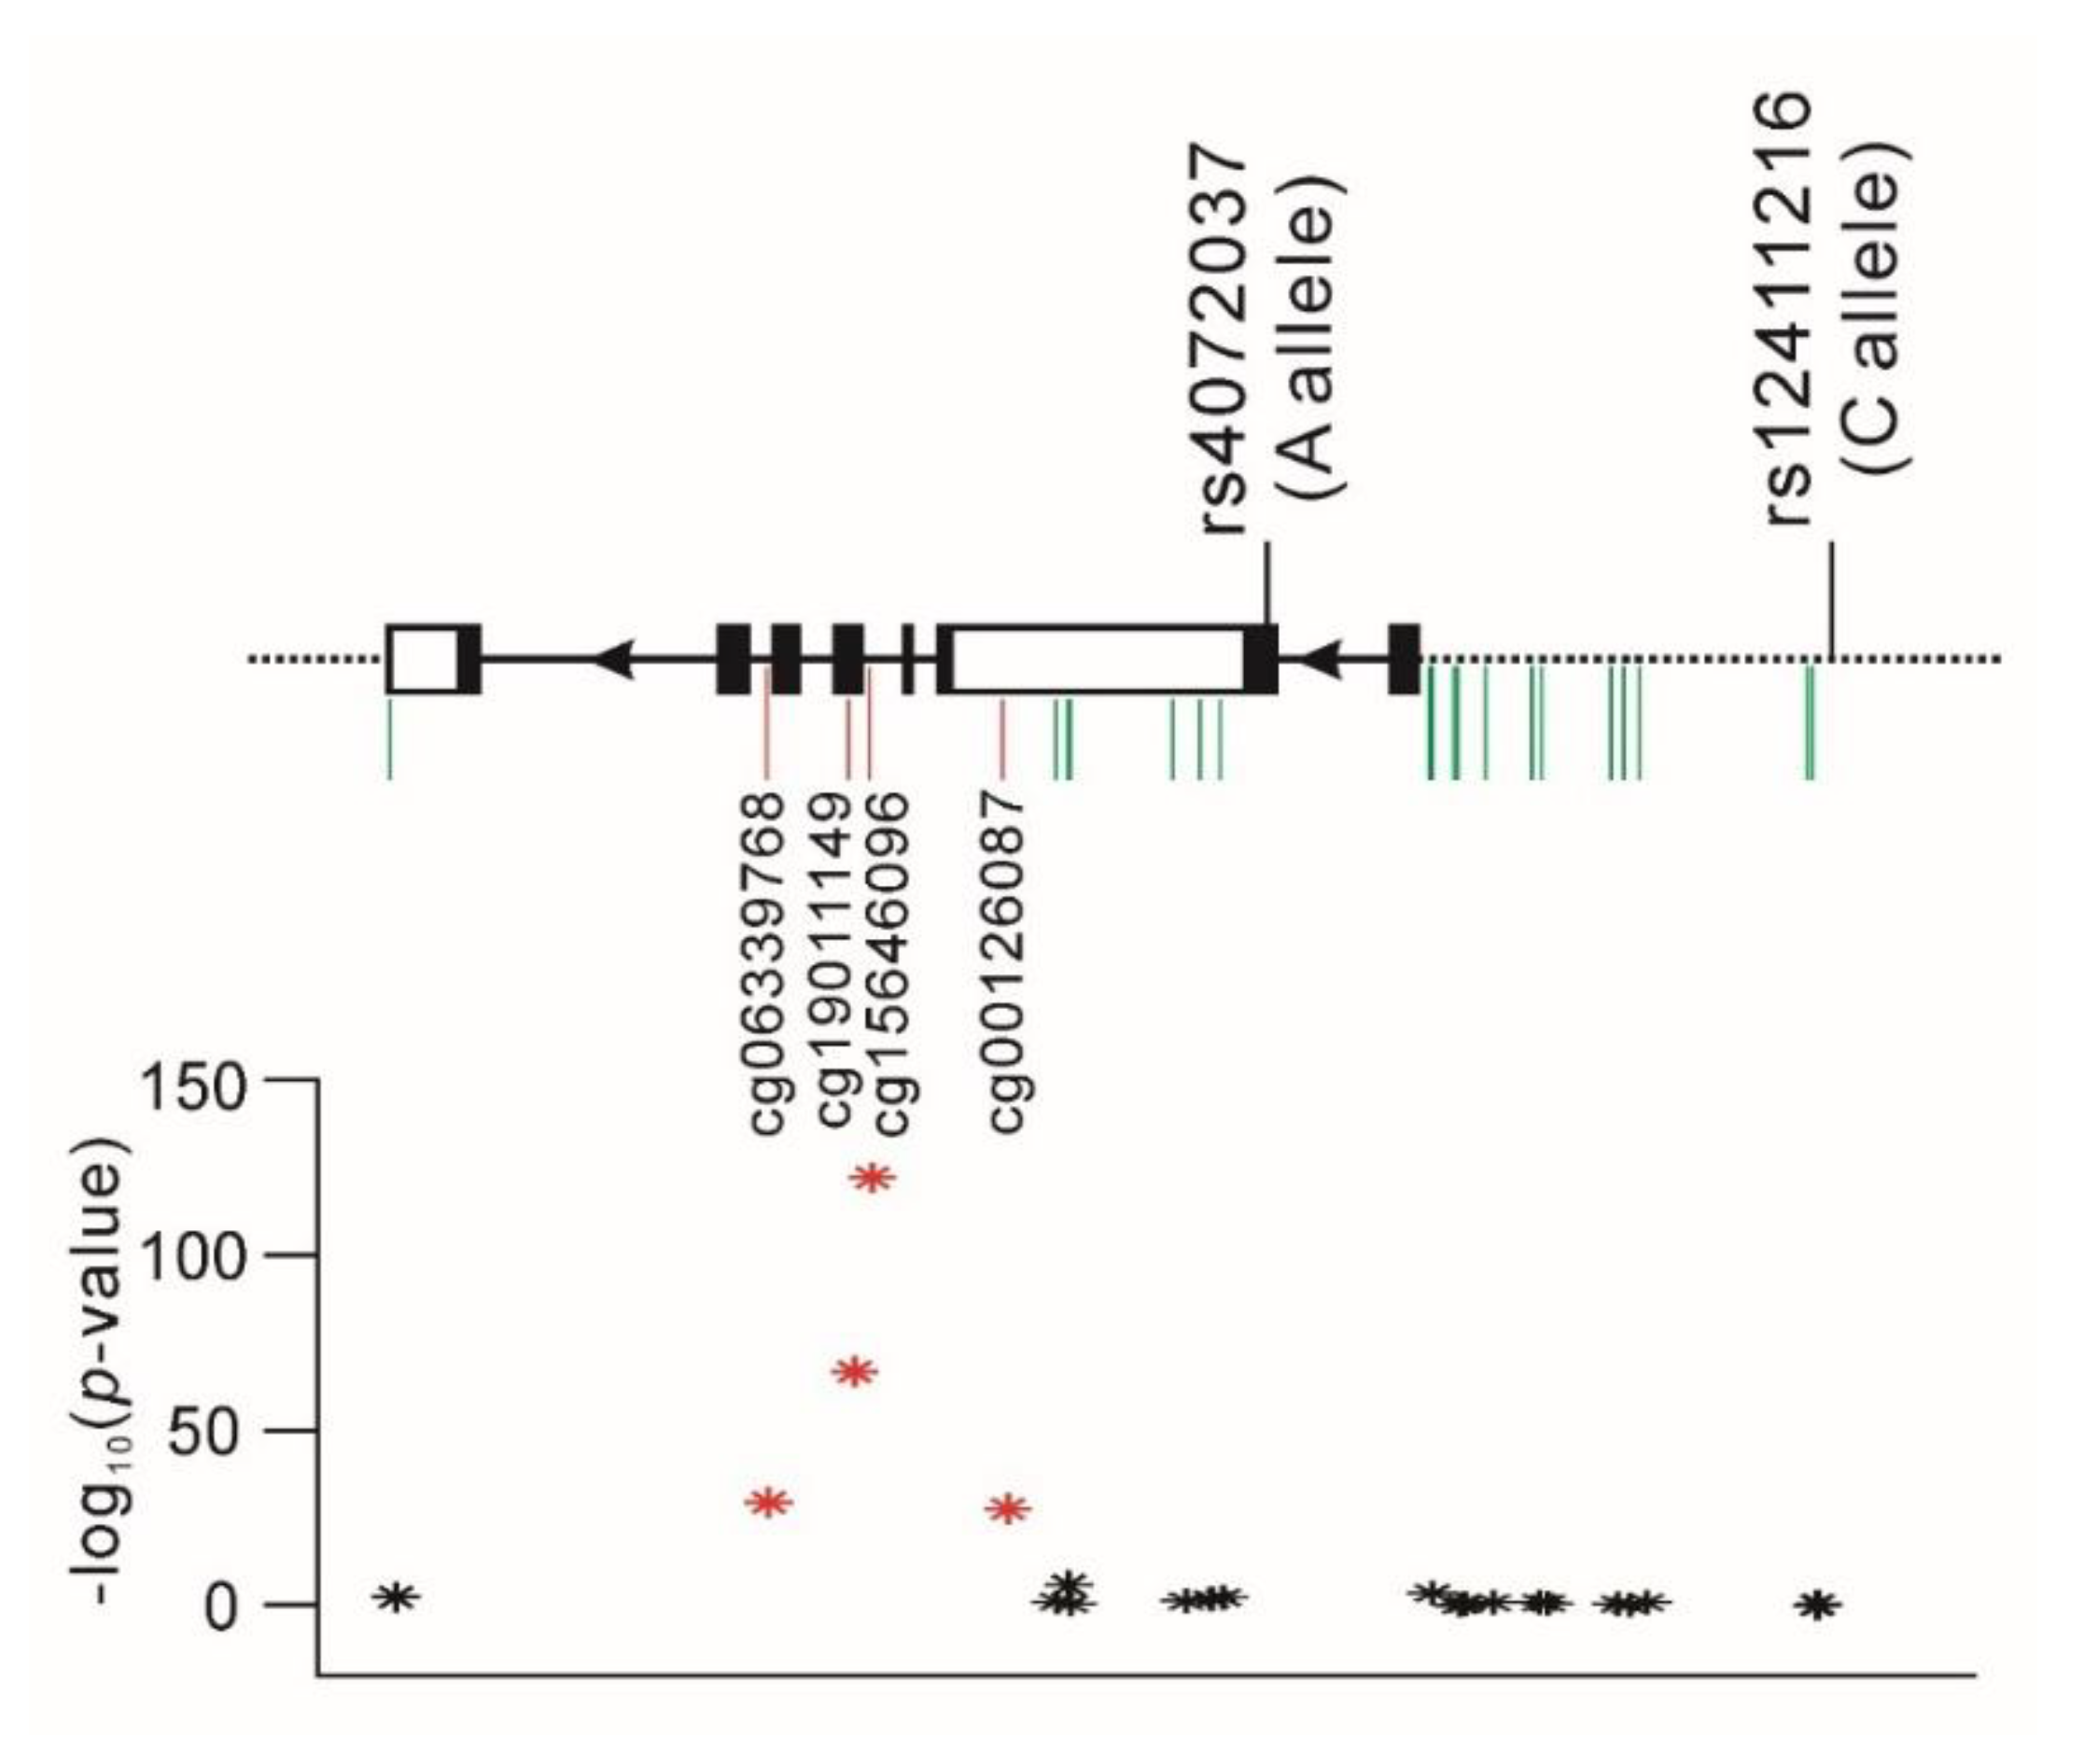
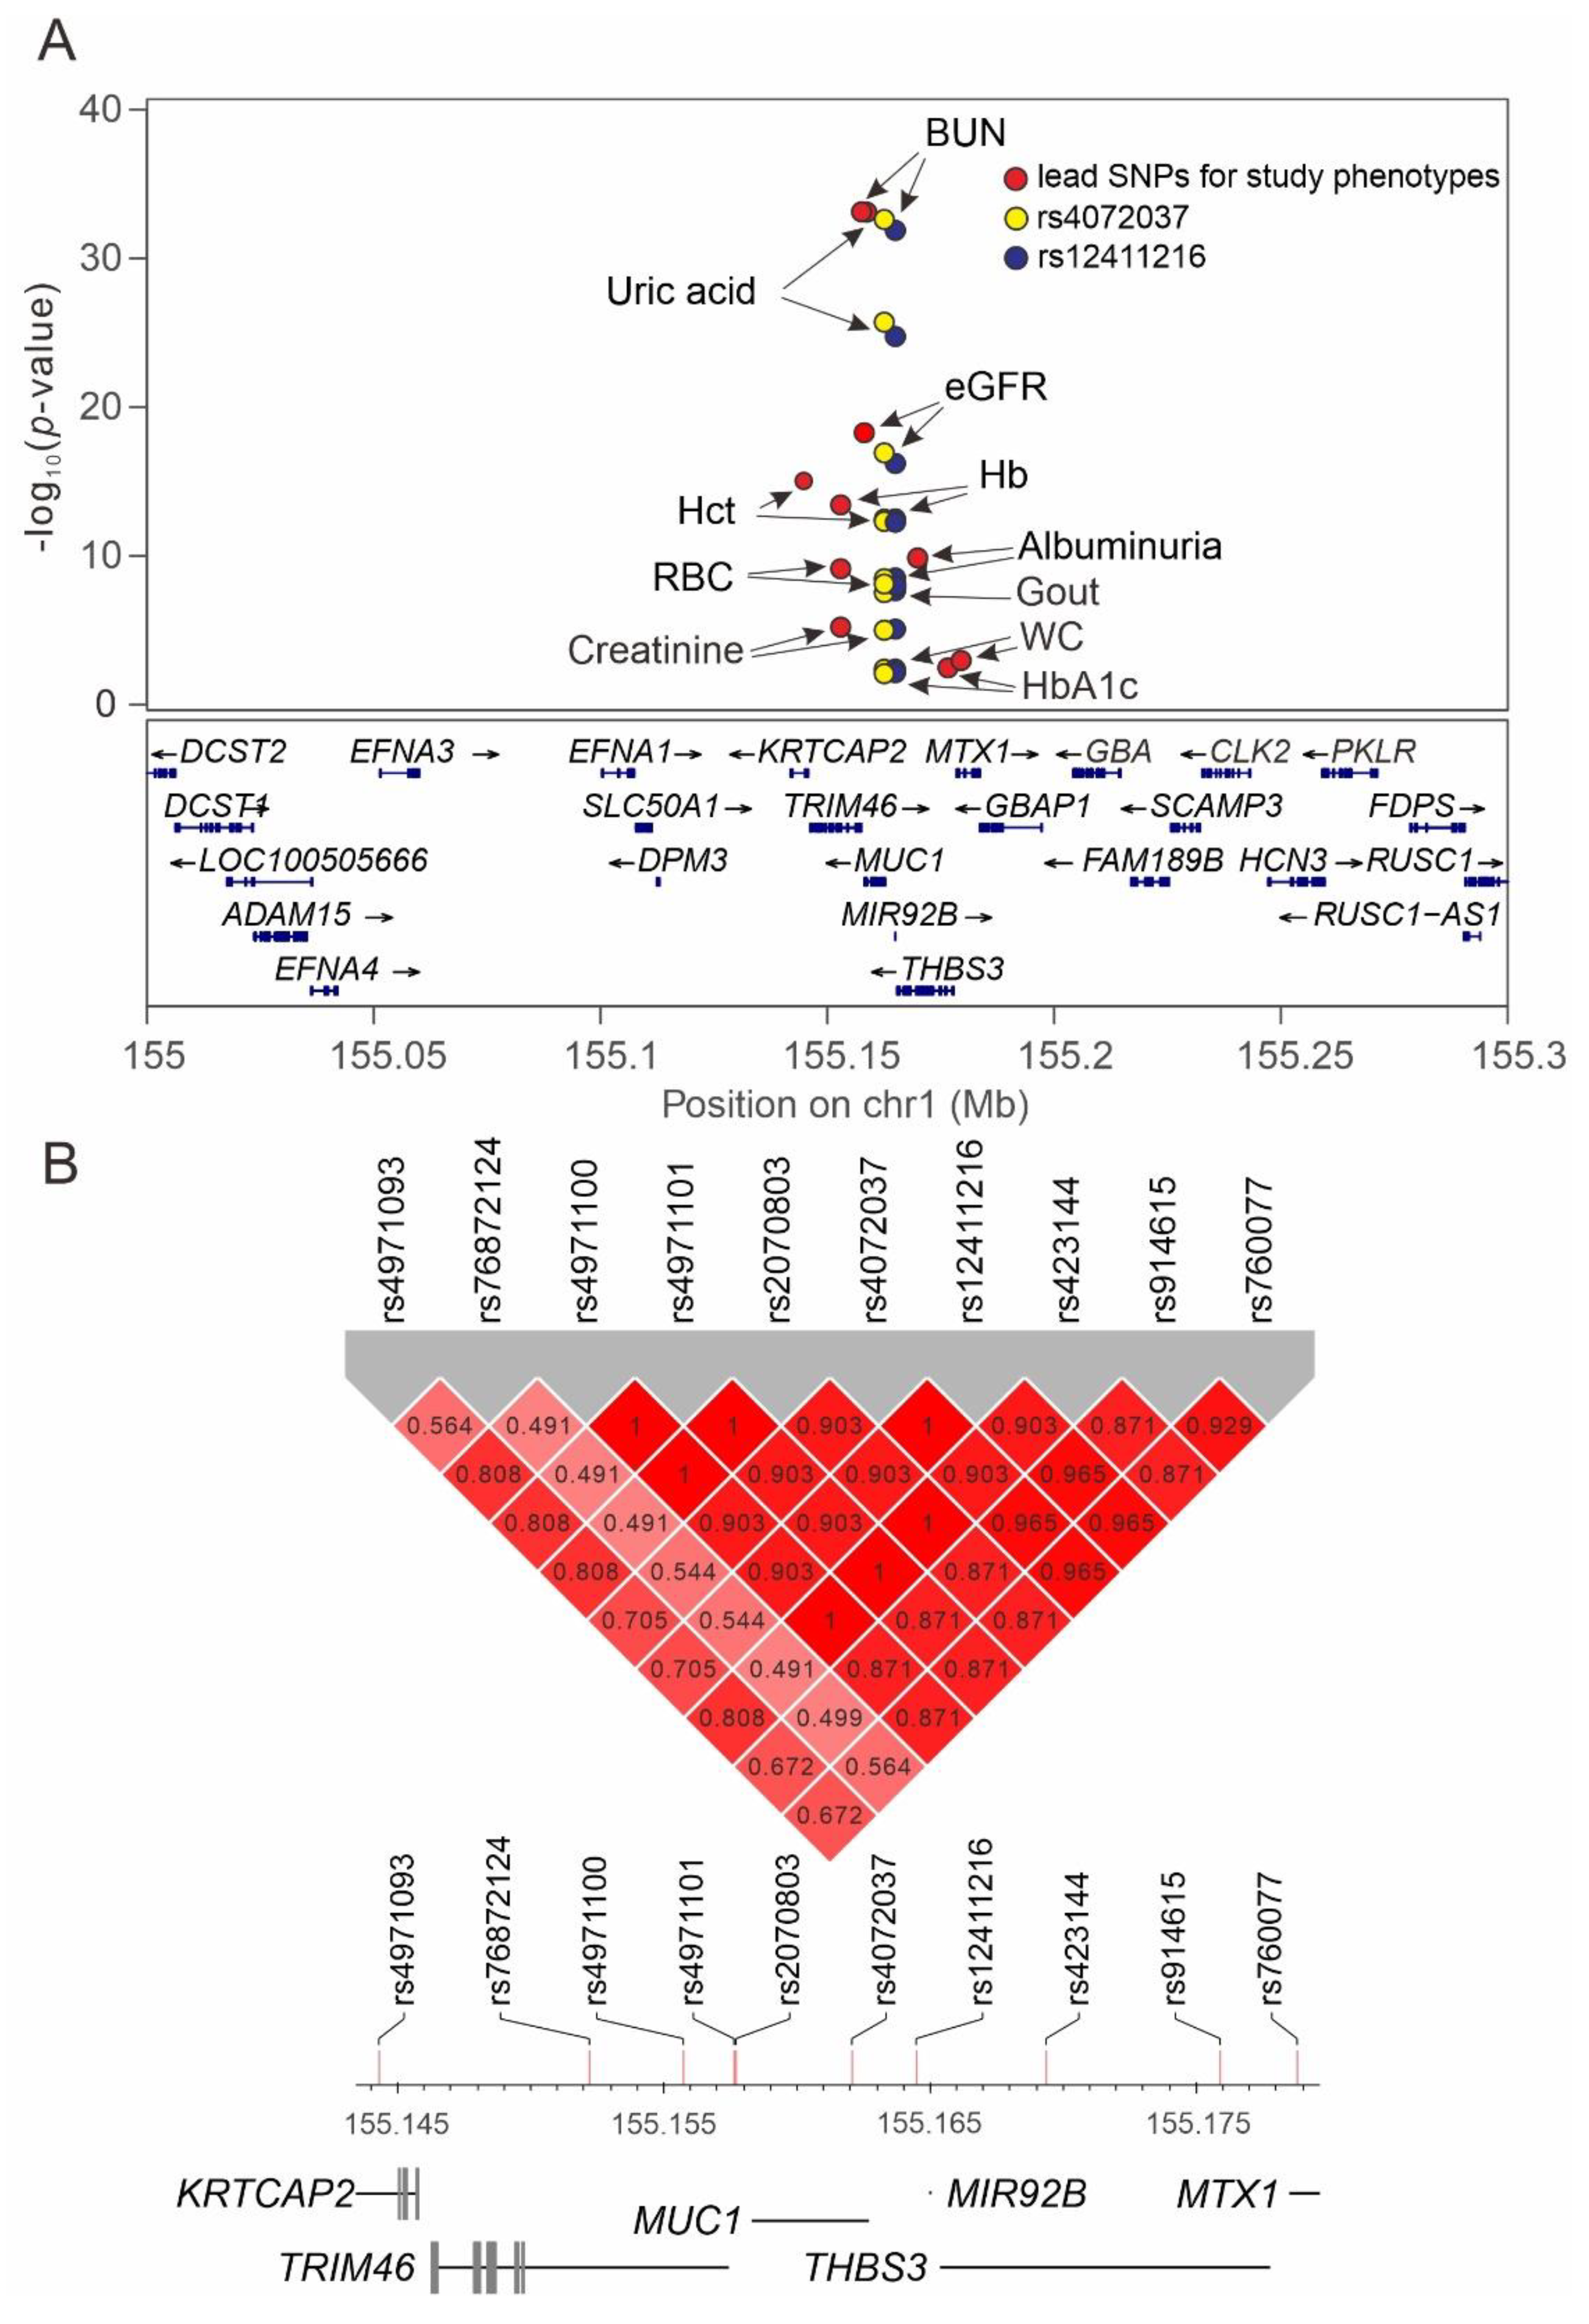
2.7. Regional Plot Association Studies for Genetic Variants at Positions 155 to 155.5 Mb on Chromosome 1q22 and the Study Phenotypes
3. Discussion
3.1. Association between MUC1 Polymorphisms and Renal Function and Albuminuria
3.2. MUC1 Polymorphisms and Serum Uric Acid Levels and Gout
3.3. MUC1 Polymorphisms and Blood Pressure Status and Waist Circumference
3.4. Association between MUC1 Polymorphisms and Red Blood Cell Parameters
3.5. Previous Functional Studies for MUC1 rs4072037 and rs12411216 Polymorphisms
3.6. Association between Functional MUC1 Variants and MUC1 Gene Methylation
3.7. Role of Nearby Gene Region Variants Determined by Performing Regional Plot Association Studies
3.8. Limitations
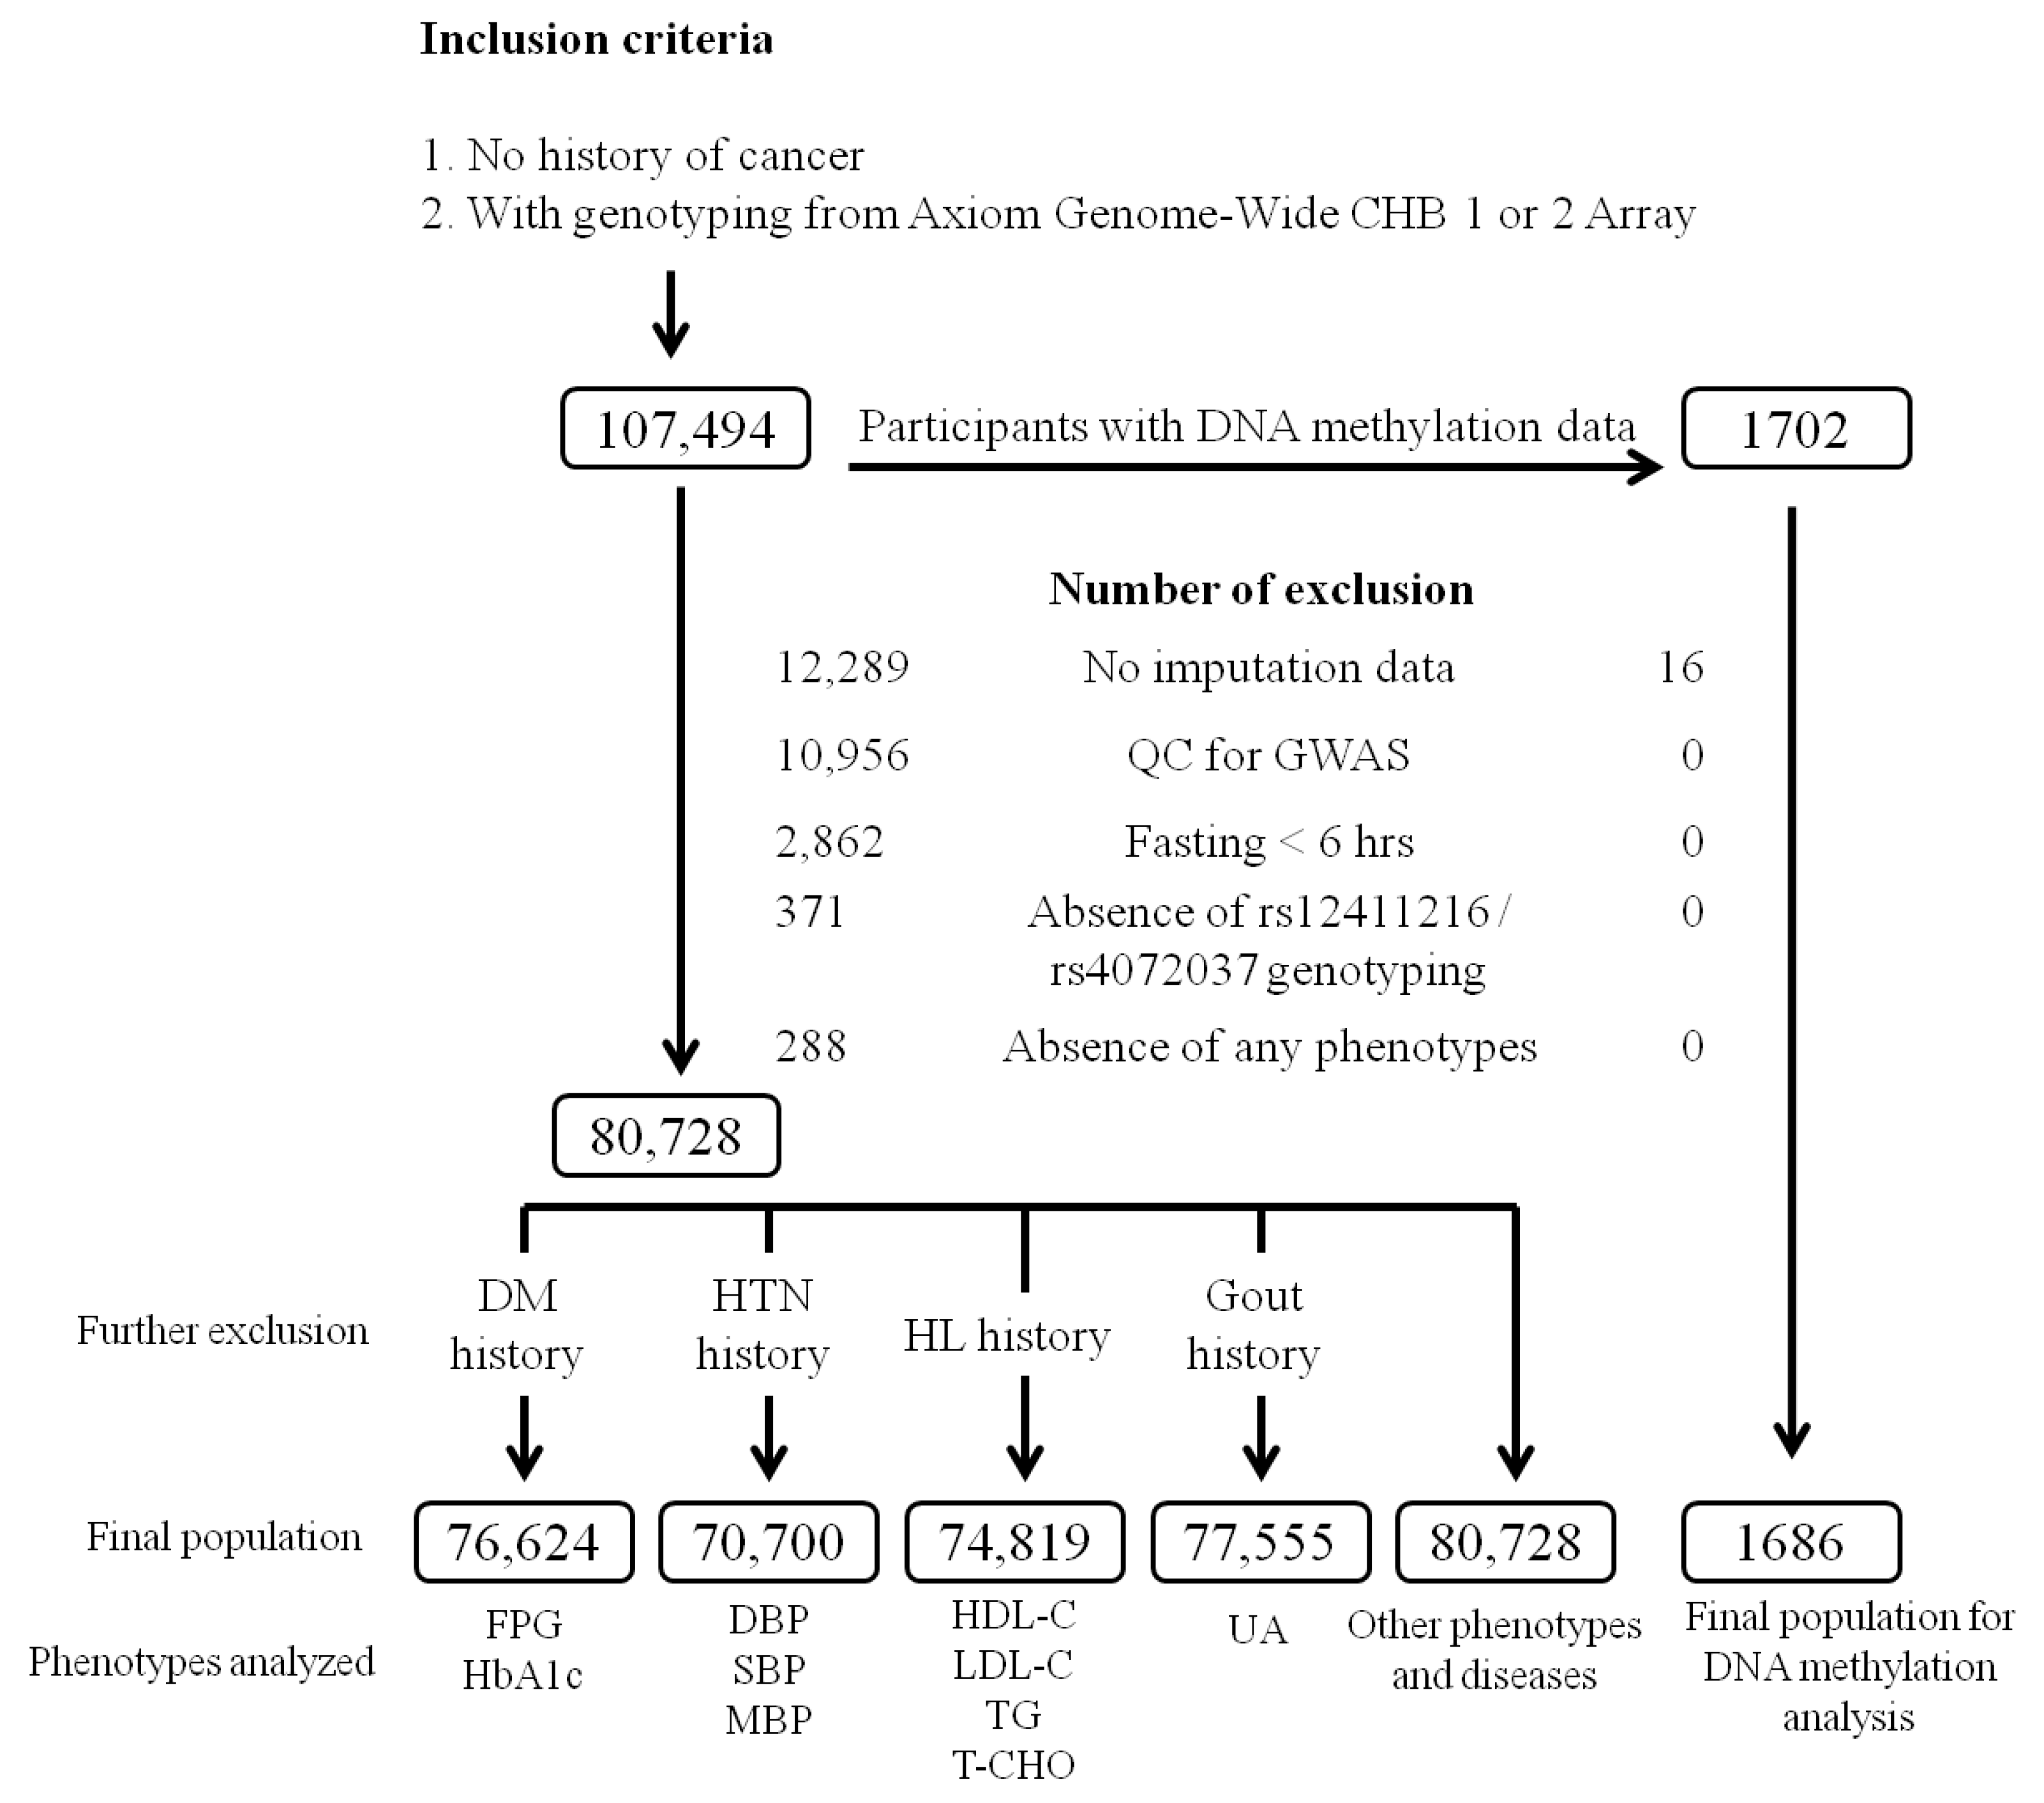
4. Participants and Methods
4.1. TWB Participants
4.2. Clinical Phenotypes and Laboratory Examinations
4.3. Selection of Functional MUC1 Variants and Genotyping
4.4. DNA Methylation Analysis
4.5. Regional Plot Association Analysis
4.6. Statistical Analysis
5. Conclusions
Supplementary Materials
Author Contributions
Funding
Institutional Review Board Statement
Informed Consent Statement
Data Availability Statement
Acknowledgments
Conflicts of Interest
Abbreviations
| GWAS | genome-wide association study |
| TWB | Taiwan Biobank |
| HL | hyperlipidemia |
| HTN | hypertension |
| DM | diabetes mellitus |
| FPG | fasting plasma glucose |
| HbA1C | hemoglobin A1C |
| SBP | systolic blood pressure |
| DBP | diastolic blood pressure |
| MBP | mean blood pressure |
| LDL-C | low-density lipoprotein cholesterol |
| HDL-C | high-density lipoprotein cholesterol |
| TG | triglyceride |
| T-CHO | total cholesterol |
| UA | uric acid |
| BMI | body mass index |
| AST | aspartate aminotransferase |
| ALT | alanine aminotransferase |
| γ-GT | γ-Glutamyl transferase |
| eGFR | estimated glomerular filtration rate |
References
- Apostolopoulos, V.; Stojanovska, L.; Gargosky, S.E. MUC1 (CD227): A multi-tasked molecule. Cell. Mol. Life Sci. CMLS 2015, 72, 4475–4500. [Google Scholar] [CrossRef]
- Behera, S.K.; Praharaj, A.B.; Dehury, B.; Negi, S. Exploring the role and diversity of mucins in health and disease with special insight into non-communicable diseases. Glycoconj. J. 2015, 32, 575–613. [Google Scholar] [CrossRef]
- Nath, S.; Mukherjee, P. MUC1: A multifaceted oncoprotein with a key role in cancer progression. Trends Mol. Med. 2014, 20, 332–342. [Google Scholar] [CrossRef] [PubMed] [Green Version]
- Syrkina, M.S.; Vassetzky, Y.S.; Rubtsov, M.A. MUC1 Story: Great Expectations, Disappointments and the Renaissance. Curr. Med. Chem. 2019, 26, 554–563. [Google Scholar] [CrossRef] [PubMed]
- Chang, J.F.; Zhao, H.L.; Phillips, J.; Greenburg, G. The epithelial mucin, MUC1, is expressed on resting T lymphocytes and can function as a negative regulator of T cell activation. Cell. Immunol. 2000, 201, 83–88. [Google Scholar] [CrossRef] [PubMed]
- Gendler, S.J. MUC1, the renaissance molecule. J. Mammary Gland. Biol. Neoplasia 2001, 6, 339–353. [Google Scholar] [CrossRef] [PubMed]
- Rughetti, A.; Biffoni, M.; Pierelli, L.; Rahimi, H.; Bonanno, G.; Barachini, S.; Pellicciotta, I.; Napoletano, C.; Pescarmona, E.; Del Nero, A.; et al. Regulated expression of MUC1 epithelial antigen in erythropoiesis. Br. J. Haematol. 2003, 120, 344–352. [Google Scholar] [CrossRef] [PubMed]
- Senapati, S.; Sharma, P.; Bafna, S.; Roy, H.K.; Batra, S.K. The MUC gene family: Their role in the diagnosis and prognosis of gastric cancer. Histol. Histopathol. 2008, 23, 1541–1552. [Google Scholar]
- Taylor-Papadimitriou, J.; Burchell, J.; Miles, D.W.; Dalziel, M. MUC1 and cancer. Biochim. Biophys. Acta 1999, 1455, 301–313. [Google Scholar] [CrossRef] [Green Version]
- Ahn, H.S.; Kim, J.H.; Jeong, H.; Yu, J.; Yeom, J.; Song, S.H.; Kim, S.S.; Kim, I.J.; Kim, K. Differential Urinary Proteome Analysis for Predicting Prognosis in Type 2 Diabetes Patients with and without Renal Dysfunction. Int. J. Mol. Sci. 2020, 21, 4236. [Google Scholar] [CrossRef]
- Bleyer, A.J.; Kmoch, S. Autosomal dominant tubulointerstitial kidney disease: Of names and genes. Kidney Int. 2014, 86, 459–461. [Google Scholar] [CrossRef] [PubMed] [Green Version]
- Devuyst, O.; Olinger, E.; Weber, S.; Eckardt, K.U.; Kmoch, S.; Rampoldi, L.; Bleyer, A.J. Autosomal dominant tubulointerstitial kidney disease. Nat. Rev. Dis. Primers 2019, 5, 60. [Google Scholar] [CrossRef] [Green Version]
- Eckardt, K.U.; Alper, S.L.; Antignac, C.; Bleyer, A.J.; Chauveau, D.; Dahan, K.; Deltas, C.; Hosking, A.; Kmoch, S.; Rampoldi, L.; et al. Autosomal dominant tubulointerstitial kidney disease: Diagnosis, classification, and management—A KDIGO consensus report. Kidney Int. 2015, 88, 676–683. [Google Scholar] [CrossRef] [PubMed] [Green Version]
- Helgason, H.; Rafnar, T.; Olafsdottir, H.S.; Jonasson, J.G.; Sigurdsson, A.; Stacey, S.N.; Jonasdottir, A.; Tryggvadottir, L.; Alexiusdottir, K.; Haraldsson, A.; et al. Loss-of-function variants in ATM confer risk of gastric cancer. Nat. Genet. 2015, 47, 906–910. [Google Scholar] [CrossRef]
- Saeki, N.; Saito, A.; Choi, I.J.; Matsuo, K.; Ohnami, S.; Totsuka, H.; Chiku, S.; Kuchiba, A.; Lee, Y.S.; Yoon, K.A.; et al. A functional single nucleotide polymorphism in mucin 1, at chromosome 1q22, determines susceptibility to diffuse-type gastric cancer. Gastroenterology 2011, 140, 892–902. [Google Scholar] [CrossRef]
- Wang, Z.; Dai, J.; Hu, N.; Miao, X.; Abnet, C.C.; Yang, M.; Freedman, N.D.; Chen, J.; Burdette, L.; Zhu, X.; et al. Identification of new susceptibility loci for gastric non-cardia adenocarcinoma: Pooled results from two Chinese genome-wide association studies. Gut 2017, 66, 581–587. [Google Scholar] [CrossRef]
- Kanai, M.; Akiyama, M.; Takahashi, A.; Matoba, N.; Momozawa, Y.; Ikeda, M.; Iwata, N.; Ikegawa, S.; Hirata, M.; Matsuda, K.; et al. Genetic analysis of quantitative traits in the Japanese population links cell types to complex human diseases. Nat. Genet. 2018, 50, 390–400. [Google Scholar] [CrossRef] [Green Version]
- Meyer, T.E.; Verwoert, G.C.; Hwang, S.J.; Glazer, N.L.; Smith, A.V.; van Rooij, F.J.; Ehret, G.B.; Boerwinkle, E.; Felix, J.F.; Leak, T.S.; et al. Genome-wide association studies of serum magnesium, potassium, and sodium concentrations identify six Loci influencing serum magnesium levels. PLoS Genet. 2010, 6, e1001045. [Google Scholar] [CrossRef] [Green Version]
- Takeuchi, F.; Akiyama, M.; Matoba, N.; Katsuya, T.; Nakatochi, M.; Tabara, Y.; Narita, A.; Saw, W.Y.; Moon, S.; Spracklen, C.N.; et al. Interethnic analyses of blood pressure loci in populations of East Asian and European descent. Nat. Commun. 2018, 9, 5052. [Google Scholar] [CrossRef] [Green Version]
- Xu, X.; Eales, J.M.; Akbarov, A.; Guo, H.; Becker, L.; Talavera, D.; Ashraf, F.; Nawaz, J.; Pramanik, S.; Bowes, J.; et al. Molecular insights into genome-wide association studies of chronic kidney disease-defining traits. Nat. Commun. 2018, 9, 4800. [Google Scholar] [CrossRef] [PubMed]
- Teumer, A.; Tin, A.; Sorice, R.; Gorski, M.; Yeo, N.C.; Chu, A.Y.; Li, M.; Li, Y.; Mijatovic, V.; Ko, Y.A.; et al. Genome-wide Association Studies Identify Genetic Loci Associated With Albuminuria in Diabetes. Diabetes 2016, 65, 803–817. [Google Scholar] [CrossRef] [PubMed] [Green Version]
- Fan, C.T.; Lin, J.C.; Lee, C.H. Taiwan Biobank: A project aiming to aid Taiwan’s transition into a biomedical island. Pharmacogenomics 2008, 9, 235–246. [Google Scholar] [CrossRef] [PubMed]
- Chen, C.H.; Yang, J.H.; Chiang, C.W.K.; Hsiung, C.N.; Wu, P.E.; Chang, L.C.; Chu, H.W.; Chang, J.; Song, I.W.; Yang, S.L.; et al. Population structure of Han Chinese in the modern Taiwanese population based on 10,000 participants in the Taiwan Biobank project. Hum. Mol. Genet. 2016, 25, 5321–5331. [Google Scholar] [CrossRef] [Green Version]
- Chronic Kidney Disease Prognosis, C.; Matsushita, K.; van der Velde, M.; Astor, B.C.; Woodward, M.; Levey, A.S.; de Jong, P.E.; Coresh, J.; Gansevoort, R.T. Association of estimated glomerular filtration rate and albuminuria with all-cause and cardiovascular mortality in general population cohorts: A collaborative meta-analysis. Lancet 2010, 375, 2073–2081. [Google Scholar]
- Teumer, A.; Li, Y.; Ghasemi, S.; Prins, B.P.; Wuttke, M.; Hermle, T.; Giri, A.; Sieber, K.B.; Qiu, C.; Kirsten, H.; et al. Genome-wide association meta-analyses and fine-mapping elucidate pathways influencing albuminuria. Nat. Commun. 2019, 10, 4130. [Google Scholar] [CrossRef] [Green Version]
- Nakatochi, M.; Kanai, M.; Nakayama, A.; Hishida, A.; Kawamura, Y.; Ichihara, S.; Akiyama, M.; Ikezaki, H.; Furusyo, N.; Shimizu, S.; et al. Genome-wide meta-analysis identifies multiple novel loci associated with serum uric acid levels in Japanese individuals. Commun. Biol. 2019, 2, 115. [Google Scholar] [CrossRef]
- Sandoval-Plata, G.; Morgan, K.; Abhishek, A. Variants in urate transporters, ADH1B, GCKR and MEPE genes associate with transition from asymptomatic hyperuricaemia to gout: Results of the first gout versus asymptomatic hyperuricaemia GWAS in Caucasians using data from the UK Biobank. Ann. Rheum. Dis. 2021, 80, 1220–1226. [Google Scholar] [CrossRef]
- Zhu, Z.; Guo, Y.; Shi, H.; Liu, C.L.; Panganiban, R.A.; Chung, W.; O’Connor, L.J.; Himes, B.E.; Gazal, S.; Hasegawa, K.; et al. Shared genetic and experimental links between obesity-related traits and asthma subtypes in UK Biobank. J. Allergy Clin. Immunol. 2020, 145, 537–549. [Google Scholar] [CrossRef] [Green Version]
- Brugger, W.; Buhring, H.J.; Grunebach, F.; Vogel, W.; Kaul, S.; Muller, R.; Brummendorf, T.H.; Ziegler, B.L.; Rappold, I.; Brossart, P.; et al. Expression of MUC-1 epitopes on normal bone marrow: Implications for the detection of micrometastatic tumor cells. J. Clin. Oncol. Off. J. Am. Soc. Clin. Oncol. 1999, 17, 1535–1544. [Google Scholar] [CrossRef]
- Astle, W.J.; Elding, H.; Jiang, T.; Allen, D.; Ruklisa, D.; Mann, A.L.; Mead, D.; Bouman, H.; Riveros-Mckay, F.; Kostadima, M.A.; et al. The Allelic Landscape of Human Blood Cell Trait Variation and Links to Common Complex Disease. Cell 2016, 167, 1415–1429.e19. [Google Scholar] [CrossRef] [PubMed] [Green Version]
- Ng, W.; Loh, A.X.; Teixeira, A.S.; Pereira, S.P.; Swallow, D.M. Genetic regulation of MUC1 alternative splicing in human tissues. Br. J. Cancer 2008, 99, 978–985. [Google Scholar] [CrossRef] [PubMed] [Green Version]
- Li, Y.; Nie, Y.; Cao, J.; Tu, S.; Lin, Y.; Du, Y.; Li, Y. G-A variant in miR-200c binding site of EFNA1 alters susceptibility to gastric cancer. Mol. Carcinog. 2014, 53, 219–229. [Google Scholar] [CrossRef] [PubMed]
- Jiang, Z.; Huang, Y.; Zhang, P.; Han, C.; Lu, Y.; Mo, Z.; Zhang, Z.; Li, X.; Zhao, S.; Cai, F.; et al. Characterization of a pathogenic variant in GBA for Parkinson’s disease with mild cognitive impairment patients. Mol. Brain 2020, 13, 102. [Google Scholar] [CrossRef]
- Mata, I.F.; Leverenz, J.B.; Weintraub, D.; Trojanowski, J.Q.; Chen-Plotkin, A.; Van Deerlin, V.M.; Ritz, B.; Rausch, R.; Factor, S.A.; Wood-Siverio, C.; et al. GBA Variants are associated with a distinct pattern of cognitive deficits in Parkinson’s disease. Mov. Disord. Off. J. Mov. Disord. Soc. 2016, 31, 95–102. [Google Scholar] [CrossRef] [PubMed] [Green Version]
- Sardi, S.P.; Clarke, J.; Viel, C.; Chan, M.; Tamsett, T.J.; Treleaven, C.M.; Bu, J.; Sweet, L.; Passini, M.A.; Dodge, J.C.; et al. Augmenting CNS glucocerebrosidase activity as a therapeutic strategy for parkinsonism and other Gaucher-related synucleinopathies. Proc. Natl. Acad. Sci. USA 2013, 110, 3537–3542. [Google Scholar] [CrossRef] [Green Version]
- Bird, A.; Taggart, M.; Frommer, M.; Miller, O.J.; Macleod, D. A fraction of the mouse genome that is derived from islands of nonmethylated, CpG-rich DNA. Cell 1985, 40, 91–99. [Google Scholar] [CrossRef]
- Lister, R.; Pelizzola, M.; Dowen, R.H.; Hawkins, R.D.; Hon, G.; Tonti-Filippini, J.; Nery, J.R.; Lee, L.; Ye, Z.; Ngo, Q.M.; et al. Human DNA methylomes at base resolution show widespread epigenomic differences. Nature 2009, 462, 315–322. [Google Scholar] [CrossRef] [Green Version]
- Varley, K.E.; Gertz, J.; Bowling, K.M.; Parker, S.L.; Reddy, T.E.; Pauli-Behn, F.; Cross, M.K.; Williams, B.A.; Stamatoyannopoulos, J.A.; Crawford, G.E.; et al. Dynamic DNA methylation across diverse human cell lines and tissues. Genome Res. 2013, 23, 555–567. [Google Scholar] [CrossRef] [PubMed] [Green Version]
- Greenberg, M.V.C.; Bourc’his, D. The diverse roles of DNA methylation in mammalian development and disease. Nat. Rev. Mol. Cell Biol. 2019, 20, 590–607. [Google Scholar] [CrossRef]
- Shukla, S.; Kavak, E.; Gregory, M.; Imashimizu, M.; Shutinoski, B.; Kashlev, M.; Oberdoerffer, P.; Sandberg, R.; Oberdoerffer, S. CTCF-promoted RNA polymerase II pausing links DNA methylation to splicing. Nature 2011, 479, 74–79. [Google Scholar] [CrossRef]
- Maunakea, A.K.; Chepelev, I.; Cui, K.; Zhao, K. Intragenic DNA methylation modulates alternative splicing by recruiting MeCP2 to promote exon recognition. Cell Res. 2013, 23, 1256–1269. [Google Scholar] [CrossRef] [PubMed] [Green Version]
- Hsu, L.A.; Chou, H.H.; Teng, M.S.; Wu, S.; Ko, Y.L. Circulating chemerin levels are determined through circulating platelet counts in nondiabetic Taiwanese people: A bidirectional Mendelian randomization study. Atherosclerosis 2021, 320, 61–69. [Google Scholar] [CrossRef] [PubMed]


| Clinical and Laboratory Parameters | Male | Female | p Value | |
|---|---|---|---|---|
| Number | 29,266 | 51,462 | ||
| Anthropology | Age (years) | 51.0 (41.0–60.0) | 51.0 (41.0–59.0) | 9.52 × 10⁻¹⁰ |
| Waist circumference (cm) | 87.5 (82.0–93.5) | 80.0 (74.0–86.5) | <10−307 | |
| Waist–hip ratio | 0.90 (0.86–0.94) | 0.84 (0.80–0.89) | <10−307 | |
| Body mass index (kg/m2) | 25.0 (23.0–27.3) | 23.0 (21.0–25.5) | <10−307 | |
| Blood pressure | Systolic BP * (mmHg) | 121.0 (112.0–131.5) | 111.0 (102.0–123.0) | <10−307 |
| Diastolic BP * (mmHg) | 76.5 (70.0–83.0) | 69.0 (62.7–76.0) | <10−307 | |
| Mean BP * (mmHg) | 91.2 (84.3–98.7) | 83.2 (76.3–91.3) | <10−307 | |
| Lipid profiles | Total cholesterol **** (mg/dL) | 190.0 (168.0–213.0) | 194.0 (172.0–218.0) | 3.77 × 10−131 |
| HDL-cholesterol **** (mg/dL) | 47.0 (40.0–54.0) | 57.0 (49.0–66.0) | <10−307 | |
| LDL-cholesterol **** (mg/dL) | 121.0 (101.0–142.0) | 118.0 (98.0–140.0) | 0.1872 | |
| Triglyceride **** (mg/dL) | 107.0 (74.0–156.0) | 83.0 (59.0–119.0) | 2.36 × 10−223 | |
| Glucose metabolism | Fasting plasma glucose ** (mg/dL) | 94.0 (89.0–99.0) | 90.0 (86.0–95.0) | 8.29 × 10−103 |
| HbA1C ** (%) | 5.6 (5.4–5.9) | 5.6 (5.4–5.8) | 0.8662 | |
| Uric acid | Uric acid *** (mg/dL) | 6.3 (5.5–7.1) | 4.8 (4.1–5.5) | <10−307 |
| Renal function | Creatinine (mg/dL) | 0.88 (0.79–0.98) | 0.60 (0.54–0.67) | <10−307 |
| eGFR (mL/min/1.73 m2) | 92.6 (81.3–105.0) | 106.2 (92.4–122.2) | <10−307 | |
| BUN (mg/dL) | 13.6 (11.5–16.0) | 12.2 (10.1–14.6) | <10−307 | |
| Albuminuria (mg/L) | 8.4 (5.3–15.0) | 9.0 (5.5–15.4) | 3.53 × 10⁻²⁹ | |
| Liver function | AST (U/L) | 24.0 (21.0–29.0) | 22.0 (19.0–26.0) | 5.09 × 10−119 |
| ALT (U/L) | 23.0 (17.0–33.0) | 17.0 (13.0–23.0) | <10−307 | |
| γ-GT (U/L) | 22.0 (16.0–34.0) | 15.0 (11.0–21.0) | 2.26 × 10−254 | |
| Serum albumin (g/dL) | 4.6 (4.4–4.7) | 4.5 (4.3–4.6) | <10−307 | |
| Total bilirubin (mg/dL) | 0.7 (0.6–0.9) | 0.6 (0.5–0.7) | <10−307 | |
| Hematological parameters | Leukocyte count (103/μL) | 5.9 (4.9–7.0) | 5.6 (4.6–6.6) | 0.2571 |
| Hematocrit (%) | 44.9 (42.9–47.1) | 40.0 (37.9–42.1) | <10−307 | |
| Platelet count (103/μL) | 221.0 (190.0–256.0) | 246.0 (211.0–286.0) | <10−307 | |
| Red blood cell count (106/μL) | 5.1 (4.8–5.3) | 4.5 (4.3–4.8) | <10−307 | |
| Hemoglobin (g/dL) | 15.1 (14.4–15.9) | 13.2 (12.4–13.8) | <10−307 | |
| Clinical and Laboratory Parameters | rs12411216 | rs4072037 | |||||||
|---|---|---|---|---|---|---|---|---|---|
| Beta | SE | p Value | Adjusted p Value | Beta | SE | p Value | Adjusted p Value | ||
| Anthropology | Age (years) | −0.0604 | 0.0639 | 0.3444 | 0.9999 | −0.0622 | 0.0637 | 0.3286 | 0.9999 |
| Waist circumference (cm) | −0.1125 | 0.0305 | 0.0002 | 0.0056 | −0.1135 | 0.0304 | 0.0002 | 0.0056 | |
| Waist–hip ratio | −0.0006 | 0.0003 | 0.0449 | 0.9999 | −0.0006 | 0.0003 | 0.0484 | 0.9999 | |
| Body mass index (kg/m2) | 0.0294 | 0.0217 | 0.1764 | 0.9999 | 0.0285 | 0.0216 | 0.1873 | 0.9999 | |
| Blood pressure | Systolic BP * (mmHg) | 0.2934 | 0.0918 | 0.0014 | 0.0392 | 0.3077 | 0.0914 | 0.0008 | 0.0224 |
| Diastolic BP * (mmHg) | 0.1211 | 0.0598 | 0.0430 | 0.9999 | 0.1302 | 0.0596 | 0.0289 | 0.8082 | |
| Mean BP * (mmHg) | 0.1785 | 0.0658 | 0.0066 | 0.1848 | 0.1894 | 0.0655 | 0.0038 | 0.1064 | |
| Lipid profiles | Total cholesterol **** (mg/dL) | −0.0009 | 0.0005 | 0.0716 | 0.9999 | −0.0008 | 0.0005 | 0.0796 | 0.9999 |
| HDL-cholesterol **** (mg/dL) | 0.0003 | 0.0006 | 0.6180 | 0.9999 | 0.0004 | 0.0006 | 0.5337 | 0.9999 | |
| LDL-cholesterol **** (mg/dL) | −0.0011 | 0.0007 | 0.1238 | 0.9999 | −0.0011 | 0.0007 | 0.1234 | 0.9999 | |
| Triglyceride **** (mg/dL) | −0.0025 | 0.0013 | 0.0548 | 0.9999 | −0.0026 | 0.0013 | 0.0486 | 0.9999 | |
| Glucose metabolism | Fasting plasma glucose ** (mg/dL) | −0.2957 | 0.0903 | 0.0011 | 0.0308 | −0.2788 | 0.0899 | 0.0019 | 0.0532 |
| HbA1C ** (%) | −0.0129 | 0.0036 | 0.0003 | 0.0084 | −0.0125 | 0.0036 | 0.0005 | 0.0140 | |
| Uric acid | Uric acid *** (mg/dL) | 0.0690 | 0.0067 | 5.73 × 10⁻²⁵ | 1.60 × 10⁻²³ | 0.0704 | 0.0067 | 4.02 × 10⁻²⁶ | 1.13 × 10⁻²⁴ |
| Renal function | Creatinine (mg/dL) | 0.0059 | 0.0013 | 4.00 × 10⁻⁶ | 0.0001 | 0.0061 | 0.0013 | 2.00 × 10⁻⁶ | 0.0001 |
| eGFR (mL/min/1.73 m2) | −1.0751 | 0.1294 | 9.86 × 10⁻¹⁷ | 2.76 × 10⁻¹⁵ | −1.1074 | 0.1289 | 8.51 × 10⁻¹⁸ | 2.38 × 10⁻¹⁶ | |
| BUN (mg/dL) | 0.2540 | 0.0210 | 1.52 × 10⁻³³ | 4.26 × 10⁻³² | 0.2558 | 0.0209 | 2.82 × 10⁻³⁴ | 7.90 × 10⁻³³ | |
| Albuminuria (mg/L) | −0.0159 | 0.0027 | 5.31 × 10⁻⁹ | 1.49 × 10⁻⁷ | −0.0158 | 0.0027 | 6.09 × 10⁻⁹ | 1.71 × 10⁻⁷ | |
| Liver function | AST (U/L) | 0.1001 | 0.0727 | 0.1682 | 0.9999 | 0.1023 | 0.0723 | 0.1572 | 0.9999 |
| ALT (U/L) | −0.0186 | 0.1121 | 0.8681 | 0.9999 | −0.0219 | 0.1116 | 0.8444 | 0.9999 | |
| γ-GT (U/L) | 0.3914 | 0.1870 | 0.0363 | 0.9999 | 0.4228 | 0.1862 | 0.0232 | 0.6496 | |
| Serum albumin (g/dL) | 0.0004 | 0.0013 | 0.7656 | 0.9999 | 0.0006 | 0.0013 | 0.6584 | 0.9999 | |
| Total bilirubin (mg/dL) | −0.0014 | 0.0016 | 0.3672 | 0.9999 | −0.0014 | 0.0016 | 0.3784 | 0.9999 | |
| Hematological parameters | Leukocyte count (103/μL) | 0.0044 | 0.0092 | 0.6307 | 0.9999 | 0.0042 | 0.0092 | 0.6494 | 0.9999 |
| Hematocrit (%) | −0.1509 | 0.0209 | 5.07 × 10⁻¹³ | 1.42 × 10⁻¹¹ | −0.1497 | 0.0208 | 6.34 × 10⁻¹³ | 1.78 × 10⁻¹¹ | |
| Platelet count (103/μL) | −0.7588 | 0.3417 | 0.0264 | 0.7392 | −0.7417 | 0.3402 | 0.0293 | 0.8204 | |
| Red blood cell count (106/μL) | −0.0153 | 0.0026 | 7.49 × 10⁻⁹ | 2.10 × 10⁻⁷ | −0.0147 | 0.0026 | 2.22 × 10⁻⁸ | 6.22 × 10⁻⁷ | |
| Hemoglobin (g/dL) | −0.0540 | 0.0074 | 2.42 × 10⁻¹³ | 6.78 × 10⁻¹² | −0.0534 | 0.0073 | 3.48 × 10⁻¹³ | 9.74 × 10⁻¹² | |
| Phenotype | p Value | Lead SNP | Gene Locus | Position | Allele | MAF | Location | SNP Function/Amino Acid (Codon) |
|---|---|---|---|---|---|---|---|---|
| Waist circumference | 0.0001 | rs760077 | MTX1 | 155178782 | T/A | 0.1869 | Missense variant | p.Ser63Thr |
| HbA1C | 0.0002 | rs914615 | THBS3 | 155175892 | A/G | 0.1895 | Intron variant | TFBS |
| Uric acid level | 3.63 × 10⁻³³ | rs2070803 | TRIM46–MUC1 | 155157715 | G/A | 0.2350 | 3′ UTR | -- |
| Serum creatinine | 0.0004 | rs76872124 | TRIM46 | 155152205 | C/T | 0.1119 | Synonymous variant | p. His438His |
| eGFR | 3.06 × 10⁻¹⁹ | rs2070803 | TRIM46–MUC1 | 155157715 | G/A | 0.2350 | 3′ UTR | -- |
| Serum urea nitrogen | 2.78 × 10⁻³⁵ | rs4971101 | TRIM46–MUC1 | 155157635 | A/G | 0.2320 | 3′ UTR | -- |
| Albuminuria | 2.21 × 10⁻¹⁰ | rs423144 | THBS3 | 155169355 | T/G | 0.2309 | Intron variant | -- |
| Hematocrit | 2.1 × 10⁻¹⁵ | rs4971093 | KRTCAP2–TRIM46 | 155144300 | A/G | 0.2193 | 2 Kb upstream variant (TRIM46) | TFBS |
| Red blood cell count | 1.18 × 10⁻⁹ | rs76872124 | TRIM46 | 155152205 | C/T | 0.1119 | Synonymous variant | p. His438His |
| Hemoglobin | 2.27 × 10⁻¹⁴ | rs76872124 | TRIM46 | 155152205 | C/T | 0.1119 | Synonymous variant | p. His438His |
| Gout | 2.94 × 10⁻⁸ | rs12411216 | MUC1 | 155164480 | A/C | 0.2053 | 2 Kb upstream variant | TFBS |
| Microalbuminuria | 0.0031 | rs4971101 | TRIM46–MUC1 | 155157635 | A/G | 0.2320 | 3′ UTR | -- |
Publisher’s Note: MDPI stays neutral with regard to jurisdictional claims in published maps and institutional affiliations. |
© 2021 by the authors. Licensee MDPI, Basel, Switzerland. This article is an open access article distributed under the terms and conditions of the Creative Commons Attribution (CC BY) license (https://creativecommons.org/licenses/by/4.0/).
Share and Cite
Teng, M.-S.; Wu, S.; Hsu, L.-A.; Chou, H.-H.; Ko, Y.-L. Pleiotropic Effects of Functional MUC1 Variants on Cardiometabolic, Renal, and Hematological Traits in the Taiwanese Population. Int. J. Mol. Sci. 2021, 22, 10641. https://doi.org/10.3390/ijms221910641
Teng M-S, Wu S, Hsu L-A, Chou H-H, Ko Y-L. Pleiotropic Effects of Functional MUC1 Variants on Cardiometabolic, Renal, and Hematological Traits in the Taiwanese Population. International Journal of Molecular Sciences. 2021; 22(19):10641. https://doi.org/10.3390/ijms221910641
Chicago/Turabian StyleTeng, Ming-Sheng, Semon Wu, Lung-An Hsu, Hsin-Hua Chou, and Yu-Lin Ko. 2021. "Pleiotropic Effects of Functional MUC1 Variants on Cardiometabolic, Renal, and Hematological Traits in the Taiwanese Population" International Journal of Molecular Sciences 22, no. 19: 10641. https://doi.org/10.3390/ijms221910641
APA StyleTeng, M.-S., Wu, S., Hsu, L.-A., Chou, H.-H., & Ko, Y.-L. (2021). Pleiotropic Effects of Functional MUC1 Variants on Cardiometabolic, Renal, and Hematological Traits in the Taiwanese Population. International Journal of Molecular Sciences, 22(19), 10641. https://doi.org/10.3390/ijms221910641