Article

Impact of Oncogenic Targets by Tumor-Suppressive miR-139-5p and miR-139-3p Regulation in Head and Neck Squamous Cell Carcinoma

1
Department of Oral Science, Chiba University Graduate School of Medicine, Chiba 260-8670, Japan
2
Department of Functional Genomics, Chiba University Graduate School of Medicine, Chiba 260-8670, Japan
3
Department of Otorhinolaryngology/Head and Neck Surgery, Chiba University Graduate School of Medicine, Chiba 260-8670, Japan
4
Department of Biochemistry and Genetics, Chiba University Graduate School of Medicine, Chiba 260-8670, Japan
*
Author to whom correspondence should be addressed.
These authors contributed equally to this work.
Int. J. Mol. Sci. 2021, 22(18), 9947; https://doi.org/10.3390/ijms22189947
Submission received: 16 August 2021 / Revised: 11 September 2021 / Accepted: 12 September 2021 / Published: 14 September 2021
(This article belongs to the Special Issue MicroRNAs in Cancer Therapy)

Abstract

:
We newly generated an RNA-sequencing-based microRNA (miRNA) expression signature of head and neck squamous cell carcinoma (HNSCC). Analysis of the signature revealed that both strands of some miRNAs, including miR-139-5p (the guide strand) and miR-139-3p (the passenger strand) of miR-139, were downregulated in HNSCC tissues. Analysis of The Cancer Genome Atlas confirmed the low expression levels of miR-139 in HNSCC. Ectopic expression of these miRNAs attenuated the characteristics of cancer cell aggressiveness (e.g., cell proliferation, migration, and invasion). Our in silico analyses revealed a total of 28 putative targets regulated by pre-miR-139 (miR-139-5p and miR-139-3p) in HNSCC cells. Of these, the GNA12 (guanine nucleotide-binding protein subunit alpha-12) and OLR1 (oxidized low-density lipoprotein receptor 1) expression levels were identified as independent factors that predicted patient survival according to multivariate Cox regression analyses (p = 0.0018 and p = 0.0104, respectively). Direct regulation of GNA12 and OLR1 by miR-139-3p in HNSCC cells was confirmed through luciferase reporter assays. Moreover, overexpression of GNA12 and OLR1 was detected in clinical specimens of HNSCC through immunostaining. The involvement of miR-139-3p (the passenger strand) in the oncogenesis of HNSCC is a new concept in cancer biology. Our miRNA-based strategy will increase knowledge on the molecular pathogenesis of HNSCC.

1. Introduction

Head and neck squamous cell carcinoma (HNSCC) is a malignant neoplasm that originates in the epithelium of the oral cavity, larynx, and pharynx, and it accounts for approximately 90% of head and neck cancers [1,2]. HNSCC is the sixth most common cancer worldwide, and over 10% of the patients are at an advanced stage at the time of initial diagnosis [3]. In addition, approximately half of the patients will experience recurrence after treatment [4]. Effective treatments for patients with metastasis or recurrence are limited, and the prognosis of patients with treatment failure is extremely poor [5]. The elucidation of the molecular pathogenesis of the malignant transformation of HNSCC is indispensable for the development of new therapeutic strategies.
As a result of the human genome project, a vast number of non-protein-coding RNA molecules (ncRNAs) have been transcribed and have been found to have actual functions in human cells [6,7]. MicroRNAs (miRNAs), a type of ncRNA, are single-stranded RNA molecules consisting of only 19−23 bases [8,9]. A specific characteristic of miRNAs is that a single miRNA can control a large number of RNA transcripts (protein-coding RNAs and ncRNAs) in a sequence-dependent manner [9]. Over the last decade, numerous studies have reported aberrantly expressed (upregulated or downregulated in cancer tissues) miRNAs in a wide range of cancers [10]. Aberrantly expressed miRNAs trigger the disruption of intracellular RNA networks and promote cancer cell initiation, metastasis, and drug resistance [11]. Therefore, up- or downregulated miRNAs in cancer cells are closely involved in human oncogenesis [7].
It is important to determine target miRNAs with altered expression in cancer tissues. Based on this concept, we determined miRNA expression signatures by using RNA sequencing in several cancers [12,13]. Our recent studies showed that some passenger strands (e.g., miR-145-3p, miR-99a-3p, and miR-199-3p) derived from miRNA duplexes act as tumor-suppressive miRNAs by targeting several oncogenes [14,15,16]. According to the previous theory of miRNA biogenesis, miRNA guide strands are incorporated into the RISC to regulate their target genes. In contrast, the passenger strands of miRNAs are degraded in the cytoplasm and have no function [17]. Recent large-scale bioinformatics analyses showed that both strands of several miRNAs (e.g., miR-30a, miR-143, and miR-145) function jointly as tumor-suppressive miRNAs in cancer cells [18,19,20]. The involvement of miRNA passenger strands in human oncogenesis is a new concept in cancer biology.
In this study, we newly generate a miRNA expression signature in clinical specimens of HNSCC by using RNA sequencing. Analysis of the signature is used to reveal the downregulation of miR-139-5p (the guide strand) and miR-139-3p (the passenger strand) in cancer tissues, and their downregulation is confirmed by an analysis of The Cancer Genome Atlas (TCGA). We demonstrate the tumor-suppressive functions of these two miRNAs and identify their target oncogenes in HNSCC. This is the first report of the involvement of the passenger strand miR-139-3p and its target genes in HNSCC. Our miRNA-based strategy will increase knowledge on the molecular pathogenesis of HNSCC.

2. Results

2.1. Generation of a miRNA Expression Signature in HNSCC

A total of six cDNA libraries were prepared from clinical specimens of HNSCC (three pairs of normal and cancer tissues) and were analyzed by using RNA sequencing. The clinical features of the HNSCC patients are summarized in Table S1. We performed RNA sequencing after a trimming procedure, and 955,314–1,927,436 reads were successfully mapped to miRNA loci within the human genome (Table S2). A total of 112 miRNAs were significantly downregulated (log2 fold change < −2.0 and p-value < 0.05) in the HNSCC tissues (Figure 1A and Table S3). Notably, our signature showed that both strands of nine pre-miRNAs (miR-1, miR-30a, miR-483, miR-99a, miR-139, miR-190a, miR-199b, miR-204, and miR-378a) were downregulated in the HNSCC tissues (Table S3). We focused on miR-139 out of these nine pre-miRNAs. To confirm the accuracy of our miRNA signature, we evaluated the expression levels of miR-139-5p and miR-139-3p in the HNSCC tissues by using the TCGA-HNSC datasets. The expression levels of miR-139-5p (p < 0.001) and miR-139-3p (p < 0.001) were significantly lower in the HNSCC tissues (Figure 1B).

2.2. Effects of Ectopic Expression of miR-139-5p and miR-139-3p on HNSCC Cell Proliferation, Migration, and Invasion

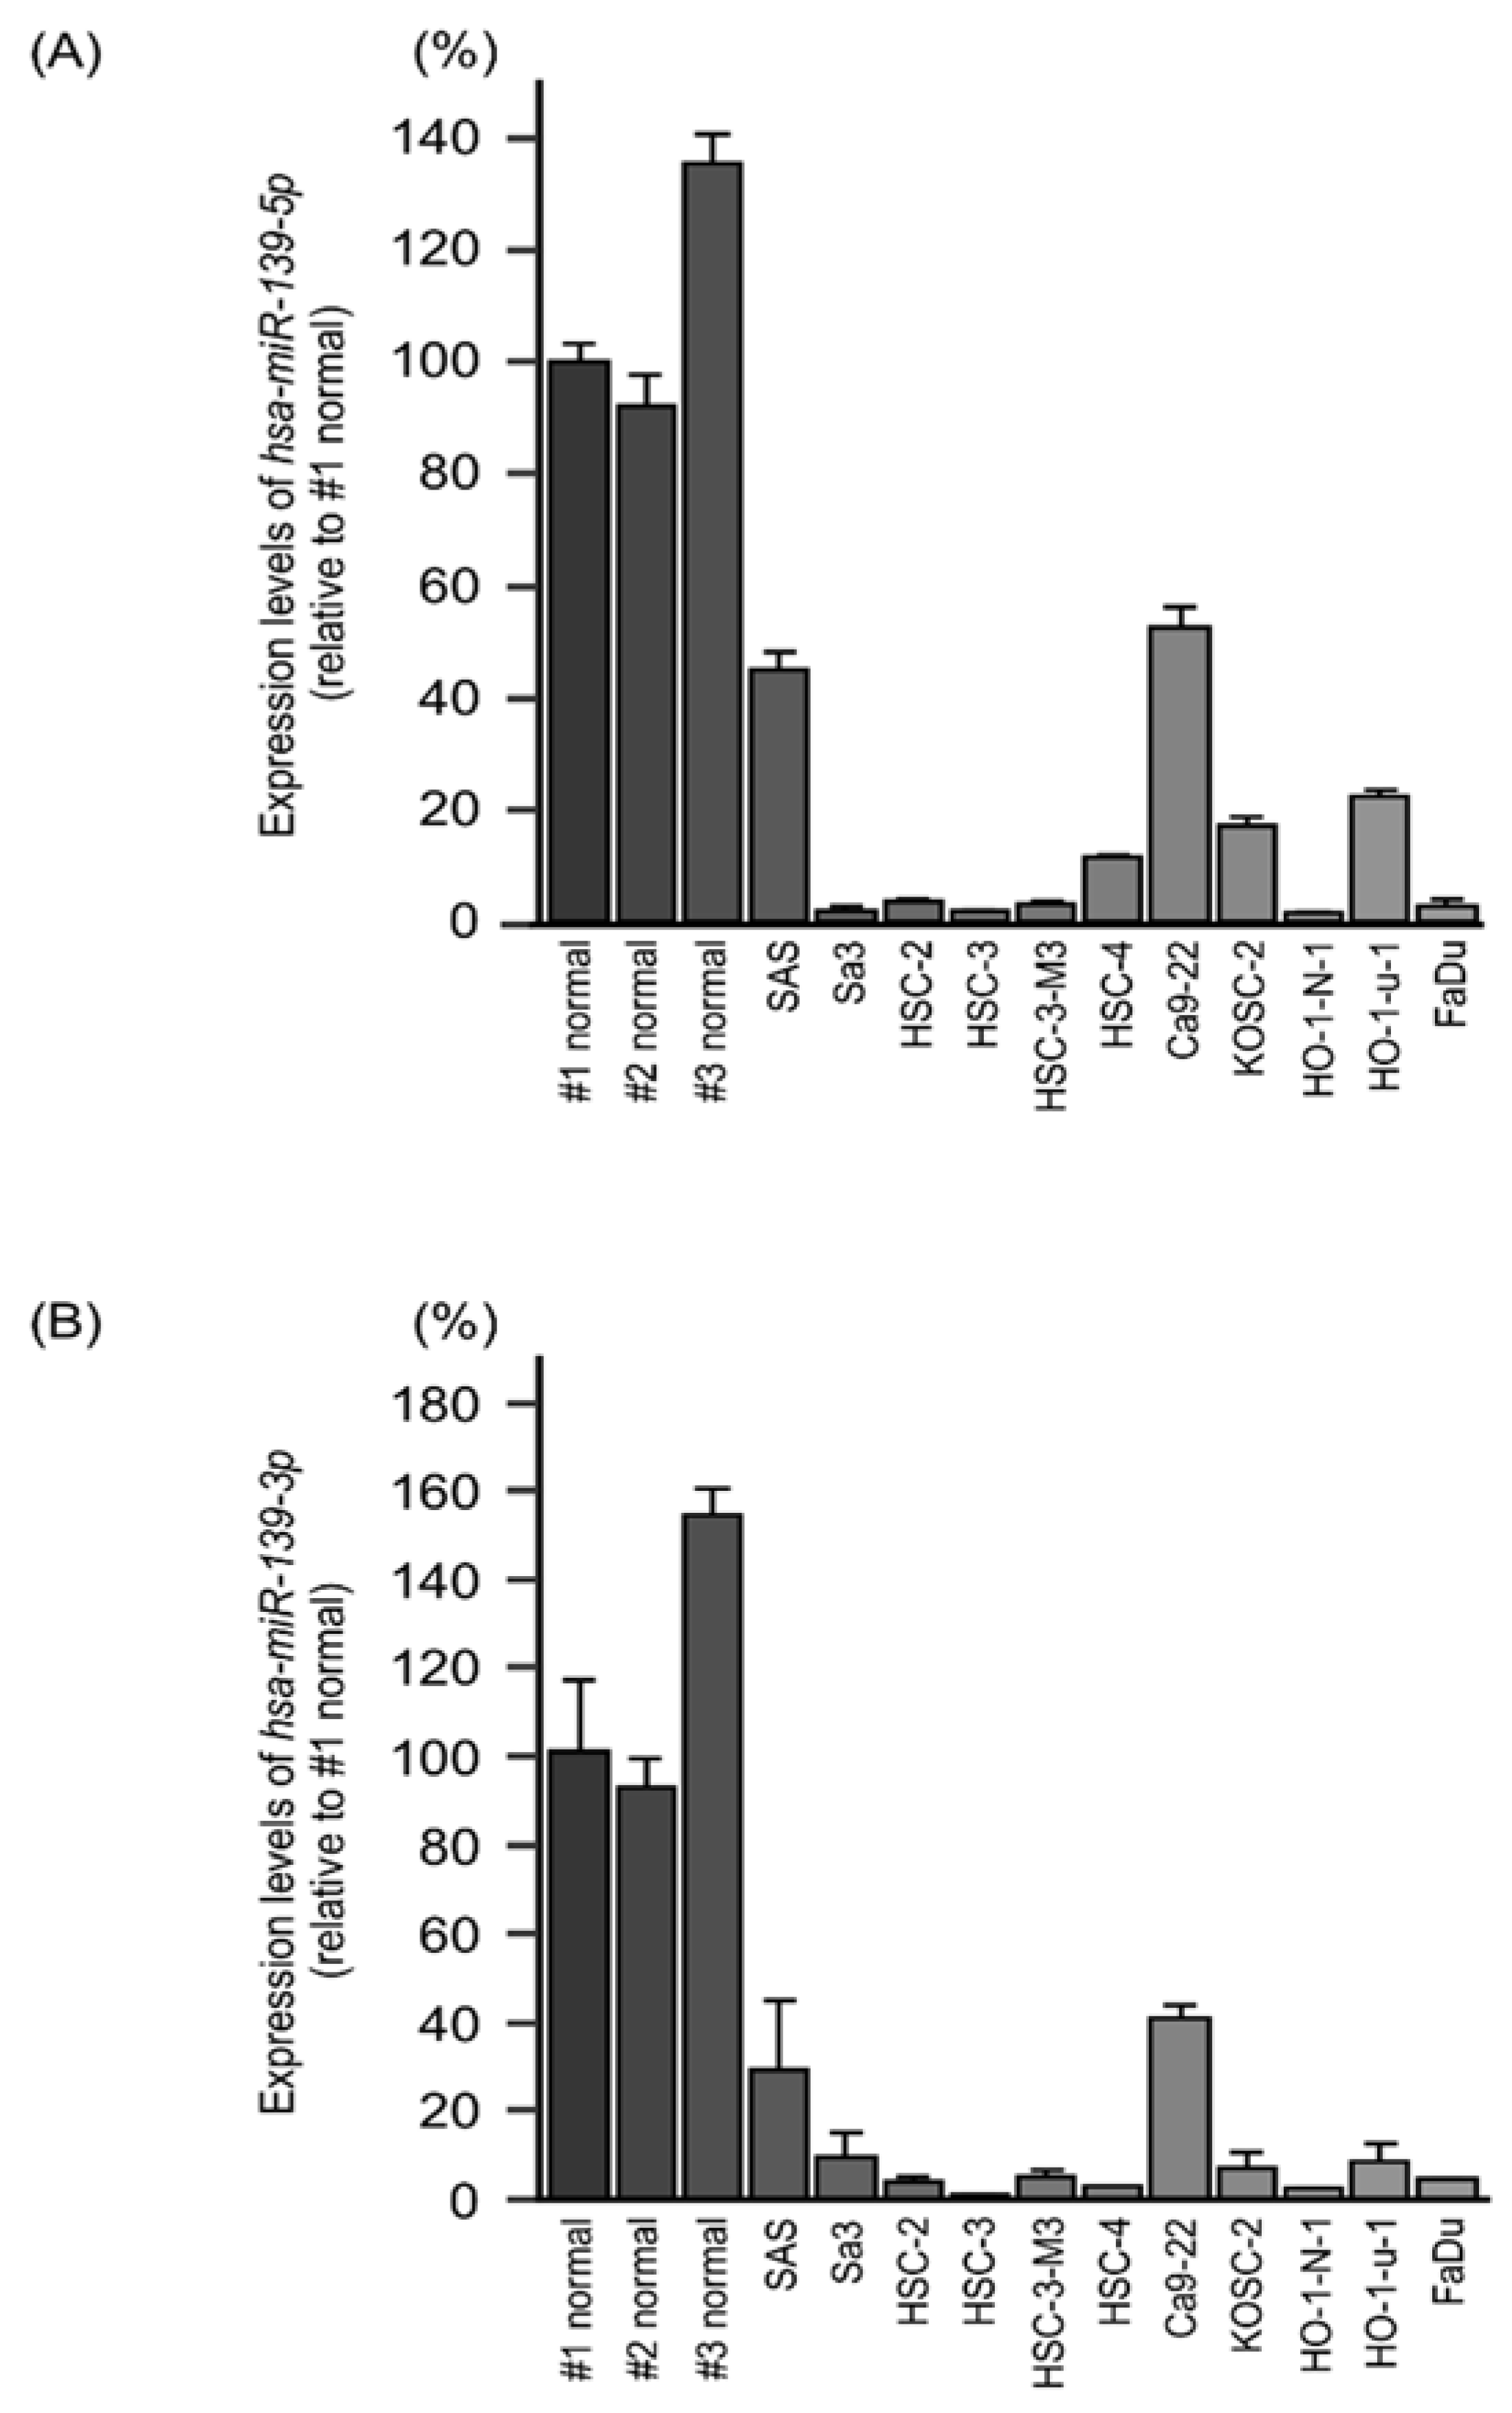
We examined the expression levels of miR-139-5p and miR-139-3p and performed functional assays of these miRNAs in two HNSCC cell lines, Sa3 and HSC-3. In these cell lines, the expression levels of miR-139-5p and miR-139-3p were lower than those in normal epithelial tissues (Figure 2). Normal oral tissues were derived from HNSCC patients, and the details are summarized in Table S1.
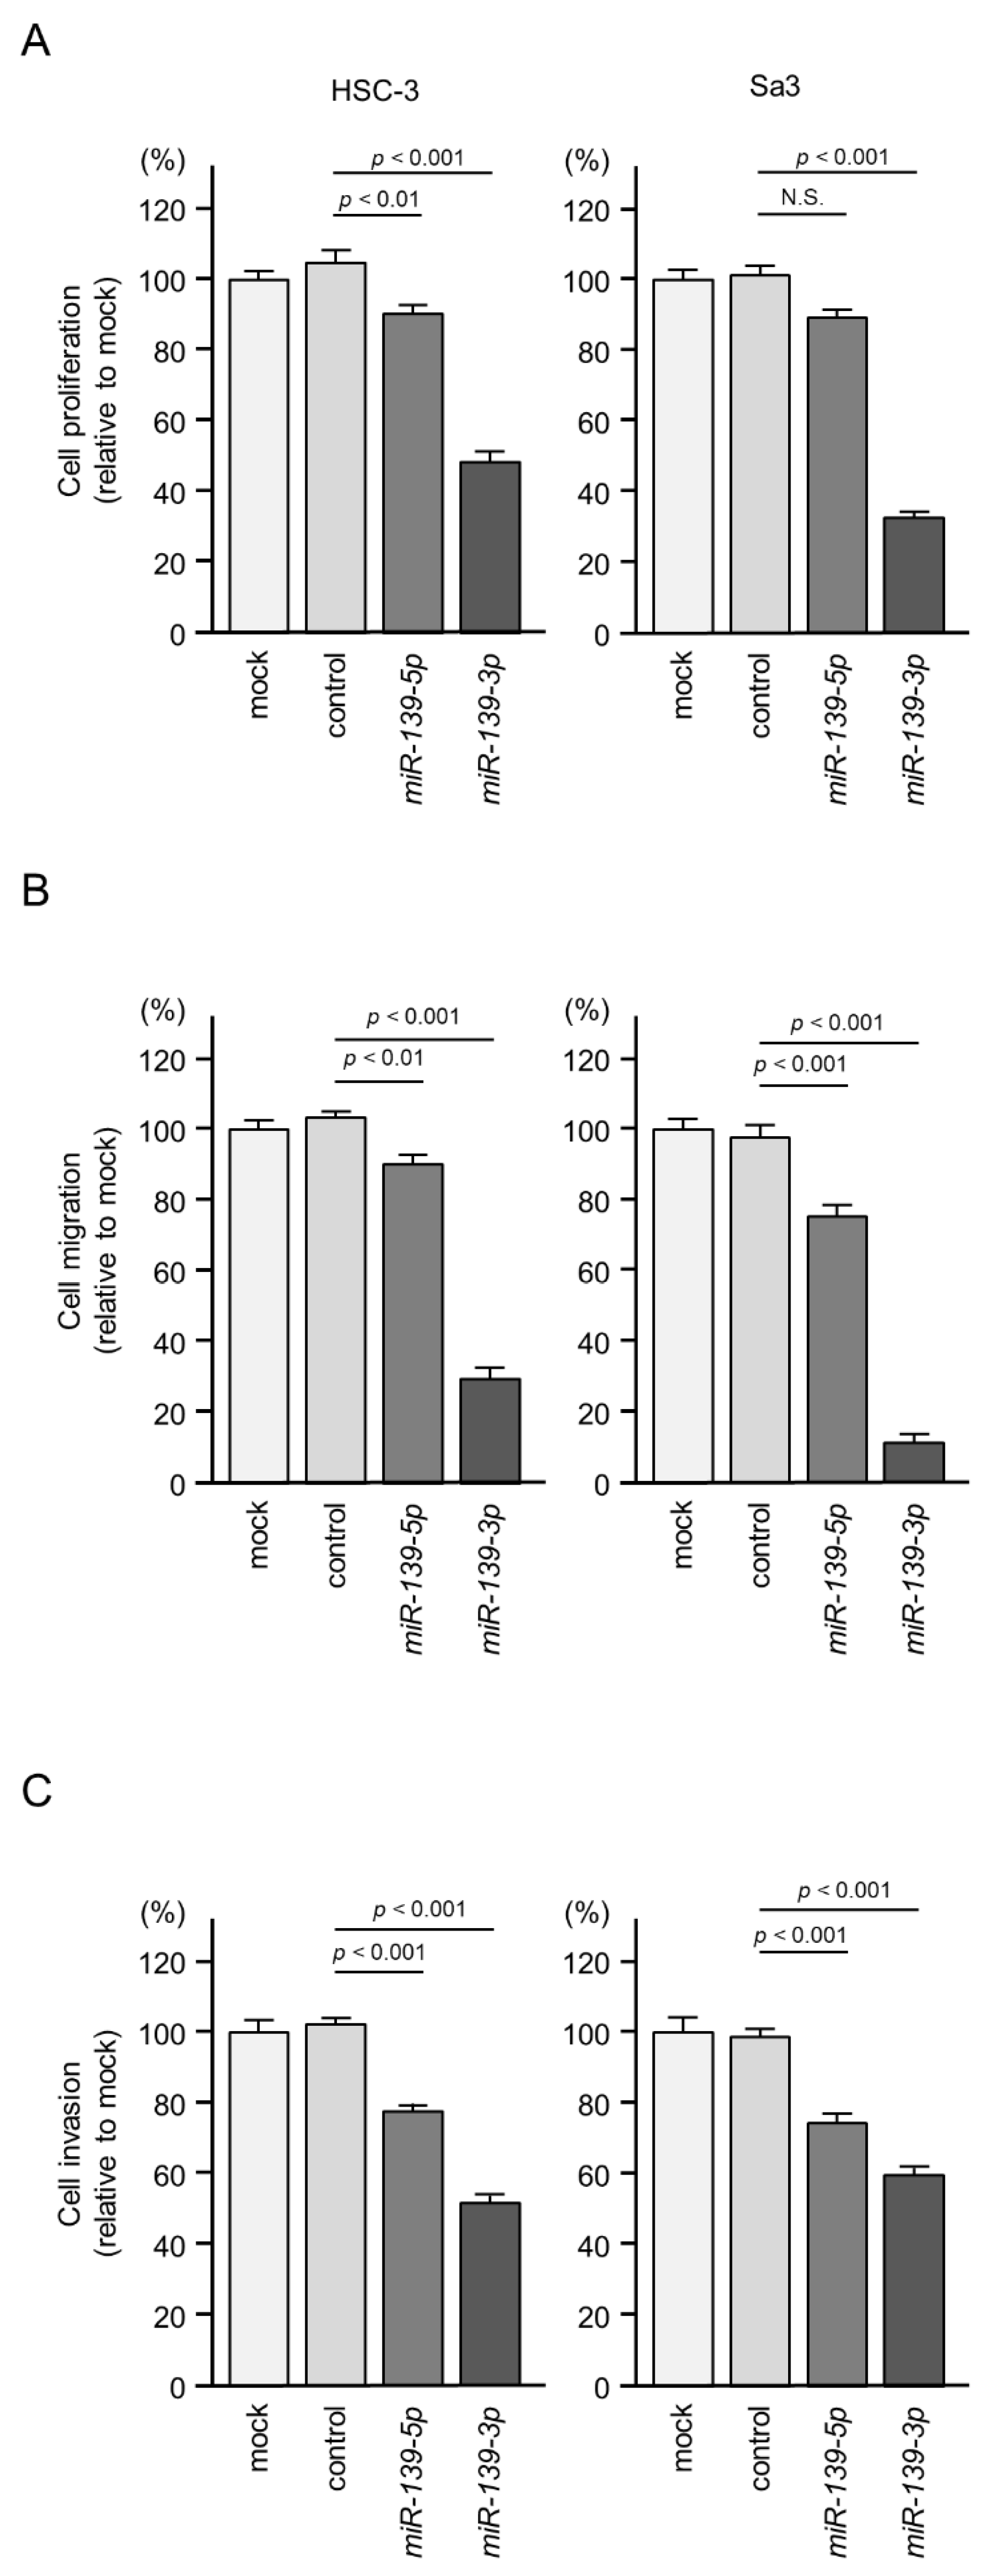
To investigate the tumor-suppressive roles of miR-139-5p and miR-139-3p, we ectopically expressed mature miR-139-5p (UCUACAGUGCACGUGUCUCCAGU) and miR-139-3p (UGGAGACGCGGCCCUGUUGGAGU) in Sa3 and HSC-3 cells and assessed the cell functions. Cancer cell malignant features were blocked by the ectopic expression of miR-139-5p or miR-139-3p (Figure 3A–C). Cell proliferation, migration, and invasion features were markedly suppressed by miR-139-3p expression (Figure 3A–C). Typical images of cells from the migration and invasion assays are shown in Figure S1.

2.3. Identification of Putative Oncogenic Targets through miR-139-5p and miR-139-3p Regulation in HNSCC Cells

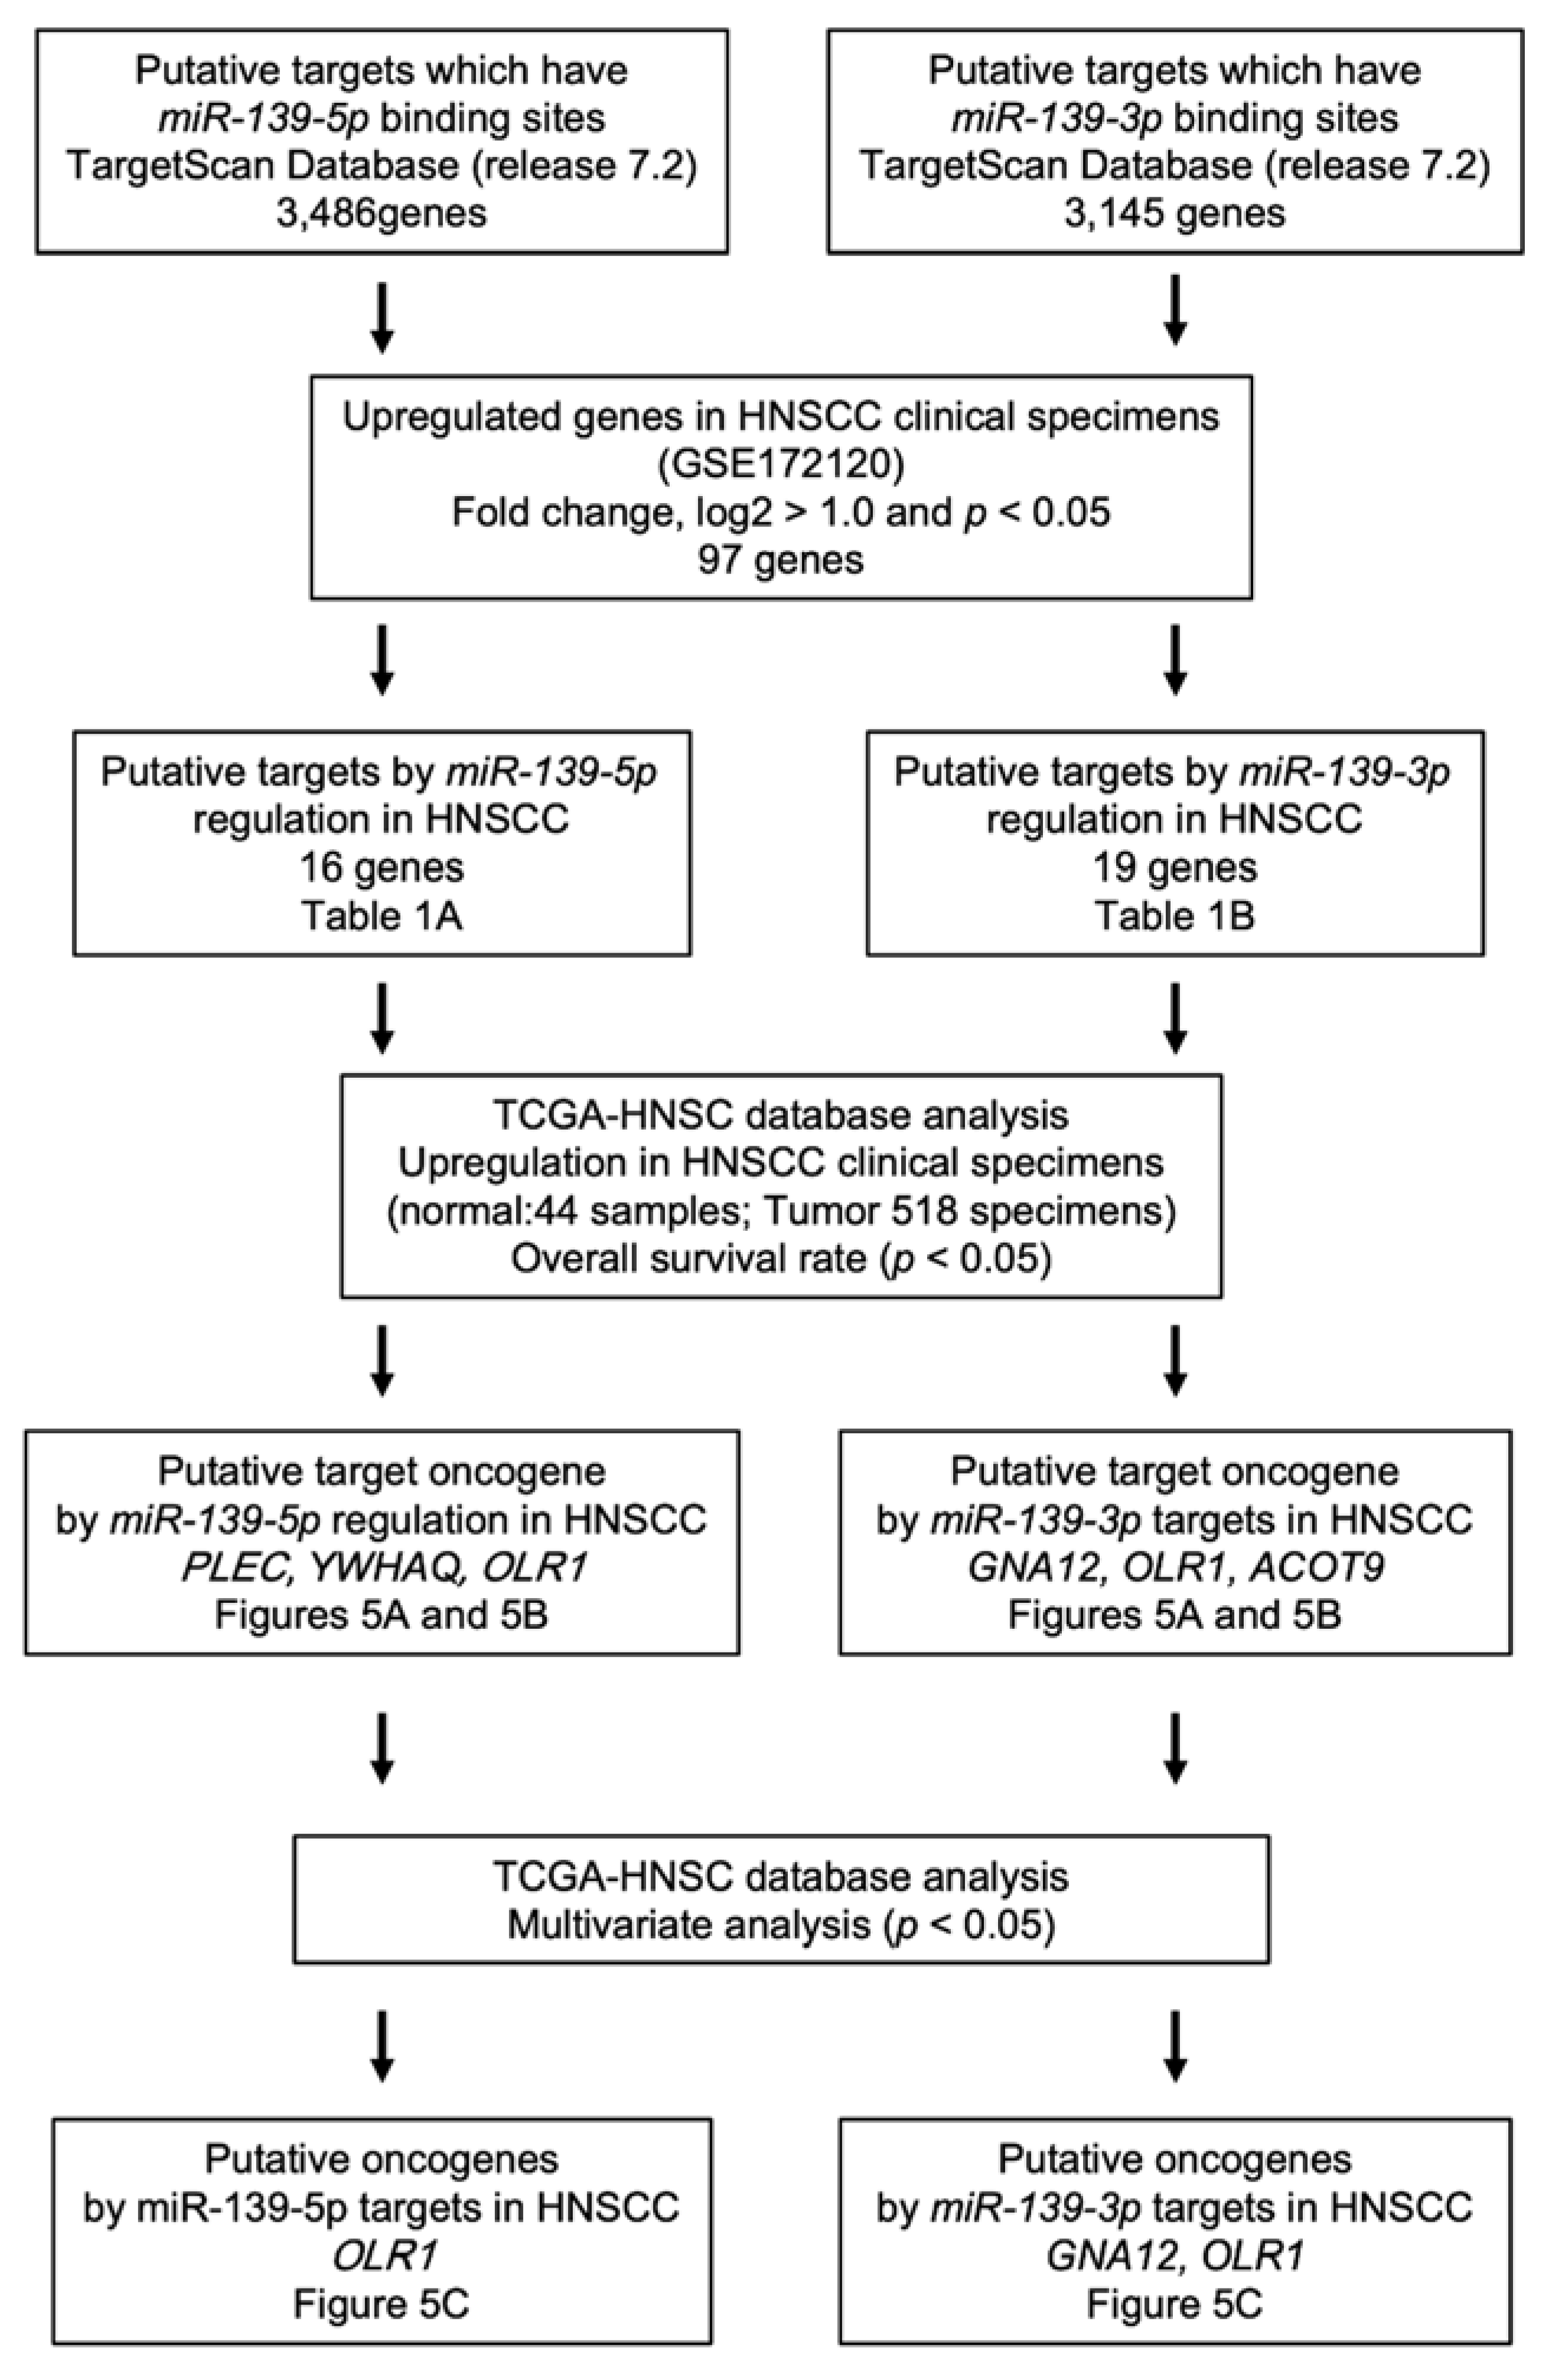
To identify the putative oncogenic targets of miR-139-5p or miR-139-3p in HNSCC cells, we used the TargetScanHuman database (release 7.2) and gene expression data (GSE172120: genes upregulated in clinical specimens of HNSCC). Our strategy for identifying the miR-139-5p and miR-139-3p target genes is shown in Figure 4.
The analysis of the TargetScan database showed that 3486 and 3145 genes had putative miR-139-5p and miR-139-3p binding sites, respectively, within their sequences (Figure 4). As the tumor suppressor miRNA targets were assumed to be upregulated in cancer tissue, we also performed a genome-wide gene expression analysis in the same clinical specimens used to generate the miRNA signature. The results revealed that 97 genes were significantly upregulated (log2 fold change > 1.0 and p-value < 0.05) in HNSCC tissues (Table S4).
The TargetScan and gene expression datasets were merged to determine the oncogenic targets of miR-139-5p or miR-139-3p in HNSCC cells. A total of 28 genes were upregulated in HNSCC tissues, and these genes had a putative miR-139-5p or miR-139-3p binding site in their 3′UTR (Table 1).
We validated the expression levels of these 28 target genes by using RNA sequencing data obtained from clinical specimens of HNSCC in TCGA. The expression of 24 genes (BCL11B, DOCK5, PLEC, SRPK2, TNFSF10, ELAVL2, YWHAQ, GNA12, HIST2H2BF, SLC43A2, TMEM184B, STRIP2, PDK1, OLR1, NAV1, MKI67, SLC25A37, OSBPL3, HES6, ABCA1, ACOT9, NKD1, APP, and SLC16A3) was upregulated in the HNSCC tissues (n = 518) compared with normal tissues (n = 44) (Figure S2A,B).

2.4. Clinical Significance of the Putative Target Genes of miR-139-5p and miR-139-3p Determined by the TCGA Analysis

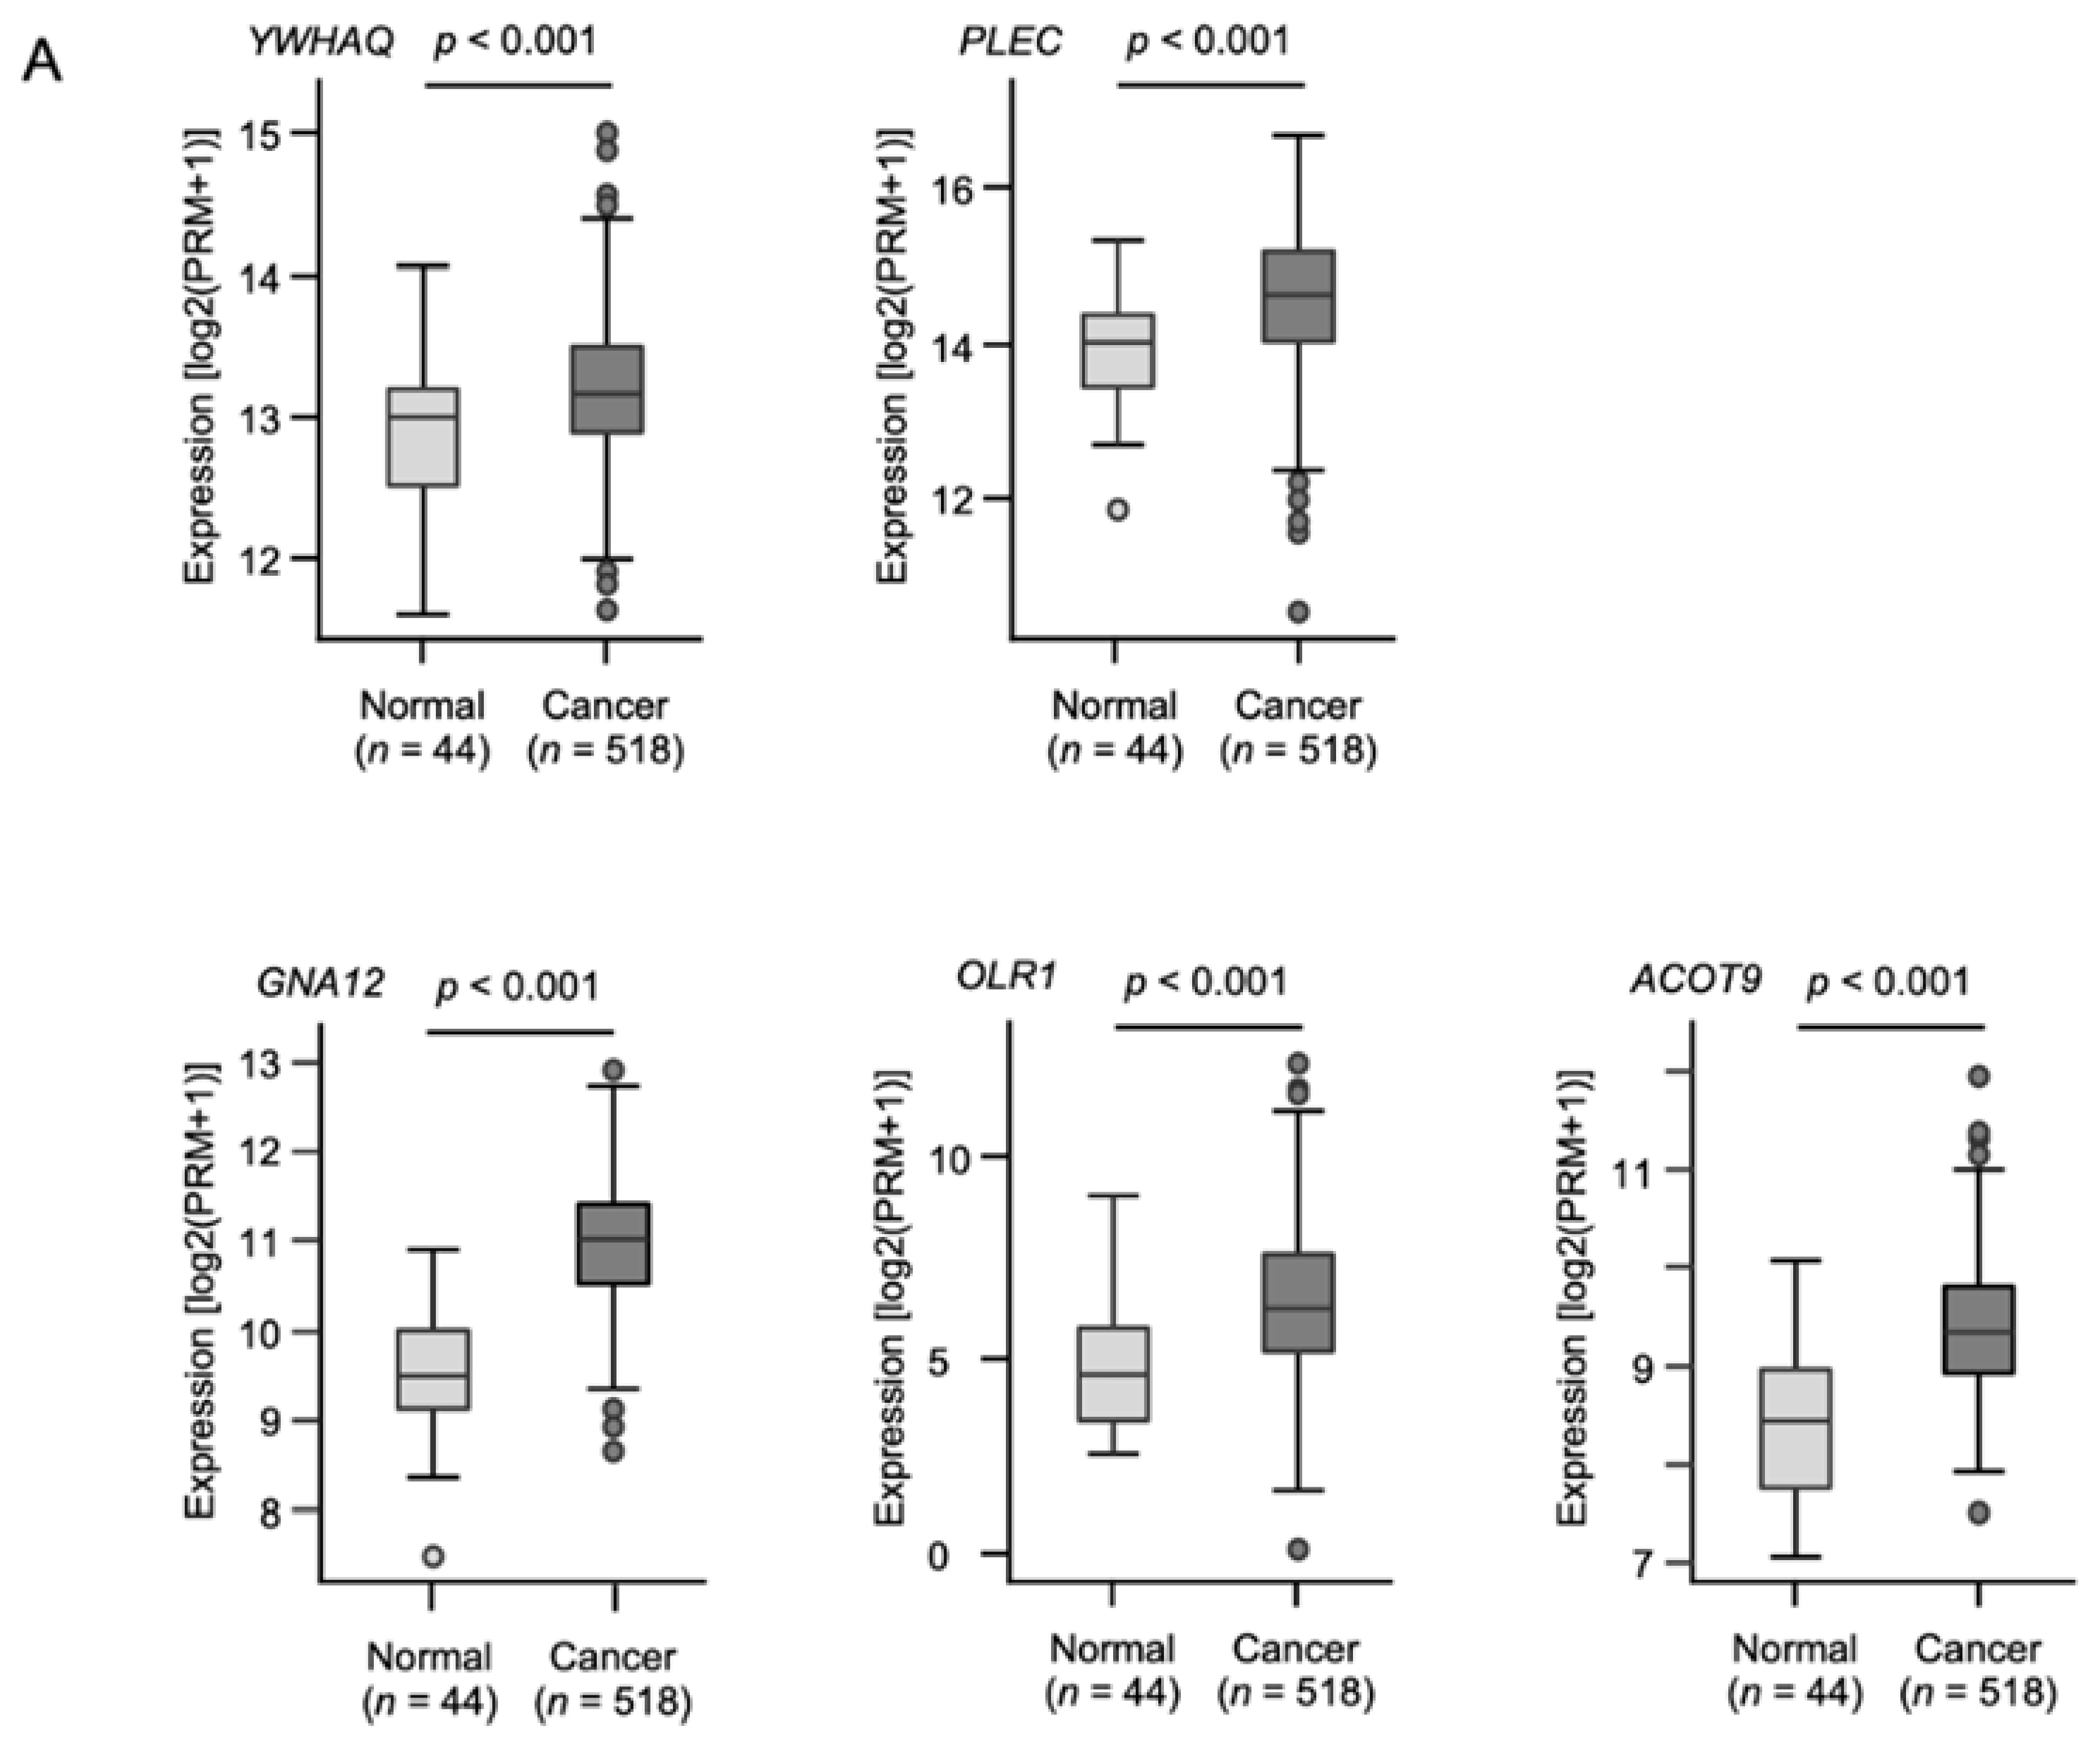
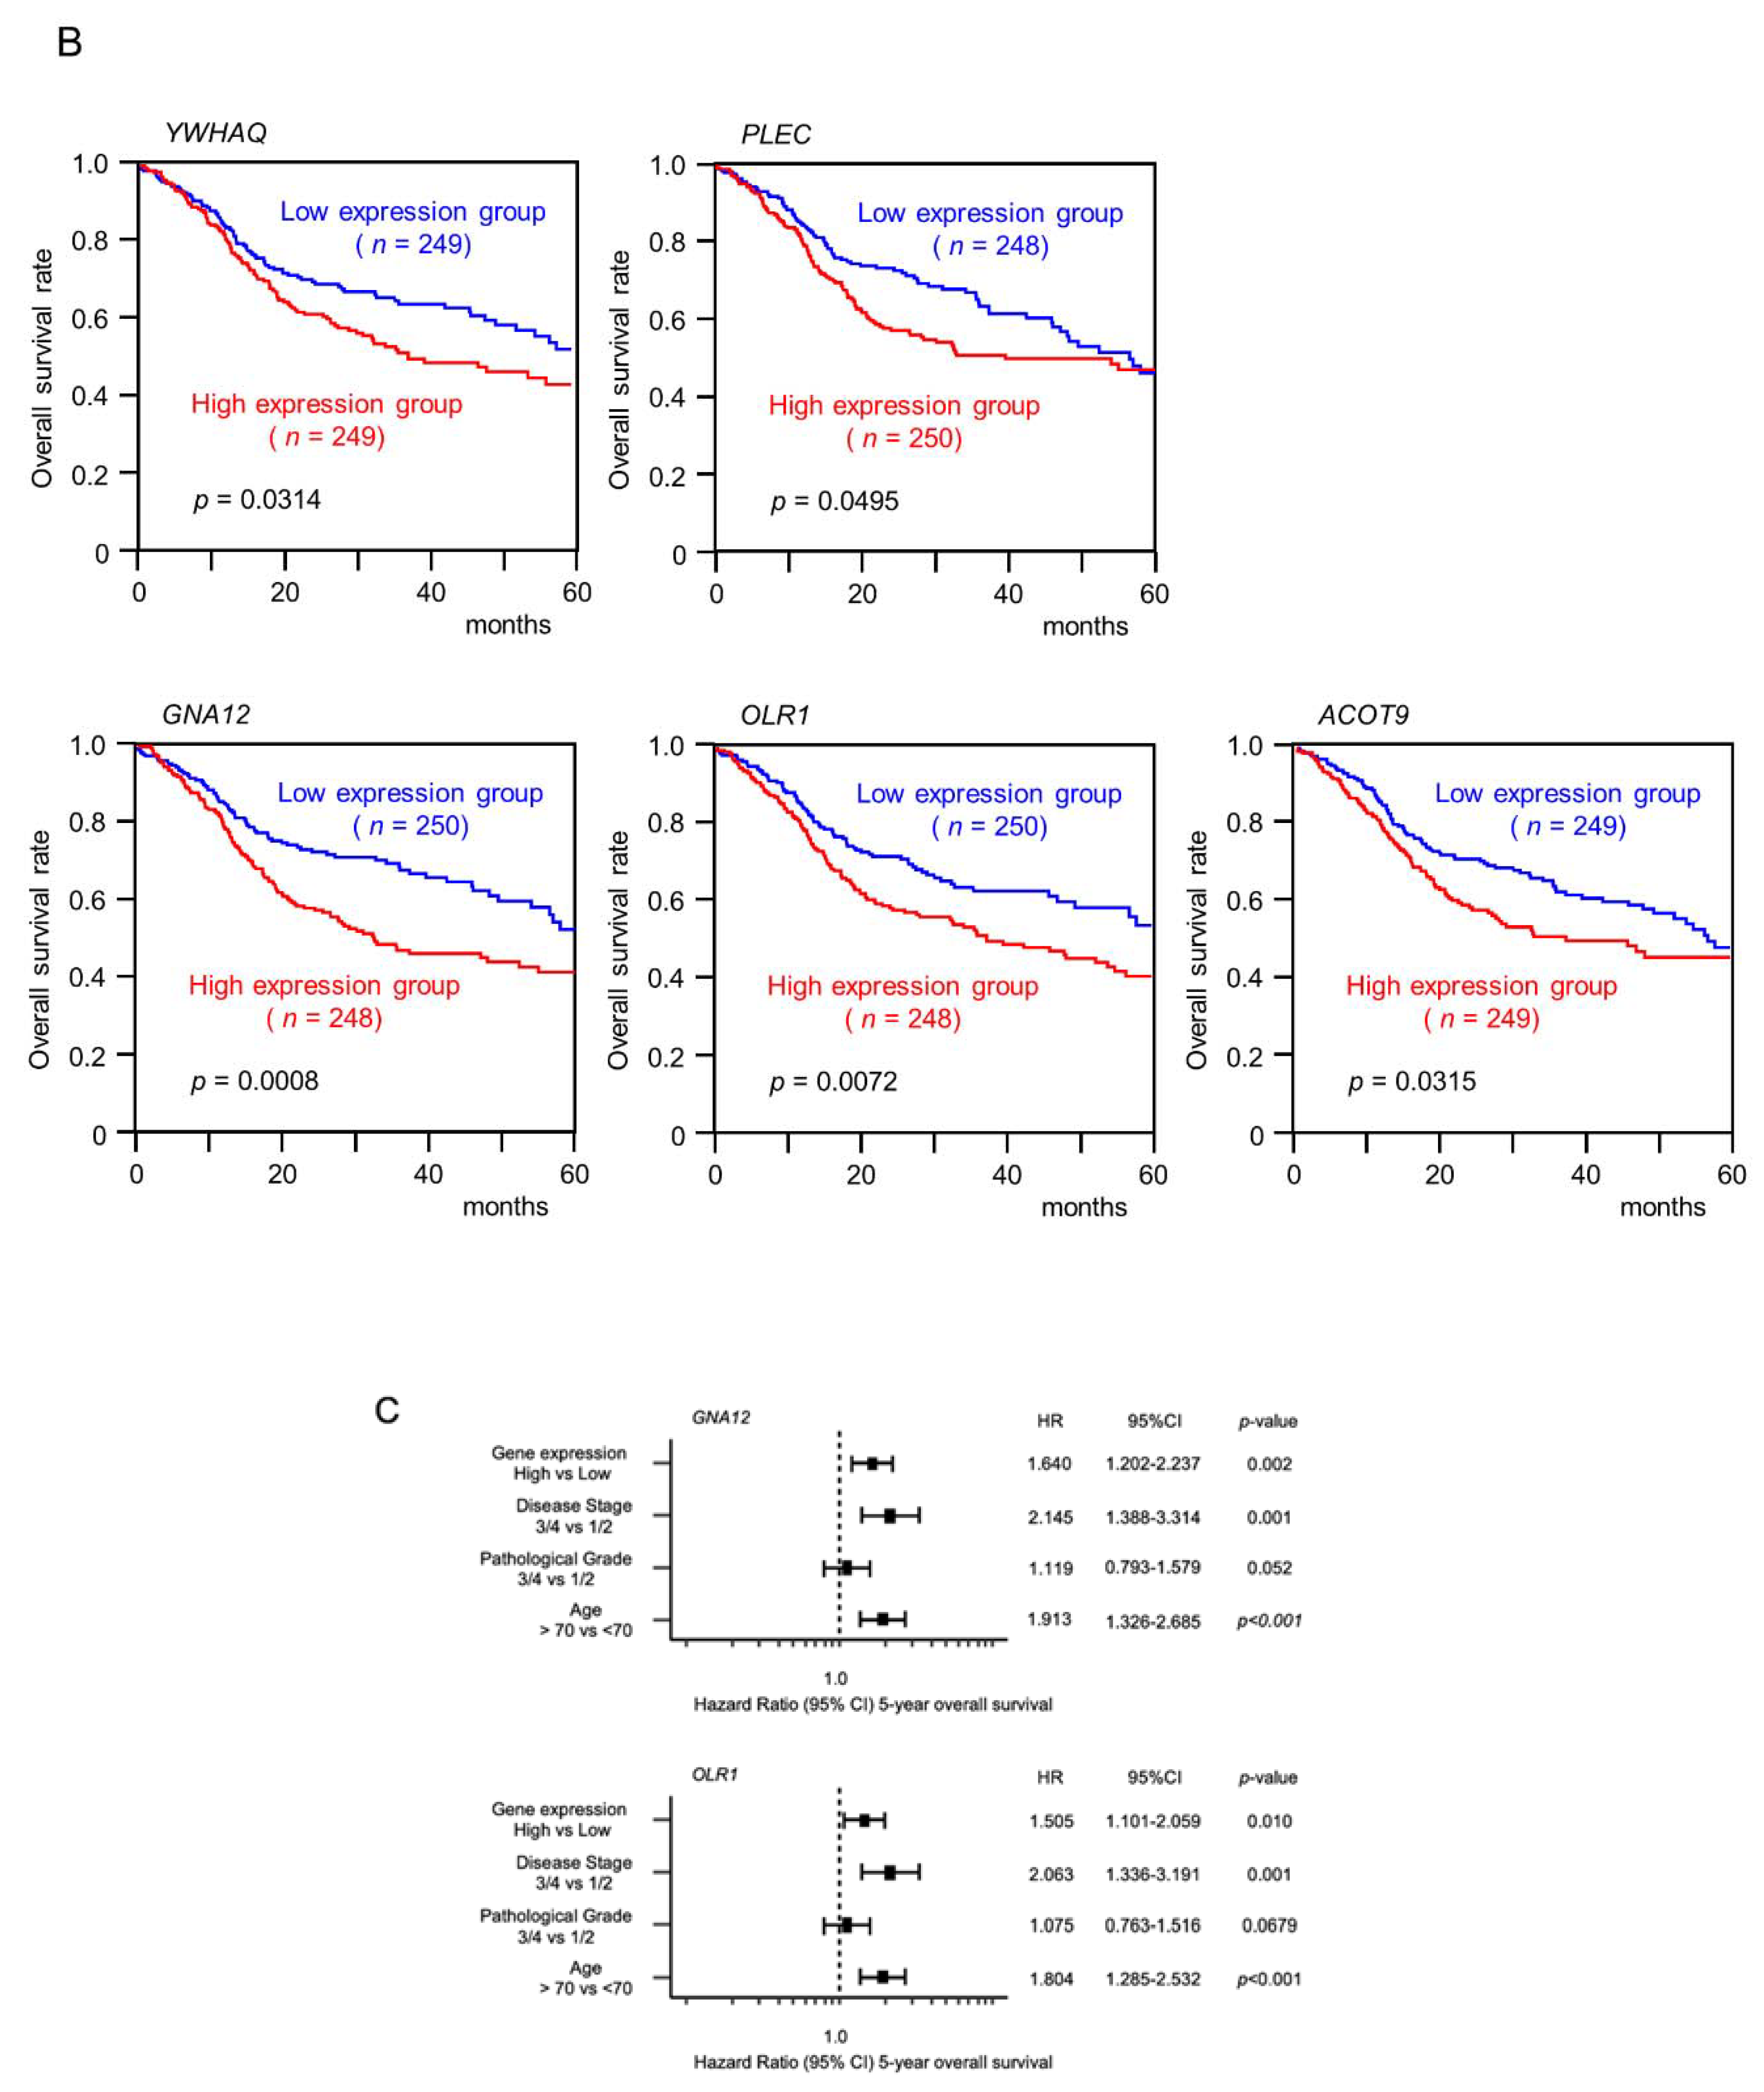
To determine clinical usefulness, a clinicopathological analysis of these putative target genes was performed with the TCGA-HNSC data. Five of the genes (PLEC, YWHAQ, GNA12, OLR1, and ACOT9) were upregulated in HNSCC (Figure 5A), and a significantly worse prognosis was predicted in patients with HNSCC (Figure 5B). Of those genes, GNA12 and OLR1 were identified as independent prognostic factors through a multivariate Cox regression analysis (Figure 5C).

2.5. Direct Regulation of GNA12 and OLR1 by miR-139-3p in HNSCC Cells

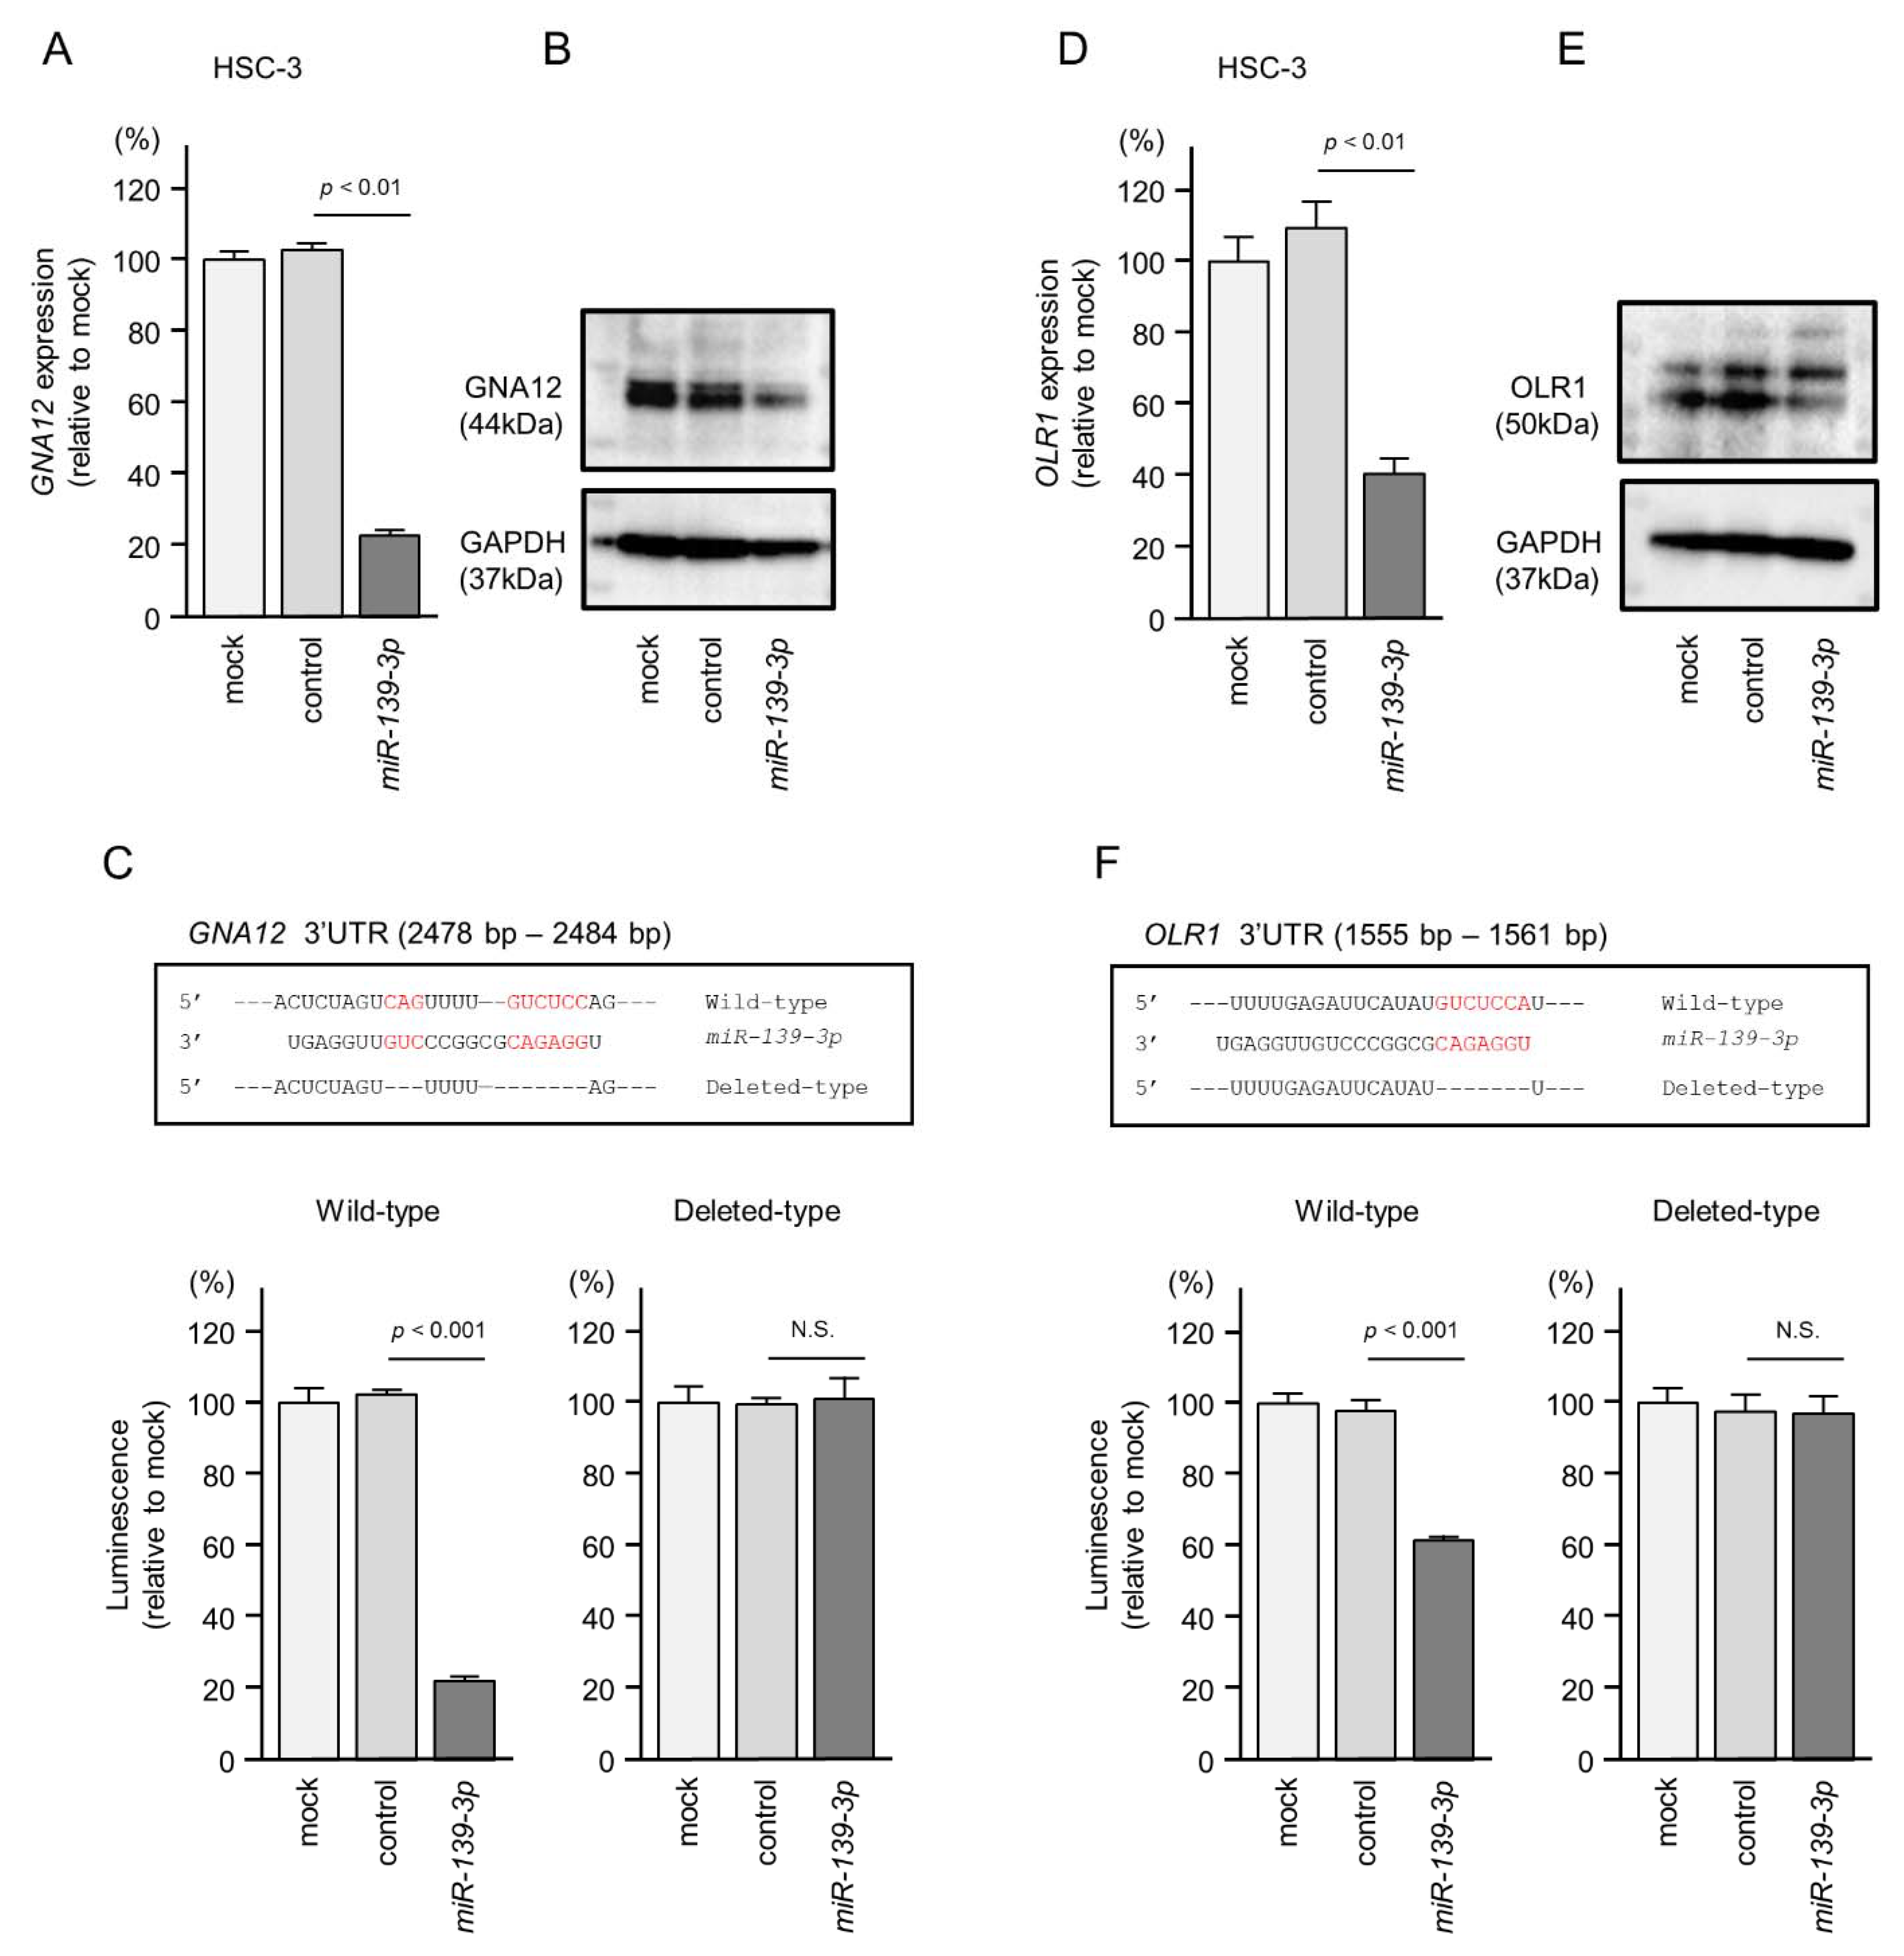
To investigate whether the expression of GNA12 and OLR1 is regulated directly by pre-miR-139 in HNSCC cells, we performed real-time PCR, Western blotting, and dual luciferase reporter assays. In HSC-3 cells transfected with miR-139-3p, both the mRNA and protein levels of GNA12 were markedly reduced (Figure 6A,B).
The dual luciferase reporter assays showed that miR-139-3p binds directly to GNA12. Luciferase activity was significantly reduced after transfection of a vector harboring the wild-type GNA12 3′-UTR sequence (containing the miR-139-3p binding site). In contrast, luciferase activity was not reduced after transfection of a vector harboring a GNA12-deleted sequence (lacking the miR-139-3p binding site) (Figure 6C). These data suggest that miR-139-3p binds directly to the 3′-UTR of GNA12 to control its expression.
The TargetScan database shows that the binding sites of both miR-139-5p and miR-139-3p are located within the 3′UTR of the OLR1 gene. We investigated the involvement of these miRNAs in the expression control of OLR1 in HNSCC cells. As a result, miR-139-5p was not involved in OLR1 expression (Figure S3).
Both the mRNA and protein levels of OLR1 were significantly downregulated after miR-139-3p transfection in HSC-3 cells (Figure 6D,E). Luciferase activity was significantly reduced after transfection with a vector harboring the wild-type sequence—but not with that harboring a deleted sequence—of the OLR1 3′-UTR (Figure 6F). These data suggest that miR-139-3p directly controls OLR1 expression by binding to its 3′-UTR in HNSCC cells.

2.6. Overexpression of GNA12 and OLR1 in Clinical Specimens of HNSCC

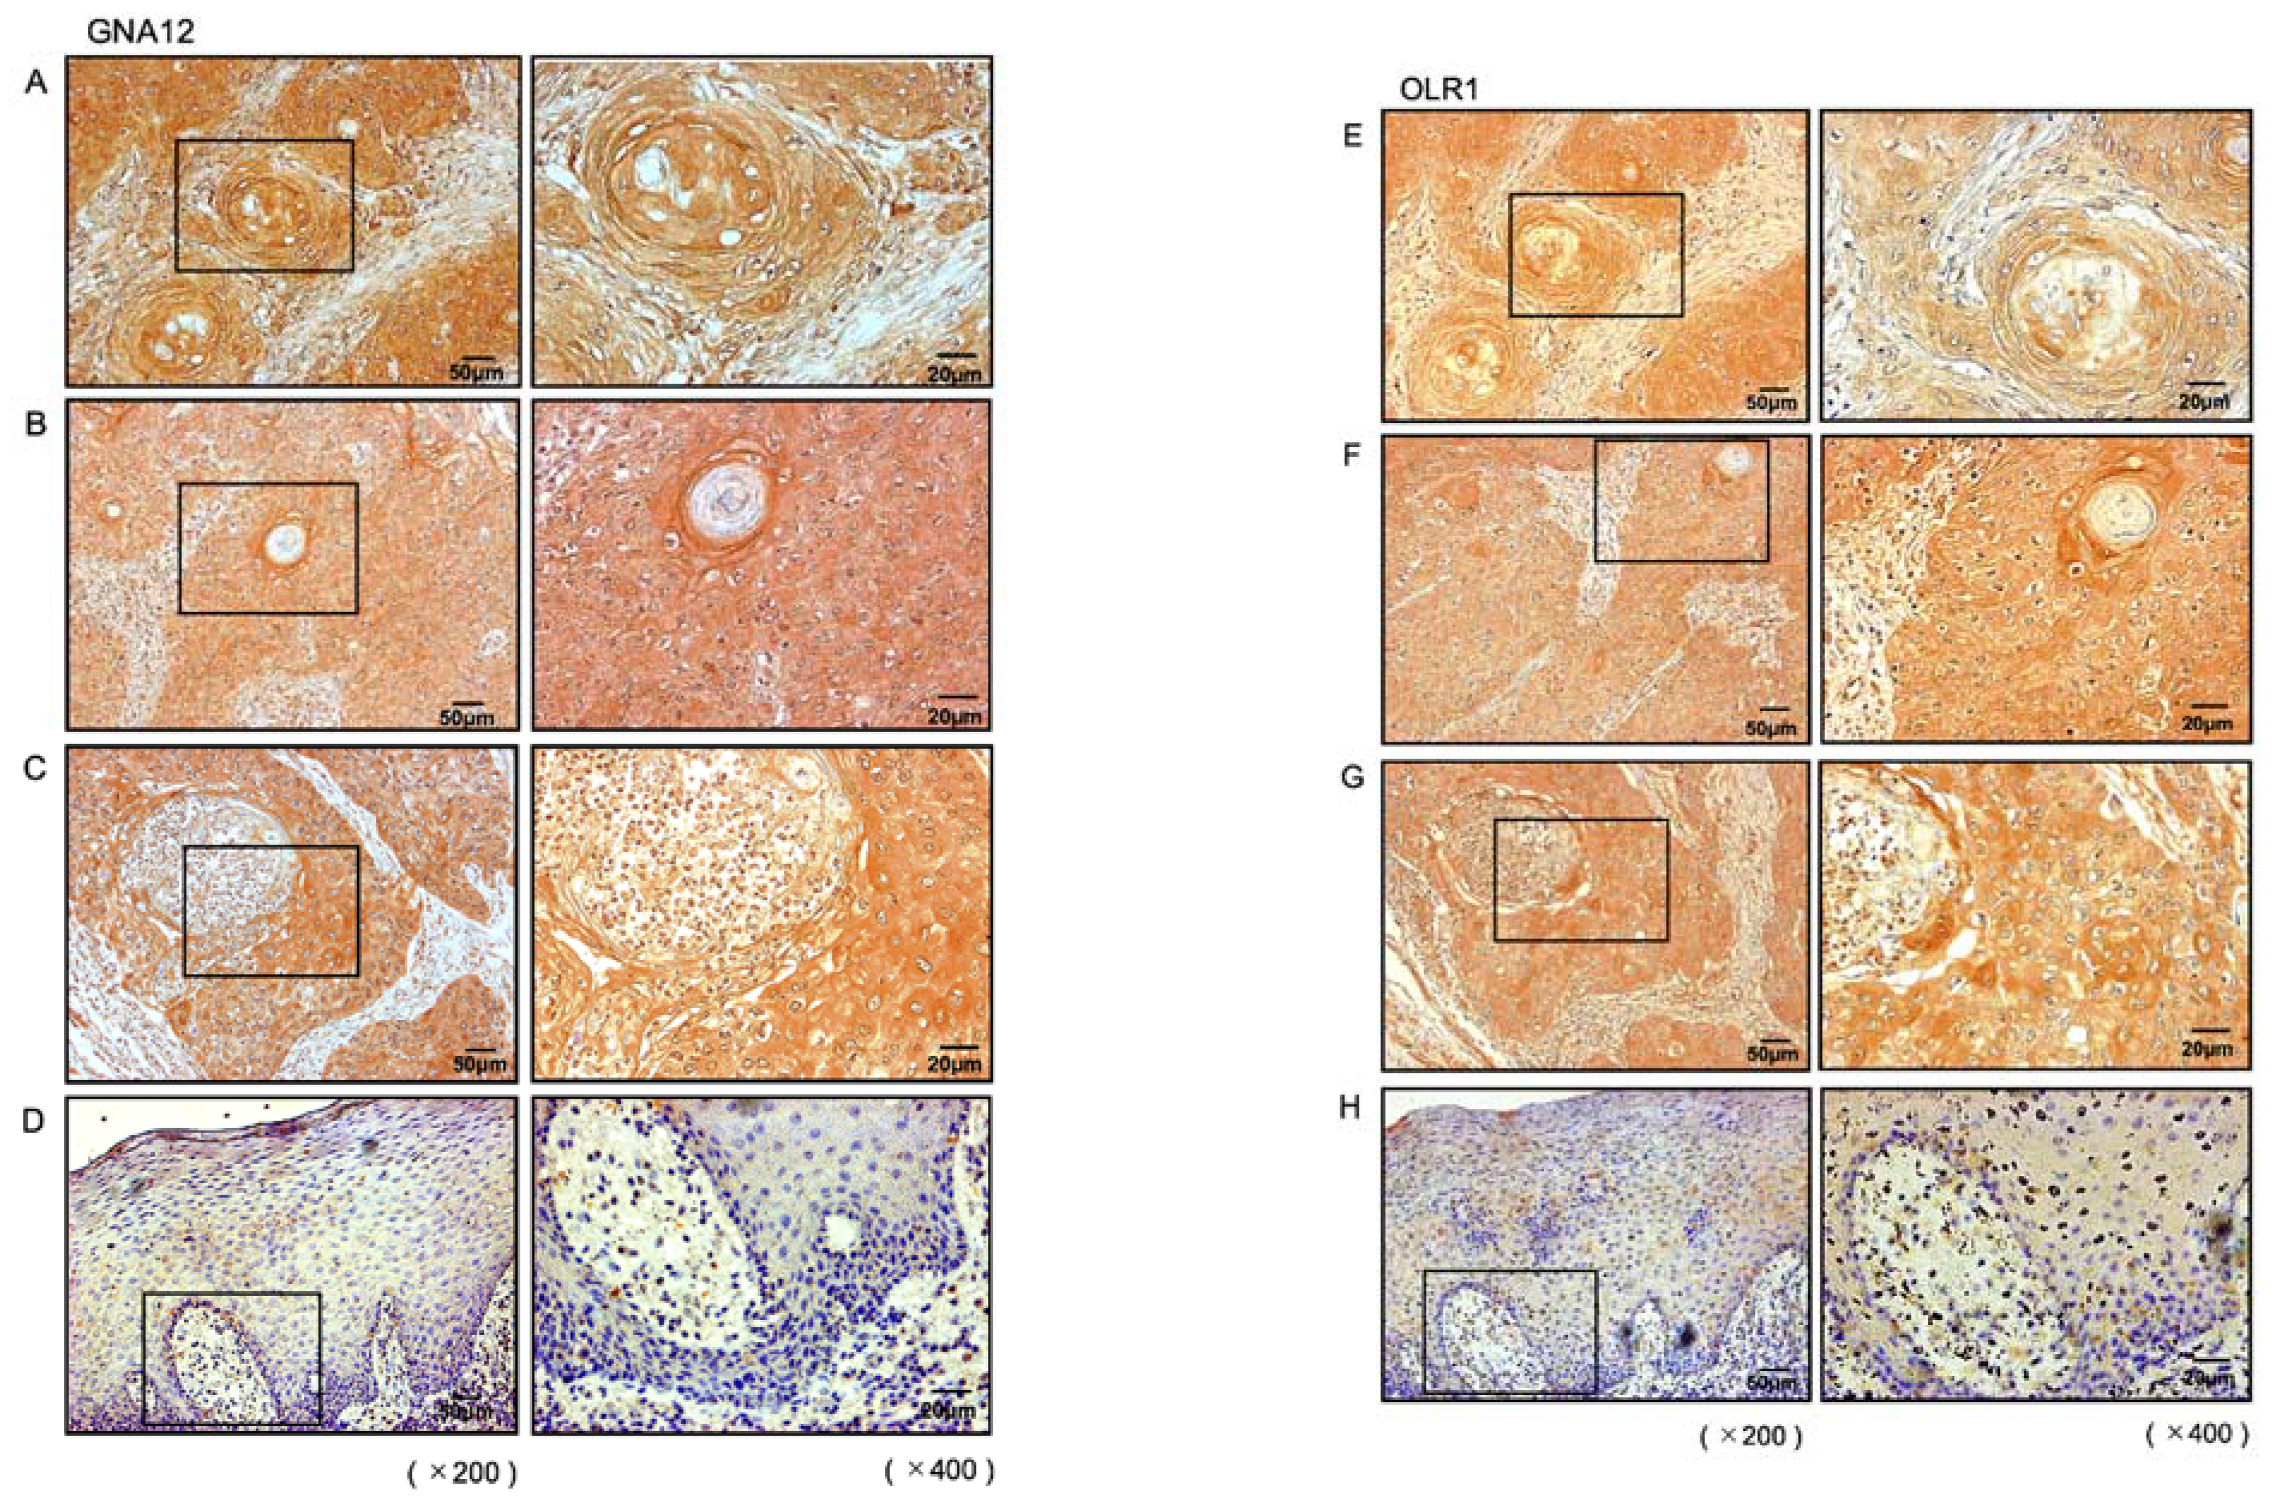
The expression of the GNA12 and OLR1 proteins was evaluated by immunostaining in clinical specimens of HNSCC. High expression of GNA12 was detected in HNSCC lesions (Figure 7A–C). In contrast, normal epithelial tissues showed weak immunostaining (Figure 7D). High expression of OLR1 was detected in HNSCC lesions, in contrast to the weak staining in the normal epithelium (Figure 7E–H). The clinical features of three of the HNSCC cases used for immunohistochemical staining are summarized in Table S5.

2.7. GNA12- and OLR1-Mediated Pathways in HNSCC Cells

Finally, we investigated the genes that were differentially expressed between the high and low GNA12 or OLR1 expression groups in an HNSCC cohort from TCGA using a gene set enrichment analysis. As a result, 19 and 14 gene sets were significantly enriched (FDR q-value < 0.05) in the high GNA12 and OLR1 expression groups, respectively (Table 2). The most enriched gene set in both the GNA12 and OLR1 expression groups was that of the “epithelial–mesenchymal transition” (Table 2 and Figure S4). These results indicate that GNA12 and OLR1 play roles as oncogenes in HNSCC via the epithelial–mesenchymal transition pathway.

3. Discussion

Due to the high rate of recurrence and metastasis after the initial treatment, the prognosis of patients with HNSCC remains poor [4,21]. Recently developed molecule-targeted drugs and immune checkpoint inhibitors have not significantly improved the prognosis of patients [5,22,23]. Therefore, novel treatment options for patients with advanced HNSCC are urgently needed. The elucidation of the molecular mechanisms underlying the oncogenesis of HNSCC is indispensable for finding therapeutic target molecules.
We have continued to use miRNA-based approaches in order to identify potential prognostic markers and therapeutic targets for HNSCC [24]. Our previous studies showed that certain integrins are controlled directly by tumor-suppressive miRNAs (e.g., miR-29-family, miR-150, and miR-199a) and that the activation of signaling mediated by ITGA3/ITGB1 and ITGA6 enhances the aggressiveness of HNSCC [12,16,25]. In addition, the expression of ITGA3 predicted poorer survival of patients with HNSCC [16].
Recently available small-RNA-sequencing methods are suitable for generating miRNA expression signatures in a wide range of human cancers. Our research group has generated miRNA signatures in several types of cancers [13,26,27,28,29]. Interestingly, these signatures revealed that some passenger strands of miRNAs (e.g., miR-99a-3p, miR-101-3p, miR-144-5p, miR-145-3p, and miR-150-3p) are downregulated in cancer tissues, and these miRNAs actually function as tumor suppressors [15,27,29,30,31]. The original miRNA theory indicates that the passenger strand of a miRNA duplex is degraded in the cytoplasm and is nonfunctional [17]. Recently, a large-scale in silico analysis of miRNAs in more than 5200 patient samples representing 14 different cancers was performed. That study demonstrated that some miRNAs (e.g., both strands of miR-28, miR-30a, miR-139, miR-144, and miR-145) coordinately modulate oncogenic pathways [32]. Simultaneous analysis of miRNA-controlled oncogenic networks will lead to the elucidation of new molecular mechanisms in human cancers.
In this study, we determined the miRNA expression signature of HNSCC by using clinical specimens. The analysis of the signature showed that a total of 112 miRNAs were significantly downregulated (log2 fold change < −2.0 and p-value < 0.05) in cancer tissues. Interestingly, among these downregulated miRNAs, 31 were annotated as passenger strands of miRNAs in the miRBase database. Functional analysis of these miRNAs and their regulated molecular networks will help elucidate the molecular pathogenesis of HNSCC.
Our previous studies revealed that miR-139-3p (the passenger strand of pre-miR-139) acts as a tumor-suppressive miRNA in bladder cancer [33] and renal cell carcinoma [34]. A single miRNA can control a vast number of RNAs in cells, and the genes controlled by a miRNA vary from cell to cell. In this study, we revealed that both strands of pre-miR-139 act as tumor-suppressive miRNAs in HNSCC cells. Previously, a vast number of studies reported that miR-139-5p plays a tumor-suppressive role in multiple cancers [35]. In oral squamous cell carcinoma (OSCC), miR-139-5p inhibited tumorigenesis by targeting HOXA9 and CXCR4 [36,37]. Recent studies showed that long non-coding RNAs (lncRNAs) are closely associated with human oncogenesis [11]. Several studies showed that LINC00152 acts as a cancer-promoting and metastatic lncRNA in multiple cancers [38]. A recent study indicated that the lncRNA LINC00152 adsorbs miR-139-5p and behaves as an oncogene in OSCC [39].
On the other hand, because it is a passenger strand, few studies have evaluated the functional significance of miR-139-3p in HNSCC cells. A previous study showed that the expression of miR-139-3p was suppressed by human papillomavirus 16, which, in turn, promoted oncogenesis in head, neck, and cervical cancers [40]. Another study showed that miR-139-3p is significantly downregulated in laryngeal squamous cell carcinoma and that its expression regulates several cancer-related genes, (e.g., RAB5A, ITGB1, FAK, PXN, VEGF, and MMP9) [41]. In breast cancer, expression of miR-139-3p was downregulated in cancer tissues and cell lines, and its expression was associated with a poor prognosis in breast cancer patients [42]. Overexpression of miR-139-3p inhibited malignant cancer cell phenotypes by targeting RAB1A [42]. Judging from previous studies and our studies, both the guide and passenger strands of miR-139 have tumor-suppressive functions, and the search for molecular pathways controlled by each strand will contribute to the elucidation of the molecular mechanisms of HNSCC.
Our next focus was to identify the oncogenic targets regulated by each strand of miR-139 (miR-139-5p and miR-139-3p) in HNSCC cells. Our in silico analysis identified five genes (PLEC, YWHAQ, GNA12, OLR1, and ACOT9) that were closely associated with a poor prognosis of patients with HNSCC. Importantly, two of those genes (GNA12 and OLR1) were independent prognostic markers in patients with HNSCC.
GNA12 (Ga12) is the alpha subunit of G proteins (heterotrimeric guanine nucleotide-binding protein), which are classified into four subfamilies: Gs, Gi, Gq, and G12 [43]. Ga12 and RhoGEF (Rho guanine nucleotide exchange factors) activate Rho-mediated signaling, which, in turn, enhances cancer cell progression, invasion, and metastasis [44]. High expression of GNA12 was detected in OSCC patients and contributed to cancer cell migration and invasion and lymph node metastasis [45,46].
A previous study showed that OLR1 is a lectin-like scavenger receptor. This receptor binds to several ligands, such as oxidized low-density lipoprotein, polyanionic chemicals, and anionic phospholipids [47]. Aberrant expression of OLR1 has been reported in multiple cancers; its expression induces the release of inflammatory cytokines and is closely related to cancer development and metastasis [48]. Detailed functional analyses of these genes will provide important information for elucidating the molecular pathogenesis of HNSCC.
In conclusion, our new RNA-sequencing-based miRNA signature revealed aberrantly expressed miRNAs in HNSCC tissues, including certain passenger strands of miRNAs. Both strands of pre-miR-139 (miR-139-5p and miR-139-3p) acted as tumor-suppressive miRNAs in HNSCC cells. A total of 28 genes were identified as targets of these miRNAs. Among these targets, GNA12 and OLR1 were demonstrated to be independent prognostic markers in patients with HNSCC. Identification of novel tumor-suppressive miRNAs and their regulated oncogenic targets may improve our knowledge of the molecular mechanisms of the oncogenesis of HNSCC.

4. Materials and Methods

4.1. Clinical HNSCC Specimens, Normal Epithelial Specimens, and HNSCC Cell Lines

Total RNA was extracted from three paired HNSCC and three normal oral epithelial tissue specimens for RNA sequencing and microarray analysis. The clinical features of HNSCC patients are summarized in Table S1. This study was approved by the Bioethics Committee of Chiba University (approval number: 28–65, 10 February 2015). Informed consent was obtained from all patients. The study’s methodologies conformed to the standards set by the Declaration of Helsinki.
The HNSCC cell lines used in this study were obtained from the RIKEN BioResource Center (Tsukuba, Ibaraki, Japan) and are summarized in Table S6.

4.2. Generation of a miRNA Expression Signature in HNSCC through RNA Sequencing

To construct the miRNA expression signature of HNSCC, six cDNA libraries were sequenced by using HiSeq 2000 (Illumina, San Diego, CA, USA). The small-RNA-sequencing and data-mining procedures have been described in our previous studies [12,26,27,28].

4.3. Ectopic miRNA Expression Assays of Cell Proliferation, Migration, and Invasion

The procedures used for transient transfection assays of miRNAs, siRNAs, and plasmid vectors were described in our previous studies [12,14,15,16]. The reagents used are listed in Table S7.

4.4. Identification of Putative Targets Controlled by miR-139-5p and miR-139-3p in HNSCC Cells

The strategy used for the selection of the miR-139-5p and miR-139-3p target genes in this study is summarized in Figure 4. We selected putative target genes with the miR-139-5p and miR-139-3p binding sites by using TargetScanHuman ver. 7.2 (http://www.targetscan.org/vert_72/, accessed on 10 July 2020) [49]. The expression profiles of the clinical specimens of HNSCC (genes downregulated in HNSCC tissues) were used to screen miRNA target genes. Our expression data were deposited in the GEO database (accession number: GSE172120). Furthermore, we narrowed down the candidate genes by factoring in clinical information from TCGA-HNSC analyses.
For the Kaplan–Meier survival analysis, we downloaded TCGA-HNSC clinical data (TCGA, Firehose Legacy) from cBioportal (https://www.cbioportal.org, accessed 10 April 2020). Gene expression data for each gene were collected from OncoLnc (http://www.oncolnc.org, accessed on 20 April 2021) [50]. For the log-rank test, we used JMP Pro 15 (SAS Institute Inc., Cary, NC, USA).
Multivariate Cox regression analyses were also performed with the TCGA-HNSC clinical data and survival data according to the expression levels of each gene from OncoLnc to identify factors associated with HNSCC patient survival. In addition to gene expression, the tumor stage, pathological grade, and age were evaluated as potential independent prognostic factors. The multivariate analyses were performed using JMP Pro 15.0.0 (SAS Institute Inc., Cary, NC, USA).

4.5. Direct Regulation of Target Genes by miR-139-3p Using Dual Luciferase Reporter Assays

The psiCHECK-2 vector (C8021; Promega, Madison, WI, USA) was inserted into the synthesized DNA with or without the miR-139-3p binding sequences of GNA12 or OLR1. The plasmid vectors were then transfected into cells using Lipofectamine 2000 (Invitrogen) at a final concentration of 50 ng/well.

4.6. Western Blotting and Immunohistochemistry

The Western blotting and immunohistochemistry procedures were detailed in our previous study [12]. The antibodies used are listed in Table S7. The clinical features of 3 HNSCC cases used for immunohistochemical staining are summarized in Table S5.

4.7. Analysis of Molecular Pathways Related to Target Genes Controlled by miR-139-3p

To analyze the molecular pathways related to the target genes of miR-139-3p, we performed gene set enrichment analysis (GSEA) for GNA12 and OLR1.
We divided the TCGA-HNSC RNA-seq data into a high-expression group and low-expression group according to the Z-score of GNA12 or OLR1 on cBioportal. A ranked list of genes was generated by comparing the expression levels of each gene between the two groups. We loaded the obtained gene list into gene set enrichment analysis (GSEA) software [51,52] and used the Molecular Signatures Database (MSigDB) hallmark gene set [53].

4.8. Statistical Analysis

All data were presented as mean values and standard errors of at least three independent experiments. Statistical analyses were performed using JMP Pro 15 (SAS Institute Inc., Cary, NC, USA). Differences between 2 groups were evaluated with t-tests. Dunnet’s test was used for multiple-group comparisons. p-value < 0.05 was considered statistically significant.

5. Conclusions

In this study, we focused on miR-139-5p and miR-139-3p based on our miRNA signatures. Our functional assays indicated that these miRNAs play an oncogenic role in HNSCC cells. Using an in silico database analysis to identify the gene targets regulated by miR-139-5p and miR-139-3p, we rapidly identified candidate oncogenes in HNSCC. Our HNSCC miRNA signature and miRNA-based analyses will provide important insights into the molecular pathogenesis of HNSCC.

Supplementary Materials

The Supplementary Materials are available online at https://www.mdpi.com/article/10.3390/ijms22189947/s1.

Author Contributions

Data curation, A.K. (Ayaka Koma), S.A., T.K., N.K., K.K. and S.M.; formal analysis, A.K. (Ayaka Koma) and C.M.; investigation, A.K. (Ayaka Koma), S.A., C.M., S.O., T.K., N.K. and S.M.; project administration, N.S.; supervision, T.H. and K.U.; writing—original draft, A.K. (Ayaka Koma) and N.S.; writing—review and editing, A.K. (Atsushi Kasamatsu). All authors have read and agreed to the published version of the manuscript.

Funding

This study was supported by JSPS KAKENHI under grant numbers 19H03847, 19K09863, 19K18759, 20H03883, and 21K09577.

Institutional Review Board Statement

This study was conducted according to the Declaration of Helsinki and was approved by the Bioethics Committee of Chiba University (approval number: 28–65, 10 February 2015).

Informed Consent Statement

Informed consent was obtained from all subjects involved in the study.

Data Availability Statement

Our expression data were deposited in the GEO database (accession number: GSE172120).

Acknowledgments

The results shown here are in part based upon data generated by the TCGA Research Network: https://www.cancer.gov/tcga, accessed on 10 April 2020.

Conflicts of Interest

The authors declare no conflict of interest.

References

  1. Leemans, C.R.; Snijders, P.J.F.; Brakenhoff, R.H. The molecular landscape of head and neck cancer. Nat. Rev. Cancer 2018, 18, 269–282. [Google Scholar] [CrossRef] [PubMed]
  2. Cohen, E.E.W.; Bell, R.B.; Bifulco, C.B.; Burtness, B.; Gillison, M.L.; Harrington, K.J.; Le, Q.T.; Lee, N.Y.; Leidner, R.; Lewis, R.L.; et al. The Society for Immunotherapy of Cancer consensus statement on immunotherapy for the treatment of squamous cell carcinoma of the head and neck (HNSCC). J. Immunother. Cancer 2019, 7, 184. [Google Scholar] [CrossRef] [PubMed] [Green Version]
  3. Wang, X.; Guo, J.; Yu, P.; Guo, L.; Mao, X.; Wang, J.; Miao, S.; Sun, J. The roles of extracellular vesicles in the development, microenvironment, anticancer drug resistance, and therapy of head and neck squamous cell carcinoma. J. Exp. Clin. Cancer Res. 2021, 40, 35. [Google Scholar] [CrossRef] [PubMed]
  4. Chow, L.Q.M. Head and Neck Cancer. N. Engl. J. Med. 2020, 382, 60–72. [Google Scholar] [CrossRef] [PubMed]
  5. Bonner, J.A.; Harari, P.M.; Giralt, J.; Cohen, R.B.; Jones, C.U.; Sur, R.K.; Raben, D.; Baselga, J.; Spencer, S.A.; Zhu, J.; et al. Radiotherapy plus cetuximab for locoregionally advanced head and neck cancer: 5-year survival data from a phase 3 randomised trial, and relation between cetuximab-induced rash and survival. Lancet Oncol. 2010, 11, 21–28. [Google Scholar] [CrossRef]
  6. Betel, D.; Wilson, M.; Gabow, A.; Marks, D.S.; Sander, C. The microRNA.org resource: Targets and expression. Nucleic Acids Res. 2008, 36, D149–D153. [Google Scholar] [CrossRef] [PubMed] [Green Version]
  7. Anfossi, S.; Babayan, A.; Pantel, K.; Calin, G.A. Clinical utility of circulating non-coding RNAs-An update. Nat. Rev. Clin. Oncol. 2018, 15, 541–563. [Google Scholar] [CrossRef]
  8. Krek, A.; Grun, D.; Poy, M.N.; Wolf, R.; Rosenberg, L.; Epstein, E.J.; MacMenamin, P.; da Piedade, I.; Gunsalus, K.C.; Stoffel, M.; et al. Combinatorial microRNA target predictions. Nat. Genet. 2005, 37, 495–500. [Google Scholar] [CrossRef]
  9. Gebert, L.F.R.; MacRae, I.J. Regulation of microRNA function in animals. Nat. Rev. Mol. Cell Biol. 2019, 20, 21–37. [Google Scholar] [CrossRef]
  10. Rupaimoole, R.; Slack, F.J. MicroRNA therapeutics: Towards a new era for the management of cancer and other diseases. Nat. Rev. Drug Discov. 2017, 16, 203–222. [Google Scholar] [CrossRef]
  11. Goodall, G.J.; Wickramasinghe, V.O. RNA in cancer. Nat. Rev. Cancer 2021, 21, 22–36. [Google Scholar] [CrossRef]
  12. Koshizuka, K.; Nohata, N.; Hanazawa, T.; Kikkawa, N.; Arai, T.; Okato, A.; Fukumoto, I.; Katada, K.; Okamoto, Y.; Seki, N. Deep sequencing-based microRNA expression signatures in head and neck squamous cell carcinoma: Dual strands of pre-miR-150 as antitumor miRNAs. Oncotarget 2017, 8, 30288–30304. [Google Scholar] [CrossRef] [Green Version]
  13. Yonemori, K.; Seki, N.; Idichi, T.; Kurahara, H.; Osako, Y.; Koshizuka, K.; Arai, T.; Okato, A.; Kita, Y.; Arigami, T.; et al. The microRNA expression signature of pancreatic ductal adenocarcinoma by RNA sequencing: Anti-tumour functions of the microRNA-216 cluster. Oncotarget 2017, 8, 70097–70115. [Google Scholar] [CrossRef] [PubMed] [Green Version]
  14. Yamada, Y.; Koshizuka, K.; Hanazawa, T.; Kikkawa, N.; Okato, A.; Idichi, T.; Arai, T.; Sugawara, S.; Katada, K.; Okamoto, Y.; et al. Passenger strand of miR-145-3p acts as a tumor-suppressor by targeting MYO1B in head and neck squamous cell carcinoma. Int. J. Oncol. 2018, 52, 166–178. [Google Scholar] [CrossRef] [PubMed]
  15. Okada, R.; Koshizuka, K.; Yamada, Y.; Moriya, S.; Kikkawa, N.; Kinoshita, T.; Hanazawa, T.; Seki, N. Regulation of Oncogenic Targets by miR-99a-3p (Passenger Strand of miR-99a-Duplex) in Head and Neck Squamous Cell Carcinoma. Cells 2019, 8, 1535. [Google Scholar] [CrossRef] [Green Version]
  16. Koshizuka, K.; Hanazawa, T.; Kikkawa, N.; Arai, T.; Okato, A.; Kurozumi, A.; Kato, M.; Katada, K.; Okamoto, Y.; Seki, N. Regulation of ITGA3 by the anti-tumor miR-199 family inhibits cancer cell migration and invasion in head and neck cancer. Cancer Sci. 2017, 108, 1681–1692. [Google Scholar] [CrossRef] [Green Version]
  17. Ha, M.; Kim, V.N. Regulation of microRNA biogenesis. Nat. Rev. Mol. Cell Biol. 2014, 15, 509–524. [Google Scholar] [CrossRef] [PubMed]
  18. Shimomura, H.; Okada, R.; Tanaka, T.; Hozaka, Y.; Wada, M.; Moriya, S.; Idichi, T.; Kita, Y.; Kurahara, H.; Ohtsuka, T.; et al. Role of miR-30a-3p Regulation of Oncogenic Targets in Pancreatic Ductal Adenocarcinoma Pathogenesis. Int. J. Mol. Sci. 2020, 21, 6459. [Google Scholar] [CrossRef] [PubMed]
  19. Sanada, H.; Seki, N.; Mizuno, K.; Misono, S.; Uchida, A.; Yamada, Y.; Moriya, S.; Kikkawa, N.; Machida, K.; Kumamoto, T.; et al. Involvement of Dual Strands of miR-143 (miR-143-5p and miR-143-3p) and Their Target Oncogenes in the Molecular Pathogenesis of Lung Adenocarcinoma. Int. J. Mol. Sci. 2019, 20, 4482. [Google Scholar] [CrossRef] [Green Version]
  20. Mataki, H.; Seki, N.; Mizuno, K.; Nohata, N.; Kamikawaji, K.; Kumamoto, T.; Koshizuka, K.; Goto, Y.; Inoue, H. Dual-strand tumor-suppressor microRNA-145 (miR-145-5p and miR-145-3p) coordinately targeted MTDH in lung squamous cell carcinoma. Oncotarget 2016, 7, 72084–72098. [Google Scholar] [CrossRef] [Green Version]
  21. Siegel, R.L.; Miller, K.D.; Fuchs, H.E.; Jemal, A. Cancer Statistics, 2021. CA Cancer J. Clin. 2021, 71, 7–33. [Google Scholar] [CrossRef]
  22. Ferris, R.L.; Blumenschein, G., Jr.; Fayette, J.; Guigay, J.; Colevas, A.D.; Licitra, L.; Harrington, K.; Kasper, S.; Vokes, E.E.; Even, C.; et al. Nivolumab for Recurrent Squamous-Cell Carcinoma of the Head and Neck. N. Engl. J. Med. 2016, 375, 1856–1867. [Google Scholar] [CrossRef]
  23. Cohen, E.E.W.; Soulières, D.; Le Tourneau, C.; Dinis, J.; Licitra, L.; Ahn, M.J.; Soria, A.; Machiels, J.P.; Mach, N.; Mehra, R.; et al. Pembrolizumab versus methotrexate, docetaxel, or cetuximab for recurrent or metastatic head-and-neck squamous cell carcinoma (KEYNOTE-040): A randomised, open-label, phase 3 study. Lancet 2019, 393, 156–167. [Google Scholar] [CrossRef]
  24. Koshizuka, K.; Hanazawa, T.; Arai, T.; Okato, A.; Kikkawa, N.; Seki, N. Involvement of aberrantly expressed microRNAs in the pathogenesis of head and neck squamous cell carcinoma. Cancer Metastasis Rev. 2017, 36, 525–545. [Google Scholar] [CrossRef]
  25. Koshizuka, K.; Kikkawa, N.; Hanazawa, T.; Yamada, Y.; Okato, A.; Arai, T.; Katada, K.; Okamoto, Y.; Seki, N. Inhibition of integrin β1-mediated oncogenic signalling by the antitumor microRNA-29 family in head and neck squamous cell carcinoma. Oncotarget 2018, 9, 3663–3676. [Google Scholar] [CrossRef] [Green Version]
  26. Toda, H.; Kurozumi, S.; Kijima, Y.; Idichi, T.; Shinden, Y.; Yamada, Y.; Arai, T.; Maemura, K.; Fujii, T.; Horiguchi, J.; et al. Molecular pathogenesis of triple-negative breast cancer based on microRNA expression signatures: Antitumor miR-204-5p targets AP1S3. J. Hum. Genet. 2018, 63, 1197–1210. [Google Scholar] [CrossRef]
  27. Toda, H.; Seki, N.; Kurozumi, S.; Shinden, Y.; Yamada, Y.; Nohata, N.; Moriya, S.; Idichi, T.; Maemura, K.; Fujii, T.; et al. RNA-sequence-based microRNA expression signature in breast cancer: Tumor-suppressive miR-101-5p regulates molecular pathogenesis. Mol. Oncol. 2020, 14, 426–446. [Google Scholar] [CrossRef] [PubMed] [Green Version]
  28. Wada, M.; Goto, Y.; Tanaka, T.; Okada, R.; Moriya, S.; Idichi, T.; Noda, M.; Sasaki, K.; Kita, Y.; Kurahara, H.; et al. RNA sequencing-based microRNA expression signature in esophageal squamous cell carcinoma: Oncogenic targets by antitumor miR-143-5p and miR-143-3p regulation. J. Hum. Genet. 2020, 65, 1019–1034. [Google Scholar] [CrossRef] [PubMed]
  29. Goto, Y.; Kurozumi, A.; Arai, T.; Nohata, N.; Kojima, S.; Okato, A.; Kato, M.; Yamazaki, K.; Ishida, Y.; Naya, Y.; et al. Impact of novel miR-145-3p regulatory networks on survival in patients with castration-resistant prostate cancer. Br. J. Cancer 2017, 117, 409–420. [Google Scholar] [CrossRef]
  30. Yamada, Y.; Arai, T.; Kojima, S.; Sugawara, S.; Kato, M.; Okato, A.; Yamazaki, K.; Naya, Y.; Ichikawa, T.; Seki, N. Regulation of antitumor miR-144-5p targets oncogenes: Direct regulation of syndecan-3 and its clinical significance. Cancer Sci. 2018, 109, 2919–2936. [Google Scholar] [CrossRef] [PubMed] [Green Version]
  31. Koshizuka, K.; Hanazawa, T.; Kikkawa, N.; Katada, K.; Okato, A.; Arai, T.; Idichi, T.; Osako, Y.; Okamoto, Y.; Seki, N. Antitumor miR-150-5p and miR-150-3p inhibit cancer cell aggressiveness by targeting SPOCK1 in head and neck squamous cell carcinoma. Auris Nasus Larynx 2018, 45, 854–865. [Google Scholar] [CrossRef]
  32. Mitra, R.; Adams, C.M.; Jiang, W.; Greenawalt, E.; Eischen, C.M. Pan-cancer analysis reveals cooperativity of both strands of microRNA that regulate tumorigenesis and patient survival. Nat. Commun. 2020, 11, 968. [Google Scholar] [CrossRef] [PubMed] [Green Version]
  33. Yonemori, M.; Seki, N.; Yoshino, H.; Matsushita, R.; Miyamoto, K.; Nakagawa, M.; Enokida, H. Dual tumor-suppressors miR-139-5p and miR-139-3p targeting matrix metalloprotease 11 in bladder cancer. Cancer Sci. 2016, 107, 1233–1242. [Google Scholar] [CrossRef] [Green Version]
  34. Okada, R.; Goto, Y.; Yamada, Y.; Kato, M.; Asai, S.; Moriya, S.; Ichikawa, T.; Seki, N. Regulation of Oncogenic Targets by the Tumor-Suppressive miR-139 Duplex (miR-139-5p and miR-139-3p) in Renal Cell Carcinoma. Biomedicines 2020, 8, 599. [Google Scholar] [CrossRef]
  35. Huang, L.L.; Huang, L.W.; Wang, L.; Tong, B.D.; Wei, Q.; Ding, X.S. Potential role of miR-139-5p in cancer diagnosis, prognosis and therapy. Oncol. Lett. 2017, 14, 1215–1222. [Google Scholar] [CrossRef] [PubMed] [Green Version]
  36. Wang, K.; Jin, J.; Ma, T.; Zhai, H. MiR-139-5p inhibits the tumorigenesis and progression of oral squamous carcinoma cells by targeting HOXA9. J. Cell. Mol. Med. 2017, 21, 3730–3740. [Google Scholar] [CrossRef]
  37. Jiang, Q.; Cao, Y.; Qiu, Y.; Li, C.; Liu, L.; Xu, G. Progression of squamous cell carcinoma is regulated by miR-139-5p/CXCR4. Front Biosci 2020, 25, 1732–1745. [Google Scholar]
  38. Yu, Y.; Yang, J.; Li, Q.; Xu, B.; Lian, Y.; Miao, L. LINC00152: A pivotal oncogenic long non-coding RNA in human cancers. Cell Prolif. 2017, 50, 4. [Google Scholar] [CrossRef] [Green Version]
  39. Li, M.; Ning, J.; Li, Z.; Wang, J.; Zhao, C.; Wang, L. LINC00152 promotes the growth and invasion of oral squamous cell carcinoma by regulating miR-139-5p. Onco. Targets Ther. 2018, 11, 6295–6304. [Google Scholar] [CrossRef] [PubMed] [Green Version]
  40. Sannigrahi, M.K.; Sharma, R.; Singh, V.; Panda, N.K.; Rattan, V.; Khullar, M. Role of Host miRNA Hsa-miR-139-3p in HPV-16-Induced Carcinomas. Clin. Cancer Res. 2017, 23, 3884–3895. [Google Scholar] [CrossRef] [Green Version]
  41. Ma, Y.; Gong, Z.; Wang, H.; Liang, Y.; Huang, X.; Yu, G. Anti-cancer effect of miR-139-3p on laryngeal squamous cell carcinoma by targeting rab5a: In vitro and in vivo studies. Pathol. Res. Pract. 2020, 216, 153194. [Google Scholar] [CrossRef]
  42. Zhang, W.; Xu, J.; Wang, K.; Tang, X.; He, J. miR-139-3p suppresses the invasion and migration properties of breast cancer cells by targeting RAB1A. Oncol. Rep. 2019, 42, 1699–1708. [Google Scholar] [CrossRef] [PubMed]
  43. Siehler, S. Regulation of RhoGEF proteins by G12/13-coupled receptors. Br. J. Pharmacol. 2009, 158, 41–49. [Google Scholar] [CrossRef] [Green Version]
  44. Kozasa, T.; Hajicek, N.; Chow, C.R.; Suzuki, N. Signalling mechanisms of RhoGTPase regulation by the heterotrimeric G proteins G12 and G13. J. Biochem. 2011, 150, 357–369. [Google Scholar] [CrossRef] [Green Version]
  45. Jian, S.L.; Hsieh, H.Y.; Liao, C.T.; Yen, T.C.; Nien, S.W.; Cheng, A.J.; Juang, J.L. Gα₁₂ drives invasion of oral squamous cell carcinoma through up-regulation of proinflammatory cytokines. PLoS ONE 2013, 8, e66133. [Google Scholar] [CrossRef] [Green Version]
  46. Gan, C.P.; Patel, V.; Mikelis, C.M.; Zain, R.B.; Molinolo, A.A.; Abraham, M.T.; Teo, S.H.; Abdul Rahman, Z.A.; Gutkind, J.S.; Cheong, S.C. Heterotrimeric G-protein alpha-12 (Gα12) subunit promotes oral cancer metastasis. Oncotarget 2014, 5, 9626–9640. [Google Scholar] [CrossRef] [Green Version]
  47. Yang, G.; Xiong, G.; Feng, M.; Zhao, F.; Qiu, J.; Liu, Y.; Cao, Z.; Wang, H.; Yang, J.; You, L.; et al. OLR1 Promotes Pancreatic Cancer Metastasis via Increased c-Myc Expression and Transcription of HMGA2. Mol. Cancer Res. 2020, 18, 685–697. [Google Scholar] [CrossRef] [Green Version]
  48. Wang, B.; Zhao, H.; Zhao, L.; Zhang, Y.; Wan, Q.; Shen, Y.; Bu, X.; Wan, M.; Shen, C. Up-regulation of OLR1 expression by TBC1D3 through activation of TNFα/NF-κB pathway promotes the migration of human breast cancer cells. Cancer Lett. 2017, 408, 60–70. [Google Scholar] [CrossRef] [PubMed]
  49. Agarwal, V.; Bell, G.W.; Nam, J.W.; Bartel, D.P. Predicting effective microRNA target sites in mammalian mRNAs. Elife 2015, 4, e05005. [Google Scholar] [CrossRef]
  50. Anaya, J. OncoLnc: Linking TCGA survival data to mRNAs, miRNAs, and lncRNAs. Peer J. Comput. Sci. 2016, 2, e67. [Google Scholar] [CrossRef] [Green Version]
  51. Subramanian, A.; Tamayo, P.; Mootha, V.K.; Mukherjee, S.; Ebert, B.L.; Gillette, M.A.; Paulovich, A.; Pomeroy, S.L.; Golub, T.R.; Lander, E.S.; et al. Gene set enrichment analysis: A knowledge-based approach for interpreting genome-wide expression profiles. Proc. Natl. Acad. Sci. USA 2005, 102, 15545–15550. [Google Scholar] [CrossRef] [Green Version]
  52. Mootha, V.K.; Lindgren, C.M.; Eriksson, K.F.; Subramanian, A.; Sihag, S.; Lehar, J.; Puigserver, P.; Carlsson, E.; Ridderstråle, M.; Laurila, E.; et al. PGC-1alpha-responsive genes involved in oxidative phosphorylation are coordinately downregulated in human diabetes. Nat. Genet. 2003, 34, 267–273. [Google Scholar] [CrossRef]
  53. Liberzon, A.; Birger, C.; Thorvaldsdóttir, H.; Ghandi, M.; Mesirov, J.P.; Tamayo, P. The Molecular Signatures Database (MSigDB) hallmark gene set collection. Cell Syst. 2015, 1, 417–425. [Google Scholar] [CrossRef] [Green Version]
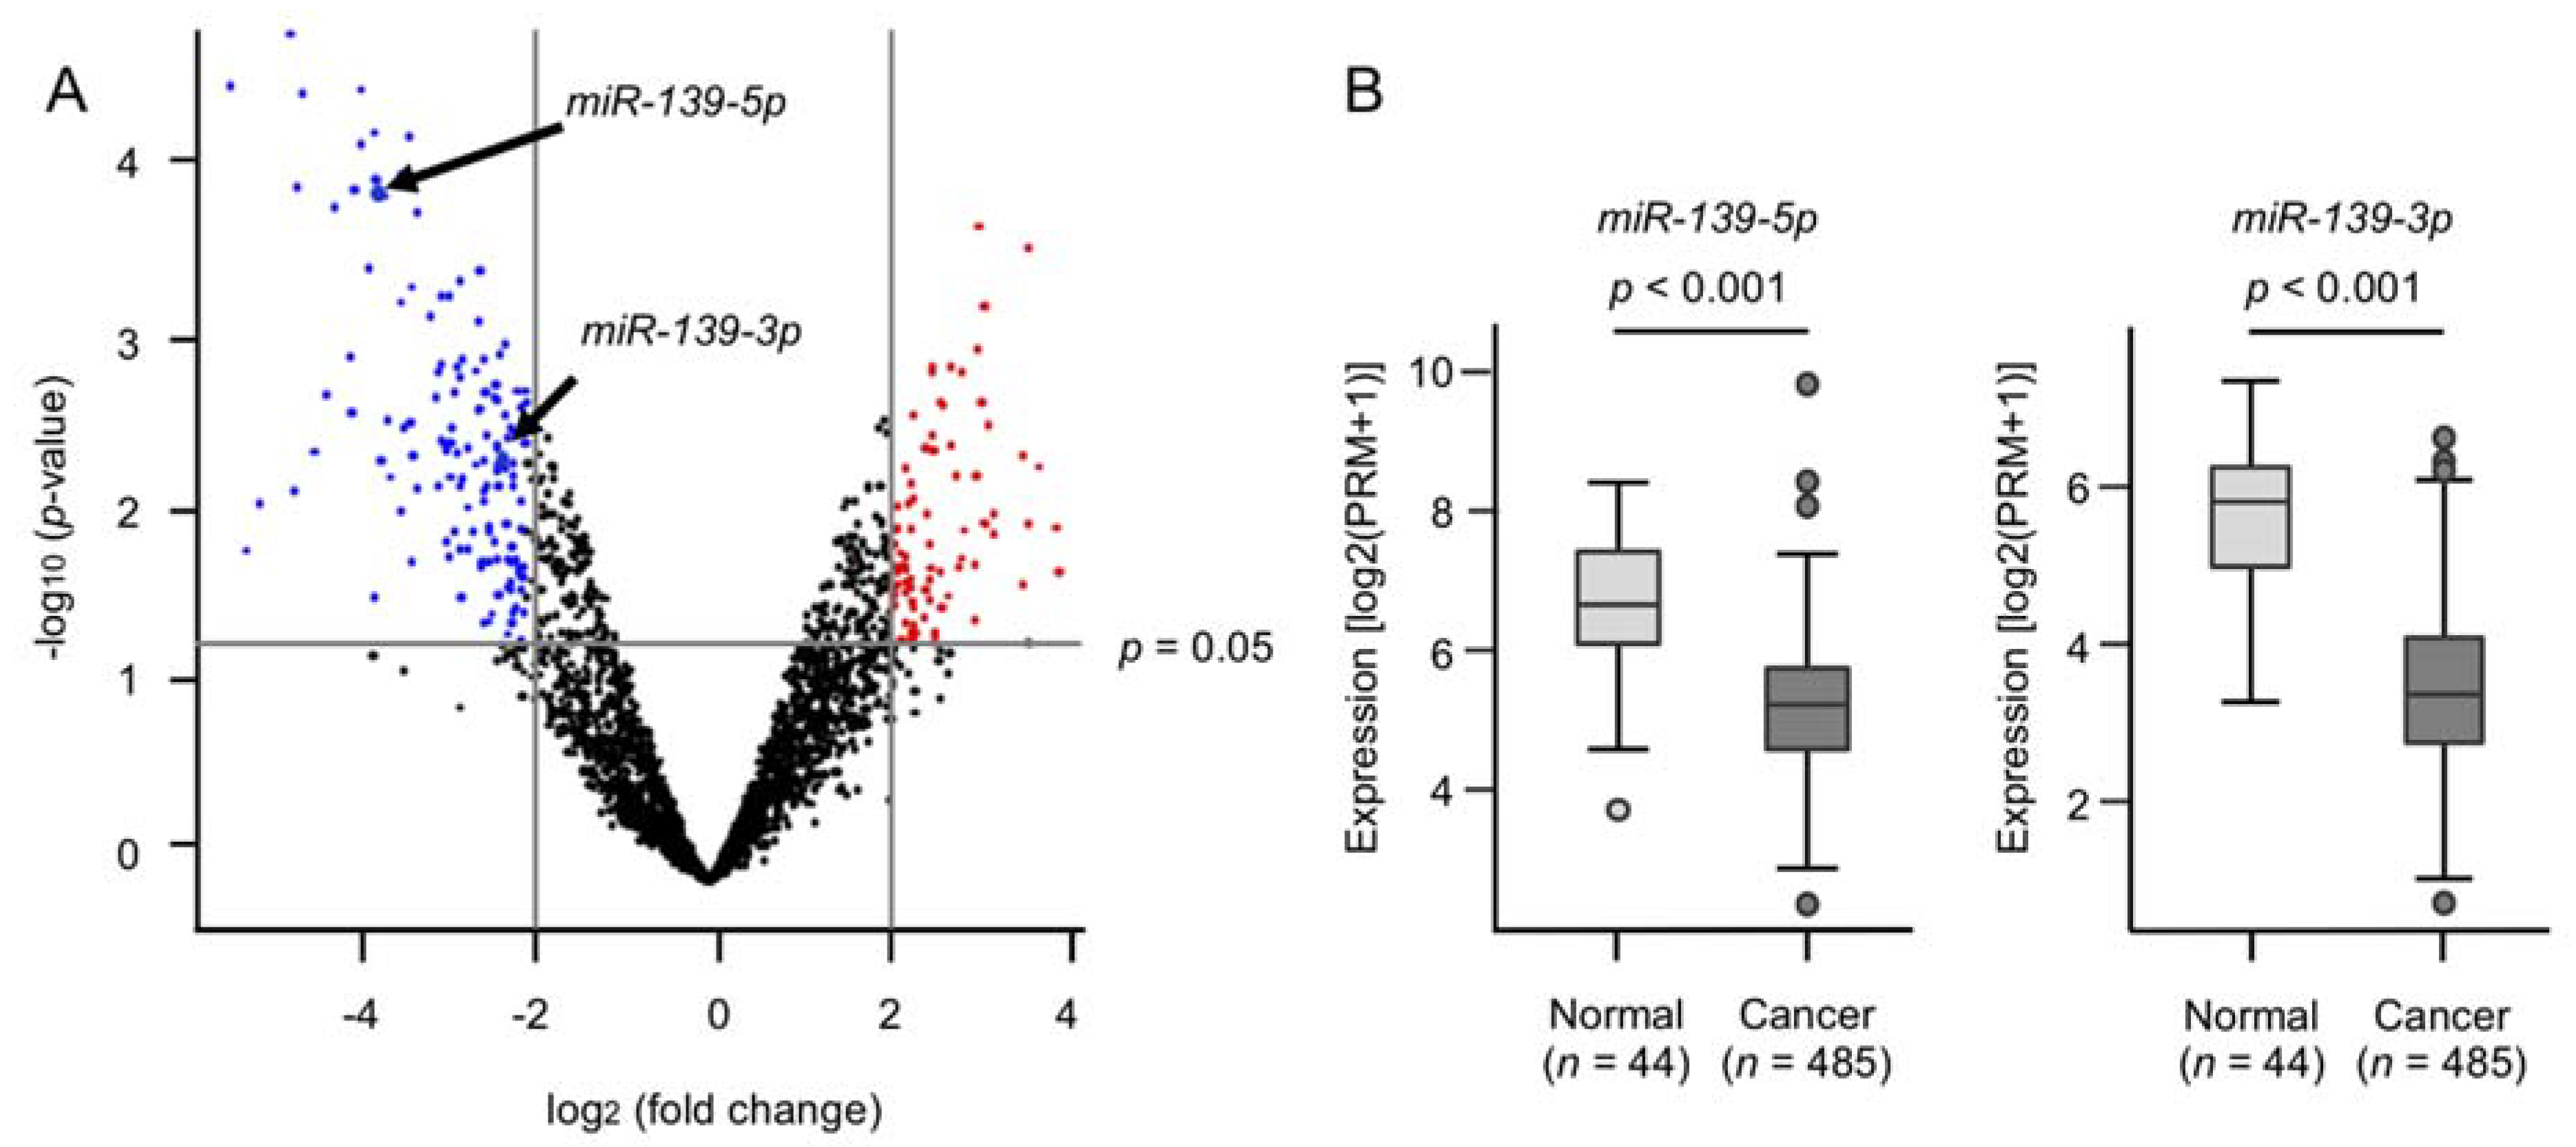
Figure 1. Expression of miR-139-5p and miR-139-3p in HNSCC tissues. (A) Volcano plot of the miRNA expression signature determined through RNA sequencing. The log2 fold change (FC) is plotted on the x-axis, and the −log10 (p-value) is plotted on the y-axis. The blue points represent the downregulated miRNAs with an absolute −log2 FC < −2.0 and p < 0.05. The red points represent the upregulated miRNAs with an absolute −log2 FC > 2.0 and p < 0.05. (B) The expression levels of miR-139-5p and miR-139-3p evaluated in an HNSCC dataset from TCGA.
Ijms 22 09947 g001
Figure 2. Expression levels of miR-139-5p and miR-139-3p in the HNSCC cell lines. (A,B) Expression levels of miR-139-5p (A) and miR-139-3p (B) in normal oral tissues and the HNSCC cell lines evaluated with real-time PCR. RNU48 was used as the internal control. Gene expression levels are expressed relative to those in “#1 normal”.
Ijms 22 09947 g002
Figure 3. (AC) Functional assays of miR-139-5p and miR-139-3p in HNSCC cells (HSC-3 and Sa3). (A) Cell proliferation assessed with an XTT assay at 72 h after transfection of mature miRNAs (N.S.; not significant). (B) Cell migration assessed using a membrane culture system at 48 h after seeding miRNA-transfected cells into the chambers. (C) Cell invasion determined with a Matrigel invasion assay at 48 h after seeding miRNA-transfected cells into the chambers.
Ijms 22 09947 g003
Figure 4. Flowchart of the strategy used to identify the putative oncogenes regulated by miR-139-5p and miR-139-3p in HNSCC cells.
Ijms 22 09947 g004
Figure 5. Clinical significance of the expression of putative target genes of miR-139-5p and miR-139-3p in HNSCC tissues. (A) Expression levels of five putative target genes (PLEC, YWHAQ, GNA12, OLR1, and ACOT9) in the clinical specimens of HNSCC from a TCGA dataset. All genes were downregulated in HNSCC tissues (n = 518) compared with normal tissues (n = 44). (B) Kaplan–Meier curves of the five-year overall survival rate according to the expression of each gene. Low expression of all five genes was significantly predictive of a worse prognosis in patients with HNSCC. The patients were divided into two groups—the high- and low-expression groups—according to the median miRNA expression level. The red and blue lines represent the high- and low-expression groups, respectively. (C) Forest plot presenting the results of a multivariate Cox regression analysis of the prognostic value of two putative target genes (GNA12 and OLR1) identified in an HNSCC dataset from TCGA. The expression levels of GNA12 and OLR1 were determined to be independent prognostic factors in terms of the 5-year overall survival rate after adjustments for tumor stage, age, and pathological grade (p < 0.05).
Ijms 22 09947 g005aIjms 22 09947 g005b
Figure 6. Direct regulation of GNA12 and OLR1 expression by miR-139-3p in HNSCC cells. (A) Real-time PCR showing the significantly reduced expression of GNA12 mRNA at 72 h after miR-139-3p transfection in HSC-3 cells. Expression of GAPDH was used as an internal control. (B) Western blot showing reduced expression of the GNA12 protein at 72 h after miR-139-3p transfection in HSC-3 cells. Expression of GAPDH was used as an internal control. (C) One putative miR-139-3p binding site predicted within the 3′-UTR of GNA12 through TargetScanHuman analyses (upper panel). Dual luciferase reporter assays showed reduced luminescence activity after cotransfection of the wild-type GNA12 3′-UTR sequence (containing the miR-139-3p binding site) with miR-139-3p in HSC-3 cells (lower panel). Normalized data were calculated as the Renilla/firefly luciferase activity ratio (N.S., not significant). (D,E) Real-time PCR and Western blots showing reduced OLR1 mRNA and protein levels, respectively, after miR-139-3p transfection in HSC-3 cells. (F) One putative miR-139-3p binding site predicted within the 3′-UTR of OLR1 through TargetScanHuman analyses (upper panel). Luminescence activity was reduced after cotransfection of the wild-type OLR1 3′-UTR sequence (containing the miR-139-3p binding site) with miR-139-3p in HSC-3 cells.
Ijms 22 09947 g006
Figure 7. Overexpression of GNA12 and OLR1 in clinical specimens of HNSCC. (AD) Immunohistochemical staining of GNA12 in clinical specimens of HNSCC. High expression of GNA12 was detected in the nuclei and/or cytoplasm of cancer cells (AC), and weak expression was detected in normal oral mucosa (D). (EH) Immunohistochemical staining of OLR1 in clinical specimens of HNSCC. High expression of OLR1 was detected in the nuclei and/or cytoplasm of cancer cells (EG), and weak expression was detected in normal oral mucosa (H).
Ijms 22 09947 g007
Table 1. Candidate target genes regulated by miR-139-5p and miR-139-3p.
A. Sixteen Candidate Target Genes Regulated by miR-139-5p
Entrez
Gene ID
Gene SymbolGene NameFold Change
(log2 > 1.0)
p-ValueTotal
Sites
19ABCA1ATP-binding cassette, sub-family A (ABC1), member 12.0650.0431
64919BCL11BBAF chromatin remodeling complex subunit BCL11B2.6200.0300
80005DOCK5dedicator of cytokinesis 51.9400.0400
1993ELAVL2ELAV-like neuron-specific RNA-binding protein 22.6060.0132
4973OLR1oxidized low-density lipoprotein (lectin-like) receptor 14.6200.0351
26031OSBPL3oxysterol-binding protein-like 31.7990.0381
5163PDK1pyruvate dehydrogenase kinase, isozyme 11.2700.0151
5209PFKFB36-phosphofructo-2-kinase/fructose-2,6-biphosphatase 31.8400.0400
5339PLECplectin1.0200.0400
10154PLXNC1plexin C11.4630.0381
51312SLC25A37solute carrier family 25 (mitochondrial iron transporter), member 371.7400.0400
6733SRPK2SRSF protein kinase 21.5500.0500
91937TIMD4T cell immunoglobulin and mucin domain containing 42.1400.0100
25829TMEM184Btransmembrane protein 184B1.1200.0462
8743TNFSF10TNF superfamily member 103.5400.0400
10971YWHAQtyrosine 3-monooxygenase/tryptophan 5-monooxygenase activation protein, theta1.0590.0471
B. Nineteen Candidate Target Genes Regulated by miR-139-3p
Entrez
Gene ID
Gene SymbolGene NameFold Change
(log2 > 1.0)
p-valueTotal
sites
2768GNA12guanine nucleotide-binding protein (G protein) alpha 121.1140.0391
440689HIST2H2BFhistone cluster 2, H2bf2.8160.0352
124935SLC43A2solute carrier family 43 (amino acid system L transporter), member 21.9620.0451
25829TMEM184Btransmembrane protein 184B1.1200.0462
57464STRIP2striatin interacting protein 22.5720.0471
5163PDK1pyruvate dehydrogenase kinase, isozyme 11.2700.0151
10154PLXNC1plexin C11.4630.0381
4973OLR1oxidized low-density lipoprotein (lectin-like) receptor 14.6200.0351
55784MCTP2multiple C2 domains, transmembrane 21.2740.0352
89796NAV1neuron navigator 11.9980.0361
4288MKI67marker of proliferation Ki-671.0050.0481
51312SLC25A37solute carrier family 25 (mitochondrial iron transporter), member 371.7390.0441
26031OSBPL3oxysterol-binding protein-like 31.7990.0381
55502HES6hes family bHLH transcription factor 61.7820.0481
19ABCA1ATP-binding cassette, sub-family A (ABC1), member 12.0650.0431
23597ACOT9acyl-CoA thioesterase 91.1210.0341
85407NKD1naked cuticle homolog 1 (Drosophila)1.2150.0421
351APPamyloid beta (A4) precursor protein1.4120.0461
9123SLC16A3solute carrier family 16 (monocarboxylate transporter), member 32.7630.0461
Table 2. The significantly enriched gene sets.
A. Gene Sets in the High GNA12 Expression Group
NameNormalized Enrichment ScoreFDR q-Value
epithelial–mesenchymal transition3.685q < 0.001
myogenesis3.268q < 0.001
UV response dn2.605q < 0.001
angiogenesis2.561q < 0.001
KRAS signaling up2.543q < 0.001
inflammatory response2.434q < 0.001
apical junction2.411q < 0.001
coagulation2.407q < 0.001
TNF-alpha signaling via NFkb2.309q < 0.001
hypoxia2.119q < 0.001
TGF-beta signaling2.096q < 0.001
IL6/JAK/STAT3 signaling2.059q < 0.001
hedgehog signaling2.005q < 0.001
complement1.8910.001
notch signaling1.7880.004
IL2/STAT5 signaling1.7720.004
pancreas beta cells1.6450.012
mitotic spindle1.5540.028
apoptosis1.5060.040
B. Gene Sets in the High OLR1 Expression Group
NameNormalized Enrichment ScoreFDR q-Value
epithelial–mesenchymal transition2.309q < 0.001
inflammatory response2.152q < 0.001
myogenesis2.121q < 0.001
angiogenesis2.089q < 0.001
coagulation2.017q < 0.001
KRAS signaling up1.996q < 0.001
allograft rejection1.910q < 0.001
complement1.7620.002
IL2/STAT5 signaling1.7020.004
IL6/JAK/STAT3 signaling1.6960.004
interferon-gamma response1.6870.004
UV response dn1.5850.013
TNF-alpha signaling via NFkb1.5500.019
apical junction1.4640.048
Publisher’s Note: MDPI stays neutral with regard to jurisdictional claims in published maps and institutional affiliations.