
An Overview of Near Infrared Spectroscopy and Its Applications in the Detection of Genetically Modified Organisms

 ,
,  ,
, 
 ,
, 
Abstract
1. Introduction
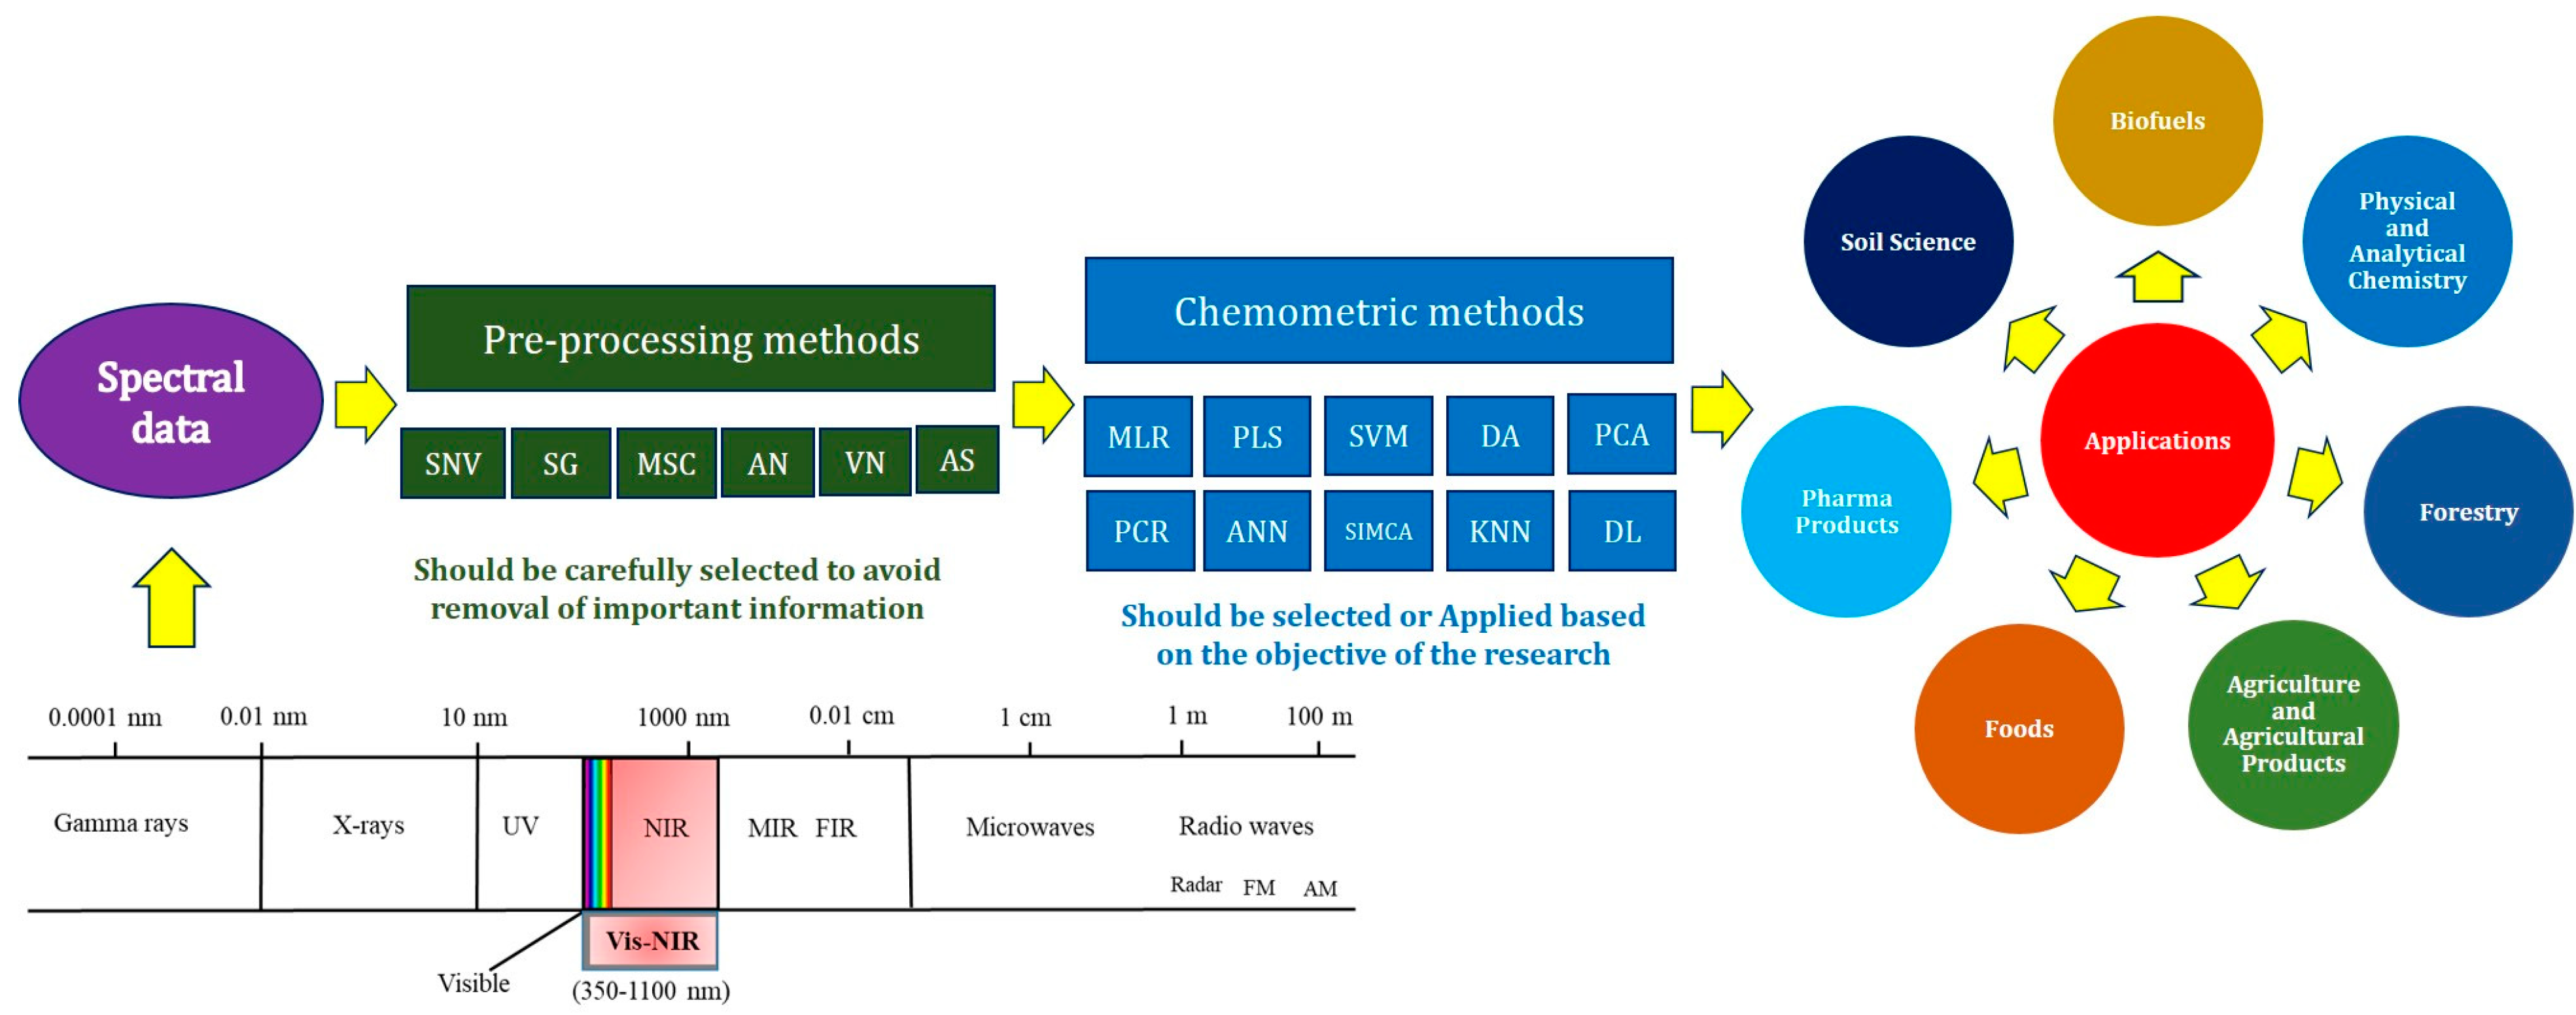
2. Principles and Characteristics of NIRS
2.1. Preprocessing Methods
2.2. Chemometric Analyses
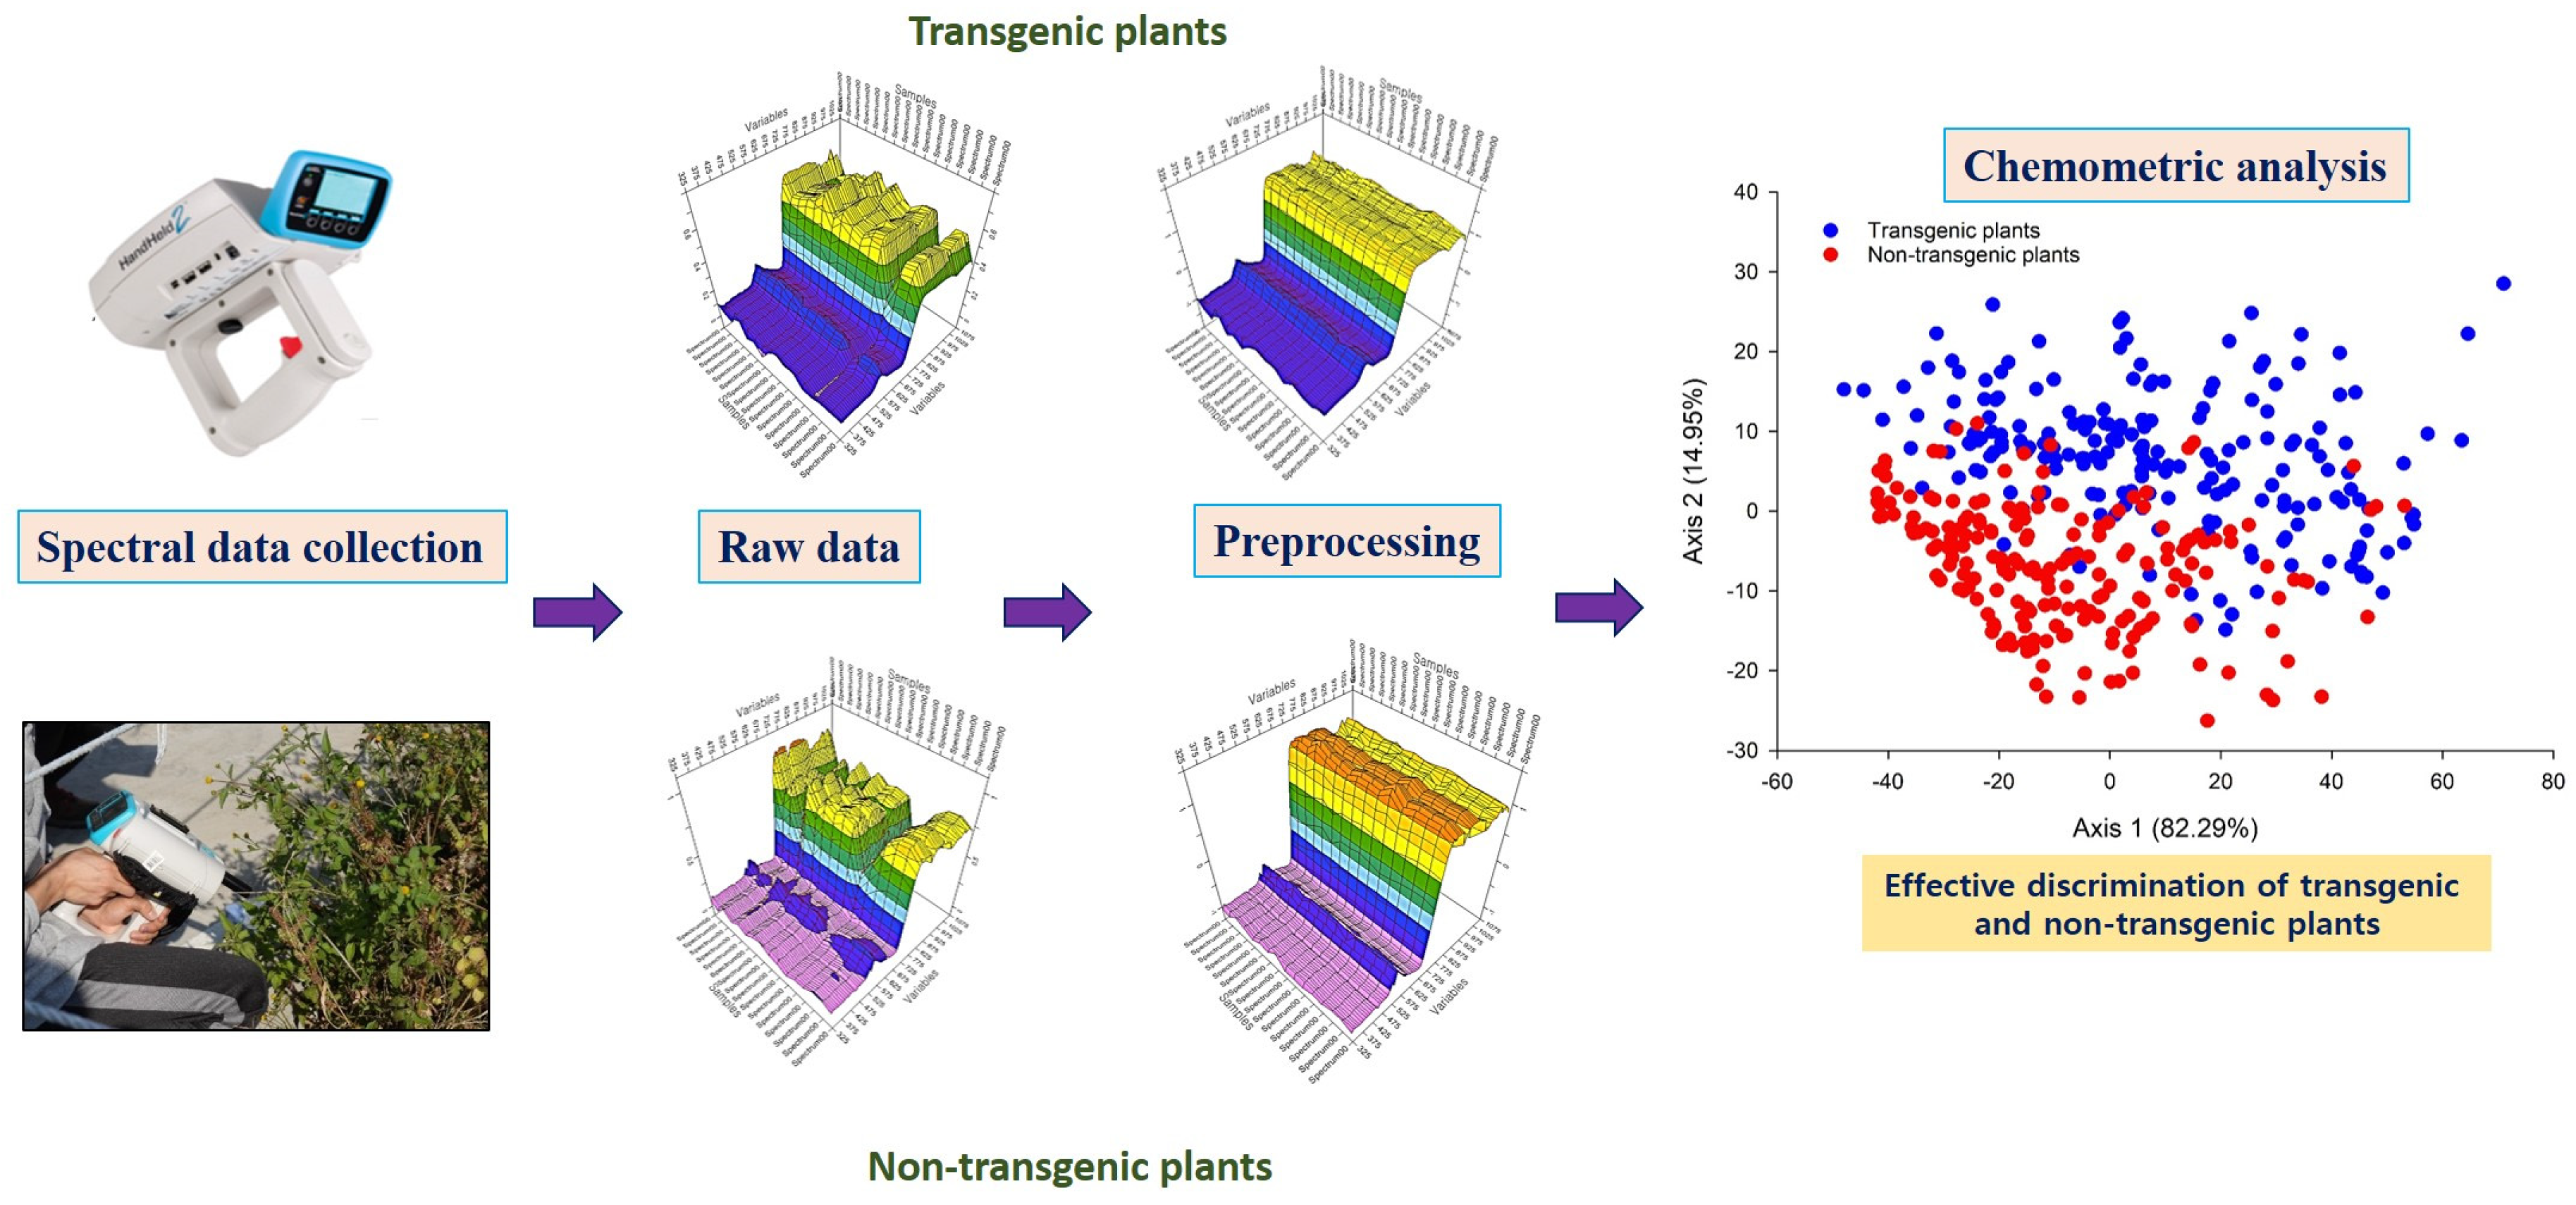
3. Overview of Biological Applications of NIRS
4. Applications of NIRS for the Detection of GM Crops and Transgenic Foods
5. Conclusions and Future Perspectives
Author Contributions
Funding
Institutional Review Board Statement
Informed Consent Statement
Conflicts of Interest
References
- Alishahi, A.; Farahmand, H.; Prieto, N.; Cozzolino, D. Identification of transgenic foods using NIR spectroscopy: A review. Spectrochim. Acta A Mol. Biomol. Spectrosc. 2010, 75, 1–7. [Google Scholar] [CrossRef]
- ISAAA. Global Status of Commercialized Biotech/GM Crops. 2019. Available online: https://www.isaaa.org/resources/publications/briefs/55/default.asp (accessed on 1 July 2021).
- Hao, Y.; Geng, P.; Wu, W.; Wen, Q.; Rao, M. Identification of rice varieties and transgenic characteristics based on near-infrared diffuse reflectance spectroscopy and chemometrics. Molecules 2019, 24, 4568. [Google Scholar] [CrossRef]
- Luna, A.S.; da Silva, A.P.; Pinho, J.S.; Ferré, J.; Boqué, R. Rapid characterization of transgenic and non-transgenic soybean oils by chemometric methods using NIR spectroscopy. Spectrochim. Acta A Mol. Biomol. Spectrosc. 2013, 100, 115–119. [Google Scholar] [CrossRef]
- Kim, D.G.; Lee, S.H.; Cho, B.K.; Byeon, D.H.; Lee, J.; Lee, W.H. Statistical analysis for determining optimal sample size for living modified organism (LMO) seed detection. J. Crop Sci. Biotechnol. 2020, 23, 1–7. [Google Scholar] [CrossRef]
- Nap, J.P.; Metz, P.L.; Escaler, M.; Conner, A.J. The release of genetically modified crops into the environment: Part I. Overview of current status and regulations. Plant J. 2003, 33, 1–18. [Google Scholar] [CrossRef]
- Taverniers, I.; Van Bockstaele, E.; De Loose, M. Cloned plasmid DNA fragments as calibrators for controlling GMOs: Different real-time duplex quantitative PCR methods. Anal. Bioanal. Chem. 2004, 378, 1198–1207. [Google Scholar] [CrossRef]
- Ahmed, F.E. Detection of genetically modified organisms in foods. Trends Biotechnol. 2002, 20, 215–223. [Google Scholar] [CrossRef]
- Van Raamsdonk, L.W.D.; Von Holst, C.; Baeten, V.; Berben, G.; Boix, A.; De Jong, J. New developments in the detection and identification of processed animal proteins in feeds. Anim. Feed Sci. Technol. 2007, 133, 63–83. [Google Scholar] [CrossRef]
- Liu, X.; Feng, X.; Liu, F.; Peng, J.; He, Y. Rapid identification of genetically modified maize using laser-induced breakdown spectroscopy. Food Bioproc. Technol. 2019, 12, 347–357. [Google Scholar] [CrossRef]
- Aouadi, B.; Zaukuu, J.L.Z.; Vitális, F.; Bodor, Z.; Fehér, O.; Gillay, Z.; Kovacs, Z. Historical evolution and food control achievements of near infrared spectroscopy, electronic nose, and electronic tongue—Critical overview. Sensors 2020, 20, 5479. [Google Scholar] [CrossRef] [PubMed]
- Shenk, J.S.; Workman, J.J.J.; Westerhaus, M.O. Application of NIR spectroscopy to agricultural products. In Handbook of Near-Infrared Analysis, 3rd ed.; Burns, D.A., Ciurczak, E.W., Eds.; Marcel Dekker: New York, NY, USA, 1992; pp. 383–431. [Google Scholar] [CrossRef]
- Cozzolino, D. An overview of the use of infrared spectroscopy and chemometrics in authenticity and traceability of cereals. Food Res. Int. 2014, 60, 262–265. [Google Scholar] [CrossRef]
- Zaukuu, J.L.Z.; Bodor, Z.; Vitalis, F.; Zsom-Muha, V.; Kovacs, Z. Near infrared spectroscopy as a rapid method for detecting paprika powder adulteration with corn flour. Acta Period. Technol. 2019, 50, 346–352. [Google Scholar] [CrossRef]
- Vitalis, F.; Zaukuu, J.L.Z.; Bodor, Z.; Aouadi, B.; Hitka, G.; Kaszab, T.; Kovacs, Z. Detection and quantification of tomato paste adulteration using conventional and rapid analytical methods. Sensors 2020, 20, 6059. [Google Scholar] [CrossRef] [PubMed]
- Nugraha, D.T.; Zaukuu, J.L.Z.; Bósquez, J.P.A.; Bodor, Z.; Vitalis, F.; Kovacs, Z. Near-infrared spectroscopy and aquaphotomics for monitoring mung bean (vigna radiata) sprout growth and validation of ascorbic acid content. Sensors 2021, 21, 611. [Google Scholar] [CrossRef] [PubMed]
- Feng, X.; Zhao, Y.; Zhang, C.; Cheng, P.; He, Y. Discrimination of transgenic maize kernel using NIR hyperspectral imaging and multivariate data analysis. Sensors 2017, 17, 1894. [Google Scholar] [CrossRef] [PubMed]
- Feng, X.; Peng, C.; Chen, Y.; Liu, X.; Feng, X.; He, Y. Discrimination of CRISPR/Cas9-induced mutants of rice seeds using near-infrared hyperspectral imaging. Sci. Rep. 2017, 7, 1–10. [Google Scholar] [CrossRef]
- Prieto, N.; Pawluczyk, O.; Dugan, M.E.R.; Aalhus, J.L. A review of the principles and applications of near-infrared spectroscopy to characterize meat, fat, and meat products. Appl. Spectrosc. 2017, 71, 1403–1426. [Google Scholar] [CrossRef]
- Cen, H.; He, Y. Theory and application of near infrared reflectance spectroscopy in determination of food quality. Trends Food Sci. Technol. 2007, 18, 72–83. [Google Scholar] [CrossRef]
- Workman, J.J., Jr. Review of process and non-invasive near-infrared and infrared spectroscopy: 1993–1999. Appl. Spectrosc. Rev. 1999, 34, 1–89. [Google Scholar] [CrossRef]
- Jiao, Y.; Li, Z.; Chen, X.; Fei, S. Preprocessing methods for near-infrared spectrum calibration. J. Chemom. 2020, 34, e3306. [Google Scholar] [CrossRef]
- Engel, J.; Gerretzen, J.; Szymańska, E.; Jansen, J.J.; Downey, G.; Blanchet, L.; Buydens, L.M. Breaking with trends in pre-processing? TrAC Trends Anal. Chem. 2013, 50, 96–106. [Google Scholar] [CrossRef]
- Lee, L.C.; Liong, C.Y.; Jemain, A.A. A contemporary review on Data Preprocessing (DP) practice strategy in ATR-FTIR spectrum. Chemom. Intell. Lab. Syst. 2017, 163, 64–75. [Google Scholar] [CrossRef]
- Rinnan, Å.; Van Den Berg, F.; Engelsen, S.B. Review of the most common pre-processing techniques for near-infrared spectra. TrAC Trends Anal. Chem. 2009, 28, 1201–1222. [Google Scholar] [CrossRef]
- Martens, H.; Jensen, S.A.; Geladi, P. Multivariate Linearity Tranformations for Near Infrared Reflectance Spectroscopy. In Proceedings of the Nordic Symposium on Applied Statistics, Stavanger, Norway, 1–4 June 1983; pp. 205–234. [Google Scholar]
- Geladi, P.; MacDougall, D.; Martens, H. Linearization and scatter-correction for near-infrared reflectance spectra of meat. Appl. Spectrosc. 1985, 39, 491–500. [Google Scholar] [CrossRef]
- Pedersen, D.K.; Martens, H.; Nielsen, J.P.; Engelsen, S.B. Near-infrared absorption and scattering separated by extended inverted signal correction (EISC): Analysis of near-infrared transmittance spectra of single wheat seeds. Appl. Spectrosc. 2002, 56, 1206–1214. [Google Scholar] [CrossRef]
- Guo, Q.; Wu, W.; Massart, D.L. The robust normal variate transform for pattern recognition with near-infrared data. Anal. Chim. Acta 1999, 382, 87–103. [Google Scholar] [CrossRef]
- Zaukuu, J.L.Z.; Aouadi, B.; Lukács, M.; Bodor, Z.; Vitális, F.; Gillay, B.; Kovacs, Z. Detecting low concentrations of nitrogen-based adulterants in whey protein powder using benchtop and handheld NIR spectrometers and the feasibility of scanning through plastic bag. Molecules 2020, 25, 2522. [Google Scholar] [CrossRef]
- Yang, J.; Xu, J.; Zhang, X.; Wu, C.; Lin, T.; Ying, Y. Deep learning for vibrational spectral analysis: Recent progress and a practical guide. Anal. Chim. Acta 2019, 1081, 6–17. [Google Scholar] [CrossRef] [PubMed]
- Norris, K.H. Food Research and Data Analysis; Martens, H., Jr., Rasswum, H., Eds.; Applied Sciences Publishers: New York, NY, USA, 1983; pp. 95–113. [Google Scholar]
- Norris, K.H.; Williams, P.C. Optimization of Mathematical Treatments of Raw Near-Infrared Signal in the Measurement of Protein in Hard Red Spring Wheat. I. Influence of Particle Size; Cereal Chem: Saint Paul, MN, USA, 1984; Volume 61, pp. 158–165. [Google Scholar]
- Savitzky, A.; Golay, M.J. Smoothing and differentiation of data by simplified least squares procedures. Anal. Chem. 1964, 36, 1627–1639. [Google Scholar] [CrossRef]
- Hashimoto, A.; Kameoka, T. Applications of infrared spectroscopy to biochemical, food, and agricultural processes. Appl. Spectrosc. Rev. 2008, 43, 416–451. [Google Scholar] [CrossRef]
- Angelopoulou, T.; Balafoutis, A.; Zalidis, G.; Bochtis, D. From laboratory to proximal sensing spectroscopy for soil organic carbon estimation—A review. Sustainability 2020, 12, 443. [Google Scholar] [CrossRef]
- Sáiz-Abajo, M.J.; González-Sáiz, J.M.; Pizarro, C. Near infrared spectroscopy and pattern recognition methods applied to the classification of vinegar according to raw material and elaboration process. J. Near Infrared Spectrosc. 2004, 12, 207–219. [Google Scholar] [CrossRef]
- Cozzolino, D.; Smyth, H.E.; Gishen, M. Feasibility study on the use of visible and near-infrared spectroscopy together with chemometrics to discriminate between commercial white wines of different varietal origins. J. Agric. Food Chem. 2003, 51, 7703–7708. [Google Scholar] [CrossRef] [PubMed]
- Andre, M. Multivariate analysis and classification of the chemical quality of 7-aminocephalosporanic acid using near-infrared reflectance spectroscopy. Anal. Chem. 2003, 75, 3460–3467. [Google Scholar] [CrossRef]
- Gestal, M.; Gómez-Carracedo, M.P.; Andrade, J.M.; Dorado, J.; Fernández, E.; Prada, D.; Pazos, A. Classification of apple beverages using artificial neural networks with previous variable selection. Anal. Chim. Acta 2004, 524, 225–234. [Google Scholar] [CrossRef]
- Casale, M.; Abajo, M.J.S.; Sáiz, J.M.G.; Pizarro, C.; Forina, M. Study of the aging and oxidation processes of vinegar samples from different origins during storage by near-infrared spectroscopy. Anal. Chim. Acta 2006, 557, 360–366. [Google Scholar] [CrossRef]
- Roussel, S.A.; Hardy, C.L.; Hurburgh, C.R., Jr.; Rippke, G.R. Detection of Roundup Ready™ soybeans by near-infrared spectroscopy. Appl. Spectrosc. 2001, 55, 1425–1430. [Google Scholar] [CrossRef]
- Sekulic, S.; Kowalski, B.R. MARS: A tutorial. J. Chemom. 1992, 6, 199–216. [Google Scholar] [CrossRef]
- Liu, C.; Liu, W.; Lu, X.; Chen, W.; Yang, J.; Zheng, L. Nondestructive determination of transgenic Bacillus thuringiensis rice seeds (Oryza sativa L.) using multispectral imaging and chemometric methods. Food Chem. 2014, 153, 87–93. [Google Scholar] [CrossRef]
- LeCun, Y.; Bengio, Y.; Hinton, G. Deep learning. Nature 2015, 521, 436–444. [Google Scholar] [CrossRef] [PubMed]
- Meza Ramirez, C.A.; Greenop, M.; Ashton, L.; Rehman, I.U. Applications of machine learning in spectroscopy. Appl. Spectrosc. Rev. 2020, 1–31. [Google Scholar] [CrossRef]
- Nabwire, S.; Suh, H.K.; Kim, M.S.; Baek, I.; Cho, B.K. Application of artificial intelligence in phenomics. Sensors 2021, 21, 4363. [Google Scholar] [CrossRef]
- Padarian, J.; Minasny, B.; McBratney, A.B. Using deep learning to predict soil properties from regional spectral data. Geoderma Reg. 2019, 16, e00198. [Google Scholar] [CrossRef]
- Ramirez-Lopez, L.; Behrens, T.; Schmidt, K.; Stevens, A.; Demattê, J.A.M.; Scholten, T. The spectrum-based learner: A new local approach for modeling soil vis–NIR spectra of complex datasets. Geoderma 2013, 195, 268–279. [Google Scholar] [CrossRef]
- Nocita, M.; Stevens, A.; Toth, G.; Panagos, P.; van Wesemael, B.; Montanarella, L. Prediction of soil organic carbon content by diffuse reflectance spectroscopy using a local partial least square regression approach. Soil Biol. Biochem. 2014, 68, 337–347. [Google Scholar] [CrossRef]
- Weinan, E. A proposal on machine learning via dynamical systems. Commun. Math. Stat. 2017, 5, 1–11. [Google Scholar] [CrossRef]
- Tsakiridis, N.L.; Theocharis, J.B.; Ben-Dor, E.; Zalidis, G.C. Using interpretable fuzzy rule-based models for the estimation of soil organic carbon from VNIR/SWIR spectra and soil texture. Chemom. Intell. Lab. Syst. 2019, 189, 39–55. [Google Scholar] [CrossRef]
- Zhang, X.; Lin, T.; Xu, J.; Luo, X.; Ying, Y. DeepSpectra: An end-to-end deep learning approach for quantitative spectral analysis. Anal. Chim. Acta 2019, 1058, 48–57. [Google Scholar] [CrossRef] [PubMed]
- Tsakiridis, N.L.; Chadoulos, C.G.; Theocharis, J.B.; Ben-Dor, E.; Zalidis, G.C. A three-level Multiple-Kernel Learning approach for soil spectral analysis. Neurocomputing 2020, 389, 27–41. [Google Scholar] [CrossRef]
- Zhang, X.; Yang, J.; Lin, T.; Ying, Y. Food and agro-product quality evaluation based on spectroscopy and deep learning: A review. Trends Food Sci. Technol. 2021, 112, 431–441. [Google Scholar] [CrossRef]
- Sohn, S.I.; Oh, Y.J.; Cho, W.S.; Cho, Y.; Shin, E.K.; Kang, H.J. Current Status of GM Crop Discrimination Technology Using Spectroscopy. Korean J. Environ. Agric. 2020, 39, 263–272. [Google Scholar] [CrossRef]
- Huang, H.; Yu, H.; Xu, H.; Ying, Y. Near infrared spectroscopy for on/in-line monitoring of quality in foods and beverages: A review. J. Food Eng. 2008, 87, 303–313. [Google Scholar] [CrossRef]
- Németh, D.; Balazs, G.; Daood, H.G.; Kovacs, Z.; Bodor, Z.; Zaukuu, J.L.Z.; Kappel, N. Standard analytical methods, sensory evaluation, NIRS and electronic tongue for sensing taste attributes of different melon varieties. Sensors 2019, 19, 5010. [Google Scholar] [CrossRef] [PubMed]
- Cao, F.; Wu, D.; He, Y. Soluble solids content and pH prediction and varieties discrimination of grapes based on visible–near infrared spectroscopy. Comput. Electron. Agric. 2010, 71, S15–S18. [Google Scholar] [CrossRef]
- Beć, K.B.; Grabska, J.; Huck, C.W. Near-infrared spectroscopy in bio-applications. Molecules 2020, 25, 2948. [Google Scholar] [CrossRef]
- Masithoh, R.E.; Amanah, H.Z.; Yoon, W.S.; Joshi, R.; Cho, B.K. Determination of protein and glucose of tuber and root flours using NIR and MIR spectroscopy. Infrared Phys. Technol. 2021, 113, 103577. [Google Scholar] [CrossRef]
- Janik, L.J.; Skjemstad, J.O.; Shepherd, K.D.; Spouncer, L.R. The prediction of soil carbon fractions using mid-infrared-partial least square analysis. Soil Res. 2007, 45, 73–81. [Google Scholar] [CrossRef]
- Amanah, H.Z.; Wakholi, C.; Perez, M.; Faqeerzada, M.A.; Tunny, S.S.; Masithoh, R.E.; Choung, M.G.; Kim, K.H.; Lee, W.H.; Cho, B.K. Near-Infrared hyperspectral imaging (NIR-HSI) for nondestructive prediction of anthocyanins content in black rice seeds. Appl. Sci. 2021, 11, 4841. [Google Scholar] [CrossRef]
- Purcell, D.E.; O’Shea, M.G.; Johnson, R.A.; Kokot, S. Near-infrared spectroscopy for the prediction of disease ratings for Fiji leaf gall in sugarcane clones. Appl. Spectrosc. 2009, 63, 450–457. [Google Scholar] [CrossRef]
- Sankaran, S.; Ehsani, R. Visible-near infrared spectroscopy based citrus greening detection: Evaluation of spectral feature extraction techniques. Crop Protect. 2011, 30, 1508–1513. [Google Scholar] [CrossRef]
- Basati, Z.; Jamshidi, B.; Rasekh, M.; Abbaspour-Gilandeh, Y. Detection of sunn pest-damaged wheat samples using visible/near-infrared spectroscopy based on pattern recognition. Spectrochim. Acta A Mol. Biomol. Spectrosc. 2018, 203, 308–314. [Google Scholar] [CrossRef] [PubMed]
- Jamshidi, B.; Mohajerani, E.; Jamshidi, J.; Minaei, S.; Sharifi, A. Non-destructive detection of pesticide residues in cucumber using visible/near-infrared spectroscopy. Food Addit. Contam. A 2015, 32, 857–863. [Google Scholar] [CrossRef]
- Wang, Y.; Xiang, J.; Tang, Y.; Chen, W.; Xu, Y. A review of the application of near-infrared spectroscopy (NIRS) in forestry. Appl. Spectrosc. Rev. 2021, 1–18. [Google Scholar] [CrossRef]
- Qu, J.H.; Liu, D.; Cheng, J.H.; Sun, D.W.; Ma, J.; Pu, H.; Zeng, X.A. Applications of near-infrared spectroscopy in food safety evaluation and control: A review of recent research advances. Crit. Rev. Food Sci. Nutr. 2015, 55, 1939–1954. [Google Scholar] [CrossRef] [PubMed]
- Rady, A.; Adedeji, A. Assessing different processed meats for adulterants using visible-near-infrared spectroscopy. Meat Sci. 2018, 136, 59–67. [Google Scholar] [CrossRef] [PubMed]
- Chandraratne, M.R.; Samarasinghe, S.; Kulasiri, D.; Bickerstaffe, R. Prediction of lamb tenderness using image surface texture features. J. Food Eng. 2006, 77, 492–499. [Google Scholar] [CrossRef]
- Kamruzzaman, M.; ElMasry, G.; Sun, D.W.; Allen, P. Prediction of some quality attributes of lamb meat using near-infrared hyperspectral imaging and multivariate analysis. Anal. Chim. Acta 2012, 714, 57–67. [Google Scholar] [CrossRef]
- Guy, F.; Prache, S.; Thomas, A.; Bauchart, D.; Andueza, D. Prediction of lamb meat fatty acid composition using near-infrared reflectance spectroscopy (NIRS). Food Chem. 2011, 127, 1280–1286. [Google Scholar] [CrossRef]
- Pullanagari, R.R.; Yule, I.J.; Agnew, M. On-line prediction of lamb fatty acid composition by visible near infrared spectroscopy. Meat Sci. 2015, 100, 156–163. [Google Scholar] [CrossRef]
- Prieto, N.; Roehe, R.; Lavín, P.; Batten, G.; Andrés, S. Application of near infrared reflectance spectroscopy to predict meat and meat products quality: A review. Meat Sci. 2009, 83, 175–186. [Google Scholar] [CrossRef]
- Nicolai, B.M.; Beullens, K.; Bobelyn, E.; Peirs, A.; Saeys, W.; Theron, K.I.; Lammertyn, J. Nondestructive measurement of fruit and vegetable quality by means of NIR spectroscopy: A review. Postharvest Biol. Technol. 2007, 46, 99–118. [Google Scholar] [CrossRef]
- Lin, H.; Ying, Y. Theory and application of near infrared spectroscopy in assessment of fruit quality: A review. Sens. Instrum. Food Qual. Saf. 2009, 3, 130–141. [Google Scholar] [CrossRef]
- Chandrasekaran, I.; Panigrahi, S.S.; Ravikanth, L.; Singh, C.B. Potential of near-infrared (NIR) spectroscopy and hyperspectral imaging for quality and safety assessment of fruits: An overview. Food Anal. Methods 2019, 12, 2438–2458. [Google Scholar] [CrossRef]
- Wang, L.; Sun, D.W.; Pu, H.; Cheng, J.H. Quality analysis, classification, and authentication of liquid foods by near-infrared spectroscopy: A review of recent research developments. Crit. Rev. Food Sci. Nutr. 2017, 57, 1524–1538. [Google Scholar] [CrossRef] [PubMed]
- Dale, L.M.; Thewis, A.; Boudry, C.; Rotar, I.; Dardenne, P.; Baeten, V.; Pierna, J.A.F. Hyperspectral imaging applications in agriculture and agro-food product quality and safety control: A review. Appl. Spectrosc. Rev. 2013, 48, 142–159. [Google Scholar] [CrossRef]
- Fu, X.; Ying, Y. Food safety evaluation based on near infrared spectroscopy and imaging: A review. Crit. Rev. Food Sci. Nutr. 2016, 56, 1913–1924. [Google Scholar] [CrossRef] [PubMed]
- Caporaso, N.; Whitworth, M.B.; Fisk, I.D. Near-Infrared spectroscopy and hyperspectral imaging for non-destructive quality assessment of cereal grains. Appl. Spectrosc. Rev. 2018, 53, 667–687. [Google Scholar] [CrossRef]
- Cozzolino, D. An overview of the application of near infrared spectroscopy to analyze and monitor soil properties in South America. Appl. Spectrosc. Rev. 2015, 50, 859–867. [Google Scholar] [CrossRef]
- Tsenkova, R.; Munćan, J.; Pollner, B.; Kovacs, Z. Essentials of aquaphotomics and its chemometrics approaches. Front. Chem. 2018, 6, 1–25. [Google Scholar] [CrossRef]
- Du, Y.; Chen, F.; Bu, G.; Zhang, L. Distribution and degradation of DNA from non-genetically and genetically modified soybean (Roundup Ready): Impact of soybean protein concentrate and soybean protein isolate preparation. Food Chem. 2021, 335, 127582. [Google Scholar] [CrossRef]
- Munck, L.; Nielsen, J.P.; Møller, B.; Jacobsen, S.; Søndergaard, I.; Engelsen, S.B.; Nørgaard, L.; Bro, R. Exploring the phenotypic expression of a regulatory proteome-altering gene by spectroscopy and chemometrics. Anal. Chim. Acta 2001, 446, 169–184. [Google Scholar] [CrossRef]
- Rui, Y.K.; Luo, Y.B.; Huang, K.L.; Wang, W.M.; Zhang, L.D. Application of near-infraraed diffuse reflectance spectroscopy to the detection and identification of transgenic corn. J. Spectrosc. Spect. Anal. 2005, 25, 1581–1583. [Google Scholar]
- Xie, L.; Ying, Y.; Ying, T.; Yu, H.; Fu, X. Discrimination of transgenic tomatoes based on visible/near-infrared spectra. Anal. Chim. Acta 2007, 584, 379–384. [Google Scholar] [CrossRef] [PubMed]
- Xie, L.; Ying, Y.; Ying, T. Quantification of chlorophyll content and classification of nontransgenic and transgenic tomato leaves using visible/near-infrared diffuse reflectance spectroscopy. J. Agric. Food Chem. 2007, 55, 4645–4650. [Google Scholar] [CrossRef] [PubMed]
- Xie, L.; Ying, Y.; Ying, T. Combination and comparison of chemometrics methods for identification of transgenic tomatoes using visible and near-infrared diffuse transmittance technique. J. Food Eng. 2007, 82, 395–401. [Google Scholar] [CrossRef]
- Xie, L.; Ying, Y.; Ying, T. Classification of tomatoes with different genotypes by visible and short-wave near-infrared spectroscopy with least-squares support vector machines and other chemometrics. J. Food Eng. 2009, 94, 34–39. [Google Scholar] [CrossRef]
- Xie, L.J.; Ying, Y.B.; Chen, M.L.; Ying, T.J. Detection of transgenic tomato leaf with LeETR1 antisense gene by near-infrared spectroscopy. Trans. ASABE 2010, 53, 313–318. [Google Scholar] [CrossRef]
- Biradar, K.S.; Nadaf, H.L.; Kenganal, M. Discrimination of transgenic cotton seed using visible and near-infrared diffuse reflectance spectroscopy (NIRS). Ind. J. Plant Physiol. 2010, 15, 234–241. [Google Scholar]
- Jiao, Z.; Si, X.X.; Li, G.K.; Zhang, Z.M.; Xu, X.P. Unintended compositional changes in transgenic rice seeds (Oryza sativa L.) studied by spectral and chromatographic analysis coupled with chemometrics methods. J. Agric. Food Chem. 2009, 58, 1746–1754. [Google Scholar] [CrossRef]
- Lee, J.H.; Choung, M.G. Nondestructive determination of herbicide-resistant genetically modified soybean seeds using near-infrared reflectance spectroscopy. Food Chem. 2011, 126, 368–373. [Google Scholar] [CrossRef]
- Agelet, L.E.; Armstrong, P.R.; Tallada, J.G.; Hurburgh, C.R., Jr. Differences between conventional and glyphosate tolerant soybeans and moisture effect in their discrimination by near infrared spectroscopy. Food Chem. 2013, 141, 1895–1901. [Google Scholar] [CrossRef] [PubMed][Green Version]
- Xu, W.; Liu, X.; Xie, L.; Ying, Y. Comparison of Fourier transform near-infrared, visible near-infrared, mid-infrared, and Raman spectroscopy as non-invasive tools for transgenic rice discrimination. Trans. ASABE 2014, 57, 141–150. [Google Scholar] [CrossRef]
- Guo, H.; Chen, J.; Pan, T.; Wang, J.; Cao, G. Vis-NIR wavelength selection for non-destructive discriminant analysis of breed screening of transgenic sugarcane. Anal. Methods 2014, 6, 8810–8816. [Google Scholar] [CrossRef]
- Long, Z.; Shan-shan, W.; Yan-fei, D.; Jia-rong, P.; Cheng, Z. Discrimination of transgenic rice based on near infrared reflectance spectroscopy and partial least squares regression discriminant analysis. Rice Sci. 2015, 22, 245–249. [Google Scholar] [CrossRef]
- Garcia-Molina, M.D.; Garcia-Olmo, J.; Barro, F. Effective identification of low-gliadin wheat lines by near infrared spectroscopy (NIRS): Implications for the development and analysis of foodstuffs suitable for celiac patients. PLoS ONE 2016, 11, e0152292. [Google Scholar] [CrossRef] [PubMed]
- Zhu, S.; Liang, J.; Yan, L. Study on Rapid Identification Methods of Transgenic Rapeseed Oil Based on Near Infrared Spectroscopy. In Proceedings of the International Conference on Computer and Computing Technologies in Agriculture, Nanchang, China, 22–25 October 2010; Springer: Berlin/Heidelberg, Germany, 2010; Volume 345, pp. 633–640. [Google Scholar] [CrossRef]


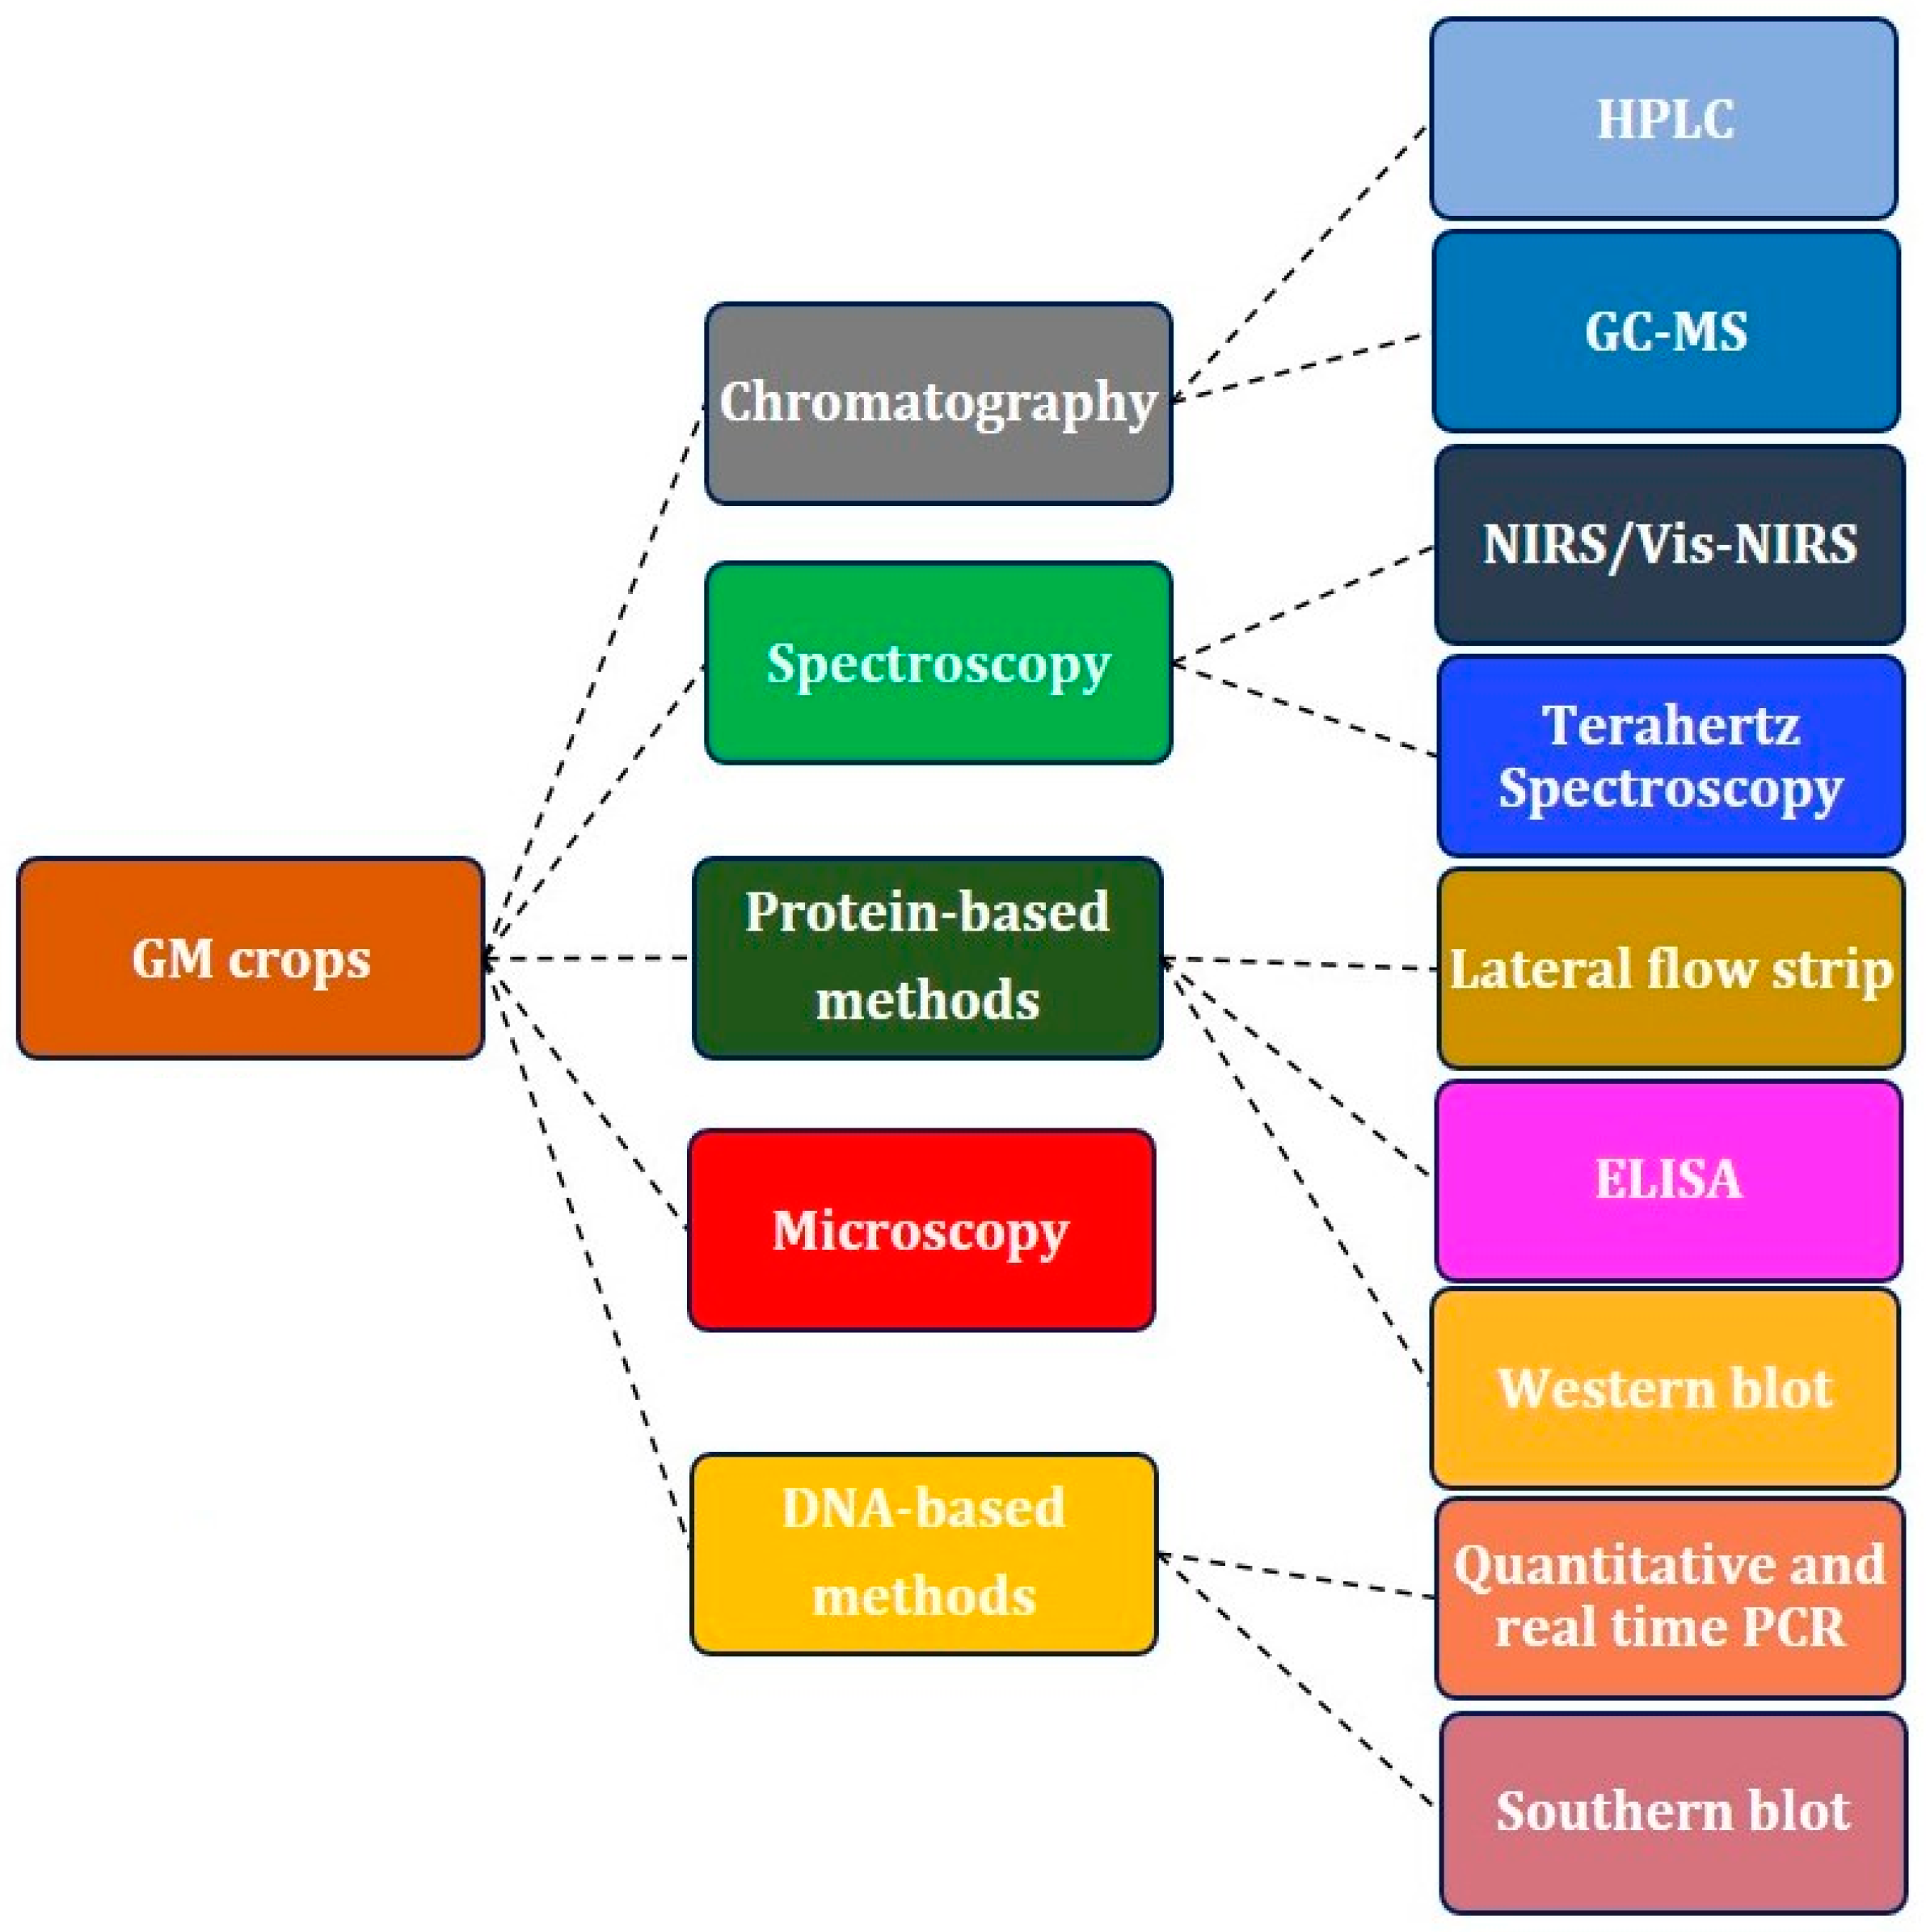
| Parameter | Protein-Based | DNA-Based | Microscopy | Chromatography | Spectroscopy | |||||
|---|---|---|---|---|---|---|---|---|---|---|
| Western Blot | ELISA | Lateral Flow Strip | Southern Blot | Qualitative PCR | Real-Time PCR | Classical Microscopy | HPLC and GC-MS | NIRS and Vis-NIRS | TeraHertz Spectroscopy | |
| Ease of use | Difficult | Moderate | Simple | Difficult | Difficult | Difficult | Difficult | Difficult | Simple | Moderate |
| Needs special equipment | Yes | Yes | No | Yes | Yes | Yes | Yes | Yes | Yes | Yes |
| Sensitivity | High | High | High | Moderate | Very High | High | High | Very High | High | High |
| Duration | 2 d | 30–90 min | 10 min | 6 h | 1.5 d | 1 d | 1 d | 1–2 d | Less than 1 min * | 15 min |
| Cost/sample (US$) | 150 | 5 | 2 | 150 | 250 | 450 | 2 | 20 | ** | 10 |
| Gives quantitative results | No | Yes | No | No | No | Yes | No | Yes | Yes | No |
| Suitable for field test | No | Yes | Yes | No | No | No | No | No | Yes | In progress |
| Employed mainly in | Academic labs | Test facility | Field Testing | Academic labs | Test facility | Test facility | Test facility | Test facility | All fields | Test facility |
| Technical | Yes | Yes | No | Yes | Yes | Yes | Yes | Yes | No | No |
| Selective | Yes | Yes | Yes | Yes | Yes | Yes | Yes | Yes | No | No |
| Portable /handheld versions available | No | No | Yes | No | No | No | No | No | Yes | In progress |
| S. No | Plant | Gene | Preprocessing Method | Chemometric Analyses | Remarks | Reference |
|---|---|---|---|---|---|---|
| 1 | Soybean | Roundup Ready® (EPSPS gene) | SNV | PLS, LWR, ANN | Around 8000 samples discriminated with an accuracy rate of 93% | [42] |
| 2 | Barley | Mutation of lys3a | MSC | PCA, PLSR | Effective discrimination of barley seeds | [86] |
| 3 | Maize | cry-gene | - | - | Effective discrimination with back-propagation approach | [87] |
| 5 | Tomato | Antisense LeETR2 | MSC, SG 1st and 2nd derivatives | PCA, DA, PLS-DA | Effective discrimination of tomato with highest accuracy | [88] |
| 6 | Tomato | Antisense LeETR1 | MSC, SG 1st and 2nd derivatives | PLS-DA | Effective discrimination of tomato with highest accuracy | [89] |
| 7 | Tomato | Antisense LeETR1 | MSC, SG 1st and 2nd derivatives | PCA, SIMCA, DPLS | Effective discrimination of tomato with highest accuracy | [90] |
| 8 | Tomato | Antisense LeETR2 | - | LS-SVM, DA, SIMCA, DPLS | Effective discrimination of tomato with highest accuracy | [91] |
| 9 | Tomato | Antisense LeETR1 | SNV | PCA, DA | Effective discrimination of tomato with highest accuracy | [92] |
| 10 | Cotton | cry1Ac | MSC, SNV, SG 1st and 2nd derivatives | PLS, PCR | Effective discrimination of cotton with 100% accuracy rate | [93] |
| 11 | Rice | RCH10, RAC22, B-1,3-glu, B-RIP | SNV, SG 1st and 2nd derivatives | PCA, PLS-DA | A comprehensive study for the GM discrimination with multiple genes and methods | [94] |
| 12 | Soybean | EPSPS gene | 2nd derivatives | PCA, PLS-DA | Using Vis-NIRS for effective discrimination of soybean with 100% accuracy | [95] |
| 13 | Soybean | Roundup Ready® (EPSPS gene) | - | PCA, PLS-DA | Successful discrimination of Roundup Ready® soybean | [96] |
| 14 | Rice | cry1Ab | MSC, SNV, SG 1st and 2nd derivatives | PCA, PLS-DA, DA | Comparative analysis using fourier transformed NIR (FT-NIR), Vis-NIR and MIR spectroscopies for the effective discrimination of GM rice | [97] |
| 15 | Rice | Bt cry gene | CDA | PCA, PLS-DA, LS-SVM, PCA-BPNN | Effective discrimination of GM rice and non-GM rice seeds | [48] |
| 16 | Sugarcane | Bt and Bar genes | SG | PCA, LDA | Effective discrimination of 456 GM and non-GM sugarcane leaf samples | [98] |
| 17 | Rice | OsTCTP and Osmi166 | SNV | PLS-DA | Effectively discriminated rice lines transformed with protein (OsTCTP) and regulation (Osmi166) genes by using NIRS | [99] |
| 18 | Bread wheat | RNAi mediated downregulation of gliadin epitopes | SNV/DT | DPLS | Discrimination of RNAi mediated GM wheat with low gliadin (gluten) content | [100] |
| 19 | Maize | cry1Ab/cry2Ag-G10evo | WT, SNV, MSC | PCA, SVM | Effective discrimination of GM maize lines with 100% accuracy | [18] |
| 20 | Rice | CRISPR-Cas9 mediated mutation of TGW6 | WT | SVM, ELM | Effective discrimination of CRIPR-Cas9 mutated rice (TWG6 gene) and normal rice by using NIRS | [19] |
| 21 | Rice | cry1Ab/cry1Ac | NWS, SNV, MSC, SG 1st derivatives | PCA, SVM, PLS-DA | Effective discrimination of GM rice lines with highest accuracy rate. | [3] |
| Transgenic Foods | ||||||
| 1 | Canola oil | - | - | PCA, DPLS | 117 canola oil samples were discriminated with a 97.30% accuracy rate | [101] |
| 2 | Soybean oil | - | Mean centering/MSC | PCA, SVM-DA, PLS-DA | 40 transgenic and 40 non-transgenic soybean oil discriminated with 100% accuracy rate | [4] |
Publisher’s Note: MDPI stays neutral with regard to jurisdictional claims in published maps and institutional affiliations. |
© 2021 by the authors. Licensee MDPI, Basel, Switzerland. This article is an open access article distributed under the terms and conditions of the Creative Commons Attribution (CC BY) license (https://creativecommons.org/licenses/by/4.0/).
Share and Cite
Sohn, S.-I.; Pandian, S.; Oh, Y.-J.; Zaukuu, J.-L.Z.; Kang, H.-J.; Ryu, T.-H.; Cho, W.-S.; Cho, Y.-S.; Shin, E.-K.; Cho, B.-K. An Overview of Near Infrared Spectroscopy and Its Applications in the Detection of Genetically Modified Organisms. Int. J. Mol. Sci. 2021, 22, 9940. https://doi.org/10.3390/ijms22189940
Sohn S-I, Pandian S, Oh Y-J, Zaukuu J-LZ, Kang H-J, Ryu T-H, Cho W-S, Cho Y-S, Shin E-K, Cho B-K. An Overview of Near Infrared Spectroscopy and Its Applications in the Detection of Genetically Modified Organisms. International Journal of Molecular Sciences. 2021; 22(18):9940. https://doi.org/10.3390/ijms22189940
Chicago/Turabian StyleSohn, Soo-In, Subramani Pandian, Young-Ju Oh, John-Lewis Zinia Zaukuu, Hyeon-Jung Kang, Tae-Hun Ryu, Woo-Suk Cho, Youn-Sung Cho, Eun-Kyoung Shin, and Byoung-Kwan Cho. 2021. "An Overview of Near Infrared Spectroscopy and Its Applications in the Detection of Genetically Modified Organisms" International Journal of Molecular Sciences 22, no. 18: 9940. https://doi.org/10.3390/ijms22189940
APA StyleSohn, S.-I., Pandian, S., Oh, Y.-J., Zaukuu, J.-L. Z., Kang, H.-J., Ryu, T.-H., Cho, W.-S., Cho, Y.-S., Shin, E.-K., & Cho, B.-K. (2021). An Overview of Near Infrared Spectroscopy and Its Applications in the Detection of Genetically Modified Organisms. International Journal of Molecular Sciences, 22(18), 9940. https://doi.org/10.3390/ijms22189940