Article

Fusion with Promiscuous Gα16 Subunit Reveals Signaling Bias at Muscarinic Receptors

1
Department of Neurochemistry, Institute of Physiology Czech Academy of Sciences, 14220 Prague, Czech Republic
2
Department of Physical Sciences, Barry University, Miami Shores, FL 33161, USA
*
Author to whom correspondence should be addressed.
Int. J. Mol. Sci. 2021, 22(18), 10089; https://doi.org/10.3390/ijms221810089
Submission received: 18 June 2021 / Revised: 6 September 2021 / Accepted: 14 September 2021 / Published: 18 September 2021
(This article belongs to the Section Biochemistry)

Abstract

:
A complex evaluation of agonist bias at G-protein coupled receptors at the level of G-protein classes and isoforms including non-preferential ones is essential for advanced agonist screening and drug development. Molecular crosstalk in downstream signaling and a lack of sufficiently sensitive and selective methods to study direct coupling with G-protein of interest complicates this analysis. We performed binding and functional analysis of 11 structurally different agonists on prepared fusion proteins of individual subtypes of muscarinic receptors and non-canonical promiscuous α-subunit of G16 protein to study agonist bias. We have demonstrated that fusion of muscarinic receptors with Gα16 limits access of other competitive Gα subunits to the receptor, and thus enables us to study activation of Gα16 mediated pathway more specifically. Our data demonstrated agonist-specific activation of G16 pathway among individual subtypes of muscarinic receptors and revealed signaling bias of oxotremorine towards Gα16 pathway at the M2 receptor and at the same time impaired Gα16 signaling of iperoxo at M5 receptors. Our data have shown that fusion proteins of muscarinic receptors with α-subunit of G-proteins can serve as a suitable tool for studying agonist bias, especially at non-preferential pathways.

1. Introduction

G-protein-coupled receptors (GPCRs) are the largest family of human membrane proteins that transmit signals into a cell through heterotrimeric G-proteins. GPCRs represent the primary target for drug development with potential application in essentially all clinical fields. They mediate a broad range of physiological processes by driving multiple intracellular effectors through various classes of G-proteins. Individual GPCRs preferentially couple to the particular class of G-proteins but they can also successfully activate others [1,2,3]. This coupling promiscuity was observed in both artificial systems with over-expressed GPCRs and native cells [4,5]. Besides G-proteins, GPCR can couple with β-arrestins which desensitize and scaffold G-protein-driven signaling pathways [6]. The multiplicity of signaling leads to the high complexity of the functional response of GPCRs to agonist stimulation.
Structurally different agonists induce specific changes in the GPCRs leading to stabilization of agonist-specific conformations that can lead to non-uniform agonist-specific modulation of signaling pathways. This preferential orientation of the signaling of a GPCR towards a subset of its signal transducers is termed signaling bias [7]. An agonist biased to a particular G-protein pathway may promote therapeutically desired signaling while simultaneously avoiding side effects mediated by activation of others, especially in conditions with well-understood pathophysiology [8,9,10]. For example, melanocortin receptor 4 (MC4R) agonist melanotan II produces its anorectic effects through coupling to Gq/11 and its adverse cardiovascular effects through Gs coupling, suggesting potential therapeutic benefit in obesity for Gq/11-biased ligands [11].
The accurate evaluation of agonist bias regarding individual G-protein pathways is crucial for preclinical drug development. However, it is a difficult task given the high complexity of GPCRs signaling. The molecular crosstalk that can occur among downstream effector molecules may bring in further complexity [12]. One of the most challenging tasks is to develop a suitable technique for the analysis of the signaling pathway of interest with high sensitivity and sufficient selectivity that is free from the interference of other signaling pathways. Measurement of second messengers struggles with molecular crosstalk of signaling pathways. The analysis of coupling of GPCRs with individual G-proteins is difficult due to the presence of others that interact concurrently with a given signaling pathway, especially in studies of non-preferential signaling pathways [13] or in studies of signaling pathways mediated by individual isoforms of given G-protein.
Muscarinic signaling is implicated in numerous pathologic events, such as the promotion of carcinoma cell growth, early pathogenesis of neurodegenerative diseases in the central nervous system of Alzheimer’s and Parkinson’s, schizophrenia, drug addiction, pain, and also in some internal diseases, e.g., asthma or overactive bladder [14,15]. As of now, no affinity-based selective agonists of individual muscarinic receptors have been discovered, due to the high homology of the orthosteric binding site among individual muscarinic subtypes [16,17,18].
Selective targeting on the Gi/o versus Gq/11 mediated pathway by biased agonist could be a way to achieve selectivity to even or odd muscarinic subtypes [19]. Moreover, agonists biased to individual isoforms of G-proteins could lead to tissue-specific activation of mAChRs, due to the predominant expression of some G-proteins in specific tissues (e.g., Go in the central nervous system or G16 in hematopoietic cells) [10,20]. We have focused on variations in the G16 signaling pathway that was not studied so far, is rare and may lead to very specific effects (e.g., tissue-specific activation). We have analyzed variation in the G16 signaling profile among individual subtypes of muscarinic receptors.
To reveal and properly quantify putative agonist bias to certain G-proteins and their isoforms, especially non-preferential ones, among individual subtypes of muscarinic receptors, a system that is sufficiently sensitive and specific is required. Furthermore, 1:1 Gα-receptor stoichiometry would simplify the analysis and interpretation of found agonist bias. We assume that fusion proteins of muscarinic receptors with Gα subunit of interest could serve as a convenient tool to screen agonist bias towards the particular Gα among individual subtypes of muscarinic receptors. Importantly, we expect that tight fusion of a receptor with a particular Gα prevents the coupling of other competing Gα to the receptor. If so, the signaling of a pathway of interest can be selectively analyzed. Fusion proteins of GPCR and α-subunit of G-protein were used to study individual G-protein mediated pathways in several studies [21,22,23,24,25,26]. We validate our assumptions on an example of fusion proteins of individual muscarinic receptors and non-canonical promiscuous Gα16 subunit.
Muscarinic signaling via non-canonical G16 G-protein may play a relevant physiological role. At the protein level, G16 expression is only detected in highly specific cell types (hematopoietic and epithelial cells) characterized by a high rate of cell turnover [27]. G16 mediated signaling may play role in immune response [28] and tumor cell growth [29].
Promiscuous Gα16 efficiently couples to any subtype of muscarinic receptor. That leads to the phospholipase C-activation, resulting in the formation of inositol phosphates. We performed a binding and functional analysis of these constructs using eleven structurally different muscarinic agonists. We demonstrated agonist-specific activation of non-canonical G16 pathway varying among individual subtypes. Additionally, we compared the signaling of agonists oxotremorine and iperoxo at Gα16_fused, Gα16 co-transfected, and wild types of M2 and M5 muscarinic receptors and revealed signaling bias of oxotremorine towards Gα16 pathway at the M2 receptor and at the same time impaired Gα16 signaling of iperoxo at M5 receptors.

2. Results

2.1. Fusion Proteins

2.1.1. Description of Fusion Proteins

Fusion proteins (denoted M1_Gα16 through M5_Gα16) were constructed from individual subtypes of muscarinic receptors M1–M5 and α-subunit of G16 G-protein. The α-subunit was tightly connected to the C-terminus of the respective receptors as described in the Methods. Palmitoylation sites at helix 8 of receptors, as well as at N-terminus of Gα16, were preserved to ensure their anchoring to the membrane. Complete sequences of fusion proteins are shown in Supplementary Materials.

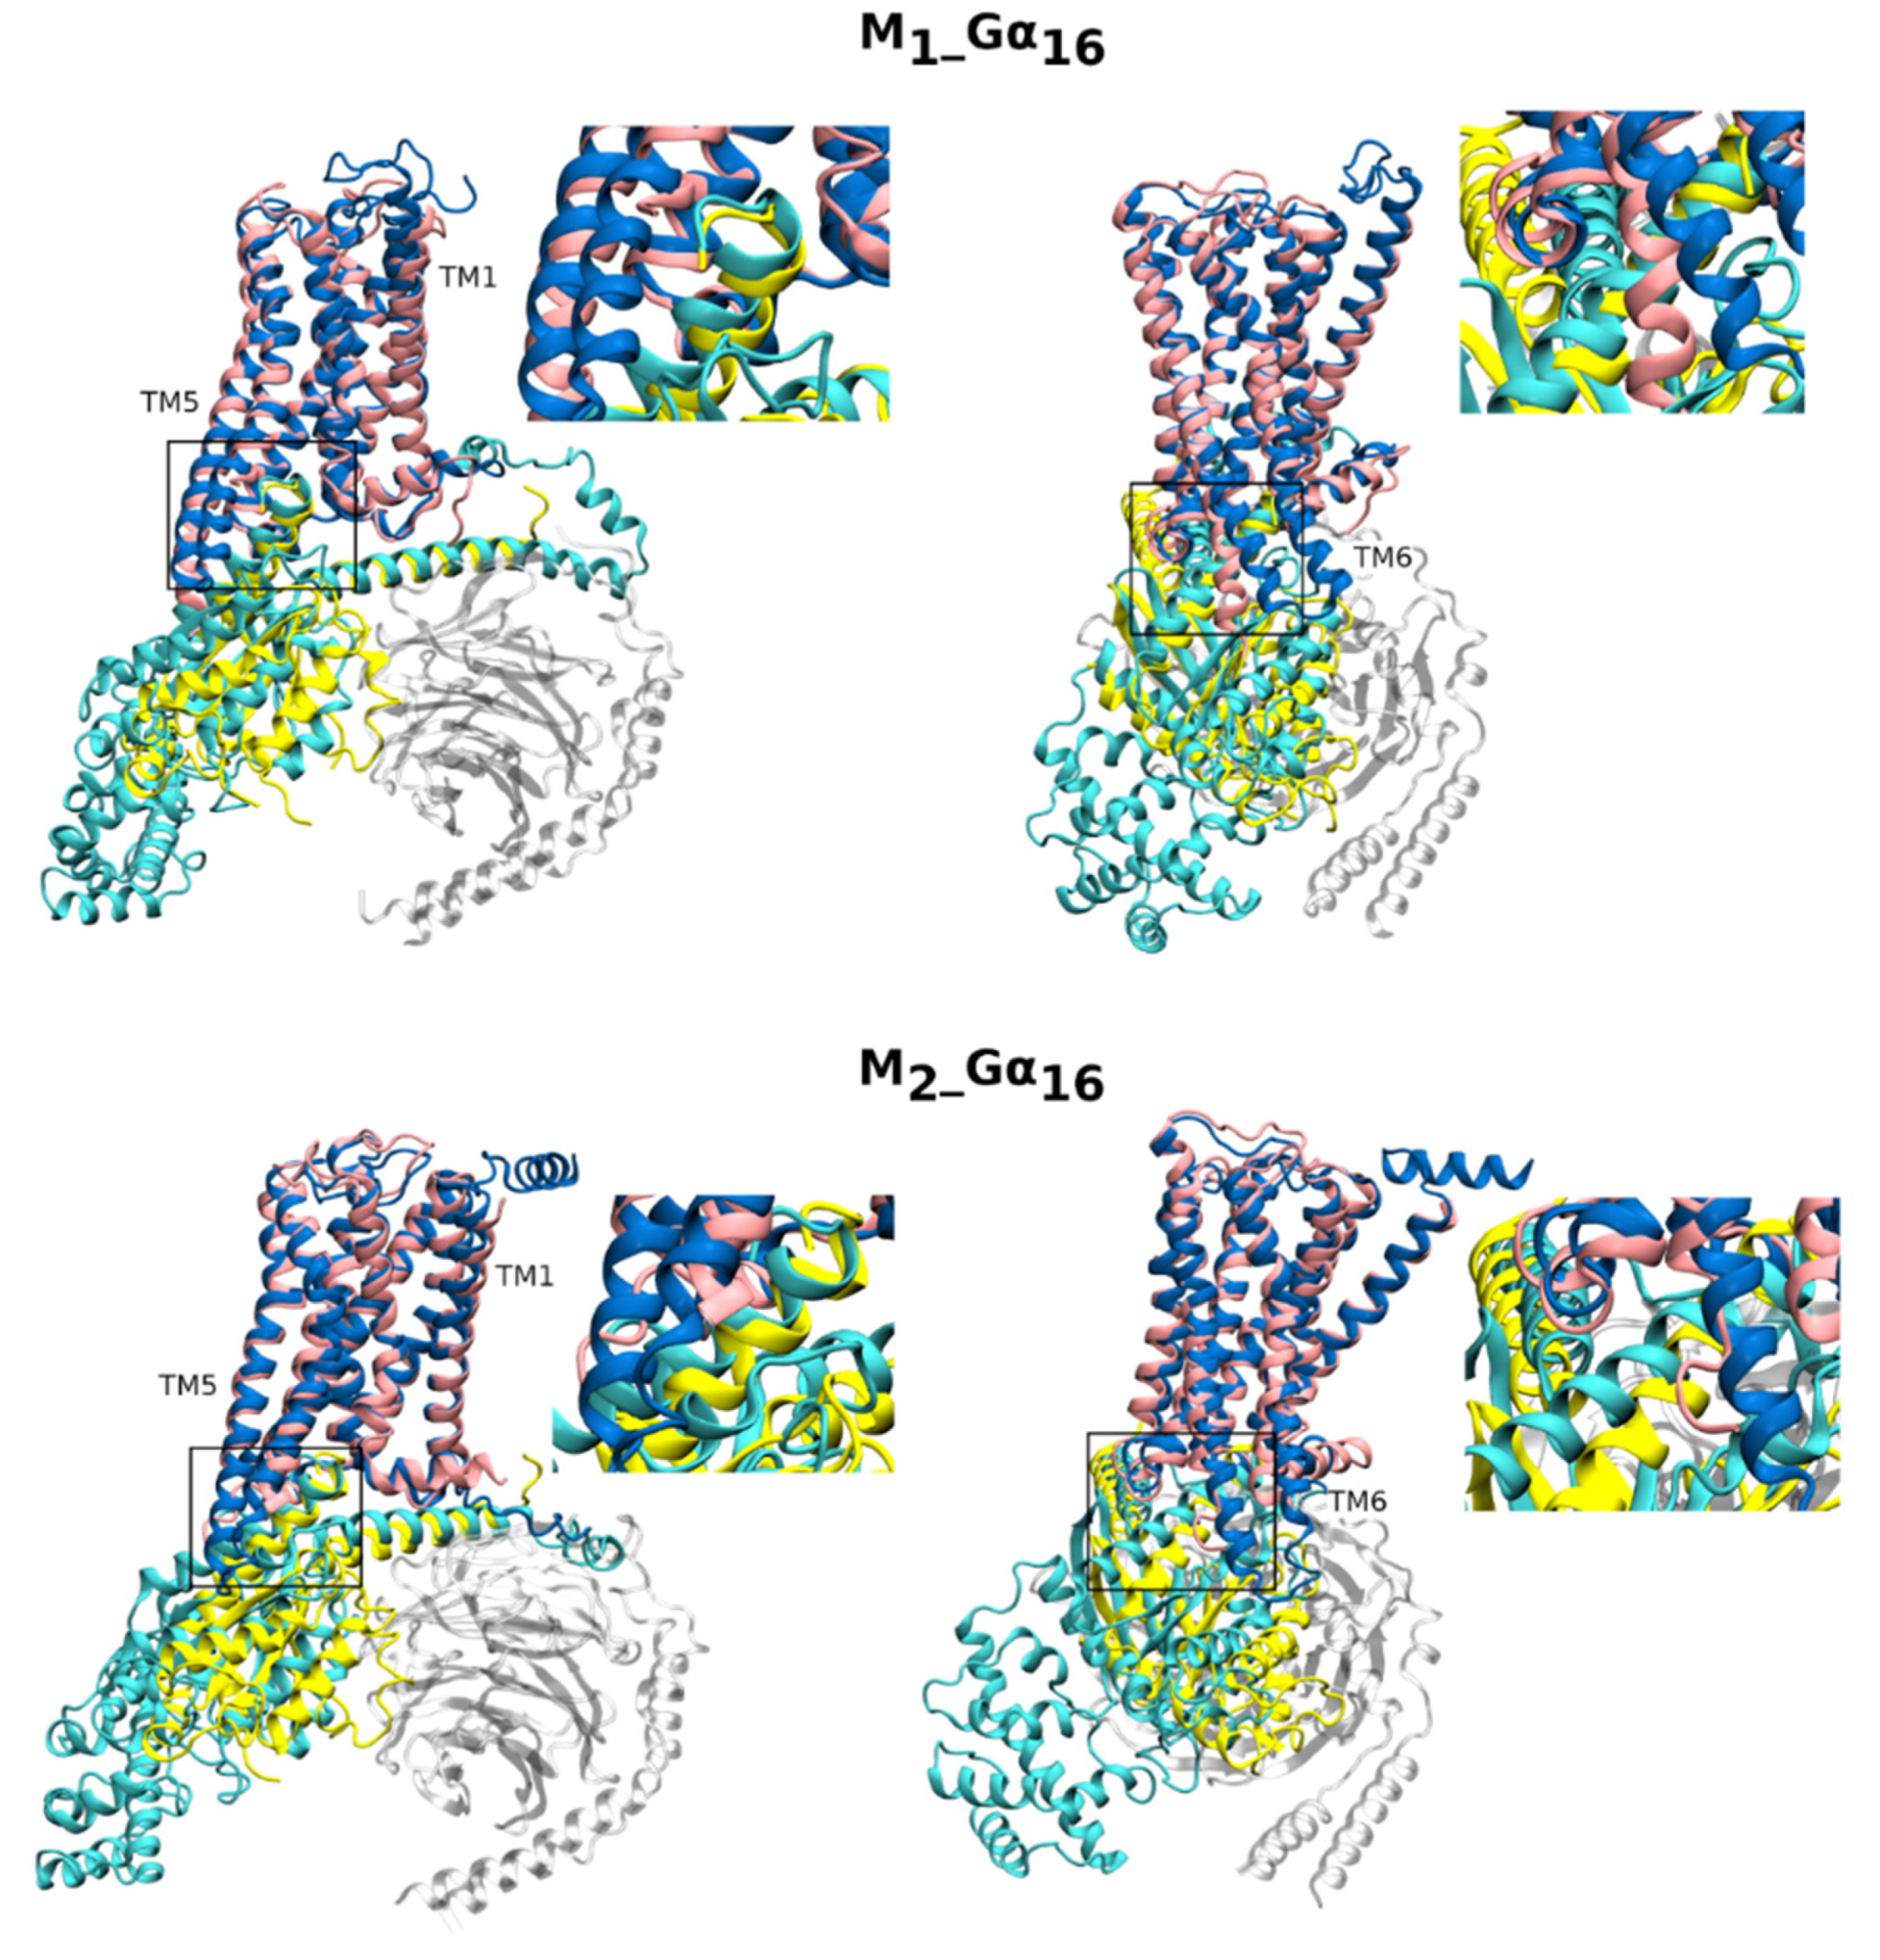
2.1.2. Homology Models of Fusion Proteins

To test whether fusion proteins respect the natural arrangement of the receptor and G-protein α-subunit that allows their successful coupling with no serious occurring disturbance to the structure arrangement, we have built homology models of M1_Gα16 and M2_Gα16 fusion proteins. Homology modeling resulted in a good model free of unusual structural features. Overlays of fusion proteins with cryo-EM of M1 + Gα11 (6OIJ) and M2 + Gαo (6OIK) receptor-G-protein complexes [30] are shown in Figure 1. The stability of structure was verified by running molecular dynamics (MD) of fusion proteins in complex with G-protein βγ-dimer in membrane/water system. Analysis of MD trajectories by Simulation Quality Analysis tools of Maestro confirmed the stability of the structures (Supplementary Materials Figure S3). No structural rearrangements occurred during 120 ns of MD. Insertion of the C-terminus of Gα16 to G-protein binding site at the receptor located between transmembrane helix 3 and 6 corresponds to the insertion of Gα11 at M1 and Gαo at M2. At the M1 receptor, the position of the C-terminus of Gα11 and Gα16 are practically identical. However, at M2, Gα16 is inserted under a sharper angle than Gαo. Insertion of the C-terminus of Gα16 instead of Gα11 or Gαo to the G-protein binding site did not induce any major change in the receptor conformation.

2.1.3. Affinity of [3H]NMS for Gα16 Fused Receptors

To confirm that fusion with Gα16 indeed did not influence receptor conformation as indicated by molecular modeling, we measured the binding of radiolabeled [3H]NMS to all Gα16_fused receptors. The affinity of [3H]NMS to fusion proteins was determined in saturation binding experiments and calculated according to Equation (1). The fusion of muscarinic receptors with Gα16 subunit did not affect the binding affinity of [3H]NMS at any fusion protein. The determined affinity of [3H]NMS to fused and wt receptors, as well as their expression level in CHO cells, is summarized in (Supplementary Materials Table S1).

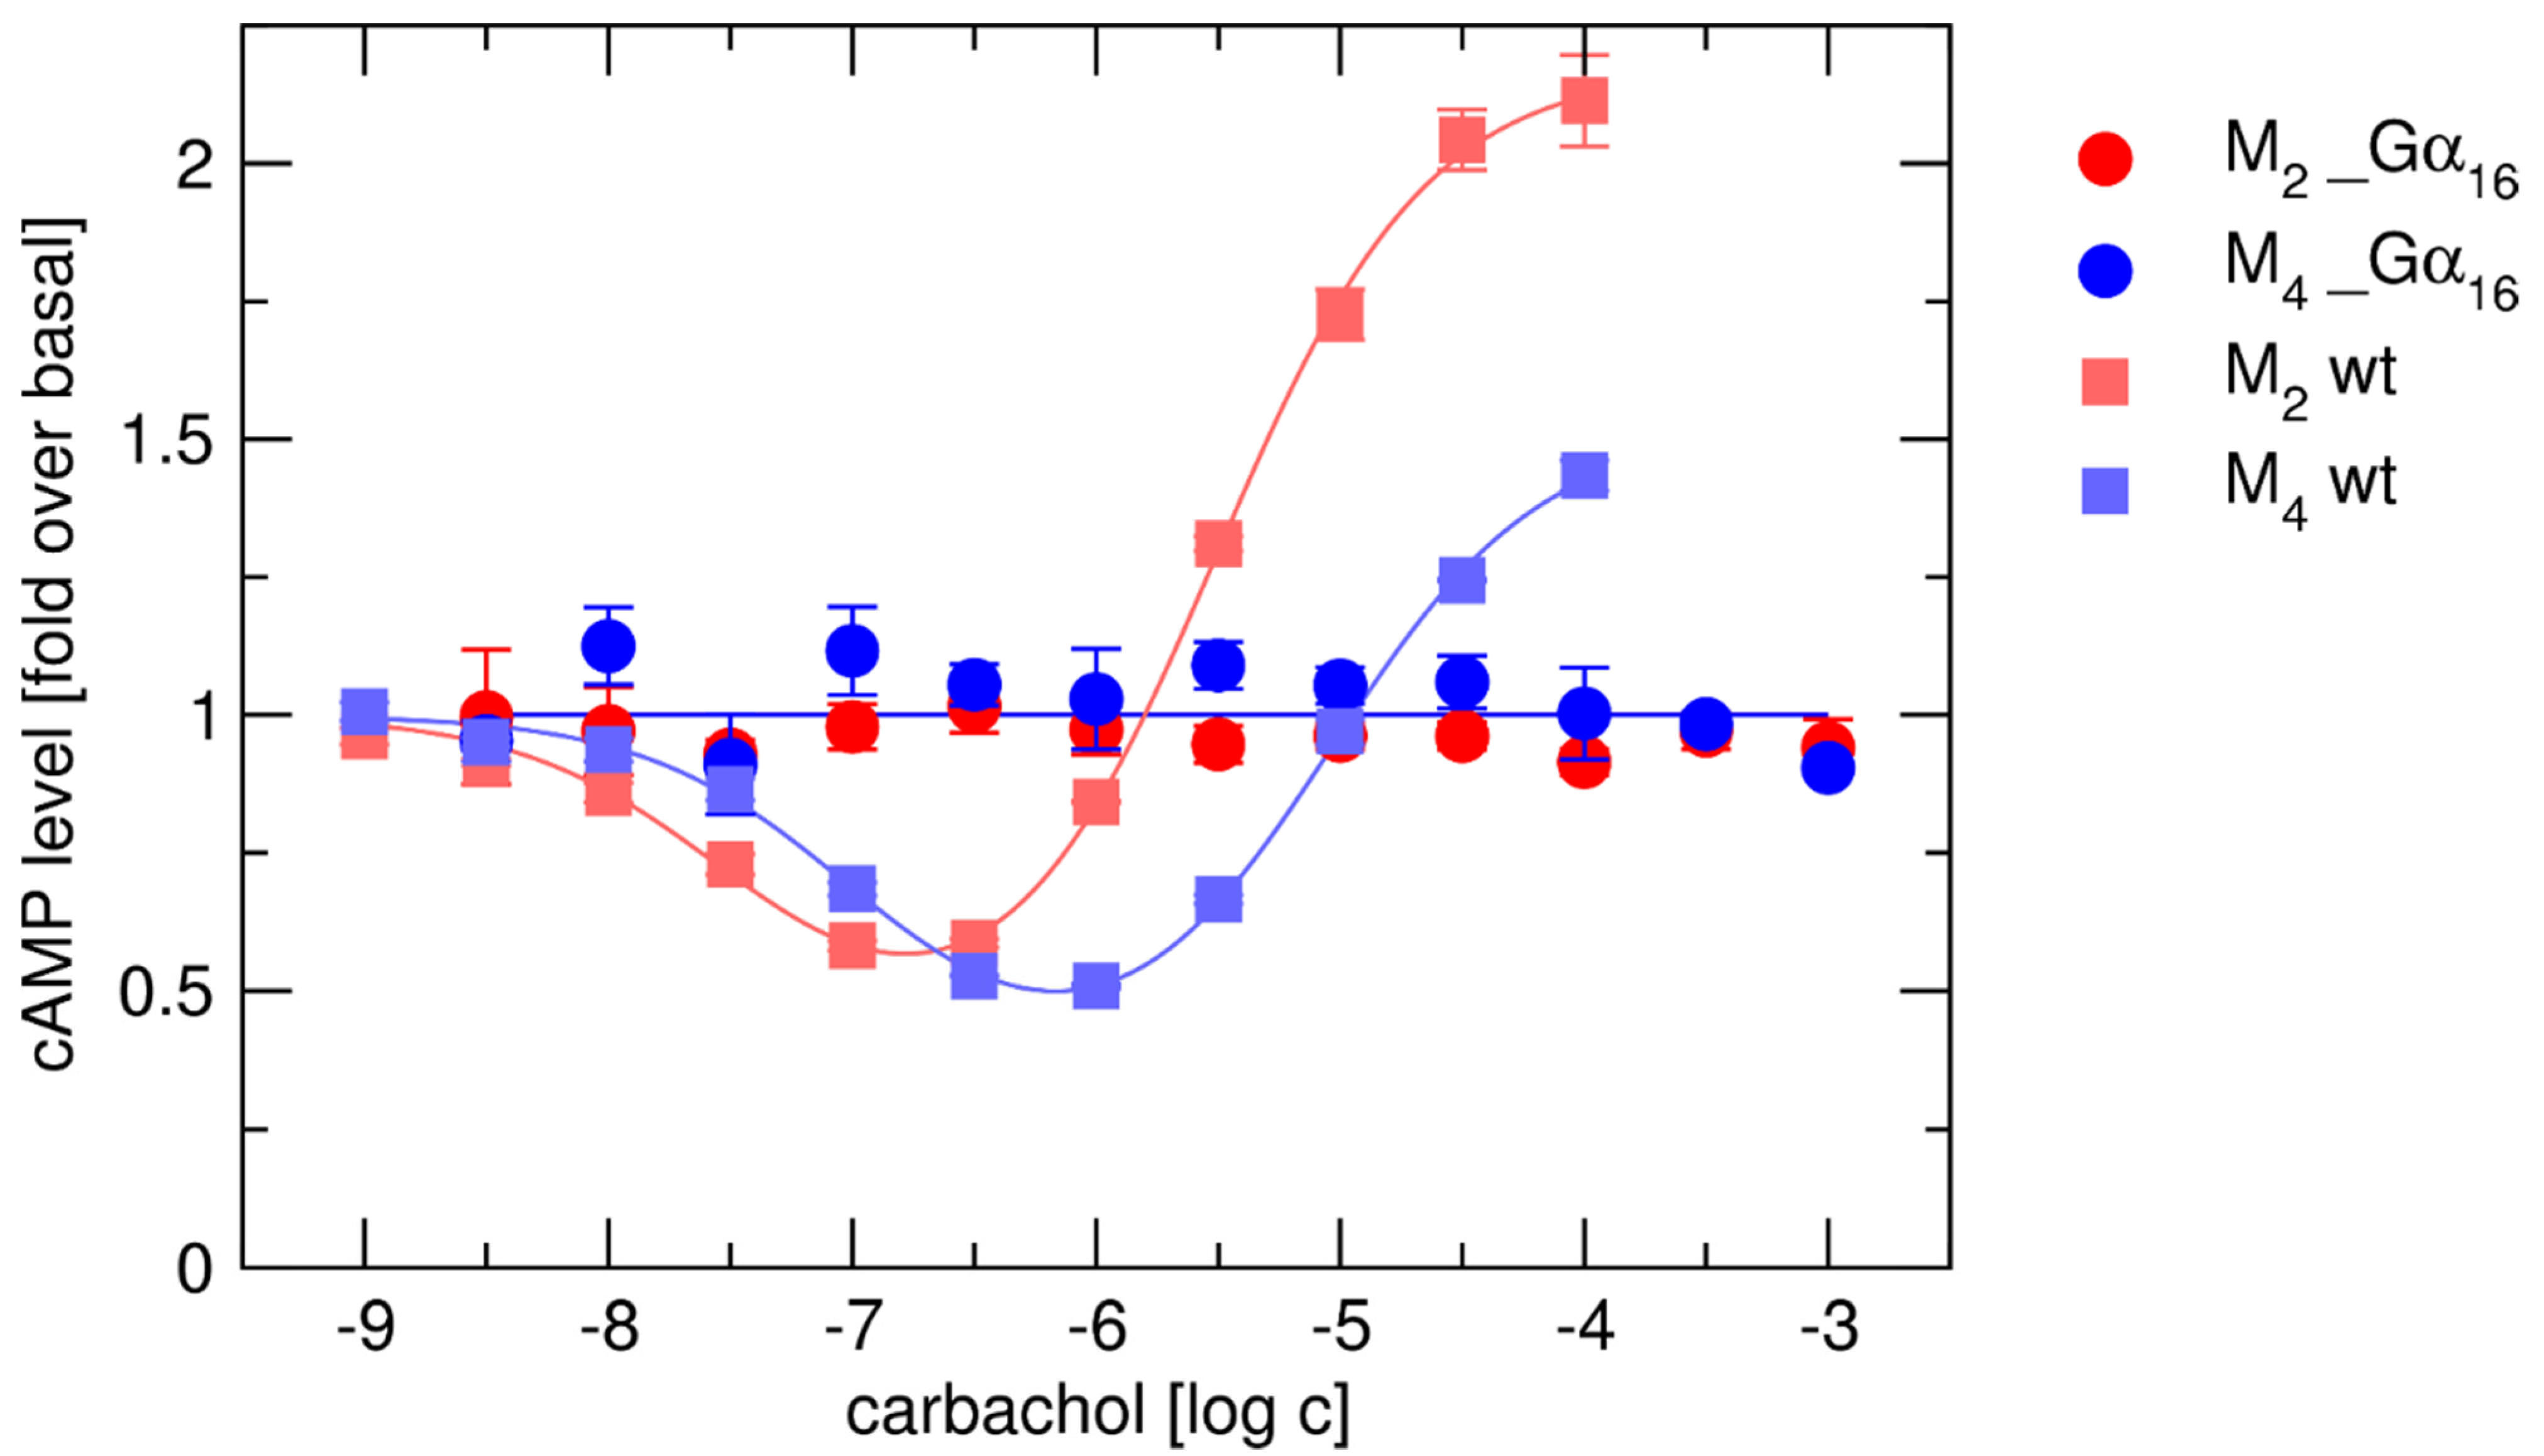
2.2. Lack of Coupling of Gα16_Fused Receptors with Endogenous G-Proteins

Muscarinic receptors are able to activate multiple G-proteins. Preferentially, muscarinic receptors M1, M3, and M5 couple with Gαq/11 and M2 and M4 receptors with Gαi/o G-proteins. All muscarinic subtypes efficiently activate non-canonical promiscuous G-protein (G16) followed by activation of the appropriate signaling pathway (phospholipase C-activation and generation of IPX). Based on molecular models, we expected that fusion of muscarinic receptors with Gα16 subunit would sterically prevent coupling of endogenously expressed G-proteins. To this end, we analyzed changes in cAMP level, mediated by endogenous Gi/o and Gs proteins, after activation of wt and Gα16_fused M2 and M4 receptors by agonist carbachol. Basal level of cAMP was determined in presence of 10 µM adenylate cyclase activator forskolin. Values of basal level determined as % of incorporated radioactivity varied in the range of 2.5–3% and are the same in cells expressing wt and fused receptors. Level of cAMP was calculated as fold over basal level. We demonstrate that tight fusion with Gα16 prevented the coupling of preferential Gαi/o and non-preferential Gs to M2 and M4 receptors. While carbachol stimulated accumulation of IPX at all Gα16_fused receptors (Supplementary Materials Table S3), at M2_Gα16 and M4_Gα16, did not change the level of cAMP, whereas at wt M2 and M4, carbachol inhibited cAMP synthesis via preferential Gi/o G-proteins at submicromolar concentrations and stimulated it via non-preferential Gs G-proteins at micromolar concentrations (Figure 2). Thus, the fusion proteins pass the signal solely through the fused Gα subunit.

2.3. Binding and Functional Analysis of Gα16 Fused Receptors

Eleven structurally different agonists, varying in the binding mode to muscarinic receptors, potency, and efficacy to activate muscarinic receptors (arecoline, carbachol furmethide, iperoxo, McN-A343, N-desmethylclozapine, oxotremorine, pilocarpine, xanomeline, JR-6, and JR-7), were used for pharmacological evaluation of the fusion proteins. Structures of tested agonists are shown in Supplementary Materials Figure S2.

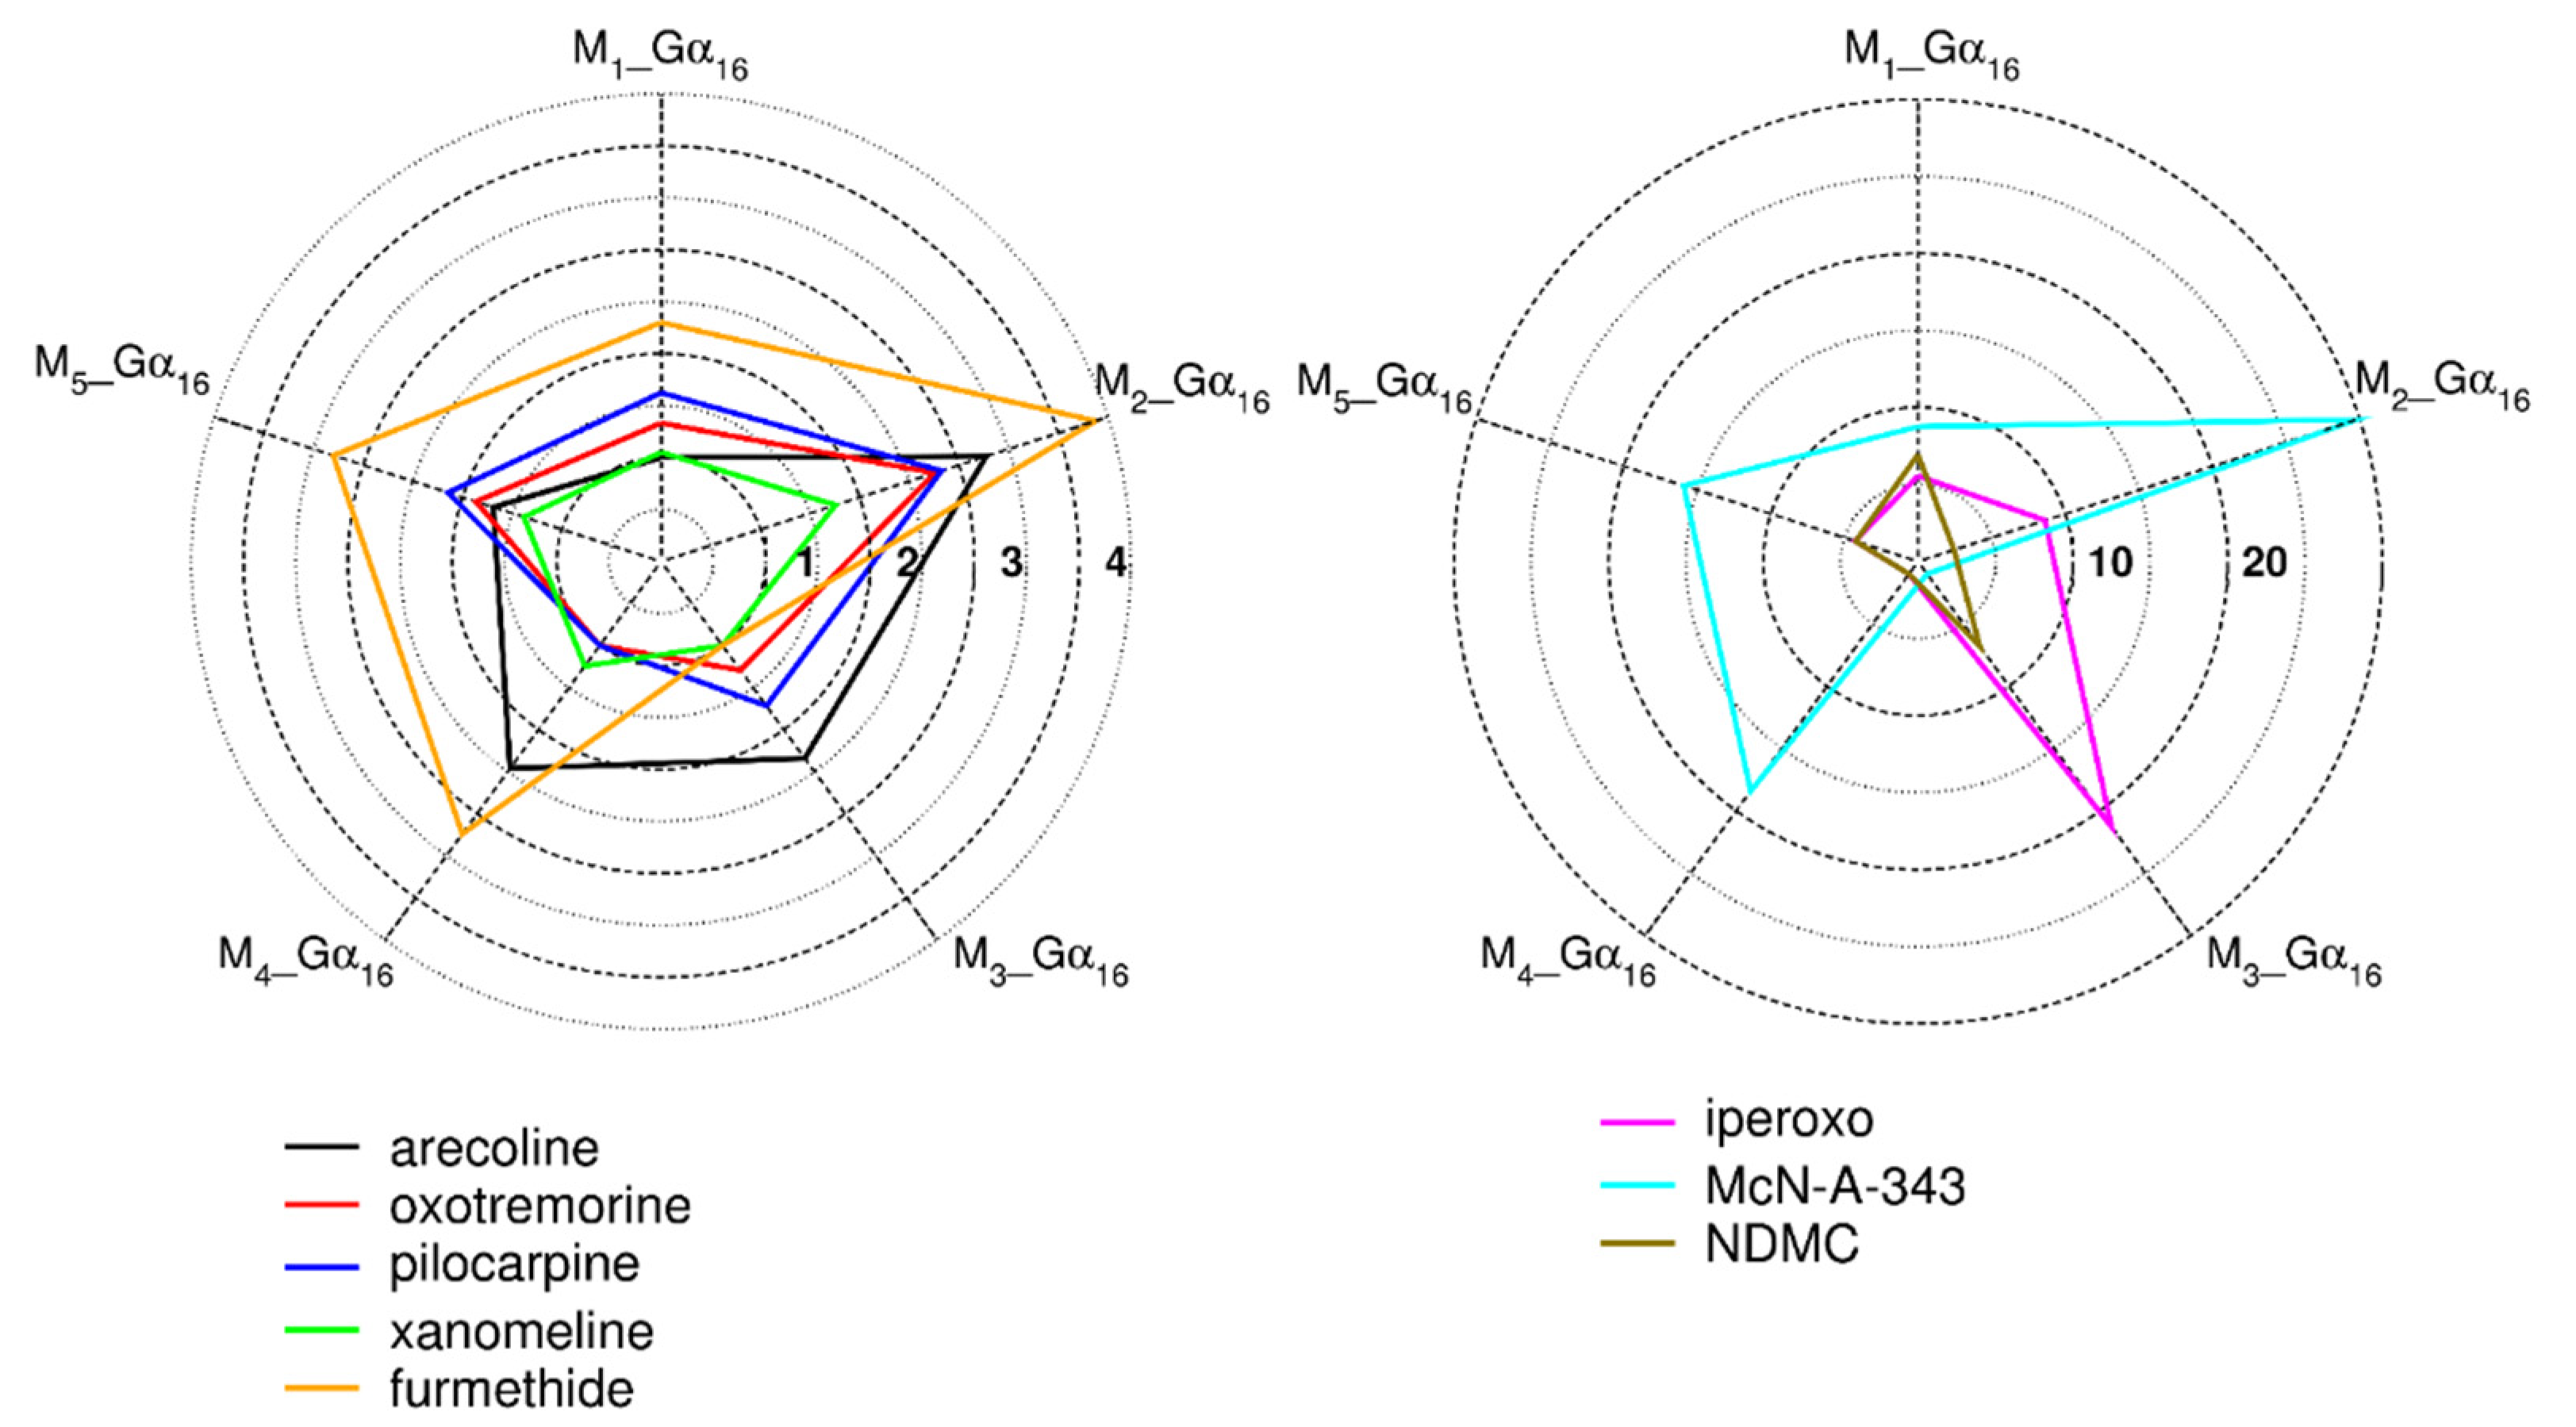
2.3.1. Binding Affinity of Tested Agonists to Gα16 Fused Muscarinic Receptors

The affinity of tested agonists to fused proteins was assayed in competition experiments with 1nM [3H]NMS, calculated according to Equation (4), and is summarized in Table 1. All agonists completely inhibited [3H]NMS binding to fused proteins. All tested agonists displayed only low-affinity binding, except for iperoxo at M1_Gα16 and JR6 at M4_Gα16. Affinities of low-affinity binding of tested agonists (carbachol, oxotremorine, pilocarpine, JR6, and JR7) to wt and Gα16_fused muscarinic receptors were compared. Data are summarized in Supplementary Materials Table S2. The affinity of carbachol was slightly lower at all Gα16_fused receptors than at corresponding wt. The decrease in affinity was observed also for pilocarpine, JR7, and oxotremorine (except oxotremorine at M1 and JR7 at M2). On the other hand, JR6 had a higher affinity at all Gα16_fused receptors, especially at M2_Gα16 affinity of JR6 was 23-times higher than at wt M2.

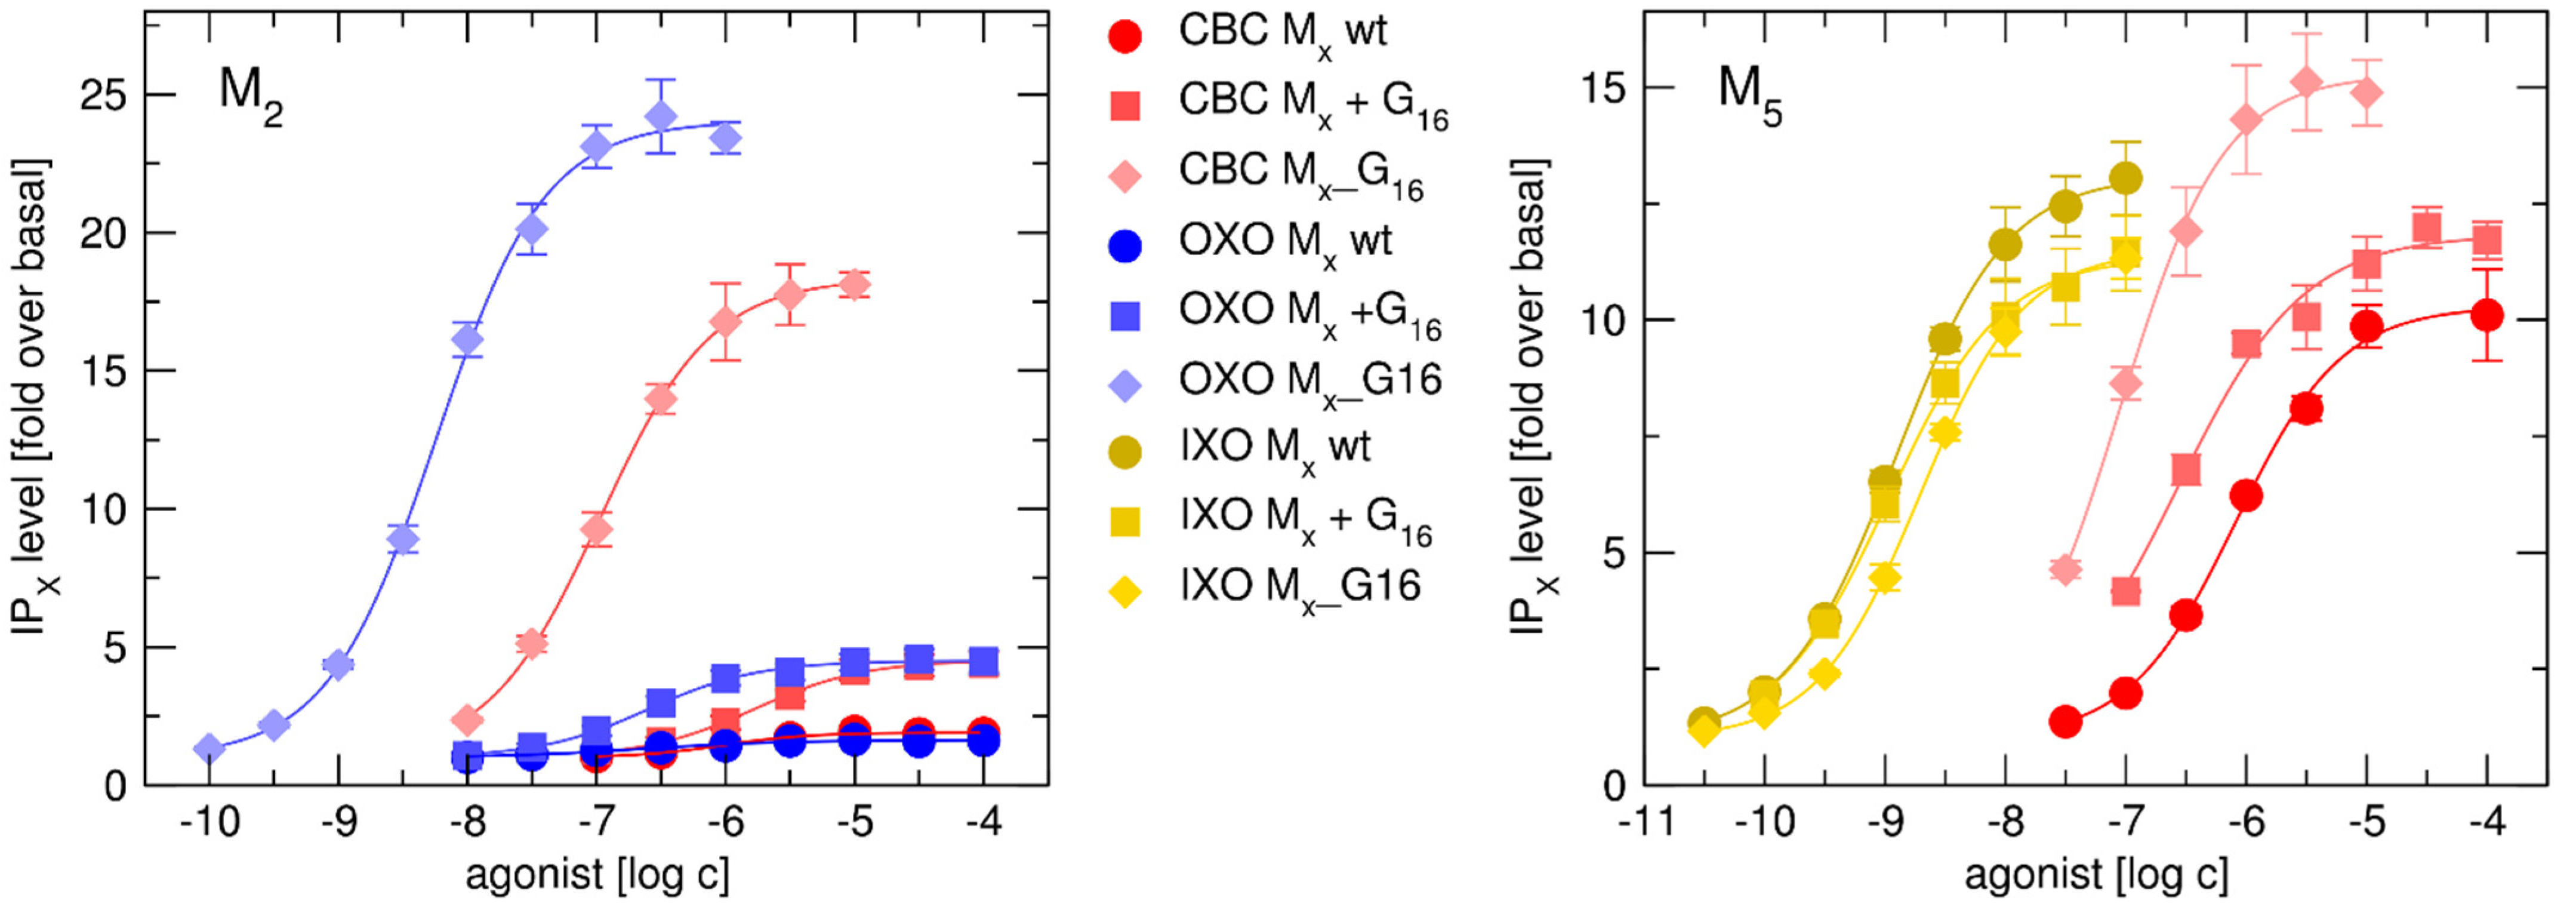
2.3.2. Functional Response of Gα16_Fused Muscarinic Receptors to Agonists

The fusion with non-canonical promiscuous G-protein Gα16 couples all subtypes of muscarinic receptors to phospholipase C-activation and generation of IPX. The level of IPX was measured by radio-chromatographic separation. Basal level (in absence of agonist) varied in range of 2–3% of incorporated radioactivity and was the same in cells expressing wt and individual fused receptors. Level of IPX in presence of individual concentrations of tested agonists was calculated as fold over basal level. Parameters of accumulation of IPX as a functional response of fused proteins to stimulation by a tested agonist, EC50 and E′MAX, are summarized in (Supplementary Materials Table S3). To calculate the coefficient of operational efficacy τ of functional response of individual Gα16_fused receptors to tested agonists, the system EMAX was determined from functional responses to the agonists carbachol, oxotremorine, and pilocarpine according to the procedure described recently [31]. Then, the τ value was used for the calculation of the equilibrium dissociation constant KA. The values of τ and KA calculated according to Equation (6) are summarized in Table 2.
Gi/o-biased muscarinic partial agonists JR6 and JR7 did not stimulate the accumulation of IPX at any fused protein. Although fusion with Gα16 led to an increase in the affinity of JR6 to all fusion proteins, JR6 and JR7 induced conformation incompatible with activation of the Gα16 signaling pathway. Except for JR6 and JR7, all tested agonists stimulated accumulation of IPx at all Gα16_fused receptors.
Quantification of Agonist Bias towards Individual Gα16 Fused Receptors.
To compare agonist specific activation of G16 mediated pathway among individual muscarinic subtypes and to quantify agonist bias towards individual Gα16_fused receptors, intrinsic activities relative to carbachol (RAi) were calculated according to Equation (8) from the E´MAX and EC50 values of accumulation of inositol phosphates (Supplementary Materials Table S3). Values of RAi are summarized in Table 2 and plotted in Figure 3. Interestingly, M2 super-agonist iperoxo [32,33] displayed a strong bias to M3_Gα16 over the rest of the subtypes. Iperoxo RAi values for other Gα16_fused receptors were two (M2) to 20-fold (M4) lower. On the other hand, N-desmethylclozapine, considered as M1 preferring agonist [34] displayed bias to M1_Gα16 and M3_Gα16 over the rest of the subtypes. The most pronounced bias was found in the case of McN-A-343. The RAi for M2_Gα16 was more than 30-times higher than RAi for M3_Gα16. On the other hand, signaling profiles to individual Gα16_fused receptors of ligands like xanomeline, oxotremorine, pilocarpine were almost balanced. The majority of agonists (arecoline, furmethide, McN-A-343, pilocarpine, xanomeline, and oxotremorine) displayed bias to M2_Gα16. RAi of arecoline decreases in order M2 > M4 ≈ M3 > M5 > M1, RAi of furmethide in order M2 > M5 ≈ M4 > M1 > M3, McN-A-343 M2 > M4 > M5 > M1 > M3, pilocarpine M2 > M5 > M3 ≈ M1 > M4, xanomeline M2 > M5 > M4 > M1 > M3, and oxotremorine M2 > M5 > M1 ≈ M3 > M4. The same results were obtained using quantification of signaling bias by calculation of bias factor10∆∆log(τ/KA) introduced by Kenakin et al., 2012 [35] (Supplementary Material Table S4, Figure S1). The variability in bias among agonists eliminates the possibility that protein fusion introduced a bias towards some of the receptors.
Functional Response of Gα16_Fused, Gα16 co-Transfected Receptors, and wt Receptors to Selected Agonists.
We analyzed activation of IPX pathway by agonist carbachol, oxotremorine, and iperoxo at Gα16_fused receptors, receptors co-transfected with Gα16-subunit and wt M2 and M5 receptor (Figure 4, Table 3).
Agonist induced coupling with Gα16: Data show better coupling of Gα16 fused M2 receptor in comparison to the co-transfected system for carbachol and oxotremorine. At IPX pathway, the value of equilibrium dissociation constant expressed as the negative logarithm (pKA) for reference agonist carbachol as well as tested agonist oxotremorine, was higher at Gα16_fused receptors than at M2 receptors co-transfected with Gα16 (Table 3), indicating a better coupling in the case of the fusion protein. The better coupling to G16 at fused receptors M1_Gα16 through M5_Gα16 than at co-transfected variants is obvious also from comparison of (Table 2 with our previous data Randakova et al. [28]). The pKA value for reference agonist carbachol and oxotremorine, as well as pilocarpine or xanomeline, was higher at Gα16_fused receptors than at corresponding wt receptors co-transfected with Gα16. The increase in pKA ranged from 3-fold for xanomeline at M1 to 63-fold for oxotremorine at M3.
In contrast, pKA of iperoxo at the fused M5_16 was lower than at co-transfected M5+Gα16, indicating worse coupling of the fusion protein (Table 3). The high variability in the observed shift in pKA excludes a possibility of the systemic artifact caused by protein fusion.
Comparison of operational efficacies of selected agonists: In comparison to the co-transfected system M2+Gα16, the increase in operational efficacy τ of both reference agonist carbachol as well as tested agonist oxotremorine to stimulate the non-canonical accumulation of IPX at M2_Gα16 (Table 3) indicates the higher sensitivity of measurement of functional response at Gα_fused receptors. Oxotremorine had higher operational efficacy than carbachol at M2_Gα16 and M5_Gα16 (Table 2). At the rest of the Gα16_fused receptors, the operational efficacies of oxotremorine and carbachol were the same. In contrast, oxotremorine stimulated accumulation of IPX at M2 + Gα16 and M2 wt with efficacy comparable (Table 3) or lower [19] to carbachol. Operational efficacies τ of functional responses of carbachol and oxotremorine at M2_Gα16 and M2 + Gα16 (Figure 4) are summarized in Table 3. In other words, at M2_Gα16 fusion protein (where M2 receptor signals only via Gα16) oxotremorine had higher efficacy than in co-transfected system (where binding of other Gα subunits to M2 may take place) which indicates bias of oxotremorine towards Gα16 mediated pathway at M2 receptor.
Interestingly, agonist iperoxo had higher operational efficacy τ than carbachol at all Gα16_fused receptors, except M5_Gα16 (Table 2). At fused M5_Gα16, τ value of iperoxo was almost 30% lower than τ values of carbachol. At the rest of Gα16_fused receptors, τ values of iperoxo were greater than τ for carbachol, least by 40 % (M4) and most nearly 7-fold (at M2). In contrast to M5_Gα16, iperoxo stimulated accumulation of IPX at M5-wt with higher operational efficacy than carbachol. At co-transfected system M5 + Gα16, iperoxo and carbachol stimulated IPX accumulation with comparable efficacy (Figure 4, Table 3) which indicates impairment of Gα16 signaling of super-agonist iperoxo at fused M5 receptor.

3. Discussion

In this study, we show that fusion proteins of receptor and α-subunit of G-protein are a suitable tool for studying agonist bias. We demonstrate it on the example of muscarinic receptors fused with Gα16 subunit and 11 muscarinic agonists whose signaling profile (bias) varies among receptor subtypes.
Analysis of signaling bias of muscarinic receptors, concerning G-protein mediated signaling, has several pitfalls. Coupling promiscuity of muscarinic receptors leads to molecular crosstalk in downstream signaling. For example, calcium ions released upon activation of Gq/11 IPX pathway modulate some adenylate cyclases and thus cAMP signaling. In turn, βγ-dimers released from Gi/o G-proteins modulate some calcium channels and thus calcium signaling [36,37]. Moreover, signals of non-preferential pathways are usually weak, thus, highly sensitive methods are needed. The main obstacle, in the study of the non-preferential G-protein pathways, is the competition of different (mainly preferential) Gα-subunits for the binding site at a given receptor. Activation of a non-preferential G-protein pathway may play important roles in processes characterized by fluctuation in an expression of individual G-proteins or GPCRs, e.g., immune cell maturation [28], progression of cancer [38], or Parkinson´s disease [39].
Several tools including G-protein-specific pharmacological inhibitors or toxins [40], C-terminus mimicking peptides [41], small interfering RNA [42,43], using artificial systems with limited endogenous G-proteins [44,45,46] or reconstitution of purified receptors and G-proteins in the artificial membrane [47,48] limit the signal mediated by certain G-proteins. Techniques like the immunoprecipitation with specific Gα antibodies [2,49], resonance energy transfer techniques, where bioluminescent (BRET) or fluorescent (FRET) donors and acceptors are fused on the C-terminus of the GPCR and in one of the subunits of the G-protein [50,51] were used to study specific GPCR-G-protein interactions. Although these methods diminish or eliminate signaling crosstalk, they are not aimed at high sensitivity.
Receptor_Gα fusion proteins are well described to study the activation of individual G-protein mediated signaling pathways at many GPCR [21,22,23,24,25,26]. We demonstrate their use to study agonist bias at non-canonical G16 pathway among individual subtypes of muscarinic receptors. Gα16(15) is expressed only in highly specific cell types such as hematopoietic and epithelial cells [27], which are characterized by a high rate of cell turnover. Muscarinic receptors expressed in these cells appear to be involved in the regulation of diverse cellular activities including immune response [28], cell proliferation, or cell differentiation [52,53].
The engineering of receptor-transducer fusion proteins seems to be an effective strategy to target cellular effectors more efficiently and specifically [21]. Fusion proteins enable the study of signaling mediated by G-proteins up to the level of individual G-proteins isoforms. Moreover, receptor-G-protein fusion forces a 1:1 stoichiometry and ensures efficient coupling of the given receptor to an attached Gα subunit. Receptor-G-protein stoichiometry is a relevant aspect of signaling bias and should be taken into account in the screening of biased agonists [54].
We have created fusion proteins of individual muscarinic receptors (M1–M5) and non-canonical promiscuous Gα16 subunit and performed detailed binding and functional analysis of these constructs using 11 structurally different muscarinic agonists to evaluate the suitability of such fusion proteins to study agonist bias. Structurally different agonists vary in interactions in the orthosteric binding site of the muscarinic receptor [55]. The portfolio of used agonists included reference balanced full agonist carbachol, classic muscarinic agonists arecoline, furmethide, pilocarpine, oxotremorine, super-agonist iperoxo [32,33], bitopic agonists xanomeline [56], and McN-A343 [57], and Gi/o-biased agonists JR6 and JR7 [19] (Supplementary Materials Figure S2).
The use of Gα_fused receptors for analysis of signaling bias is conditioned by the full preservation of binding and functional properties of both receptor and Gα subunit. In the preparation of the construct, palmitoylation sites, at the C-terminus of the receptors [58], and the N-terminus of the Gα subunit [59], that mediate interaction with the membrane, were maintained. That is essential for keeping the native conformation of a receptor as well as G-protein. Comparison of homology models of prepared constructs M1_Gα16 and M2_Gα16 with cryo-EM structures of receptor-G-protein complexes M1 + Gα11 and M2 + Gαo [30] confirmed the natural arrangement of the receptor and Gα in fusion proteins (Figure 1). At the M1 receptor, insertion of the C-terminus of related Gα16 and Gα11 subunits into the G-protein binding site of the receptor is practically identical. On the other hand, at the M2 receptor, evolutionarily more distant Gα16 and Gαo differ in the angle at which they are inserted into the G-protein binding site. Gα-specific insertion of C-terminus into the intracellular cavity of cognate GPCR was observed in 3D structures of GPCR-G-protein complexes [30,60,61,62,63] and demonstrated using molecular dynamics (MD) as well [64]. Furthermore, the fusion of muscarinic receptors with Gα16 subunit did not affect the binding affinity of the labeled antagonist [3H]N-methylscopolamine at any fusion protein (Supplementary Materials Table S1), indicating that fusion did not markedly influence receptor conformation.
The signaling of interest can be selectively analyzed when the binding of other competing G-proteins to the receptor is excluded. We hypothesized that tight fusion of the receptor with a particular Gα subunit prevents the binding of other G-proteins. The M2 and M4 receptors preferentially inhibit cAMP synthesis via Gαi/o G-proteins and can also couple with non-preferential Gαs to activate cAMP synthesis [65,66]. In contrast to the wt M2 and M4 receptors (Figure 2), carbachol did not induce changes in cAMP level at fused M2_Gα16 and M4_Gα16 receptors, indicating no coupling to endogenous Gi/o or Gs G-proteins. It suggests that, unlike some fusion constructs [67], our directly Gα16_fused constructs indeed prevent the access of competitive Gα subunits to the receptor.
The binding analysis has shown that in contrast to wild-type (wt) receptors, at Gα16_fused constructs, almost all tested agonists displayed only low-affinity binding. G-protein binding to a receptor might, in turn, allosterically influence ligand binding [68,69]. The absence of high-affinity binding of most agonists to Gα16_fused receptors may be either due to lack of pre-coupling of Gα16 to the receptor or receptor is pre-coupled Gα16 that binds GDP [43]. Since the decrease in the value of equilibrium dissociation constant (KA) of agonists at Gα16_fused receptors in comparison to wt receptor co-expressed with Gα16 (Table 3, Table 2 versus our previous data [28]) indicates pre-coupling, the absence of high-affinity binding indicates pre-coupling Gα16 that binds GDP [43].
G16 G-protein is efficiently capable to couple all muscarinic subtypes (M1–M5) via phospholipase C activation (IPX accumulation). Thus, it may be possible to analyze the activation of all muscarinic subtypes using one assay (measurement of the accumulation of inositol phosphates, IPX) and demonstrate agonist-specific activation of this pathway. Signaling bias among individual Gα16_fused receptors was calculated from relative intrinsic activities RAi to reference agonist carbachol [70] (Table 2). RAi values can be easily calculated for several pathways and many ligands and quickly compared. In principle, for a single signaling pathway and two or more receptors, a ligand that has greater RAi at one receptor than at other(s) is biased to a given pathway at that receptor. Additionally, we analyzed our data also by conventionally used bias factor [35]. Data are summarized in (Supplementary Materials Table S4) and plotted (Supplementary Materials Figure S1). Quantification of agonist bias obtained by both ways was the same, showing that a quick comparison of RAi factors is sufficient and that analysis was conducted correctly. Presented data demonstrate differences in the pattern of the Gα16 pathway activation at five subtypes of Gα16_fused muscarinic receptors after stimulation by structurally different agonists. It points to variations in the compatibility of agonist-specific conformations with Gα16 coupling and activation. While some agonists have quite balanced Gα16 pathway activation patterns—such as pilocarpine, oxotremorine, or xanomeline—profound bias towards individual Gα16_fused muscarinic receptors was observed for agonists McN-A-343 (towards M2_Gα16) and iperoxo (towards M3_Gα16). McN-A343 is a bitopic agonist, capable of stimulating the Gq pathway while incapable of stimulating Gs at M1 expressed in CHO cells [64]. We have shown that McN-A343 successfully activates G16 pathway at all muscarinic subtypes with a bias towards M2. Interestingly, M2 super-agonist iperoxo displayed bias towards M3_Gα16 over other Gα16_fused receptors. It was demonstrated that iperoxo-based dualsteric compounds exert bias Gi/o over Gs pathway at M2 [71] but exert bias to Gq/11 over Gi/o signaling at the M1 receptor [72]. On the other hand, M1-preferring agonist N-desmethylclozapine displayed bias to M1_Gα16 and M3_Gα16 over the rest of the subtypes. It points to huge variability in signaling depending on the combination of a ligand–receptor-pathway system, promising a chance to find agonists with a bias to the desired pathway at the desired receptor subtype.
Comparison of parameters of functional response of selected agonists at Gα16_fused and Gα16 cotransfected wt receptors suggest better coupling of fused Gα subunit. The better coupling of Gα16 in fusion proteins was demonstrated by a decrease in the value of equilibrium dissociation constant (KA) of agonists at Gα16_fused receptors (Table 2 vs. our previous data Randakova et al. [19], Table 3), except iperoxo at M5_Gα16 (Table 3, discussed below). The elimination of interaction with other competitive Gα subunits as well as fusion alone could lead to better coupling of fused Gα subunits. The operational equilibrium dissociation constant KA quantifies an affinity of agonist to the conformation that initiates a given signaling pathway. Thus, it can be considered as one of the coupling parameters.
Furthermore, the operational efficacy τ to stimulate the non-canonical accumulation of IPX induced both by reference agonist carbachol and tested agonist oxotremorine is higher at fusion protein M2_Gα16 than at co-transfected system M2 + Gα16 (Table 3). The better coupling (both the decrease in KA and increase in τ) indicates that the fusion protein strategy is highly sensitive and thus suitable for detection and analysis of low-efficacy pathways.
Despite the high sensitivity, we did not detect accumulation of IPx induced by Gi/o biased agonist JR6 and JR7 (Table 2) at any fused protein. These data further support the true Gi/o bias of these novel agonists and also support the suitability of these fusion systems in the analysis of signaling bias.
Our data demonstrate that oxotremorine stimulates accumulation of IPx at M2_Gα16 more efficiently in comparison with co-transfected system M2+Gα16, where the competition of endogenous Gi/o and Gq/11 occurs and more efficiently than at wt M2 via endogenous Gq/11 (Table 3). In our previous study of Randáková et al. [19], oxotremorine displayed lower RAi to stimulate the accumulation of IPX in the co-expressed system M2 + Gα16 than in the presented study. This discrepancy can be explained by different levels of expression of Gα16 in co-expressed systems and points to the advantage of using fusion proteins with 1:1 stoichiometry for easier spotting of agonist bias. In comparison with our previous data [19], oxotremorine exerts bias towards IPx accumulation (via M2_Gα16) over cAMP inhibition via Gi/o at wt M2. Signaling bias of agonist oxotremorine to G16 over Gi/o and Gq/11 pathway at M2 receptor would be hard to reveal and quantify without fusion proteins due to signaling crosstalk or could be overlooked due to competition with other G-proteins. We show that using fusion proteins for this analysis can be very practical.
Furthermore, we demonstrate impairment of Gα16 signaling of super-agonist iperoxo at the M5 receptor. Besides worse coupling (lower pKA) of iperoxo to fused M5_Gα16 (Table 3), unlike other Gα16_fused receptors, super-agonist iperoxo stimulated accumulation of IPX at M5_Gα16 with lower operational efficacy than reference agonist carbachol. In contrast at wt M5 receptors expressed in CHO cells, iperoxo stimulated accumulation of IPX through cognate Gαq/11 with higher operational efficacy than carbachol. In CHO cells expressing wt M5 co-transfected with Gα16, operational efficacy for carbachol and iperoxo was the same (Figure 4, Table 3), which could be explained by competition of Gα16 with endogenous preferential Gq/11. Combined data thus indicate incompatibility of active M5 receptor conformation specific to iperoxo with Gα16 coupling and activation.

4. Materials and Methods

4.1. Construct Preparation

Constructs containing sequences of human variants of muscarinic acetylcholine receptors M1–M5 fused with the human variant of Gα15 subunit (also known as Gα16 [73]) were prepared, and new stable cell lines of Chinese hamster ovary (CHO) expressing these fusion proteins were generated. Plasmids pcDNA3.1 coding human receptors M1–M5 and Gα16 subunit were obtained from Missouri S&T cDNA Resource Center (Rolla, MO, USA). Plasmid pCMV6-A-Hygro containing hygromycin as a mammalian selection marker was purchased from Origene (Rockville, MD, USA). The coding sequence for Gα16 subunit and subsequently sequences for M1–M5 receptors and were subcloned into the pCMV6-A-Hygro vector using restriction endonucleases. To this end, restriction site AflII at the N-terminus of the Gα16 subunit and AgeI at the C-terminus of receptor sequences were created. Both parts were connected via short GATRARS linker, corresponding to the C-terminal amino acids in the M2 sequence and N-terminal amino acid of the Gα16 subunit. Cysteines needed for palmitoylation of receptors (C435 at M1, C457 at M2, C561 at M3, C470 at M4, and C512 at M5) were preserved. Sequences of all fusion proteins are in the Supplementary Material.

4.2. Homology Modeling

Homology models of fusion proteins were constructed as hybrid models using YASARA software, Biosciences (Vienna, Austria) [74]. For M1_Gα16 fusion protein structures PDB ID: 6WJC, 5CXV, 3SN6, 6OIJ, and 6PT0 were selected by the program as templates. For M2_Gα16 fusion protein structures PDB ID: 5ZK3, 6OIK, 3SN6, 6OIJ, and 6PT0 were selected by the program as templates. Modeling parameters were set as follows:
Modeling speed: Slow.
Number of PSI-BLAST iterations in template search: 4.
Maximum allowed (PSI-)BLAST E-value to consider template: 0.5.
Maximum number of templates to be used: 5.
Maximum number of templates with the same sequence: 1.
Maximum oligomerization state: 4 (tetrameric).
Maximum number of alignment variations per template: 5.
Maximum number of conformations tried per loop: 50.
Maximum number of residues added to the termini: 10.

4.3. Molecular Dynamics

The homology model of fusion proteins and structure of M1 receptor in complex with G11 G-protein (6OIJ) were aligned on the receptor part using MUSTANG [75]. The βγ-dimer from the 6OIJ structure was added to the homology model. To evaluate the stability of homology models, conventional molecular dynamics (MD) was simulated using Desmond/GPU ver. 6.1, D. E. Shaw Research (New York, NY, USA). The simulated system consisted of a receptor–G-protein complex in 1-palmitoyl-2-oleoyl-sn-glycero-3-phosphocholine membrane set to receptor helices in water and 0.15 M NaCl. The system was first relaxed by the standard Desmond protocol for membrane proteins. Then 120 ns of NPγT (Nosé–Hoover chain thermostat at 300 K, Martyna–Tobias–Klein barostat at 1.01325 bar, isotropic coupling, Coulombic cut-off at 0.9 nm) molecular dynamics without restrains was simulated. The quality of molecular dynamics simulation was assessed by Simulation Quality Analysis tools of Maestro.

4.4. Cell Culture and Membrane Preparation

CHO-K1 cells, ATCC (Manassas, VA, USA) were transfected with the desired plasmids using Lipofectamine 3000, Invitrogen (Carlsbad, CA, USA). Subconfluent cells were washed with phosphate-buffered saline and then Opti-MEM, Life Technologies (Carlsbad, CA, USA) containing Lipofectamine at a final concentration of 5 μL/mL and plasmid DNA at a final concentration of 1 μg/mL was applied. After 48 h cells were diluted 1000-times by subculturing and hygromycin-B, Toku-E (Bellingham, WA, USA) was added at a final concentration of 200 µg/mL for selection of transfected clones. Selected clones of each construct were used up to passage 10. The expression level of fused muscarinic receptors was confirmed in radioligand binding experiments using 3H-N-methylscopolamine ([3H]NMS),ARC (ST.Louis, MO, USA). Additionally, CHO-K1 cells were also transiently co-transfected with plasmids coding muscarinic receptors and plasmid coding Gα16 subunit. For transient transfection, linear polyethyleneimine PEI 25K, Polysciences, (Hirschberg, Germany) was used. Subconfluent cells were incubated 24 h in the growth medium containing PEI at a final concentration of 2.4 μg/mL and plasmid DNA at a final concentration of 0.8 μg/mL. After 24 h, fresh medium was added, and cells were harvested 48 h after transfection.
CHO cells expressing individual Gα16_fused muscarinic receptors were grown to confluence in 75 cm2 flasks in Dulbecco’s modified EaglE′s medium supplemented with 10% fetal bovine serum, Life Technologies (Carlsbad, CA, USA). One million cells were subcultured in 100 mm Petri dishes. Cells were washed with phosphate-buffered saline and harvested by mild trypsinization for functional experiments or manually for binding experiments on day five after subculture. After harvesting cells were centrifuged for 3 min at 250× g.
Membranes from CHO cells were prepared for binding experiments. The pellets of harvested cells were suspended in the ice-cold homogenization medium (100 mM NaCl, 20 mM Na-HEPES, 10 mM EDTA, pH = 7.4) and homogenized on ice by two 30 sec strokes using a Polytron homogenizer Ultra-Turrax; Janke & Kunkel GmbH & Co. KG, IKA-Labortechnik, (Staufen, Germany) with a 30-sec pause between strokes. Cell homogenates were centrifuged for 5 min at 1000× g. The supernatant was collected and centrifuged for 30 min at 30,000× g. Pellets were suspended in the washing medium (100 mM NaCl, 10 mM MgCl2, 20 mM Na-HEPES, pH = 7.4), left for 30 min at 4 °C, and then centrifuged again for 30 min at 30,000× g. The resulting membrane pellets were kept at −80 °C until assayed.

4.5. Radioligand Binding Experiments

All radioligand binding experiments were optimized and carried out as described by El-Fakahany and Jakubik [76]. Briefly, membranes (approximately 10 μg of membrane proteins per sample) were incubated in 96-well plates for 3 h at 25 °C in the incubation medium (100 mM NaCl, 20 mM Na-HEPES,10 mM MgCl2, pH = 7.4). In the case of the M5 receptor, which has very slow kinetics of binding, the incubation time was extended to 5 h. Incubation volume for competition and saturation experiments with [3H]NMS was 400 μL or 800 μL, respectively.
In saturation experiments of binding of [3H]NMS six concentrations of the radioligand (ranging from 63 to 2000 pM) were used. Agonist binding was determined in competition experiments with 1 nM [3H]NMS. Nonspecific binding was determined in the presence of 10 μM unlabeled atropine. Incubation was terminated by filtration through Whatman GF/C glass fiber filters, Whatman (Maidstone, GB using a Brandel harvester, Brandel (Gaithersburg, MD, USA). Filters were dried in a microwave oven (3 min, 800 W), and then solid scintillator Meltilex A was melted on filters (105 °C, 90 s) using a hot plate. The filters were cooled and counted in a Microbeta scintillation counter, PerkinElmer Waltham, MA, USA).

4.6. Measurement of Production of cAMP

Agonist-induced changes in the cAMP level were analyzed at Gα16_fused M2 and M4 receptors and M2 and M4 wild types. The level of cAMP was determined in radio-chromatographical separation of [3H]-cAMP as described previously [4]. To determine levels of cAMP, cells in suspension were pre-incubated for 1 h with 0.4 μM [3H]adenine, ARC (St.Louis, MO, USA), washed, and incubated for 10 min in the presence of 1 mM isobutyl methylxanthine and 10 μM forskolin. Then about 200,000 cells per 0.8 mL of sample were incubated for 1 h with tested agonists. Incubation was ended by the addition of 0.2 mL of 2.5 M HCl to the samples. Samples were applied to alumina columns (1.5 g of alumina per column, Sigma, USA), washed with 2 mL of ammonium acetate (1 M, pH = 7.0), and eluted from columns with 4 mL of ammonium acetate and measured by liquid scintillation spectrometry. Level of cAMP was expressed in dpm (decay per minute). Data are expressed as fold over basal level (after subtraction of blank value), the bottom (basal) is equal to 1.

4.7. Accumulation of Inositol Phosphates

The functional response of Gα16_fused muscarinic receptors was measured as an agonist-stimulated accumulation of inositol phosphates (IPX) using radiochemical chromatography as described previously [4]. The assay was performed in cells in suspension. IPX was determined after separation on ion-exchange columns Dowex 1 × 8-200, Sigma (St.Louis, MO, USA). Harvested cells were resuspended in Krebs-HEPES buffer (KHB; 138 mM NaCl; 4mM KCl; 1.3 mM CaCl2; 1mM MgCl2; 1.2 mM NaH2PO4; 20 mM HEPES; 10 mM glucose; pH adjusted to 7.4) and centrifuged 250 g for 3 min. Cells were resuspended in KHB supplemented with 500 nM [3H]myo-inositol, ARC (St.Lous, MO) and incubated at 37 °C for 1 h. Then they were washed once with an excess of KHB, resuspended in KHB containing 10 mM LiCl, and incubated for 1 h at 37 °C in the presence of indicated concentrations of agonists. The total reaction volume was 800 µL. Incubation was terminated by the addition of 0.5 mL of stopping solution (chloroform: methanol: 35% HCl; 2: 1: 0.1) and placed in 4 °C for 1 h. An aliquot (0.6 mL) of the upper (aqueous) phase was taken and loaded onto ion-exchange columns. Columns were washed with 10 mL of deionized water and 20 mL of 60 mM ammonium formate/5 mM sodium borate solution. IPX were collectively eluted from columns by 4 mL of 1 M ammonium formate-0.1 M/formic acid buffer. Level of IPx is expressed in dpm (decay per minute). Data are expressed as fold over basal level (after subtraction of blank value), the bottom (basal) is equal to 1.

4.8. Used Agonists

Muscarinic agonists arecoline, carbachol furmethide, iperoxo, McN-A343, N-desmethylclozapine, oxotremorine, pilocarpine (Sigma, St.Louis, MO, USA), xanomeline (Tocris Bioscience, Bristol, UK), JR-6, and JR-7 (synthesized at Barry University, Miami Shores, FL, USA [19]) were used in this study. Structures of all used agonists are in the Supplementary Material (Figure S2).

4.9. Data and Analysis

Experiments were independent, using different seedings of CHO cells. Binding experiments were carried out in three experiments with samples in quadruplicates and functional assays were carried out at least in three experiments with samples in triplicate. Experimenters were blind to tested agonists.
After subtraction of non-specific binding (binding experiments) or background/blank values (functional experiments) data were normalized to control values determined in each experiment. IC50 and EC50 values and parameters derived from them (Ki and KA) were treated as logarithms. All data were included in the analysis, no outliers were excluded. In statistical analysis value of p < 0.05 was taken as significant for all data. In multiple comparison tests ANOVA with p < 0.05 was followed by Tukey HSD post-test (p < 0.05). Data were processed in Microsoft office, analyzed, and plotted using the program Grace. The statistic was calculated using R (www.r-project.org, accessed on 13 September 2021).

4.9.1. [3H]NMS Saturation Binding

The equilibrium dissociation constant (KD) and maximum binding capacity (BMAX) were determined in the saturation experiments. Non-specific binding in the presence of 10 µM atropine was subtracted to determine specific binding. Free concentration of [3H]NMS was calculated by subtraction of values of specific binding from the final concentration of [3H]NMS calculated from measurements of added radioactivity. Equation (1) was fitted to the data.
y = B MAX x K D + x
where y is specific binding at free concentration x. KD values are expressed as negative logarithms and BMAX values as pmol of binding sites per mg of membrane protein.

4.9.2. Competition Binding

The binding of tested agonists was determined in competition experiments with 1 nM [3H]NMS fitting of Equation (2) for one-site competition or Equation (3) for two-site competition
y = 100 100 * x x + IC 50
y = 100 ( 100 - flow ) * x x + IC 50 high flow * x x + IC 50 low
where y is specific radioligand biding at concentration x of competitor expressed as a percent of binding in the absence of a competitor, IC50 is concentration causing 50% inhibition of radioligand binding, flow is the fraction of low-affinity binding sites expressed in percents.
Inhibition constants KI for analyzed agonists were calculated as
K I = IC 50 1 + [ D ] K D
where IC50 is concentration causing 50 % inhibition of [3H]NMS binding calculated according to Equation (2) or (3) from competition binding data, [D] is the concentration of [3H]NMS used, and KD is its equilibrium dissociation constant calculated according to Equation (1) from saturation binding data. Inhibition constants KI are expressed as negative logarithms.

4.9.3. Functional Response

The potency of analyzed agonists (EC50) to induce maximal response (E′MAX) were obtained by fitting Equation (5) to the data from measurement of the accumulation of inositol phosphates,
y = 1 + ( E MAX 1 ) * x nH EC 50 nH + x nH
where y is a functional response at a concentration of tested compound x, E′MAX is the apparent maximal response to the tested compound, EC50 is concentration causing half-maximal effect and nH is slope factor (Hill coefficient). EC50 values are expressed as negative logarithms and EMAX values as folds over basal.

4.9.4. Operational Model of Functional Agonism

The operational efficacy coefficient τ [77] was determined by fitting Equation (6) to data from the functional assay.
y = E MAX * τ * x K A + ( τ + 1 ) x
where y is a functional response at a concentration of tested compound x, EMAX is the maximal response of the system, KA is the equilibrium dissociation constant. Equation (6) was fitted to data from functional experiments. Equation (6) was fitted to data by the two-step procedure described earlier [31]. In the first step, system EMAX was determined using carbachol, oxotremorine, and pilocarpine as internal standards by global fit to all data for a given receptor subtype and signaling pathway. In the second step, Equation (6) with EMAX fixed to the value determined in the first step was fitted to individual experimental data sets.

4.9.5. Relative Intrinsic Activity

For comparison of effects of agonists at different receptors fused with alpha Gα16 to IPX signaling pathways, relative intrinsic activity (RAi) was calculated according to Griffin et al. [70].
RA i = τ carbachol * K Aa τ a * K Acarbachol
where τa and KAa are half-effective concentration and apparent maximal response to the tested compound, respectively. As Hill coefficients were equal to one, RAi values were calculated according to Equation (8).
RA i = E MAXcarbachol * EC 50 a E MAXa * EC 50 carbachol
where EC50a and E′MAXa are half-effective concentration and apparent maximal response to the tested compound, respectively.

4.9.6. Signaling Bias

For receptors activating two or more signaling pathways, a ligand that has greater RAi value for one pathway than for other(s) is biased to that pathway. Analogically, for a single signaling pathway and two or more receptors, a ligand that has greater RAi at one receptor than at other(s) is biased to a given pathway at that receptor.
Analysis of signaling bias via bias factor 10∆∆log(τ/KA) introduced by Kenakin et al., 2012 [35] is summarized in Supplementary Material (Table S4; Figure S1).

5. Conclusions

The analysis of agonist bias at individual G-protein mediated pathways including non-preferential ones, plays a relevant role in the agonist screening and the development of drugs with reduced side effects that temper their clinical use. Our data showed that fusion proteins of muscarinic receptors and Gα subunits can serve as a suitable approach to analyze agonist bias and to serve as a convenient screening tool. Fusion proteins provide 1:1 receptor Gα stoichiometry, which makes quantification of agonist bias easier. We demonstrate that fusion of muscarinic receptors with Gα16 limits access of other competitive Gα subunits to the receptor. That, in turn, makes it easier to quantify signaling via the non-canonical Gα16. We demonstrated agonist-specific activation of G16 mediated pathway among individual subtypes of muscarinic receptors. We have confirmed functional selectivity of novel muscarinic agonists JR6 and JR7 for Gi/o signaling pathway [19]. Furthermore, our data revealed signaling bias of oxotremorine towards non-canonical G16 at M2 and impairment of iperoxo mediated signaling through G16, regarding Gi/o and Gq/11 for M2 and Gq/11 for M5 G-proteins.

Supplementary Materials

The Supplementary Materials are available online at https://www.mdpi.com/article/10.3390/ijms221810089/s1.

Author Contributions

Conceptualization, A.R. and J.J.; Methodology, P.Z. and A.R.; Validation, A.R. and J.J.; Formal analysis, A.R. and J.J.; Investigation, D.N., M.J.M., P.Z. and M.H.; Resources, J.B.; Data curation, A.R.; Writing—original draft preparation, A.R.; Writing—review and editing, J.J. and J.B.; Supervision, A.R.; Project administration, A.R.; Funding acquisition, A.R. All authors have read and agreed to the published version of the manuscript.

Funding

This research was funded by the Czech Science Foundation, (grant no. 19-06106Y) and by the Czech Academy of Sciences institutional support (RVO:67985823).

Institutional Review Board Statement

Not applicable.

Informed Consent Statement

Not applicable.

Acknowledgments

We would like to thank Vladimír Doležal for reading this manuscript and Dana Ungerová for technical support.

Conflicts of Interest

The authors declare no conflict of interest. The funders had no role in the design of the study; in the collection, analyses, or interpretation of data; in the writing of the manuscript, or in the decision to publish the results.

References

  1. Hermans, E. Biochemical and pharmacological control of the multiplicity of coupling at G-protein-coupled receptors. Pharmacol. Ther. 2003, 99, 25–44. [Google Scholar] [CrossRef]
  2. Jakubík, J.; El-Fakahany, E.E.; Dolezal, V. Differences in kinetics of xanomeline binding and selectivity of activation of G proteins at M(1) and M(2) muscarinic acetylcholine receptors. Mol. Pharmacol. 2006, 70, 656–666. [Google Scholar] [CrossRef] [Green Version]
  3. Masuho, I.; Ostrovskaya, O.; Kramer, G.M.; Jones, C.D.; Xie, K.; Martemyanov, K.A. Distinct profiles of functional discrimination among G proteins determine the actions of G protein-coupled receptors. Sci. Signal. 2015, 8, 1–16. [Google Scholar] [CrossRef] [Green Version]
  4. Jakubík, J.; Bačáková, L.; Lisá, V.; El-Fakahany, E.E.; Tuček, S. Activation of muscarinic acetylcholine receptors via their allosteric binding sites. Proc. Natl. Acad. Sci. USA 1996, 93, 8705–8709. [Google Scholar] [CrossRef] [Green Version]
  5. Laugwitz, K.L.; Allgeier, A.; Offermanns, S.; Spicher, K.; Van Sande, J.; Dumont, J.E.; Schultz, G. The human thyrotropin receptor: A heptahelical receptor capable of stimulating members of all four G protein families. Proc. Natl. Acad. Sci. USA 1996, 93, 116–120. [Google Scholar] [CrossRef] [PubMed] [Green Version]
  6. Peterson, Y.K.; Luttrell, L.M. The Diverse Roles of Arrestin Scaffolds in G Protein–Coupled Receptor Signaling. Pharmacol. Rev. 2017, 69, 256. [Google Scholar] [CrossRef] [Green Version]
  7. Kenakin, T.; Christopoulos, A. Signalling bias in new drug discovery: Detection, quantification and therapeutic impact. Nat. Rev. Drug Discov. 2013, 12, 205–216. [Google Scholar] [CrossRef] [Green Version]
  8. Lorenzen, E.; Ceraudo, E.; Berchiche, Y.A.; Rico, C.A.; Fürstenberg, A.; Sakmar, T.P.; Huber, T. G protein subtype–specific signaling bias in a series of CCR5 chemokine analogs. Sci. Signal. 2018, 11. [Google Scholar] [CrossRef] [Green Version]
  9. Seyedabadi, M.; Ghahremani, M.H.; Albert, P.R. Biased signaling of G protein coupled receptors (GPCRs): Molecular determinants of GPCR/transducer selectivity and therapeutic potential. Pharmacol. Ther. 2019, 200, 148–178. [Google Scholar] [CrossRef] [PubMed]
  10. Randáková, A.; Jakubík, J. Functionally selective and biased agonists of muscarinic receptors. Pharmacol. Res. 2021, 169, 105641. [Google Scholar] [CrossRef]
  11. Li, Y.Q.; Shrestha, Y.; Pandey, M.; Chen, M.; Kablan, A.; Gavrilova, O.; Offermanns, S.; Weinstein, L.S. Gq/11 α and Gs α mediate distinct physiological responses to central melanocortins. J. Clin. Investig. 2016, 126, 40–49. [Google Scholar] [CrossRef] [PubMed] [Green Version]
  12. Hur, E.M.; Kim, K.T. G protein-coupled receptor signalling and cross-talk: Achieving rapidity and specificity. Cell. Signal. 2002, 14, 397–405. [Google Scholar] [CrossRef]
  13. Denis, C.; Sauliere, A.; Galandrin, S.; Senard, J.-M.; Gales, C. Probing Heterotrimeric G Protein Activation: Applications to Biased Ligands. Curr. Pharm. Des. 2012, 18, 128–144. [Google Scholar] [CrossRef] [Green Version]
  14. Matera, C.; Tata, A. Pharmacological Approaches to Targeting Muscarinic Acetylcholine Receptors. Recent Pat. CNS Drug Discov. 2014, 9, 85–100. [Google Scholar] [CrossRef]
  15. De Angelis, F.; Maria Tata, A. Analgesic Effects Mediated by Muscarinic Receptors: Mechanisms and Pharmacological Approaches. Cent. Nerv. Syst. Agents Med. Chem. 2016, 16, 218–226. [Google Scholar] [CrossRef] [PubMed]
  16. Haga, K.; Kruse, A.C.A.; Asada, H.; Yurugi-Kobayashi, T.; Shiroishi, M.; Zhang, C.; Weis, W.I.; Okada, T.; Kobilka, B.K.; Haga, T.; et al. Structure of the human M2 muscarinic acetylcholine receptor bound to an antagonist. Nature 2012, 482, 547–551. [Google Scholar] [CrossRef] [Green Version]
  17. Kruse, A.; Hu, J.; Pan, A.; Arlow, D. Structure and dynamics of the M3 muscarinic acetylcholine receptor. Nature 2012, 482, 552–556. [Google Scholar] [CrossRef] [Green Version]
  18. Thal, D.M.; Sun, B. Crystal Structures of the M1 and M4 Muscarinic Acetylcholine Receptors. Nature 2016, 531, 335–340. [Google Scholar] [CrossRef] [Green Version]
  19. Randáková, A.; Nelic, D.; Ungerová, D.; Nwokoye, P.; Su, Q.; Doležal, V.; El-Fakahany, E.E.; Boulos, J.; Jakubík, J. Novel M2-selective, Gi-biased agonists of muscarinic acetylcholine receptors. Br. J. Pharmacol. 2020, 177, 2073–2089. [Google Scholar] [CrossRef]
  20. Downes, G.B.; Gautam, N. The G protein subunit gene families. Genomics 1999, 62, 544–552. [Google Scholar] [CrossRef]
  21. Bertin, B.; Freissmuth, M.; Jockers, R.; Strosberg, A.D.; Marullo, S. Cellular signaling by an agonist-activated receptor/G(s)α fusion protein. Proc. Natl. Acad. Sci. USA 1994, 91, 8827–8831. [Google Scholar] [CrossRef] [Green Version]
  22. Wenzel-Seifert, K.; Seifert, R. Molecular analysis of β2-adrenoceptor coupling to G(s)-, G(i)-, and G(q)-proteins. Mol. Pharmacol. 2000, 58, 954–966. [Google Scholar] [CrossRef] [PubMed]
  23. Massotte, D.; Brillet, K.; Kieffer, B.L.; Milligan, G. Agonists activate Gi1α or Gi2α fused to the human mu opioid receptor differently. J. Neurochem. 2002, 81, 1372–1382. [Google Scholar] [CrossRef]
  24. Milligan, G.; Parenty, G.; Stoddart, L.A.; Lane, J.R. Novel pharmacological applications of G-protein-coupled receptor-G protein fusions. Curr. Opin. Pharmacol. 2007, 7, 521–526. [Google Scholar] [CrossRef]
  25. Lane, J.R.; Powney, B.; Wise, A.; Rees, S.; Milligan, G. Protean agonism at the dopamine D2 receptor: (S)-3-(3-hydroxyphenyl)-N-propylpiperidine is an agonist for activation of Go1 but an antagonist/inverse agonist for Gi1, G i2, and Gi3. Mol. Pharmacol. 2007, 71, 1349–1359. [Google Scholar] [CrossRef]
  26. Suga, H.; Haga, T. Ligand screening system using fusion proteins of G protein-coupled receptors with G protein α subunits. Neurochem. Int. 2007, 51, 140–164. [Google Scholar] [CrossRef]
  27. Giannone, F.; Malpeli, G.; Lisi, V.; Grasso, S.; Shukla, P.; Ramarli, D.; Sartoris, S.; Monsurró, V.; Krampera, M.; Amato, E.; et al. The puzzling uniqueness of the heterotrimeric G15 protein and its potential beyond hematopoiesis. J. Mol. Endocrinol. 2010, 44, 259–269. [Google Scholar] [CrossRef] [Green Version]
  28. Grant, K.R.; Harnett, W.; Milligant, G. Differential G-protein expression during B- and T-cell development. Immunology 1997, 90, 564–571. [Google Scholar] [CrossRef]
  29. Giovinazzo, F.; Malpeli, G.; Zanini, S.; Parenti, M.; Piemonti, L.; Colombatti, M.; Valenti, M.T.; Dalle Carbonare, L.; Scarpa, A.; Sinnett-Smith, J.; et al. Ectopic expression of the heterotrimeric G15 protein in pancreatic carcinoma and its potential in cancer signal transduction. Cell. Signal. 2013, 25, 651–659. [Google Scholar] [CrossRef]
  30. Maeda, S.; Qu, Q.; Robertson, M.J.; Skiniotis, G.; Kobilka, B.K. Structures of the M1 and M2 muscarinic acetylcholine receptor/G-protein complexes. Science 2019, 364, 552–557. [Google Scholar] [CrossRef]
  31. Jakubík, J.; Randáková, A.; Rudajev, V.; Zimčík, P.; El-Fakahany, E.E.; Doležal, V. Applications and limitations of fitting of the operational model to determine relative efficacies of agonists. Sci. Rep. 2019, 9, 4637. [Google Scholar] [CrossRef] [Green Version]
  32. Schrage, R.; Seemann, W.K.; Klöckner, J.; Dallanoce, C.; Racké, K.; Kostenis, E.; De Amici, M.; Holzgrabe, U.; Mohr, K. Agonists with supraphysiological efficacy at the muscarinic M2 ACh receptor. Br. J. Pharmacol. 2013, 169, 357–370. [Google Scholar] [CrossRef] [PubMed] [Green Version]
  33. Schrage, R.; Holze, J.; Klöckner, J.; Balkow, A.; Klause, A.S.; Schmitz, A.L.; De Amici, M.; Kostenis, E.; Tränkle, C.; Holzgrabe, U.; et al. New insight into active muscarinic receptors with the novel radioagonist [3H]iperoxo. Biochem. Pharmacol. 2014, 90, 307–319. [Google Scholar] [CrossRef]
  34. Sur, C.; Mallorga, P.J.; Wittmann, M.; Jacobson, M.A.; Pascarella, D.; Williams, J.B.; Brandish, P.E.; Pettibone, D.J.; Scolnick, E.M.; Conn, P.J. N-desmethylclozapine, an allosteric agonist at muscarinic 1 receptor, potentiates N-methyl-D-aspartate receptor activity. Proc. Natl. Acad. Sci. USA 2003, 100, 13674–13679. [Google Scholar] [CrossRef] [Green Version]
  35. Kenakin, T.; Watson, C.; Muniz-Medina, V.; Christopoulos, A.; Novick, S. A simple method for quantifying functional selectivity and agonist bias. ACS Chem. Neurosci. 2012, 3, 193–203. [Google Scholar] [CrossRef] [PubMed] [Green Version]
  36. Antoni, F.A. Calcium regulation of adenylyl cyclase: Relevance for endocrine control. Trends Endocrinol. Metab. 1997, 8, 7–14. [Google Scholar] [CrossRef]
  37. Delmas, P.; Abogadie, F.C.; Milligan, G.; Buckley, N.J.; Brown, D.A. βγ dimers derived from G0 and G1 proteins contribute different components of adrenergic inhibition of Ca2+ channels in rat sympathetic neurones. J. Physiol. 1999, 518, 23–36. [Google Scholar] [CrossRef]
  38. Li, S.; Huang, S.; Peng, S. Bin Overexpression of G protein-coupled receptors in cancer cells: Involvement in tumor progression. Int. J. Oncol. 2005, 27, 1329–1339. [Google Scholar] [CrossRef]
  39. Corvol, J.C.; Muriel, M.P.; Valjent, E.; Féger, J.; Hanoun, N.; Girault, J.A.; Hirsch, E.C.; Hervé, D. Persistent increase in olfactory type G-protein α subunit levels may underlie D1 receptor functional hypersensitivity in Parkinson disease. J. Neurosci. 2004, 24, 7007–7014. [Google Scholar] [CrossRef] [Green Version]
  40. Campbell, A.P.; Smrcka, A.V.; Arbor, A. Targeting G protein-coupled receptor signalling by blocking G proteins. Nat. Rev. 2019, 17, 789–803. [Google Scholar] [CrossRef]
  41. Rasenick, M.M.; Watanabe, M.; Lazarevic, M.B.; Hatta, S.; Hamm, H.E. Synthetic peptides as probes for G protein function: Carboxyl-terminal Gαs peptides mimic Gs and evoke high affinity agonist binding to β-adrenergic receptors. J. Biol. Chem. 1994, 269, 21519–21525. [Google Scholar] [CrossRef]
  42. Krumins, A.M.; Gilman, A.G. Targeted knockdown of G protein subunits selectively prevents receptor-mediated modulation of effectors and reveals complex changes in non-targeted signaling proteins. J. Biol. Chem. 2006, 281, 10250–10262. [Google Scholar] [CrossRef] [Green Version]
  43. Jakubík, J.; Janíčková, H.; Randáková, A.; El-Fakahany, E.E.; Doležal, V. Subtype differences in pre-coupling of muscarinic acetylcholine receptors. PLoS ONE 2011, 6, e27732. [Google Scholar] [CrossRef] [Green Version]
  44. Barr, A.J.; Brass, L.F.; Manning, D.R. Reconstitution of receptors and GTP-binding regulatory proteins (G proteins) in Sf9 cells. A direct evaluation of selectivity in receptor-G protein coupling. J. Biol. Chem. 1997, 272, 2223–2229. [Google Scholar] [CrossRef] [PubMed] [Green Version]
  45. Houston, C.; Wenzel-Seifert, K.; Bürckstümmer, T.; Seifert, R. The human histamine H2-receptor couples more efficiently to Sf9 insect cell Gs-proteins than to insect cell Gq-proteins: Limitations of Sf9 cells for the analysis of receptor/Gq-protein coupling. J. Neurochem. 2002, 80, 678–696. [Google Scholar] [CrossRef] [PubMed]
  46. Uustare, A.; Näsman, J.; Åkerman, K.E.O.; Rinken, A. Characterization of M2 muscarinic receptor activation of different G protein subtypes. Neurochem. Int. 2004, 44, 119–124. [Google Scholar] [CrossRef]
  47. Parker, E.M.; Kameyama, K.; Higashijima, T.; Ross, E.M. Reconstitutively active G protein-coupled receptors purified from baculovirus-infected insect cells. J. Biol. Chem. 1991, 266, 519–527. [Google Scholar] [CrossRef]
  48. Heitz, F.; McClue, S.J.; Harris, B.A.; Guenet, C. Expression of human M2 muscarinic receptors in Sf9 cells: Characterisation and reconstitution with G-proteins. J. Recept. Signal Transduct. Res. 1995, 15, 55–70. [Google Scholar] [CrossRef] [PubMed]
  49. DeLapp, N.W. The antibody-capture [35S]GTPγS scintillation proximity assay: A powerful emerging technique for analysis of GPCR pharmacology. Trends Pharmacol. Sci. 2004, 25, 400–401. [Google Scholar] [CrossRef]
  50. Galés, C.; Rebois, R.V.; Hogue, M.; Trieu, P.; Breit, A.; Hébert, T.E.; Bouvier, M. Real-time monitoring of receptor and G-protein interactions in living cells. Nat. Methods 2005, 2, 177–184. [Google Scholar] [CrossRef]
  51. Hein, P.; Frank, M.; Hoffmann, C.; Lohse, M.J.; Bünemann, M. Dynamics of receptor/G protein coupling in living cells. EMBO J. 2005, 24, 4106–4114. [Google Scholar] [CrossRef] [Green Version]
  52. Wessler, I.; Kilbinger, H.; Bittinger, F.; Unger, R.; Kirkpatrick, C.J. The non-neuronal cholinergic system in humans: Expression, function and pathophysiology. Life Sci. 2003, 72, 2055–2061. [Google Scholar] [CrossRef]
  53. Pereira, A.; McLaren, A.; Bell, W.R.; Copolov, D.; Dean, B. Potential clozapine target sites on peripheral hematopoietic cells and stromal cells of the bone marrow. Pharmacogenom. J. 2003, 3, 227–234. [Google Scholar] [CrossRef] [Green Version]
  54. Onfroy, L.; Galandrin, S.; Pontier, S.M.; Seguelas, M.H.; N’Guyen, D.; Sénard, J.M.; Galés, C. G protein stoichiometry dictates biased agonism through distinct receptor-G protein partitioning. Sci. Rep. 2017, 7, 7885. [Google Scholar] [CrossRef] [Green Version]
  55. Randáková, A.; Dolejší, E.; Rudajev, V.; Zimčík, P.; Doležal, V.; El-Fakahany, E.E.; Jakubík, J. Classical and atypical agonists activate M1 muscarinic acetylcholine receptors through common mechanisms. Pharmacol. Res. 2015, 97, 27–39. [Google Scholar] [CrossRef] [Green Version]
  56. Jakubík, J.; Tuek, S.; El-Fakahany, E.E. Allosteric modulation by persistent binding of xanomeline of the interaction of competitive ligands with the M1 muscarinic acetylcholine receptor. J. Pharmacol. Exp. Ther. 2002, 301, 1033–1041. [Google Scholar] [CrossRef] [Green Version]
  57. Valant, C.; Gregory, K.J.; Hall, N.E.; Scammells, P.J.; Lew, M.J.; Sexton, P.M.; Christopoulos, A. A novel mechanism of G protein-coupled receptor functional selectivity: Muscarinic partial agonist McN-A-343 as a bitopic orthosteric/allosteric ligand. J. Biol. Chem. 2008, 283, 29312–29321. [Google Scholar] [CrossRef] [PubMed] [Green Version]
  58. Hayashi, M.K.; Haga, T. Palmitoylation of muscarinic acetylcholine receptor m2 subtypes: Reduction in their ability to activate G proteins by mutation of a putative palmitoylation site, cysteine 457, in the carboxyl-terminal tail. Arch. Biochem. Biophys. 1997, 340, 376–382. [Google Scholar] [CrossRef]
  59. Chen, C.A.; Manning, D.R. Regulation of G proteins by covalent modification. Oncogene 2001, 20, 1643–1652. [Google Scholar] [CrossRef] [PubMed] [Green Version]
  60. Rasmussen, S.G.F.; DeVree, B.T.; Zou, Y.; Kruse, A.C.; Chung, K.Y.; Kobilka, T.S.; Thian, F.S.; Chae, P.S.; Pardon, E.; Calinski, D.; et al. Crystal structure of the β2 adrenergic receptor-Gs protein complex. Nature 2011, 477, 549–555. [Google Scholar] [CrossRef] [Green Version]
  61. Draper-Joyce, C.J.; Khoshouei, M.; Thal, D.M.; Liang, Y.L.; Nguyen, A.T.N.; Furness, S.G.B.; Venugopal, H.; Baltos, J.A.; Plitzko, J.M.; Danev, R.; et al. Structure of the adenosine-bound human adenosine A1 receptor-Gi complex. Nature 2018, 558, 559–565. [Google Scholar] [CrossRef]
  62. García-Nafría, J.; Tate, C.G. Cryo-EM structures of GPCRs coupled to Gs, Gi and Go. Mol. Cell. Endocrinol. 2019, 488, 1–13. [Google Scholar] [CrossRef]
  63. Koehl, A.; Hu, H.; Maeda, S.; Zhang, Y.; Qu, Q.; Paggi, J.M.; Latorraca, N.R.; Hilger, D.; Dawson, R.; Matile, H.; et al. Structure of the μ-opioid receptor-Gi protein complex. Nature 2018, 558, 547–552. [Google Scholar] [CrossRef]
  64. Gurwitz, D.; Haring, R.; Heldman, E.; Fraser, C.M.; Manor, D.; Fisher, A. Discrete activation of transduction pathways associated with acetylcholine m1 receptor by several muscarinic ligands. Eur. J. Pharmacol. Mol. Pharmacol. 1994, 267, 21–31. [Google Scholar] [CrossRef]
  65. Burford, N.T.; Tobin, A.B.; Nahorski, S.R. Differential coupling of m1, m2 and m3 muscarinic receptor subtypes to inositol 1,4,5-trisphosphate and adenosine 3′,5′-cyclic monophosphate accumulation in Chinese hamster ovary cells. J. Pharmacol. Exp. Ther. 1995, 274, 134–142. [Google Scholar] [PubMed]
  66. Michal, P.; El-Fakahany, E.E.; Dolezal, V. Muscarinic M2 receptors directly activate Gq/11 and Gs G-proteins. J. Pharmacol. Exp. Ther. 2007, 320, 607–614. [Google Scholar] [CrossRef] [Green Version]
  67. Burt, A.R.; Sautel, M.; Wilson, M.A.; Rees, S.; Wise, A.; Milligan, G. Agonist occupation of an alpha2A-adrenoreceptor-Gi1alpha fusion protein results in activation of both receptor-linked and endogenous Gi proteins. Comparisons of their contributions to GTPase activity and signal transduction and analysis of receptor-G prot. J. Biol. Chem. 1998, 273, 10367–10375. [Google Scholar] [CrossRef] [PubMed] [Green Version]
  68. Jakubík, J.; Janíčková, H.; El-Fakahany, E.E.; Doležal, V. Negative cooperativity in binding of muscarinic receptor agonists and GDP as a measure of agonist efficacy. Br. J. Pharmacol. 2011, 162, 1029–1044. [Google Scholar] [CrossRef] [PubMed] [Green Version]
  69. Devree, B.T.; Mahoney, J.P.; Vélez-Ruiz, G.A.; Rasmussen, S.G.F.; Kuszak, A.J.; Edwald, E.; Fung, J.J.; Manglik, A.; Masureel, M.; Du, Y.; et al. Allosteric coupling from G protein to the agonist-binding pocket in GPCRs. Nature 2016, 535, 182–186. [Google Scholar] [CrossRef] [Green Version]
  70. Griffin, M.T.; Figueroa, K.W.; Liller, S.; Ehlert, F.J. Estimation of agonist activity at g protein-coupled receptors: Analysis of M2 muscarinic receptor signaling through Gi/o, G s, and G15. J. Pharmacol. Exp. Ther. 2007, 321, 1193–1207. [Google Scholar] [CrossRef] [PubMed] [Green Version]
  71. Bermudez, M.; Bock, A.; Krebs, F.; Holzgrabe, U.; Mohr, K.; Lohse, M.J.; Wolber, G. Ligand-Specific Restriction of Extracellular Conformational Dynamics Constrains Signaling of the M2 Muscarinic Receptor. ACS Chem. Biol. 2017, 12, 1743–1748. [Google Scholar] [CrossRef]
  72. Holze, J.; Bermudez, M.; Pfeil, E.M.; Kauk, M.; Bödefeld, T.; Irmen, M.; Matera, C.; Dallanoce, C.; De Amici, M.; Holzgrabe, U.; et al. Ligand-Specific Allosteric Coupling Controls G-Protein-Coupled Receptor Signaling. ACS Pharmacol. Transl. Sci. 2020, 3, 859–867. [Google Scholar] [CrossRef] [PubMed]
  73. Amatruda, T.T.; Steele, D.A.; Slepak, V.Z.; Simon, M.I. Gα16, a G protein α subunit specifically expressed in hematopoietic cells. Proc. Natl. Acad. Sci. USA 1991, 88, 5587–5591. [Google Scholar] [CrossRef] [Green Version]
  74. Krieger, E.; Joo, K.; Lee, J.; Lee, J.; Raman, S.; Thompson, J.; Tyka, M.; Baker, D.; Karplus, K. Improving physical realism, stereochemistry, and side-chain accuracy in homology modeling: Four approaches that performed well in CASP8. Proteins Struct. Funct. Bioinforma. 2009, 77, 114–122. [Google Scholar] [CrossRef] [Green Version]
  75. Konagurthu, A.S.; Whisstock, J.; Stuckey, P.J. Progressive multiple alignment using sequence triplet optimizations and three-residue exchange costs. J. Bioinform. Comput. Biol. 2004, 2, 719–745. [Google Scholar] [CrossRef]
  76. El-Fakahany, E.E.; Jakubik, J. Radioligand Binding at Muscarinic Receptors. In Neuromethods; Myslivecek, J., Jakubík, J., Eds.; Humana Press Inc.: Totowa, NJ, USA, 2016; Volume 107, pp. 37–68. [Google Scholar]
  77. Black, J.W.; Leff, P. Operational models of pharmacological agonism. Proc. R. Soc. Lond.-Biol. Sci. 1983, 220, 141–162. [Google Scholar] [CrossRef]
Figure 1. Comparison of homology models of fusion proteins with cryo-EM structures of receptor-G-protein complexes. Comparison of homology models of M1_Gα16 (upper, blue_cyan) and M2_Gα16 (lower, blue_cyan) fusion proteins with cryo-EM structures of M1 receptor in an active conformation induced by iperoxo (upper, pink) in complex with Gα11 (upper, yellow) (6OIJ) and M2 receptor in an active conformation induced by iperoxo (lower, pink) in complex with GαoA (lower, yellow) (6OIK) as viewed TM4 and TM5 (left) or TM6 and TM7 (right) in front. Complexes of βγ-subunits of G-proteins from cryo-EM structures are shown in grey. Structures were aligned on the receptor molecule. Details of insertion of C-terminus of α-subunit into G-protein binding site of the receptor are enlarged in the insets.
Ijms 22 10089 g001
Figure 2. Carbachol-stimulated changes in the cAMP level. Changes in the forskolin-stimulated level of cAMP were measured at CHO cells expressing wt (squares) or Gα16_fused (circles) M2 (red) and M4 (blue) receptors after stimulation by increasing concentration of carbachol. Data are expressed as fold over the basal level of cAMP (in absence of carbachol). Basal level of cAMP was determined in presence of 10 µM forskolin and is equal to 1. Data are means ± SD from three independent experiments performed in triplicate.
Ijms 22 10089 g002
Figure 3. Polar plot of relative intrinsic activity RAi. Intrinsic activities of individual agonists relative to reference agonist carbachol (RAi) calculated according to Equation (8) from the measurement of the accumulation of inositol phosphates are plotted. Values are expressed as ratios of RAi to RAi at receptor with the lowest activity for given agonist (Arecoline M1; Furmethide, McN-A-343, Xanomeline M3; NDMC, Oxotremorine, Iperoxo, Pilocarpine M4).
Ijms 22 10089 g003
Figure 4. Comparison of functional response of M2 and M5 receptor variants to agonists. Accumulation of inositol phosphates (IPx) induced by increasing concentration of agonists carbachol (CBC-red), oxotremorine(OXO-blue), or iperoxo (IXO-yellow) in CHO cells expressing wt (circles), Gα16 subunit co-transfected (diamonds) or Gα16_fused (squares) M2 (left graph) and M5 (right graph) receptors. Data are expressed as folds over the basal level (in absence of agonist) and bottom is equal to 1. Data are means ± SD from three independent experiments performed in triplicate.
Ijms 22 10089 g004
Table 1. Affinities of muscarinic agonists to Gα16_fused receptors Affinities of muscarinic agonists are expressed as negative logarithms of inhibition constants (KI) of [3H]NMS binding to individual subtypes of muscarinic receptors fused with Gα16-subunit. They were calculated according to Equation (4) from IC50 values obtained by fitting Equation (2) or (3) to data from competition experiments with [3H]NMS. Values are means ± SD from three independent experiments performed in quadruplicates.
M1_Gα16M2_Gα16M3_Gα16M4_Gα16M5_Gα16
Arecoline5.19 ± 0.064.68 ± 0.035.17 ± 0.084.68 ± 0.015.16 ± 0.04
Carbachol4.87 ± 0.014.62 ± 0.014.77 ± 0.024.61 ± 0.024.72 ± 0.01
Furmethide5.79 ± 0.014.69 ± 0.045.27 ± 0.034.71 ± 0.015.25 ± 0.02
Iperoxo (high)8.35 ± 0.12n.d.n.d.n.d.n.d.
Iperoxo (low)6.20 ± 0.085.83 ± 0.036.06 ± 0.045.96 ± 0.036.99 ± 0.02
McN-A-3434.24 ± 0.046.54 ± 0.045.14 ± 0.026.41 ± 0.025.34 ± 0.06
NDMC7.06 ± 0.016.51 ± 0.046.75 ± 0.026.40 ± 0.016.77 ± 0.03
Oxotremorine6.61 ± 0.015.70 ± 0.046.24 ± 0.035.86 ± 0.026.16 ± 0.03
Pilocarpine5.26 ± 0.024.52 ± 0.014.92 ± 0.024.54 ± 0.034.88 ± 0.04
Xanomeline7.29 ± 0.016.82 ± 0.027.19 ± 0.047.04 ± 0.037.06 ± 0.02
JR-6 (high)n.d.n.d.n.d.6.73 ± 0.28n.d.
JR-6 (low)4.97 ± 0.075.74 ± 0.105.07 ± 0.045.29 ± 0.215.44 ± 0.05
JR-74.34 ± 0.055.17 ± 0.074.22 ± 0.064.82 ± 0.034.46 ± 0.04
n.d., not determined.
Table 2. Parameters of functional response of Gα16_fused receptors. Operational efficacy τ, agonist equilibrium dissociation constant KA, and agonist relative intrinsic activity RAi were calculated according to Equations (6)–(8), respectively, from parameters of functional response EC50 and E´MAX (Supplementary Material, Table S3) obtained by fitting Equation (5) to data from measurement of the accumulation of inositol phosphates. Values of system EMAX are (27.1 ± 0.5 for M1_Gα16; 30.7 ± 0.603 for M2_Gα16; 27.1 ± 0.6 for M3_Gα16; 27.1 ± 1.2 for M4_Gα16; and 28.9 ± 0.4 for M5_Gα16). KA is expressed as negative logarithms. Values are means ± SD from three independent experiments performed in triplicate.
ArecolineCarbacholFurmethideIperoxoMcN-A343NDMCOxotremorinePilocarpineXanomelineJR6JR7
M1_G16τ0.594±0.0570.887±0.0170.655±0.0051.577±0.0550.472±0.020.5±0.0090.869±0.0270.668±0.040.795±0.00700
pKA6.68±0.016.8±0.066.3±0.038.24±0.036.53±0.17.43±0.057.82±0.056.29±0.028.25±0.02n.c.n.c.
RAi0.45±0.0251±0.010.234±0.00145.9±0.90.248±0.0062.4±0.02 *10.3±0.20.234±0.00825±0.100
M2_G16τ1.566±0.0381.41±0.0281.669±0.0349.61±0.2271.033±0.0210.951±0.0162.799±0.0810.946±0.021.669±0.03400
pKA6.73±0.066.6±0.066.18±0.037.62±0.086.68±0.046.7±0.027.64±0.086.39±0.028.15±0.03n.c.n.c.
RAi1.47±0.02 *1±0.010.446±0.005 *71.3±10.875±0.010 *0.846±0.00821.4±0.4 *0.407±0.005 *41.9±0.5 *00
M3_G16τ0.541±0.0040.918±0.020.656±0.0092.926±0.8760.307±0.0460.497±0.0030.834±0.0270.697±0.0390.777±0.02200
pKA7.1±0.016.8±0.085.95±0.318.56±0.15.81±0.137.43±0.067.84±0.056.31±0.018.25±0.03n.c.n.c.
RAi1.05±01±0.010.102±0.001176±30 *0.028±0.0022.35±0.0110±0.20.247±0.00823.8±0.400
M4_G16τ0.804±0.0710.897±0.040.865±0.0841.273±0.0550.704±0.070.623±0.050.994±0.0490.557±0.0540.866±0.08400
pKA7.19±0.047.1±0.016.64±0.017.87±0.036.93±0.026.8±0.027.95±0.016.47±0.018.59±0.01n.c.n.c.
RAi1.11±0.061±0.030.33±0.0188.26±0.210.523±0.030.346±0.0167.76±0.220.144±0.00829.6±1.700
M5_G16τ0.51±0.0051.126±0.0151.072±0.010.825±0.0310.358±0.0090.709±0.0091.555±0.0160.8±0.0231.172±0.01500
pKA7.02±0.146.7±0.026.25±0.038.46±0.146.96±0.117.07±0.037.72±0.036.34±0.018.2±0.01n.c.n.c.
RAi0.76±0.0051±0.010.336±0.00235±10.452±0.0061.47±0.0114.5±0.10.309±0.00533±0.200
n.c., not calculated; *, greater than at other subtypes (p < 0.05, according to ANOVA and Tukey-HSD post-test).
Table 3. Comparison of parameters of functional response of variants of M2 and M5 receptor. Parameters of agonist-induced functional response EC50 and E´MAX were obtained by fitting Equation (6) to data from measurement of the accumulation of inositol phosphates. Operational efficacy τ, agonist equilibrium dissociation constant KA and agonist relative intrinsic activity RAi were calculated according to Equations (6)–(8), respectively. EC50 and KA are expressed as negative logarithms. Values of system EMAX are (30.7 ± 0.603 for M2_Gα16; 29 ± 3 for M5_Gα16; 5.8 ± 0.4 for M2 + Gα16; 21 ± for M5 + Gα16; 5.5 ± 0.4 for wt M2; 22 ± 2 for wt M5). Values are means ± SD from 3 independent experiments performed in triplicate.
pEC50E′MAXτpKARAi
M2+Gα16carbachol5.59±0.124.62±0.370.88±0.175.52±0.17 1±0.03
oxotremorine6.53±0.134.46±0.330.85±0.156.26±0.10 5.41±0.05
M2_Gα16carbachol6.99±0.0618±0.41.41±0.036.6±0.061±0.01
oxotremorine8.22±0.0822.4±0.6 *2.8±0.08 *7.64±0.0821.4±0.4
M2 wtcarbachol6.01±0.041.91±0.070.2±0.15.9±0.11±0.01
oxotremorine6.68±0.051.60±0.050.2±0.16.6±0.13.08±0.28
M5+Gα16carbachol6.61±0.0811.7±0.40.814±0.036.35±0.08 1±0.02
iperoxo8.95±0.1411.4±0.80.785±0.0578.7±0.14 213±9
M5_Gα16carbachol7.03±0.0215.3±0.21.126±0.0156.7±0.021±0.01
iperoxo8.72±0.1411.3±0.4 *0.825±0.031 *8.46±0.1435±1
M5 wtcarbachol6.09±0.1610.1±1.10.68±0.0775.86±0.161±0.06
iperoxo8.93±0.1613±1.1 *1.08±0.09 *8.61±0.16912±45
*, different from carbachol (p < 0.05), different from fusion protein (p < 0.05), according to ANOVA and Tukey HSD post-test.
Publisher’s Note: MDPI stays neutral with regard to jurisdictional claims in published maps and institutional affiliations.

