
BGP-15 Inhibits Hyperglycemia-Aggravated VSMC Calcification Induced by High Phosphate

 ,
,  , and
, and 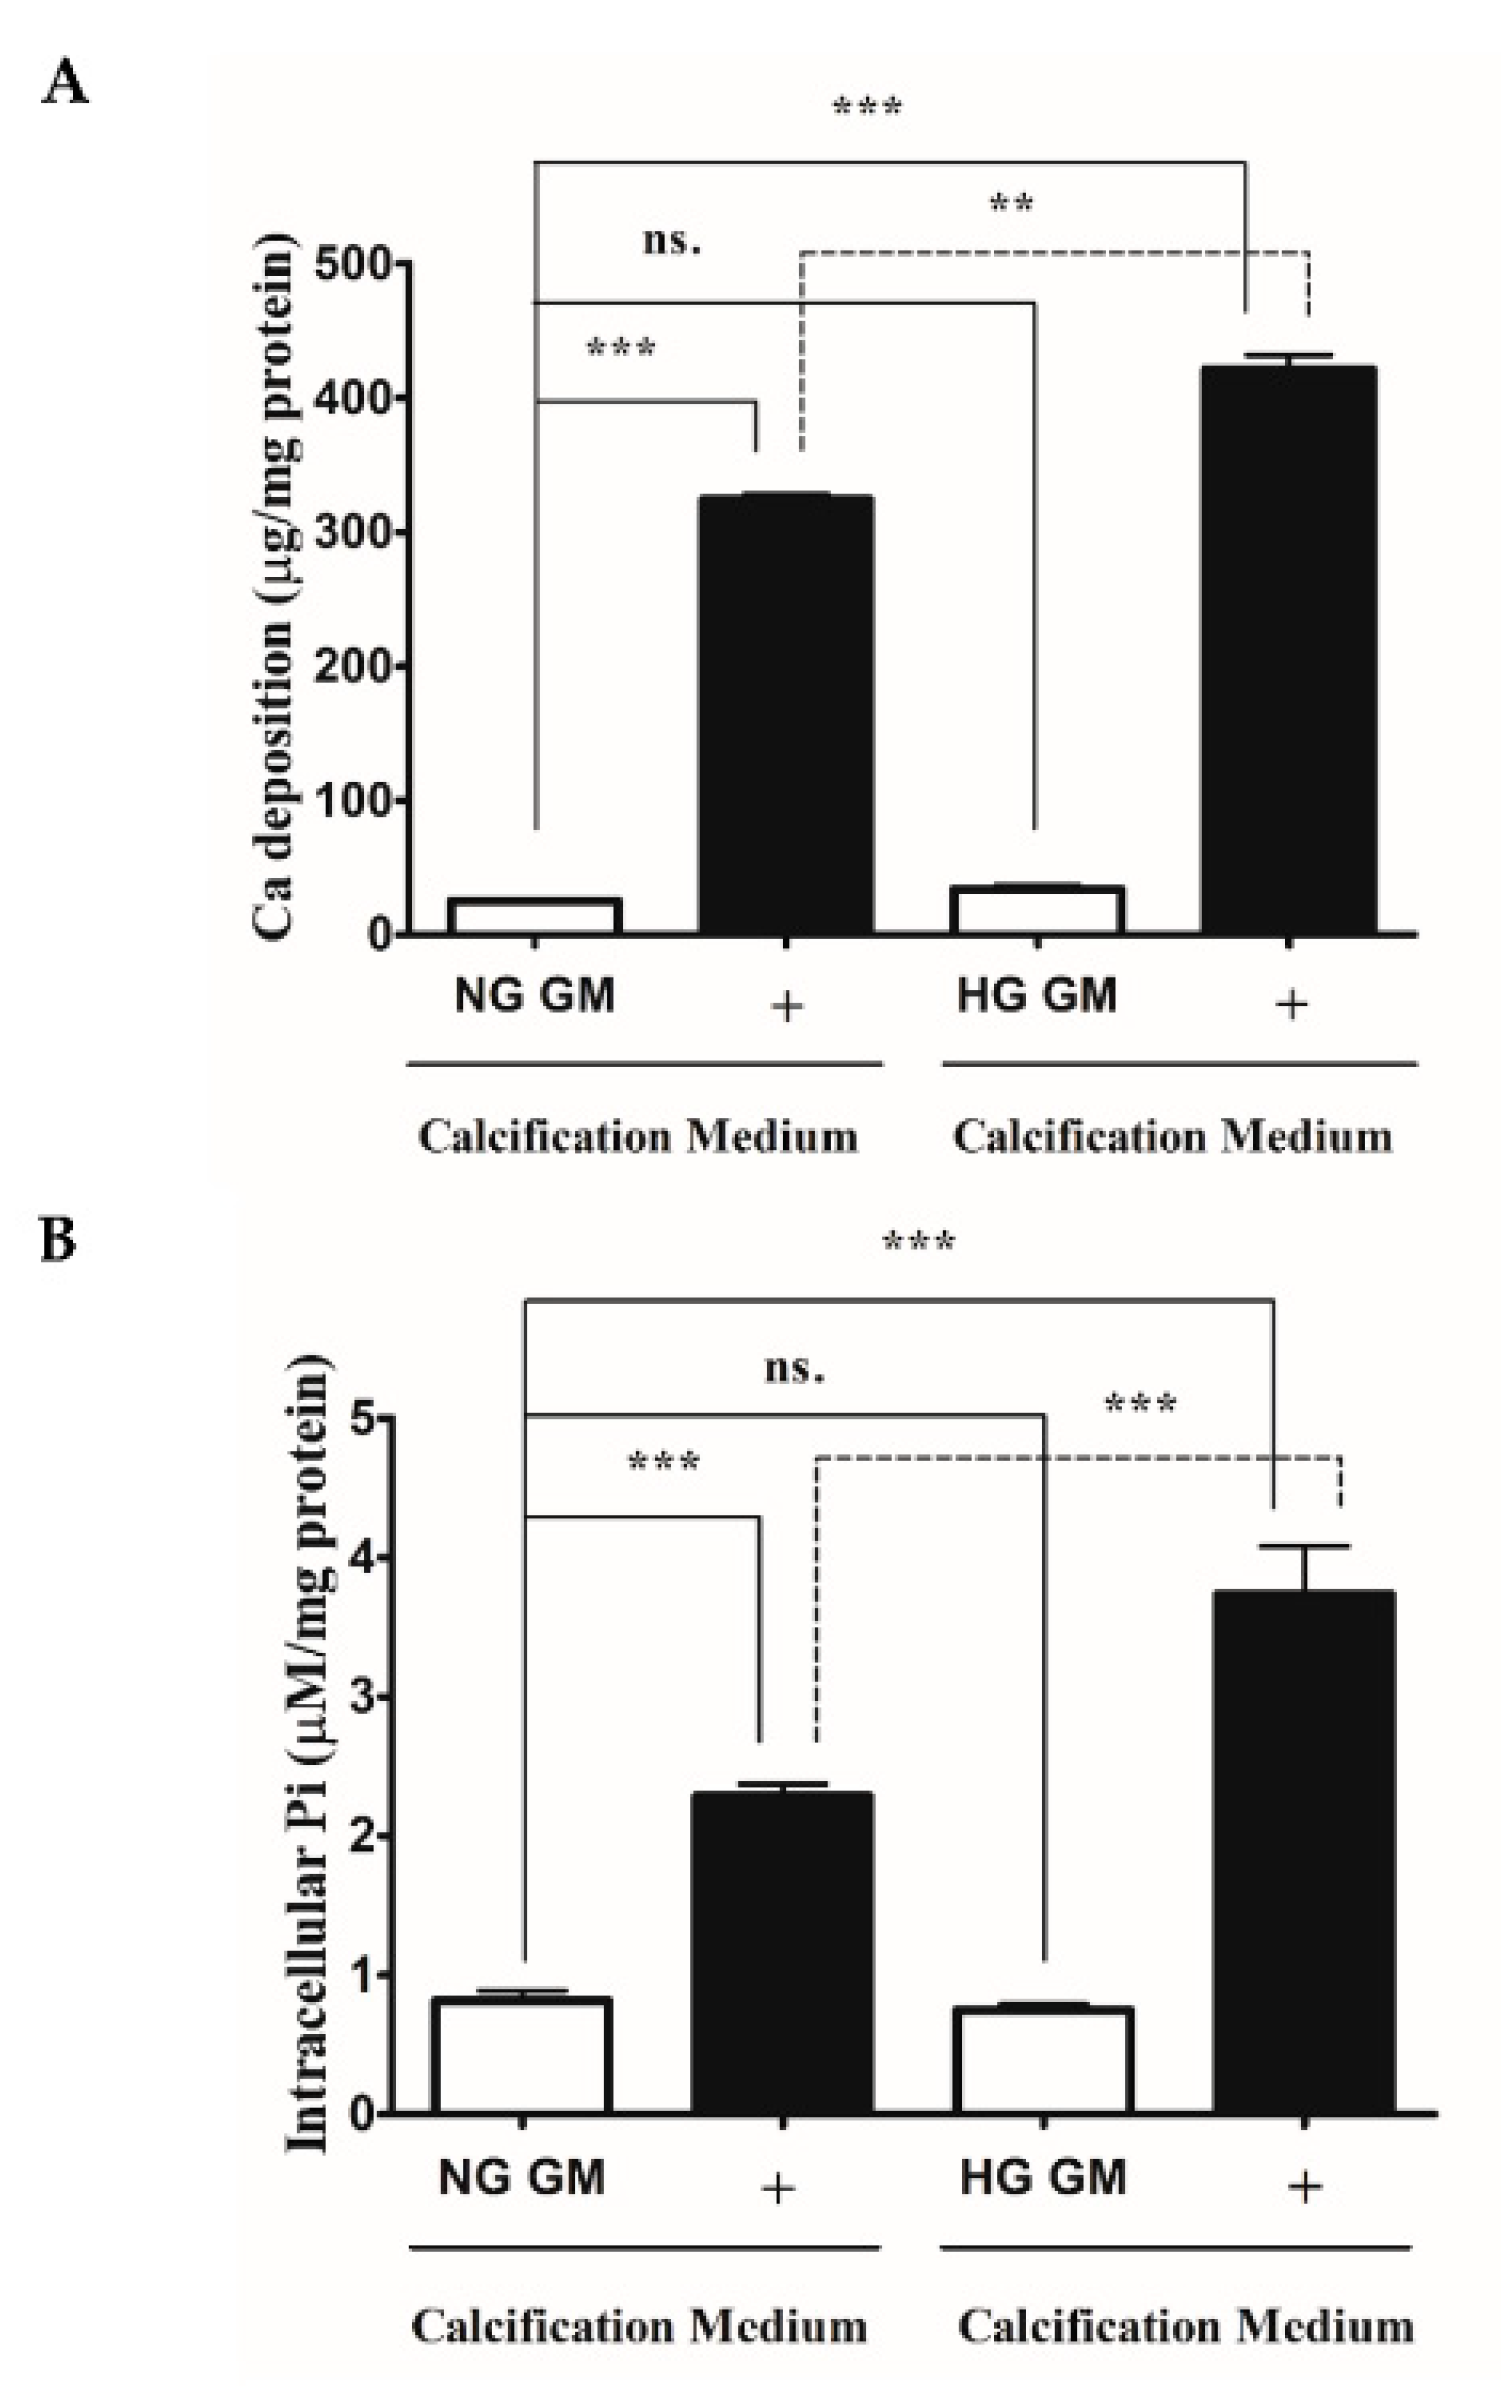
Abstract
1. Introduction
2. Results
2.1. HG Aggravates High Pi-Induced ECM Calcium Deposition and Pi Uptake of VSMCs
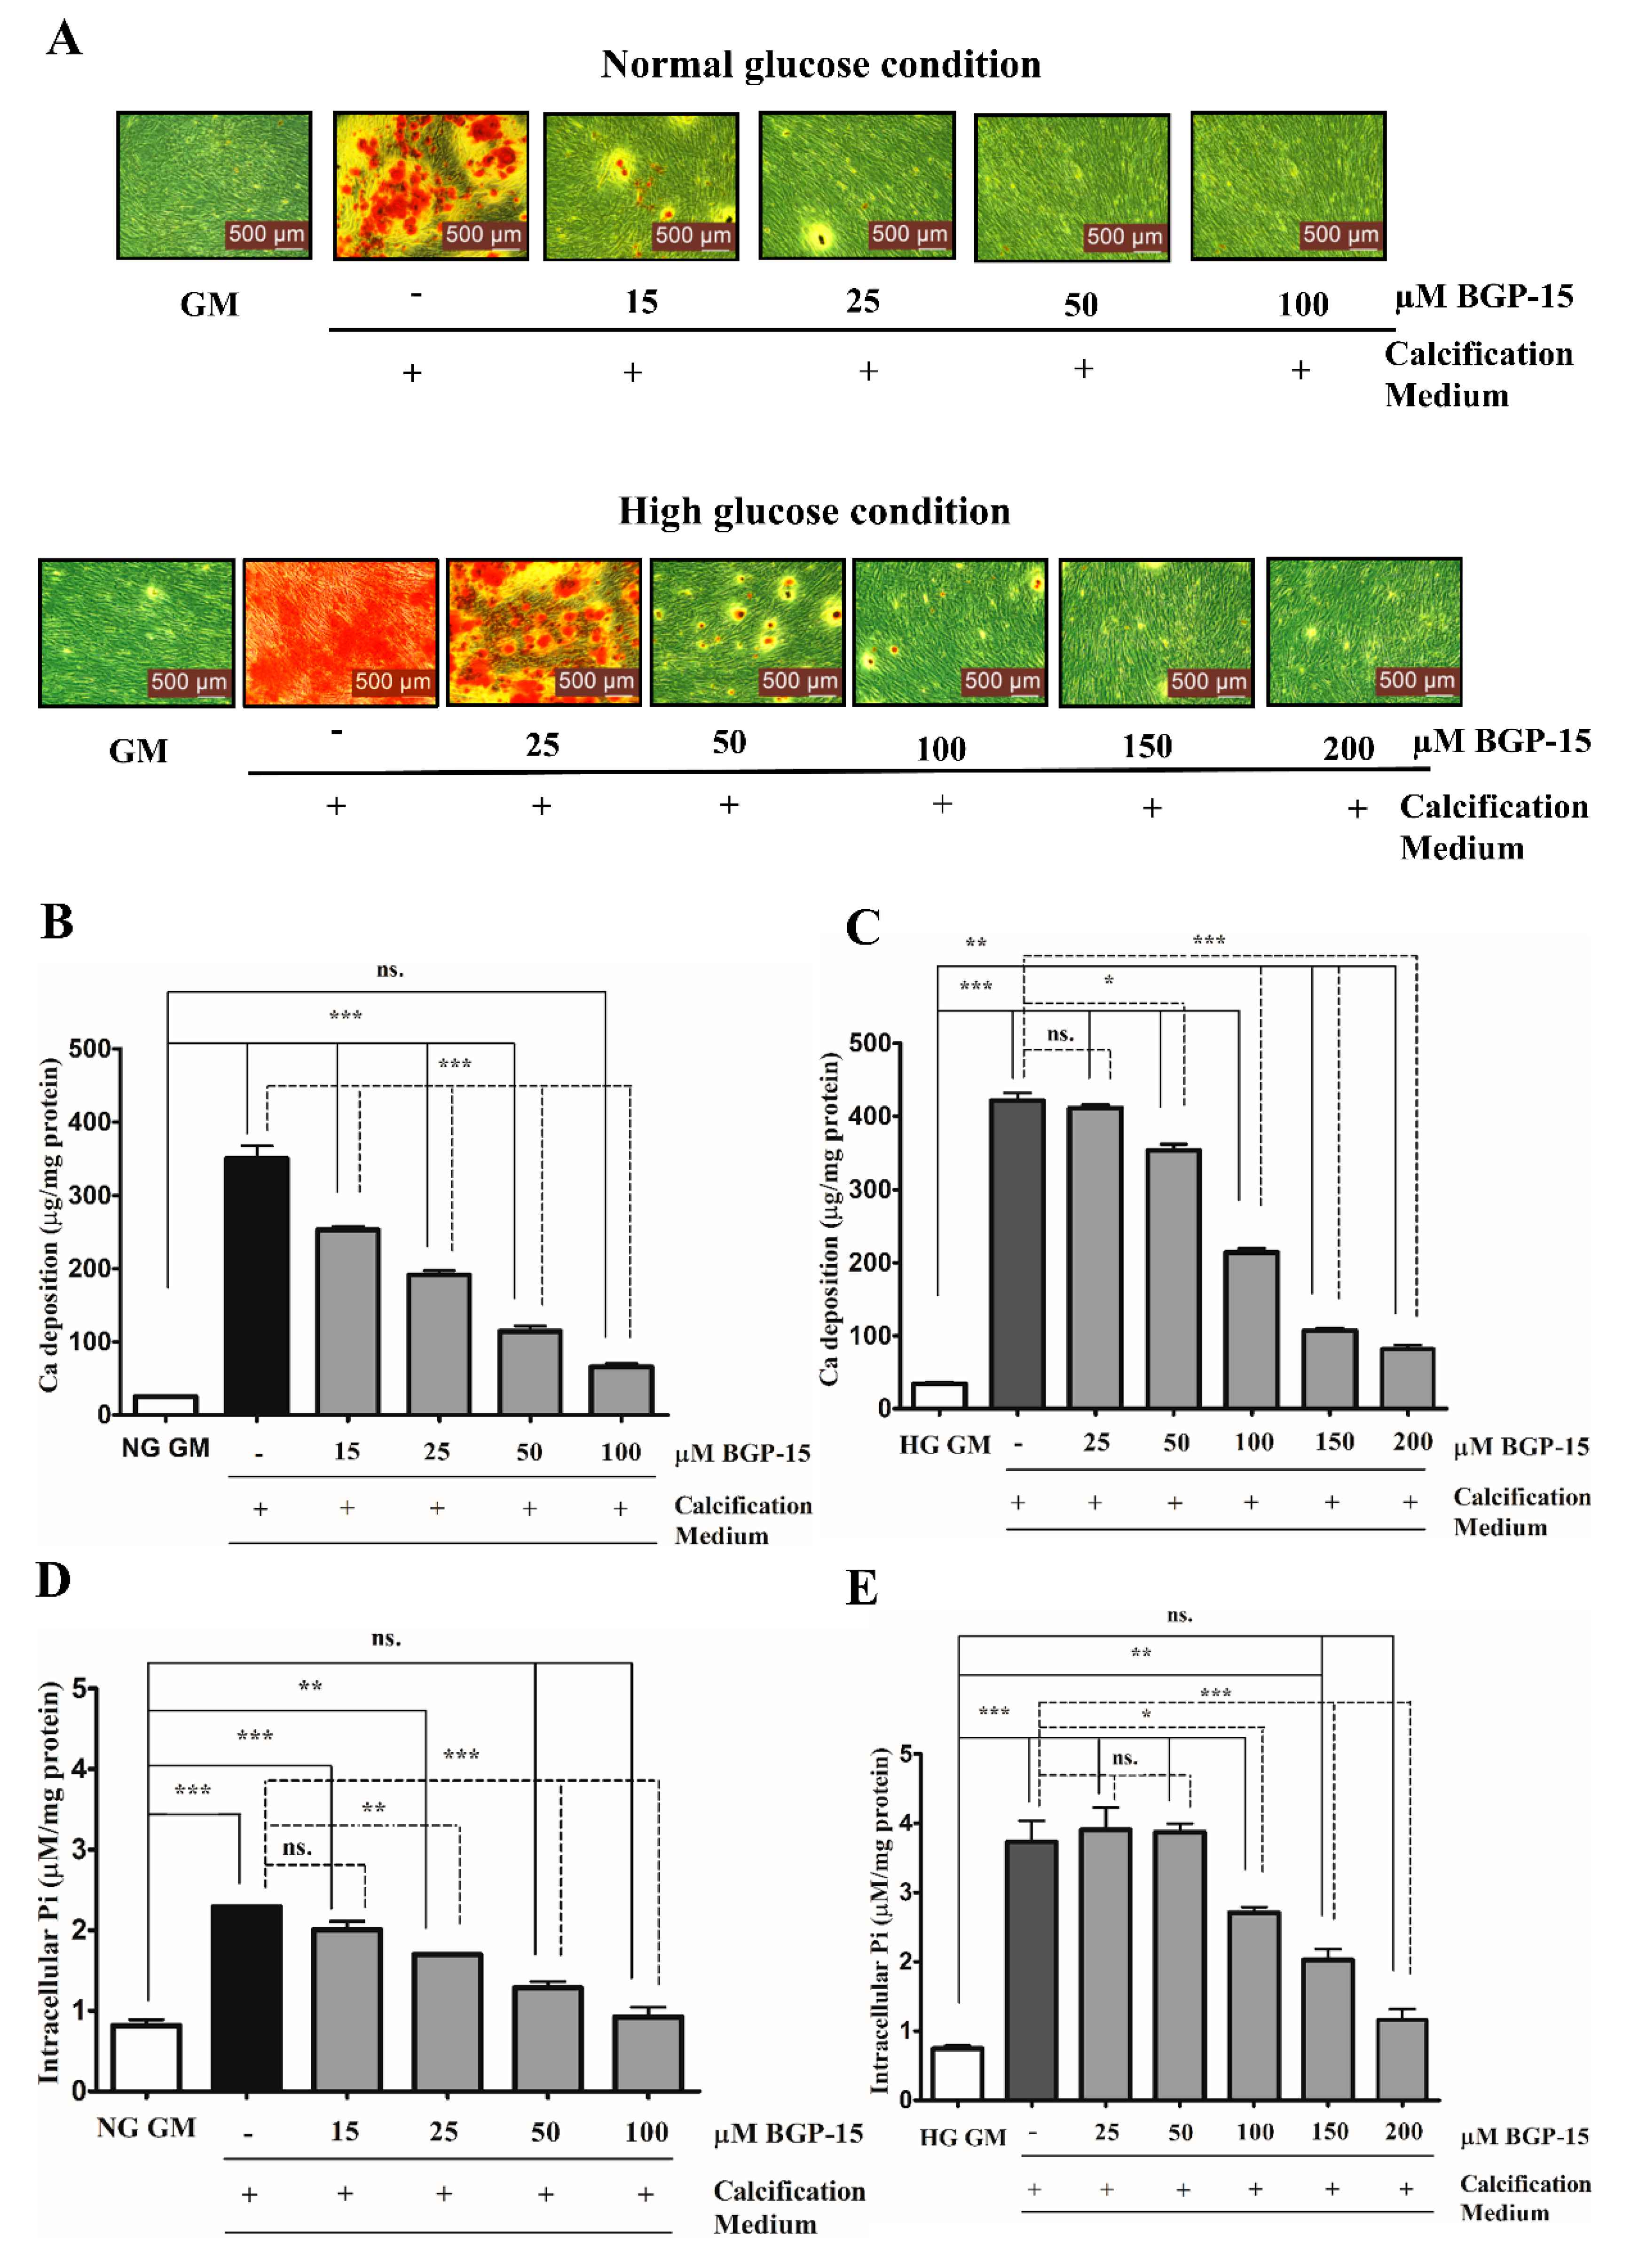
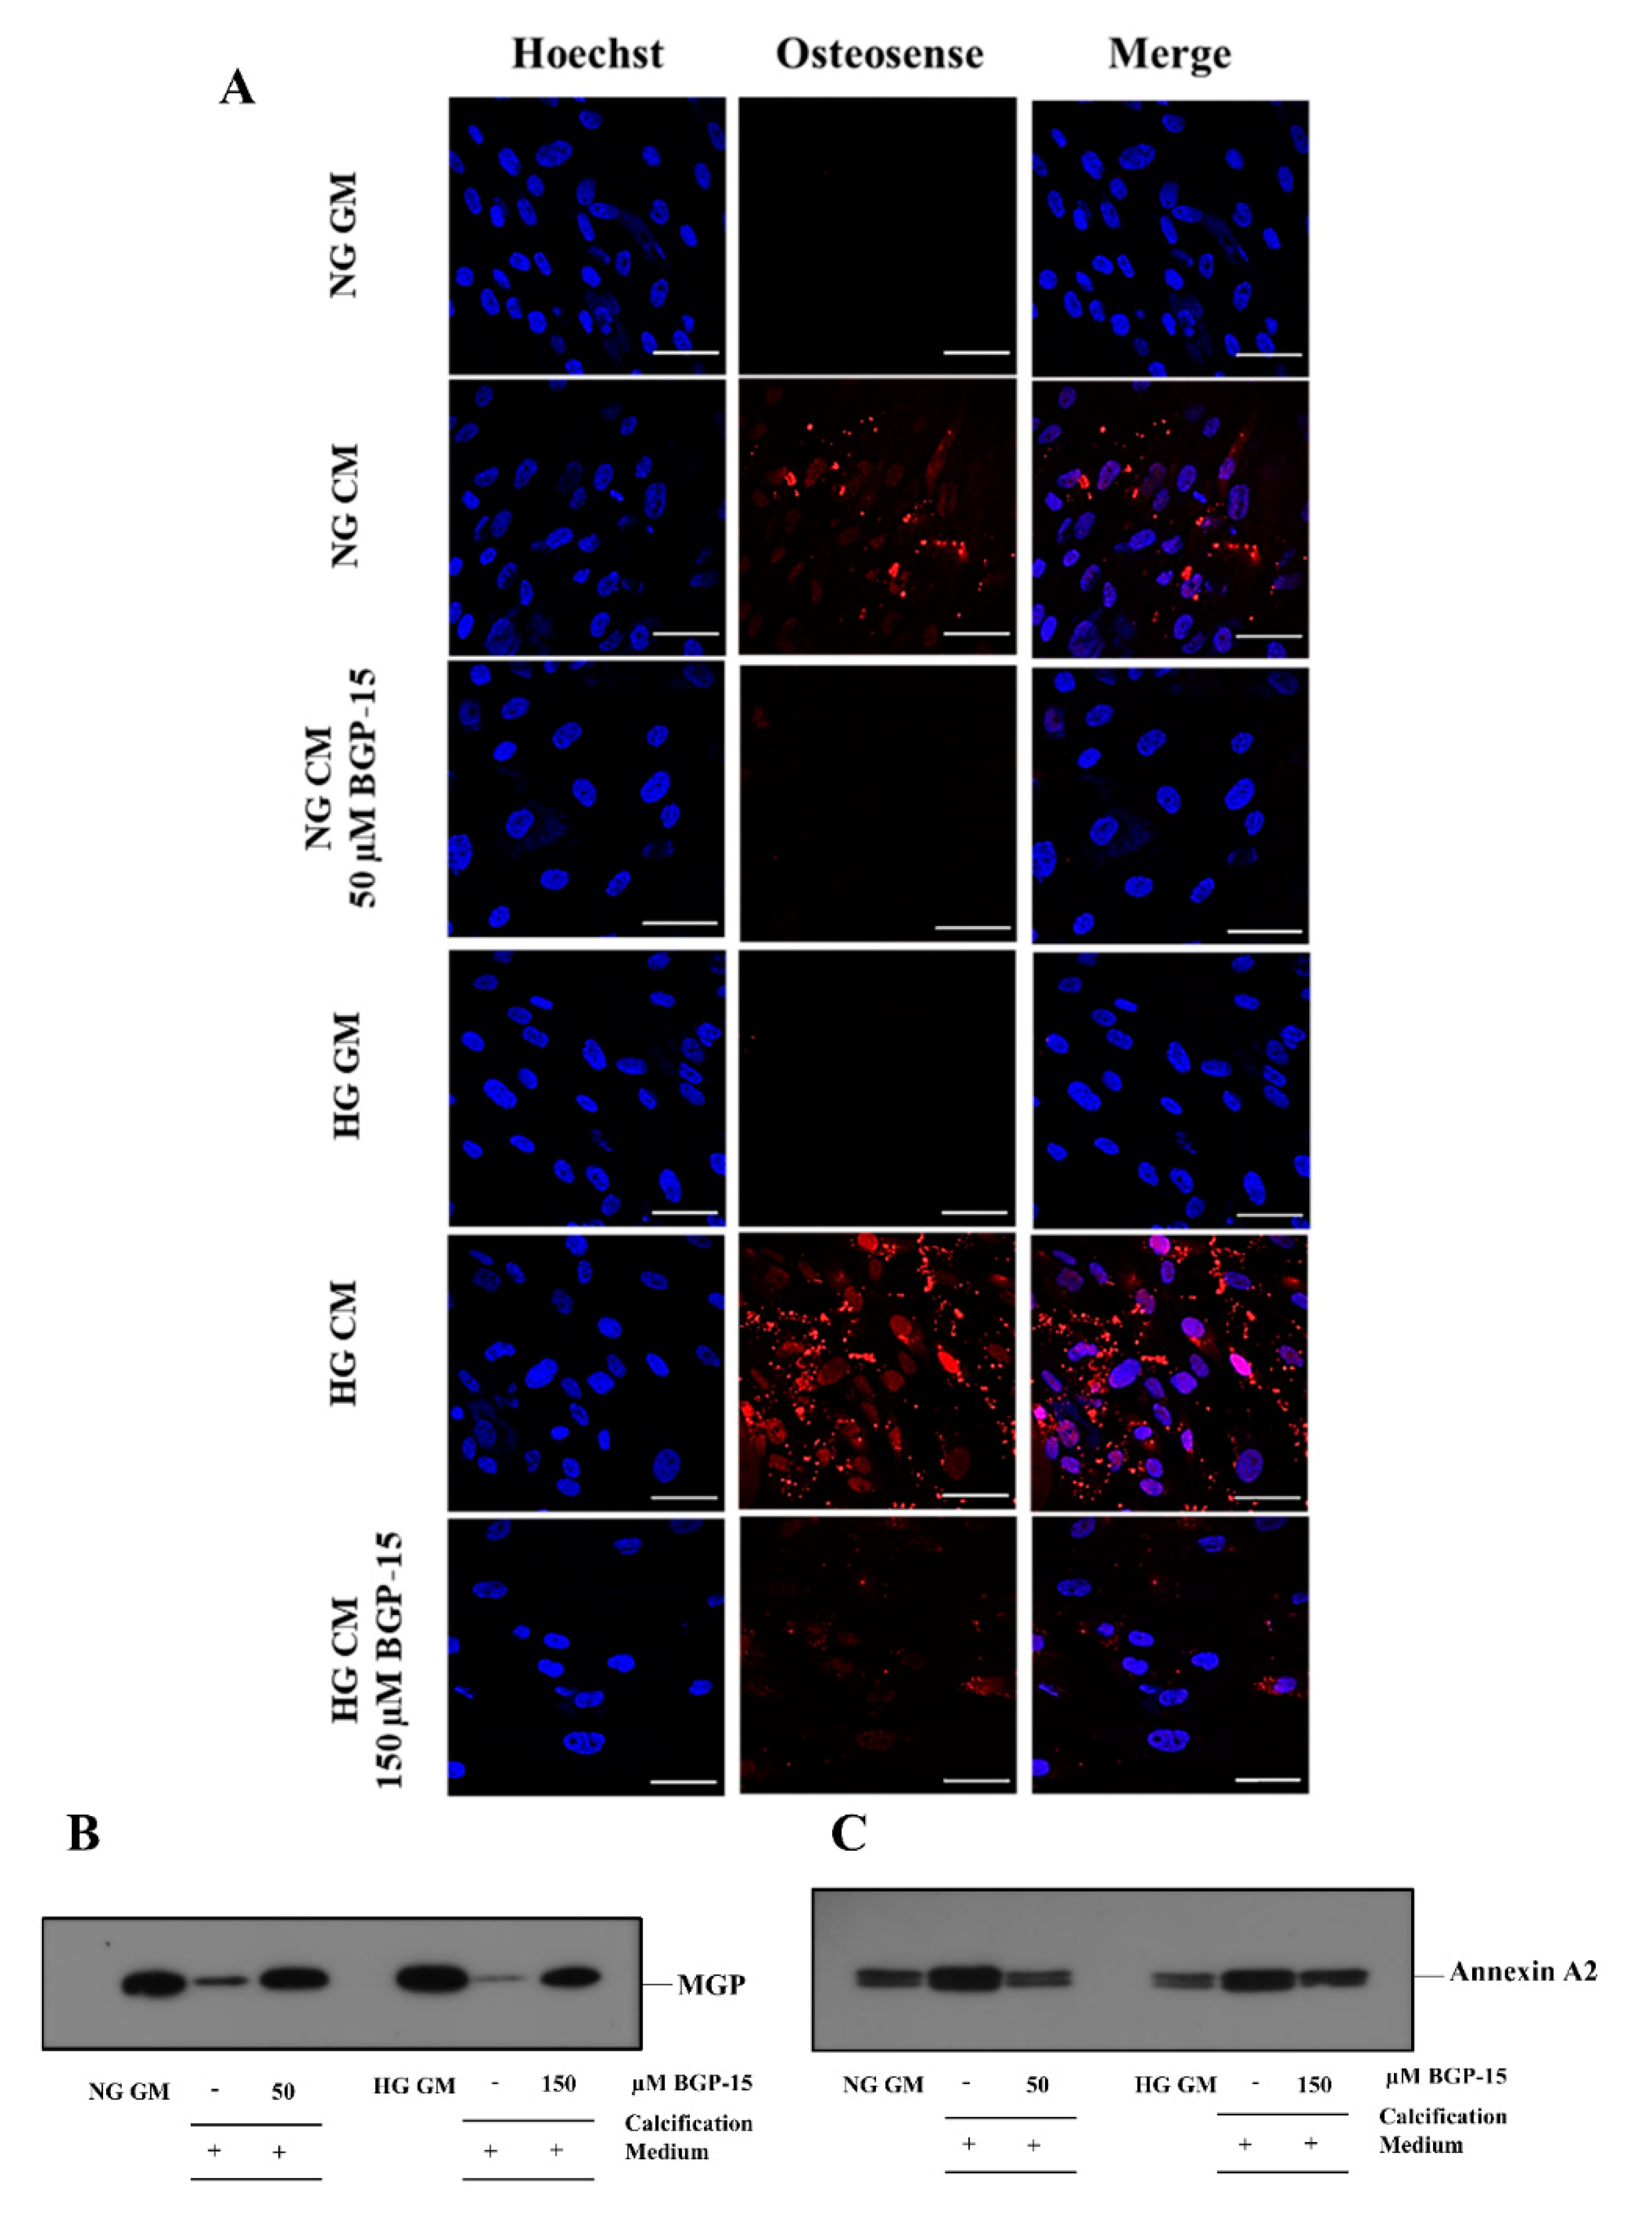
2.2. BGP-15 Mitigates High Pi-Induced ECM Calcium Deposition and Pi Uptake of VSMCs in Both Normal Glucose (NG) and High Glucose (HG) Conditions
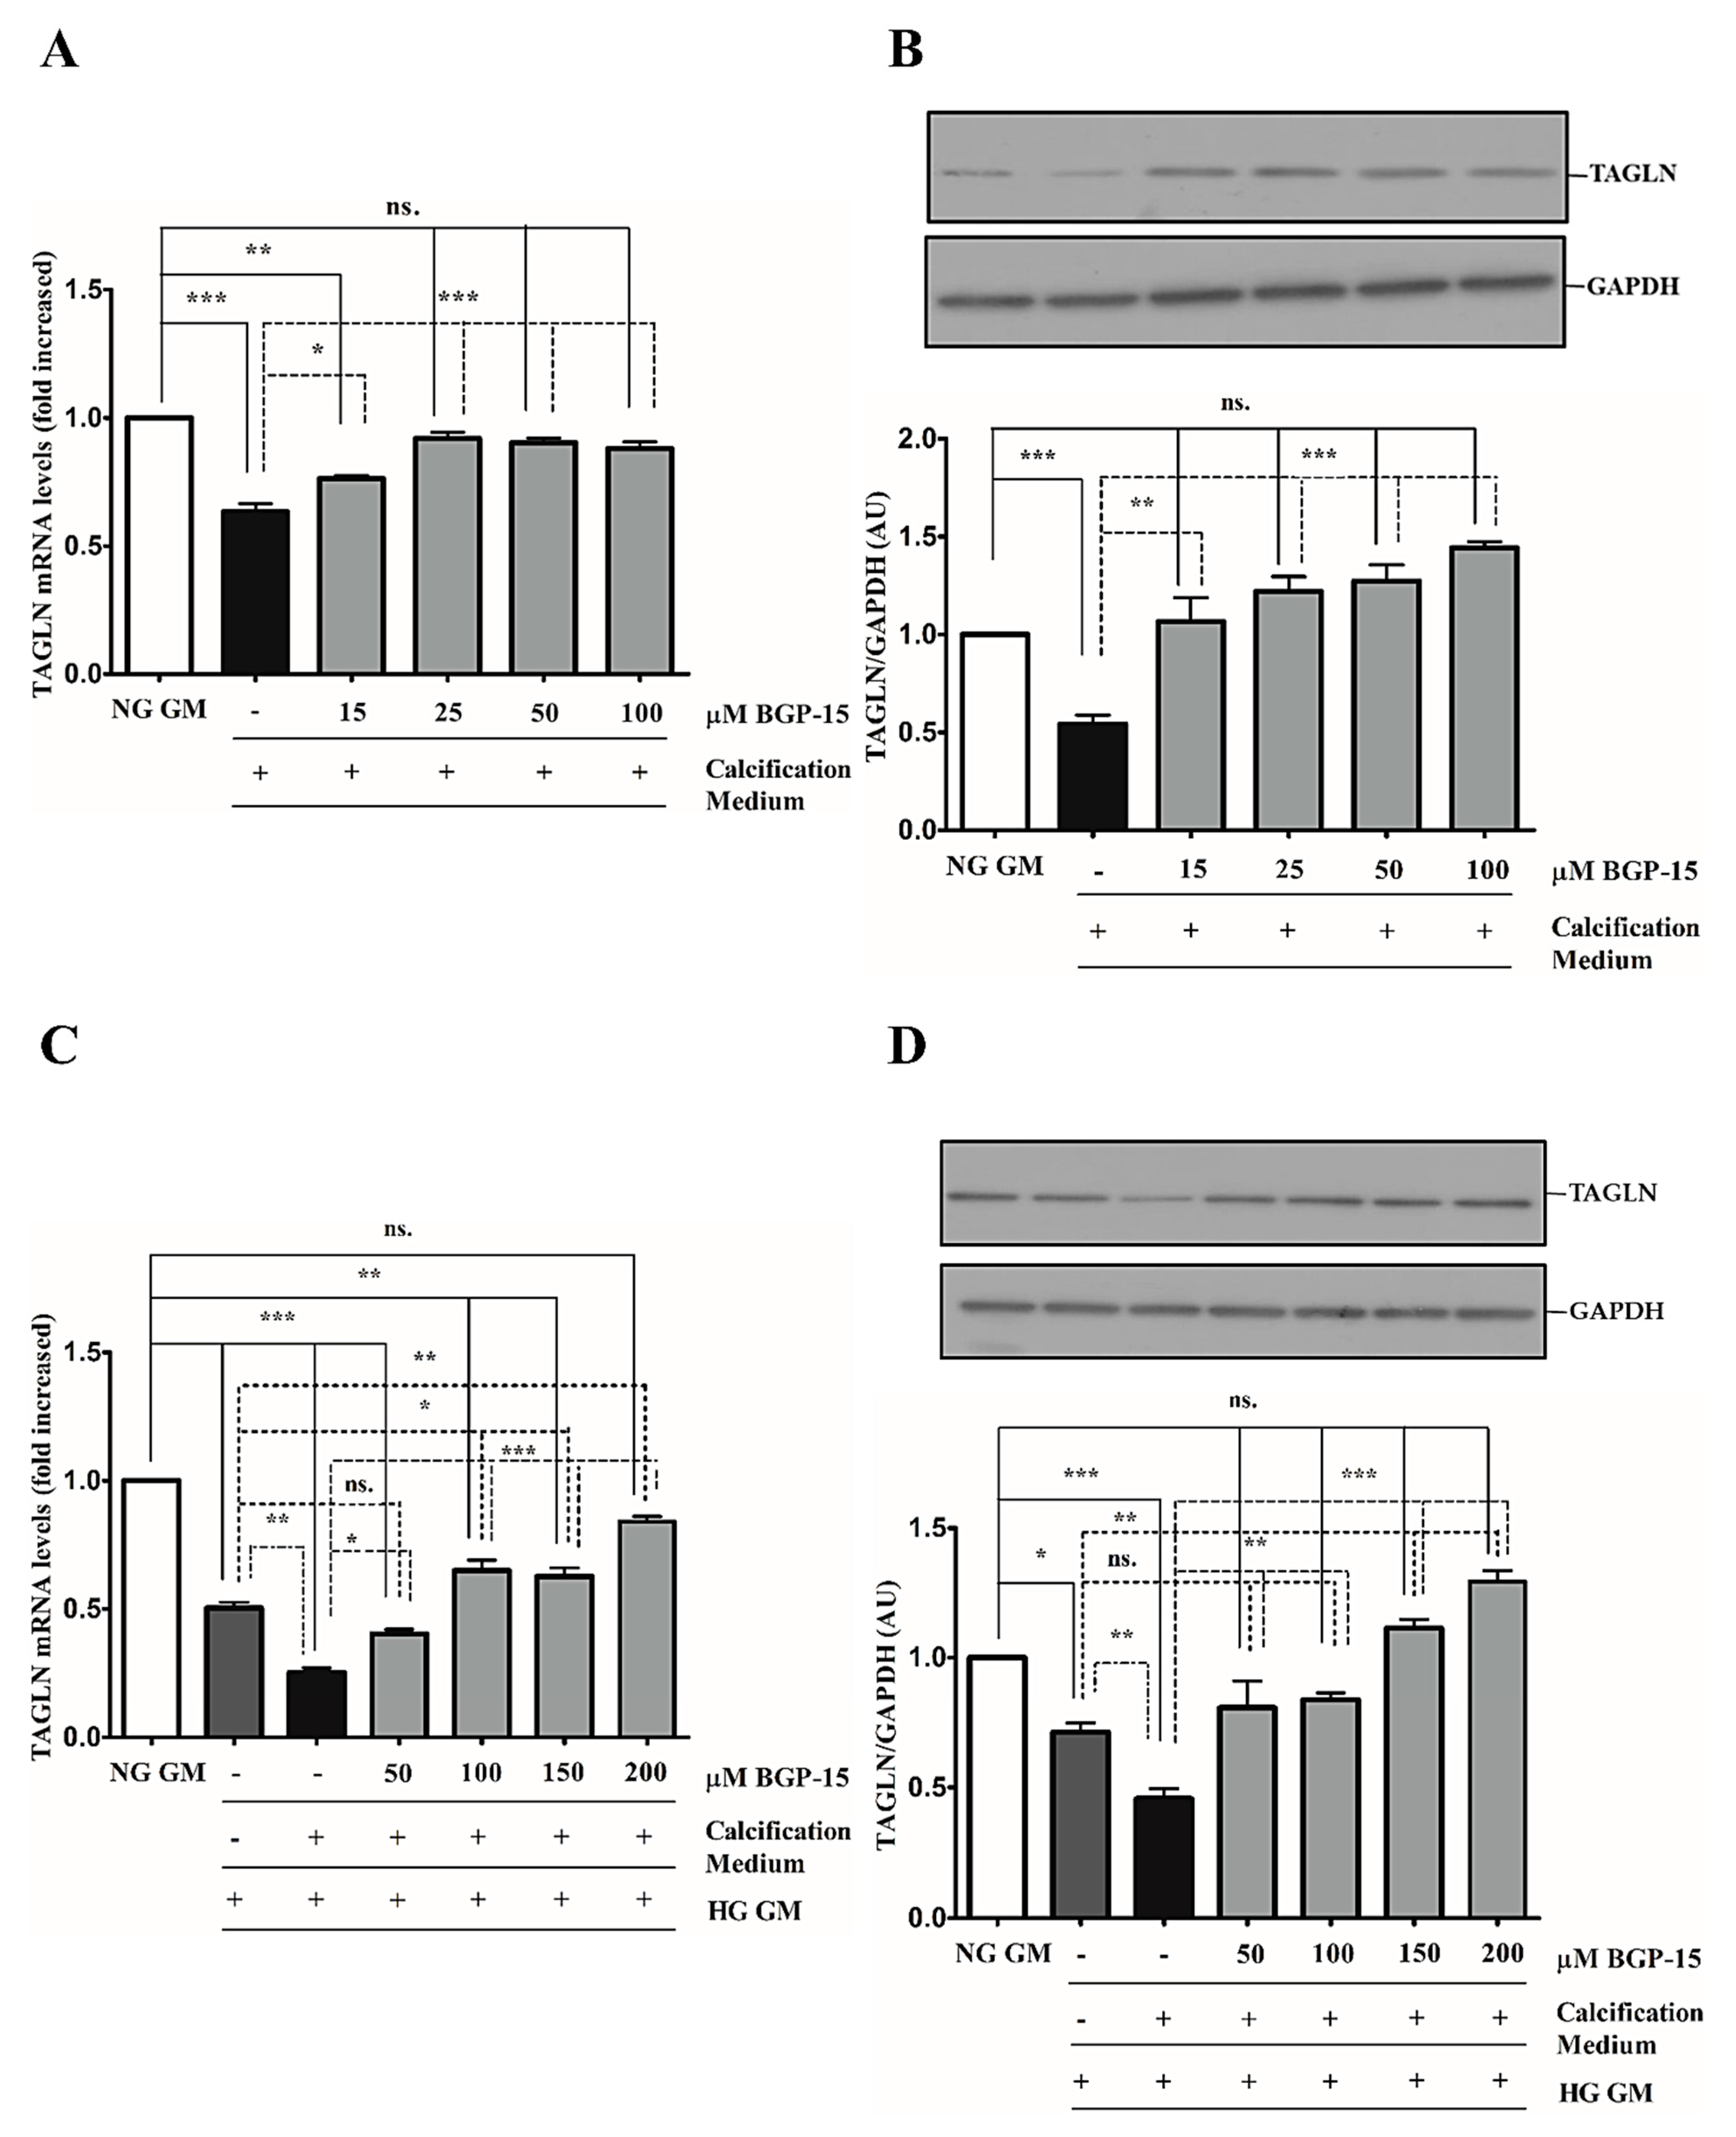
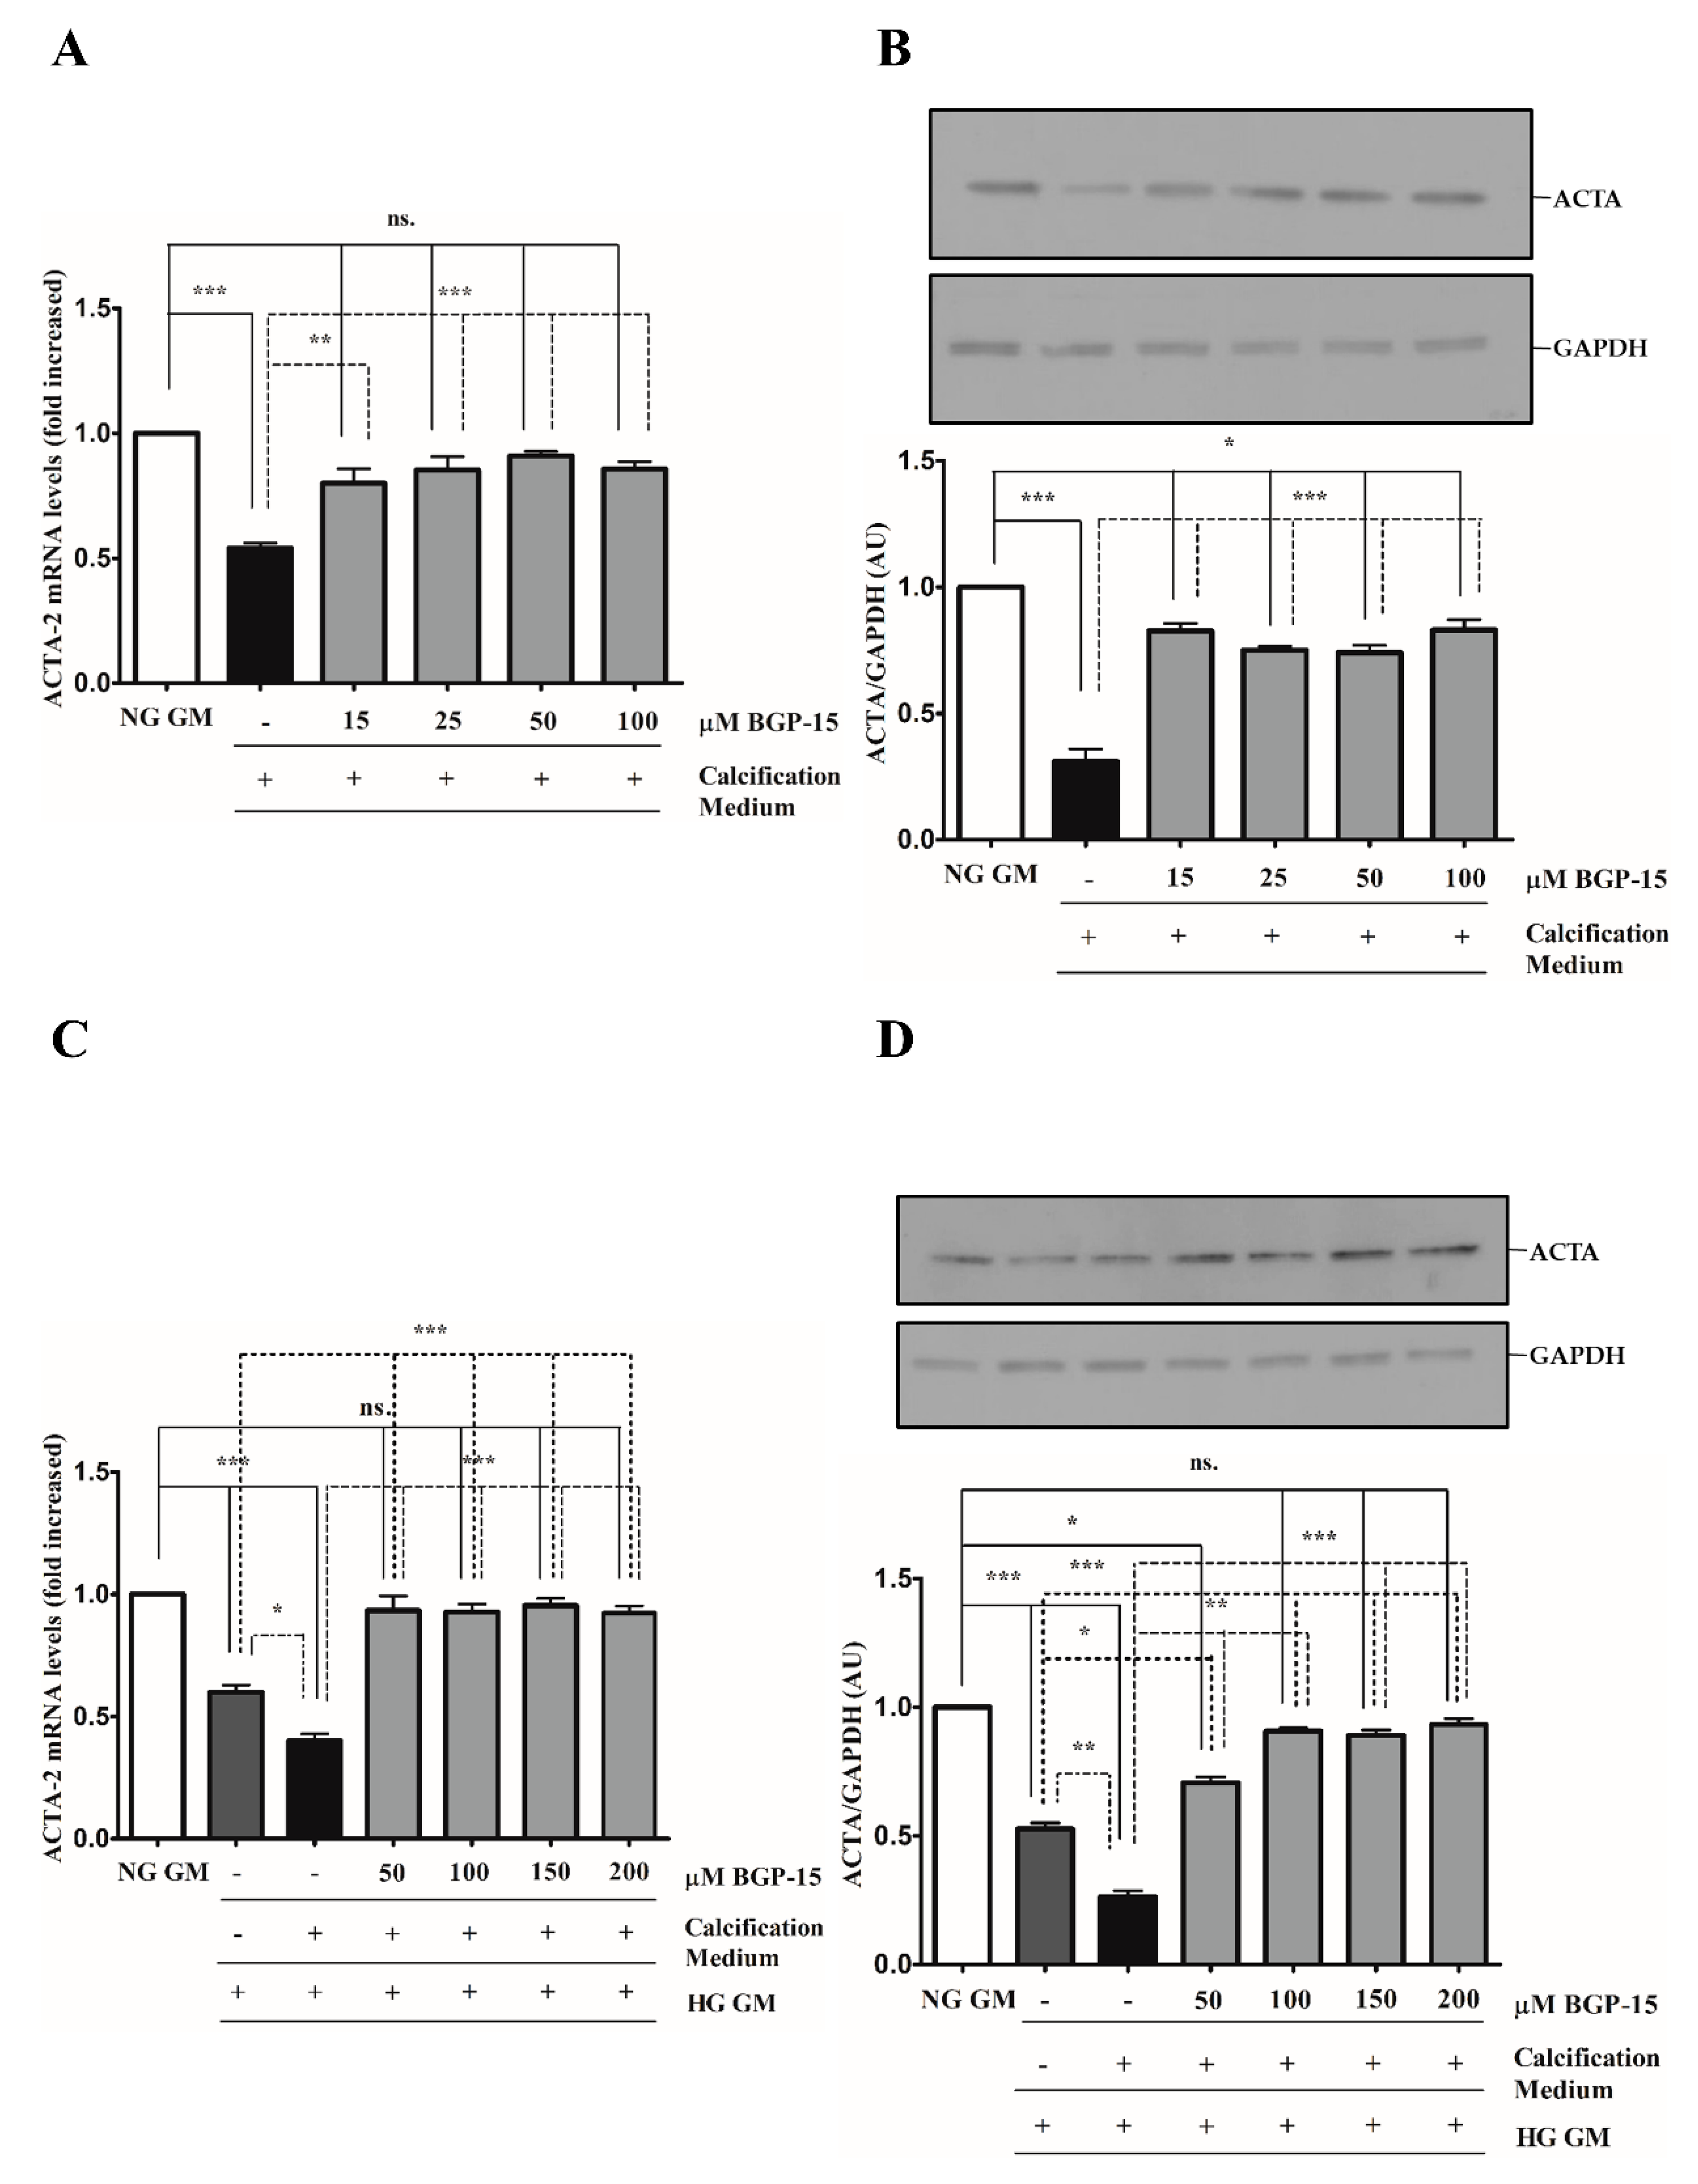
2.3. BGP-15 Inhibits High Pi-Induced Loss of Smooth Muscle Cell-Specific Markers in Both NG and HG Conditions
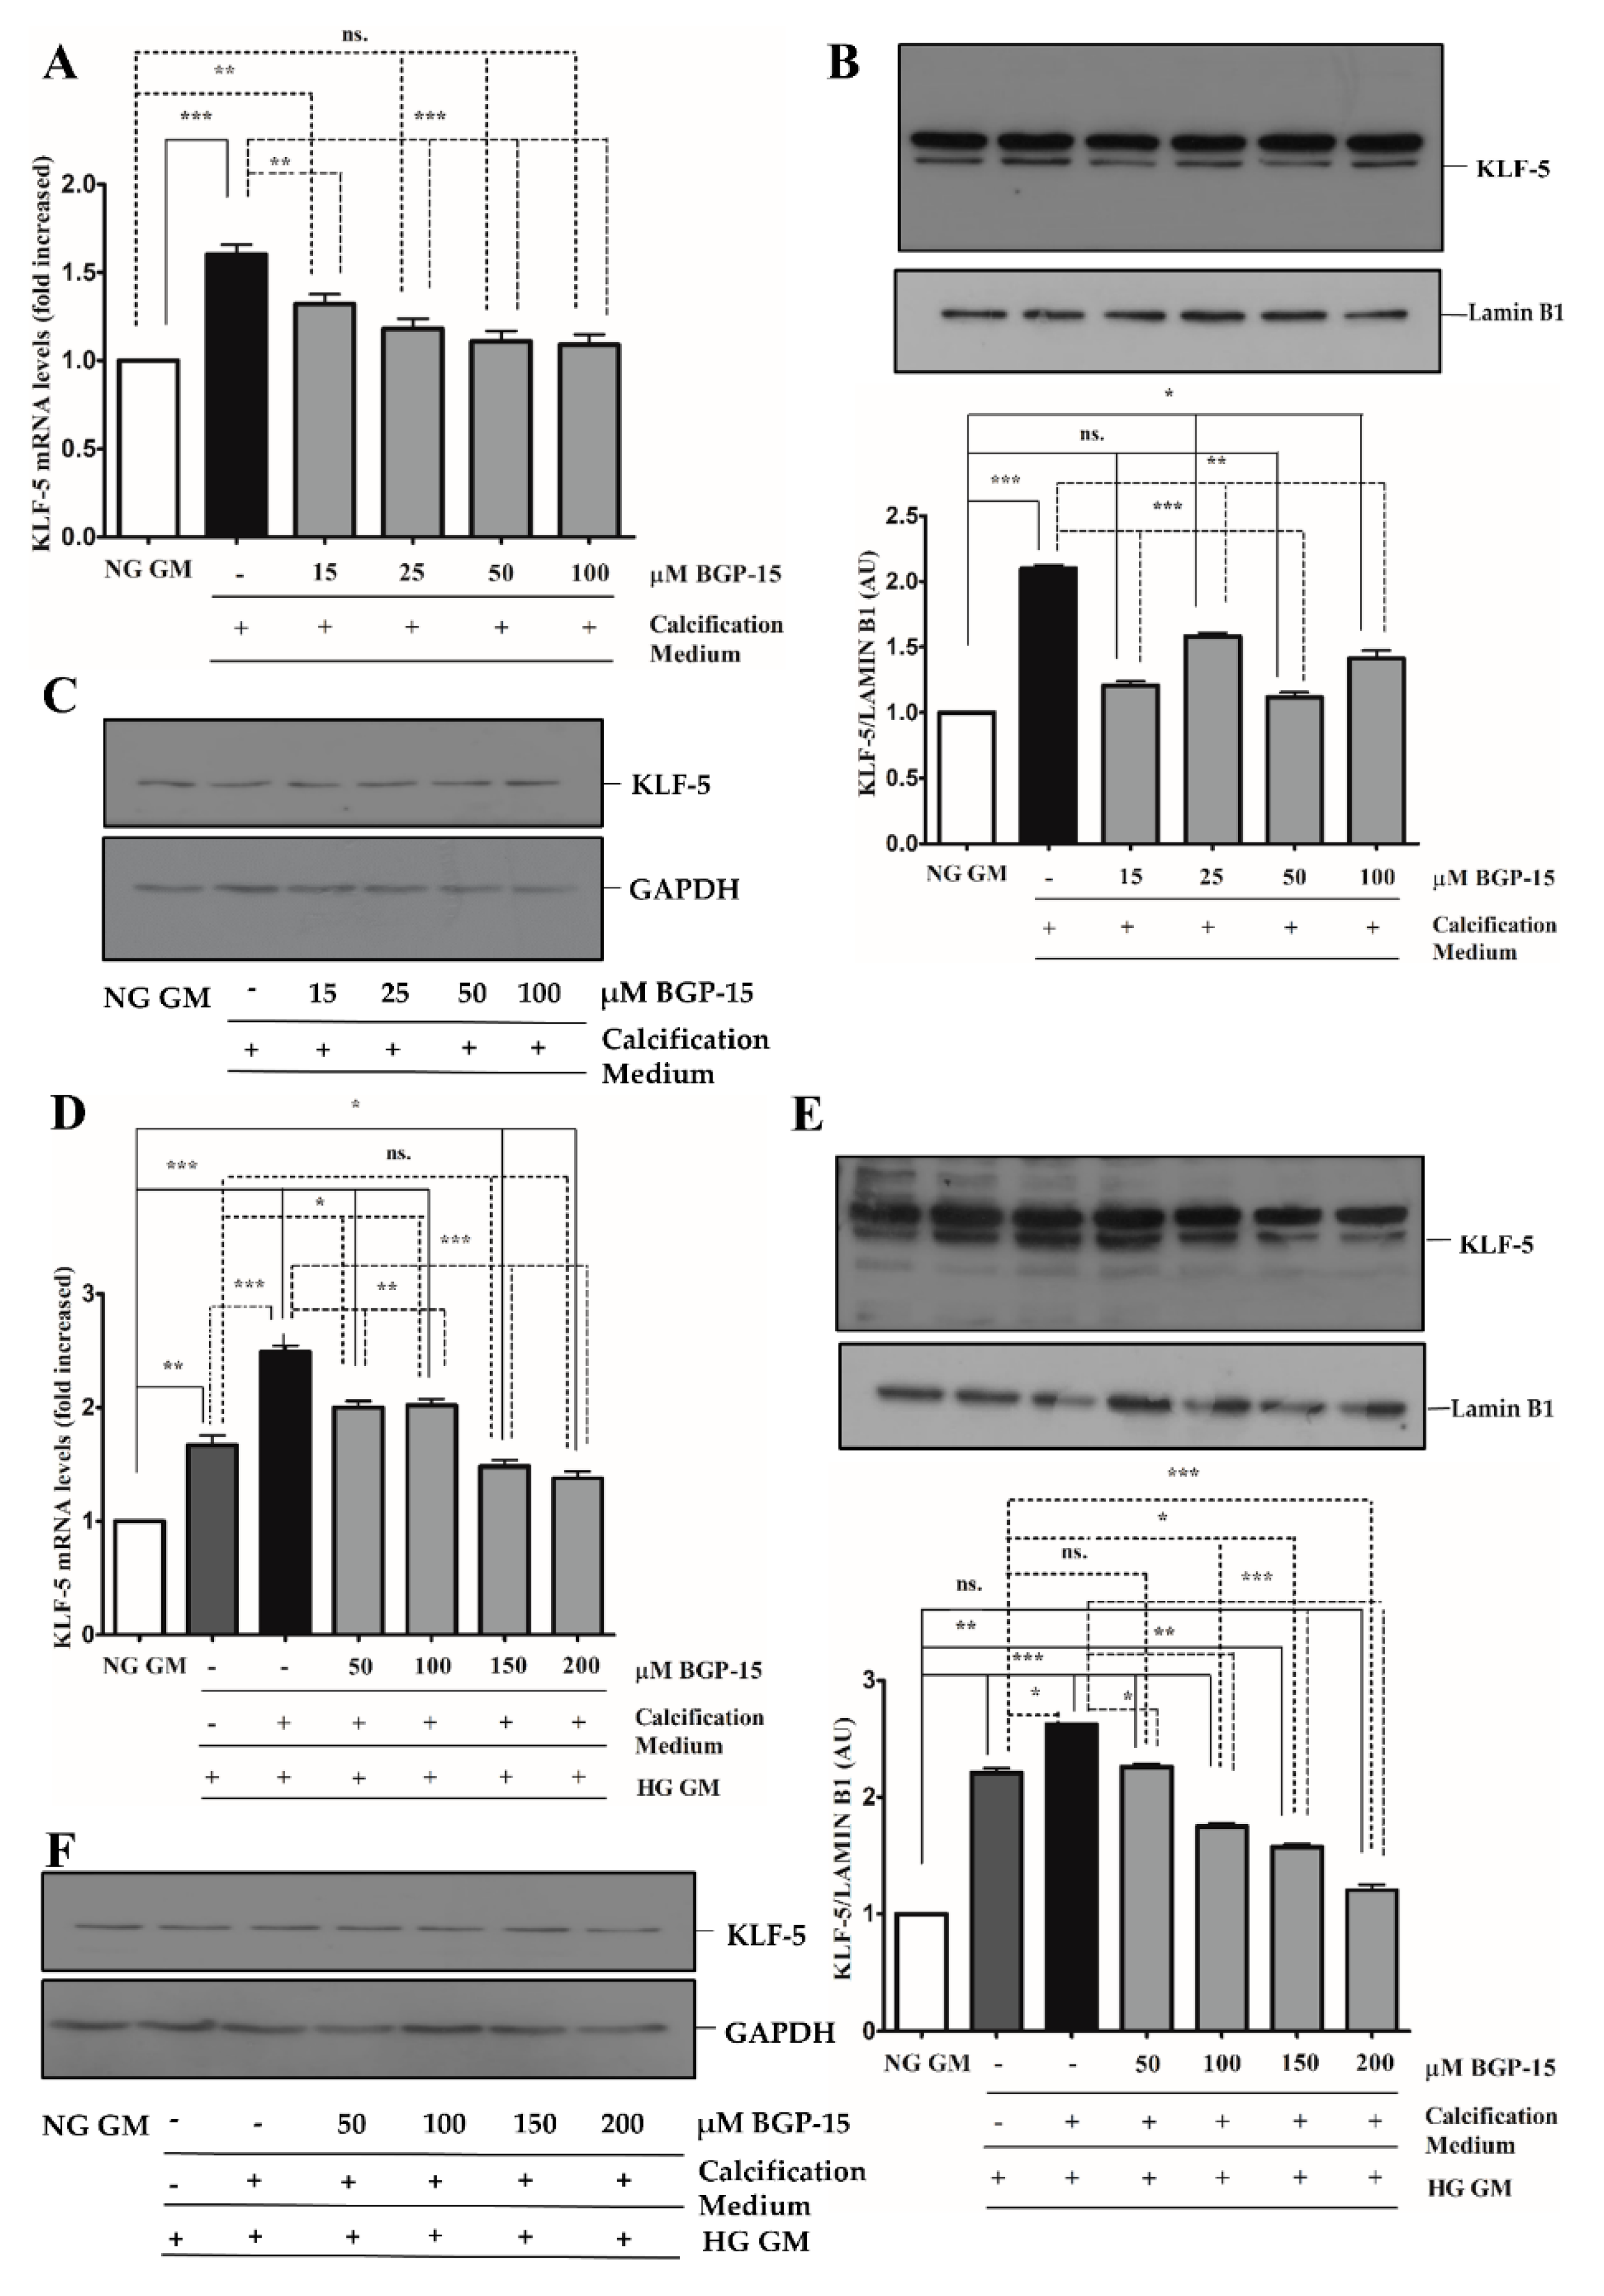
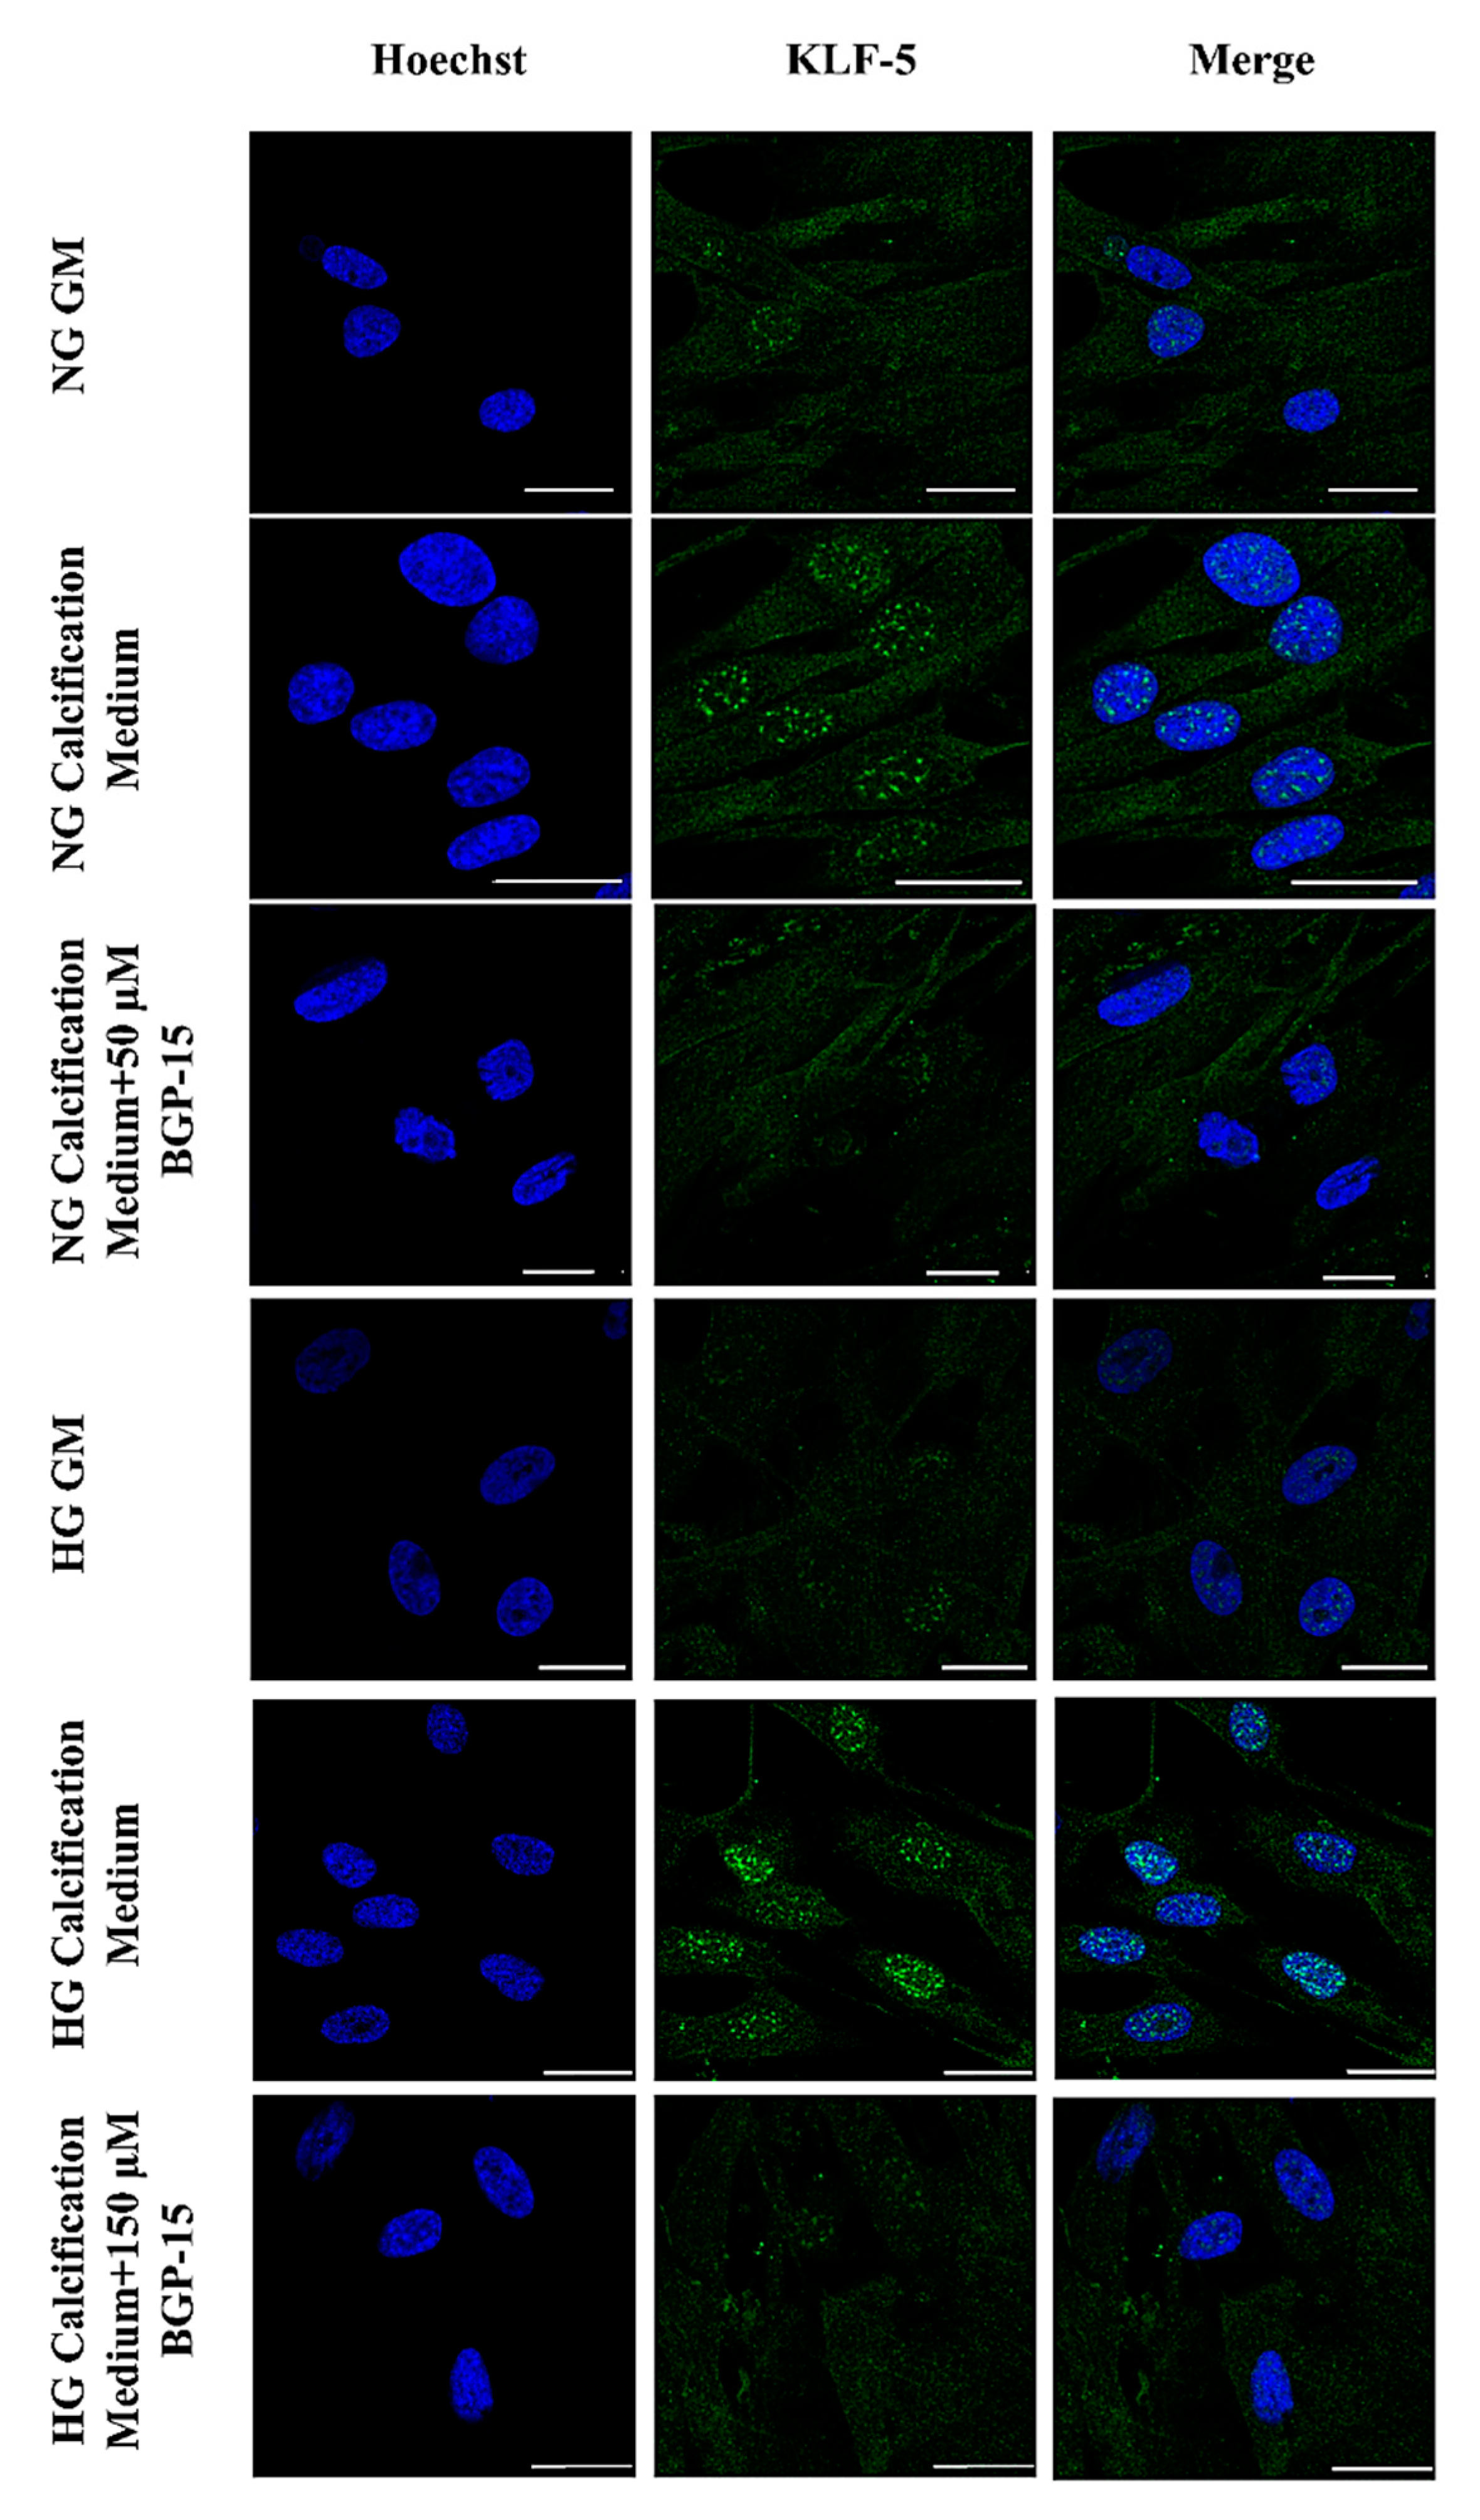
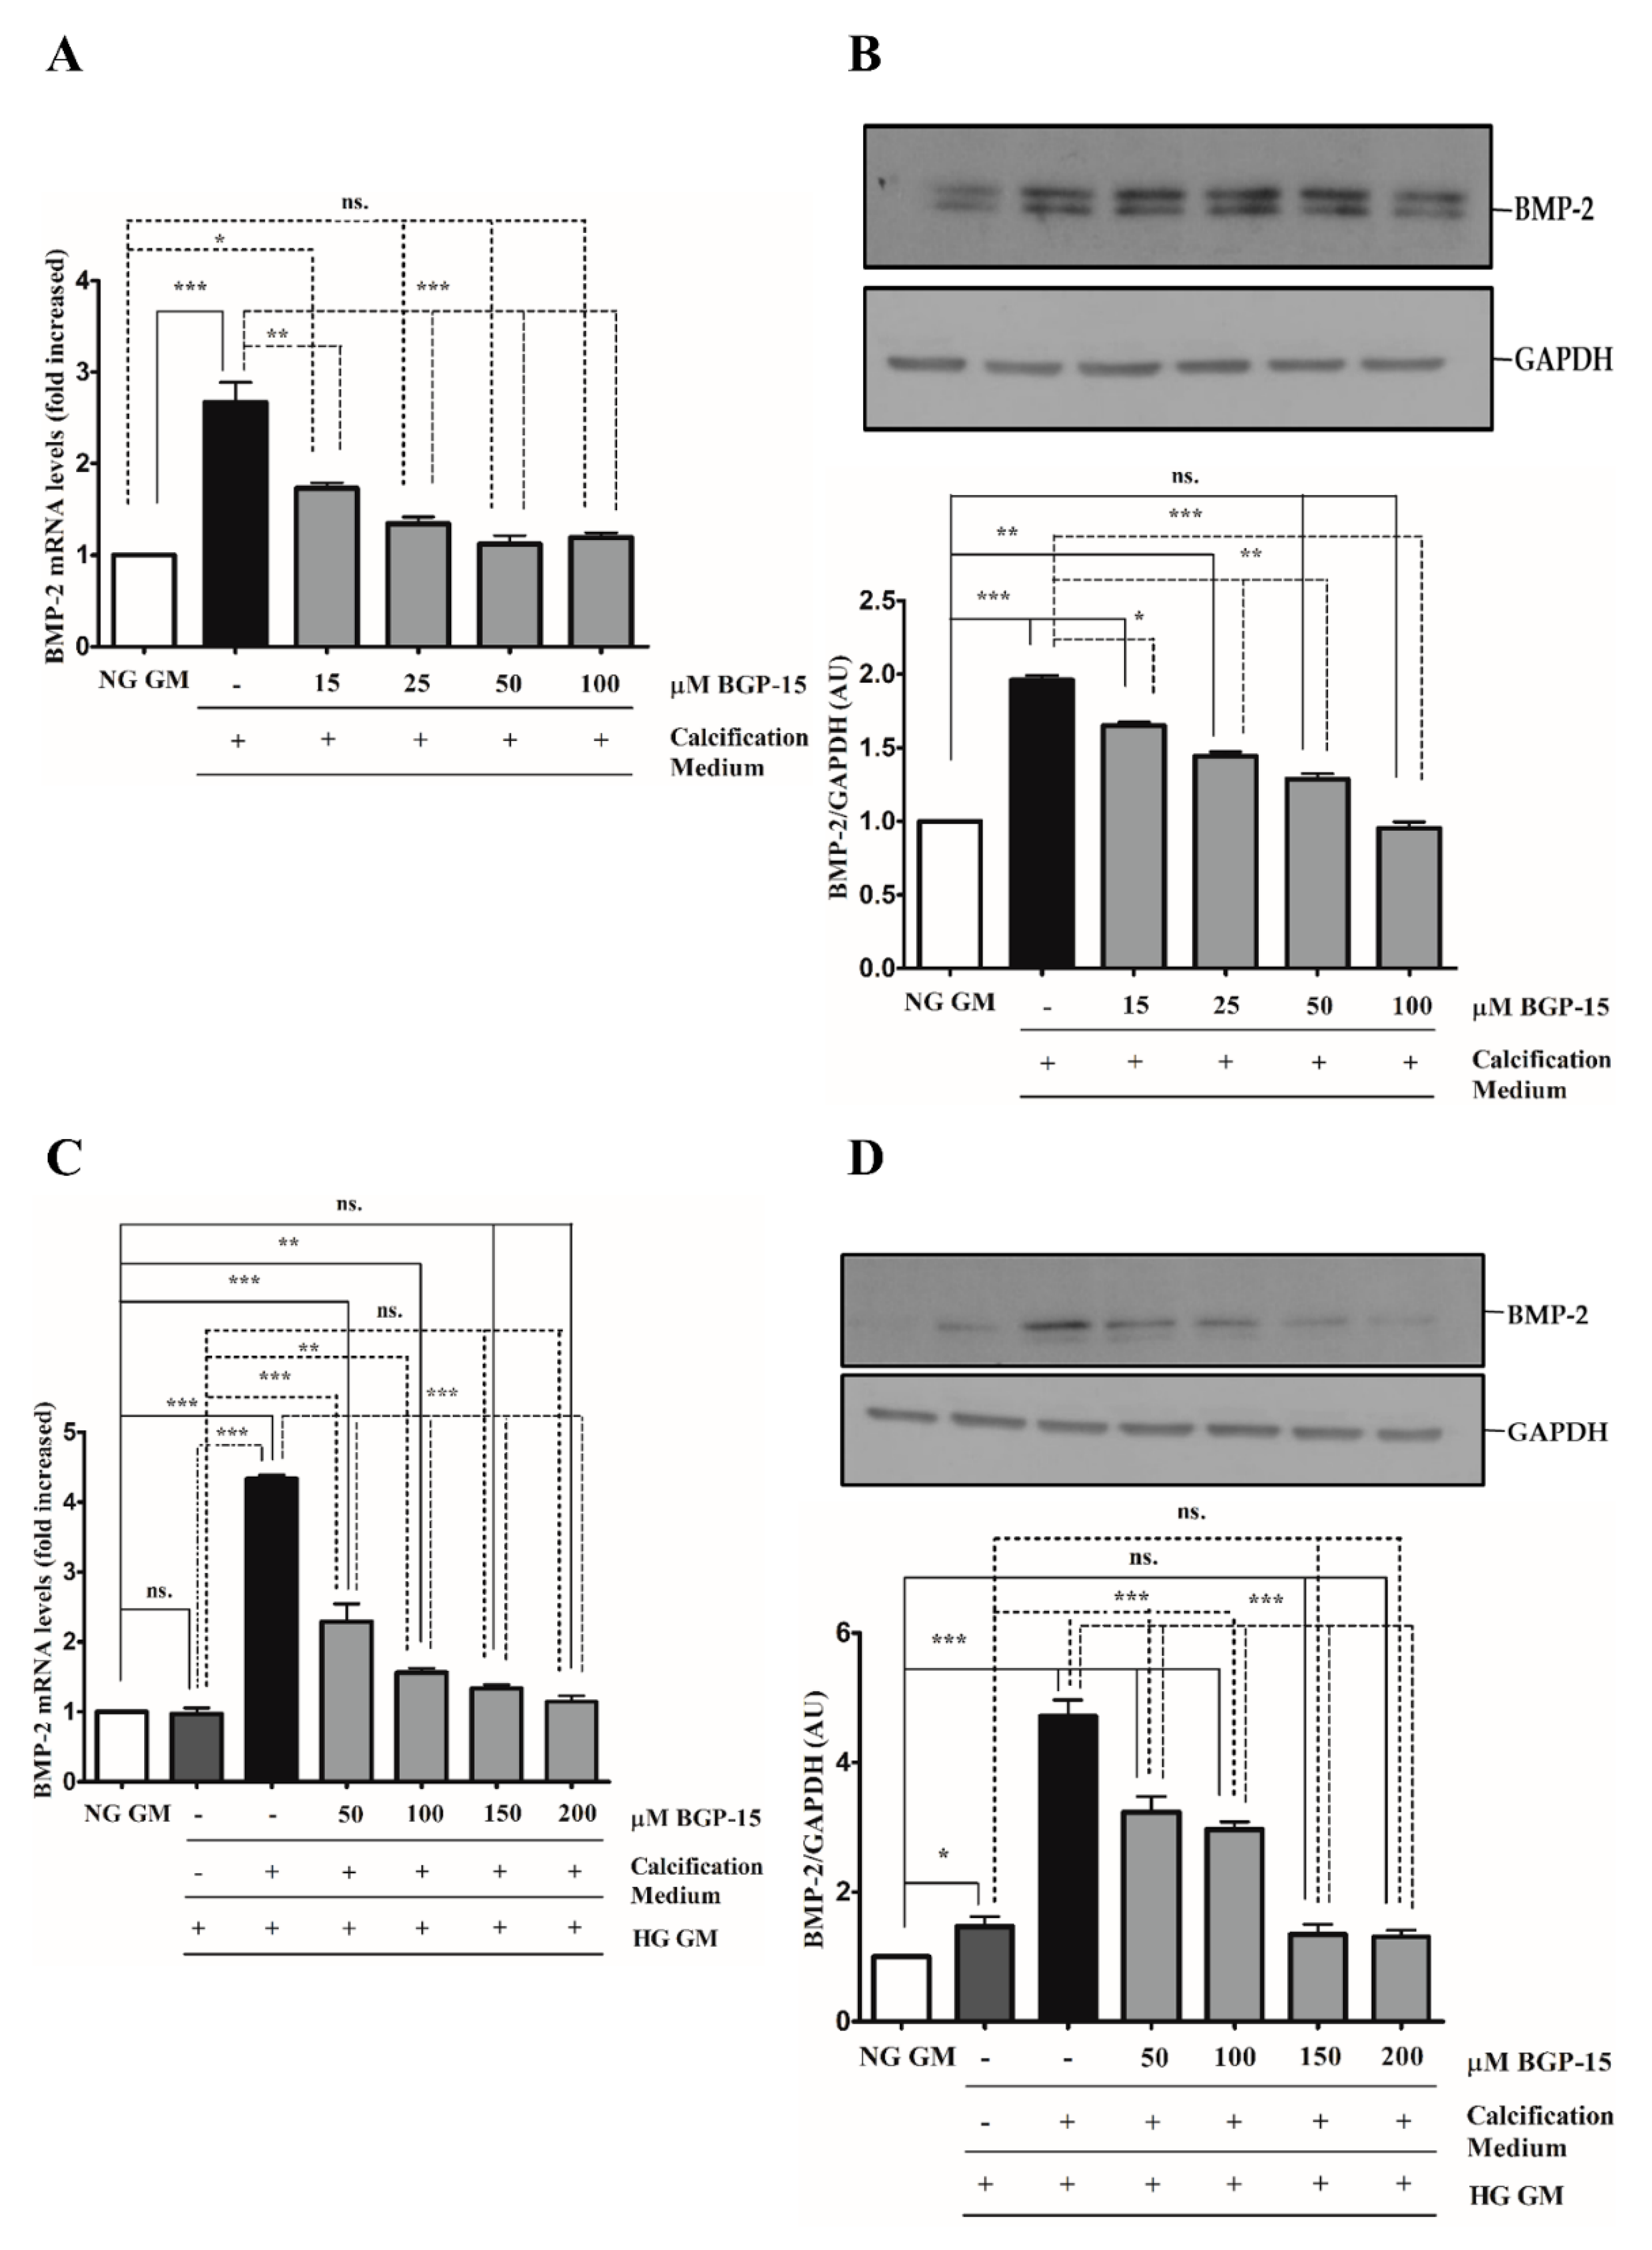
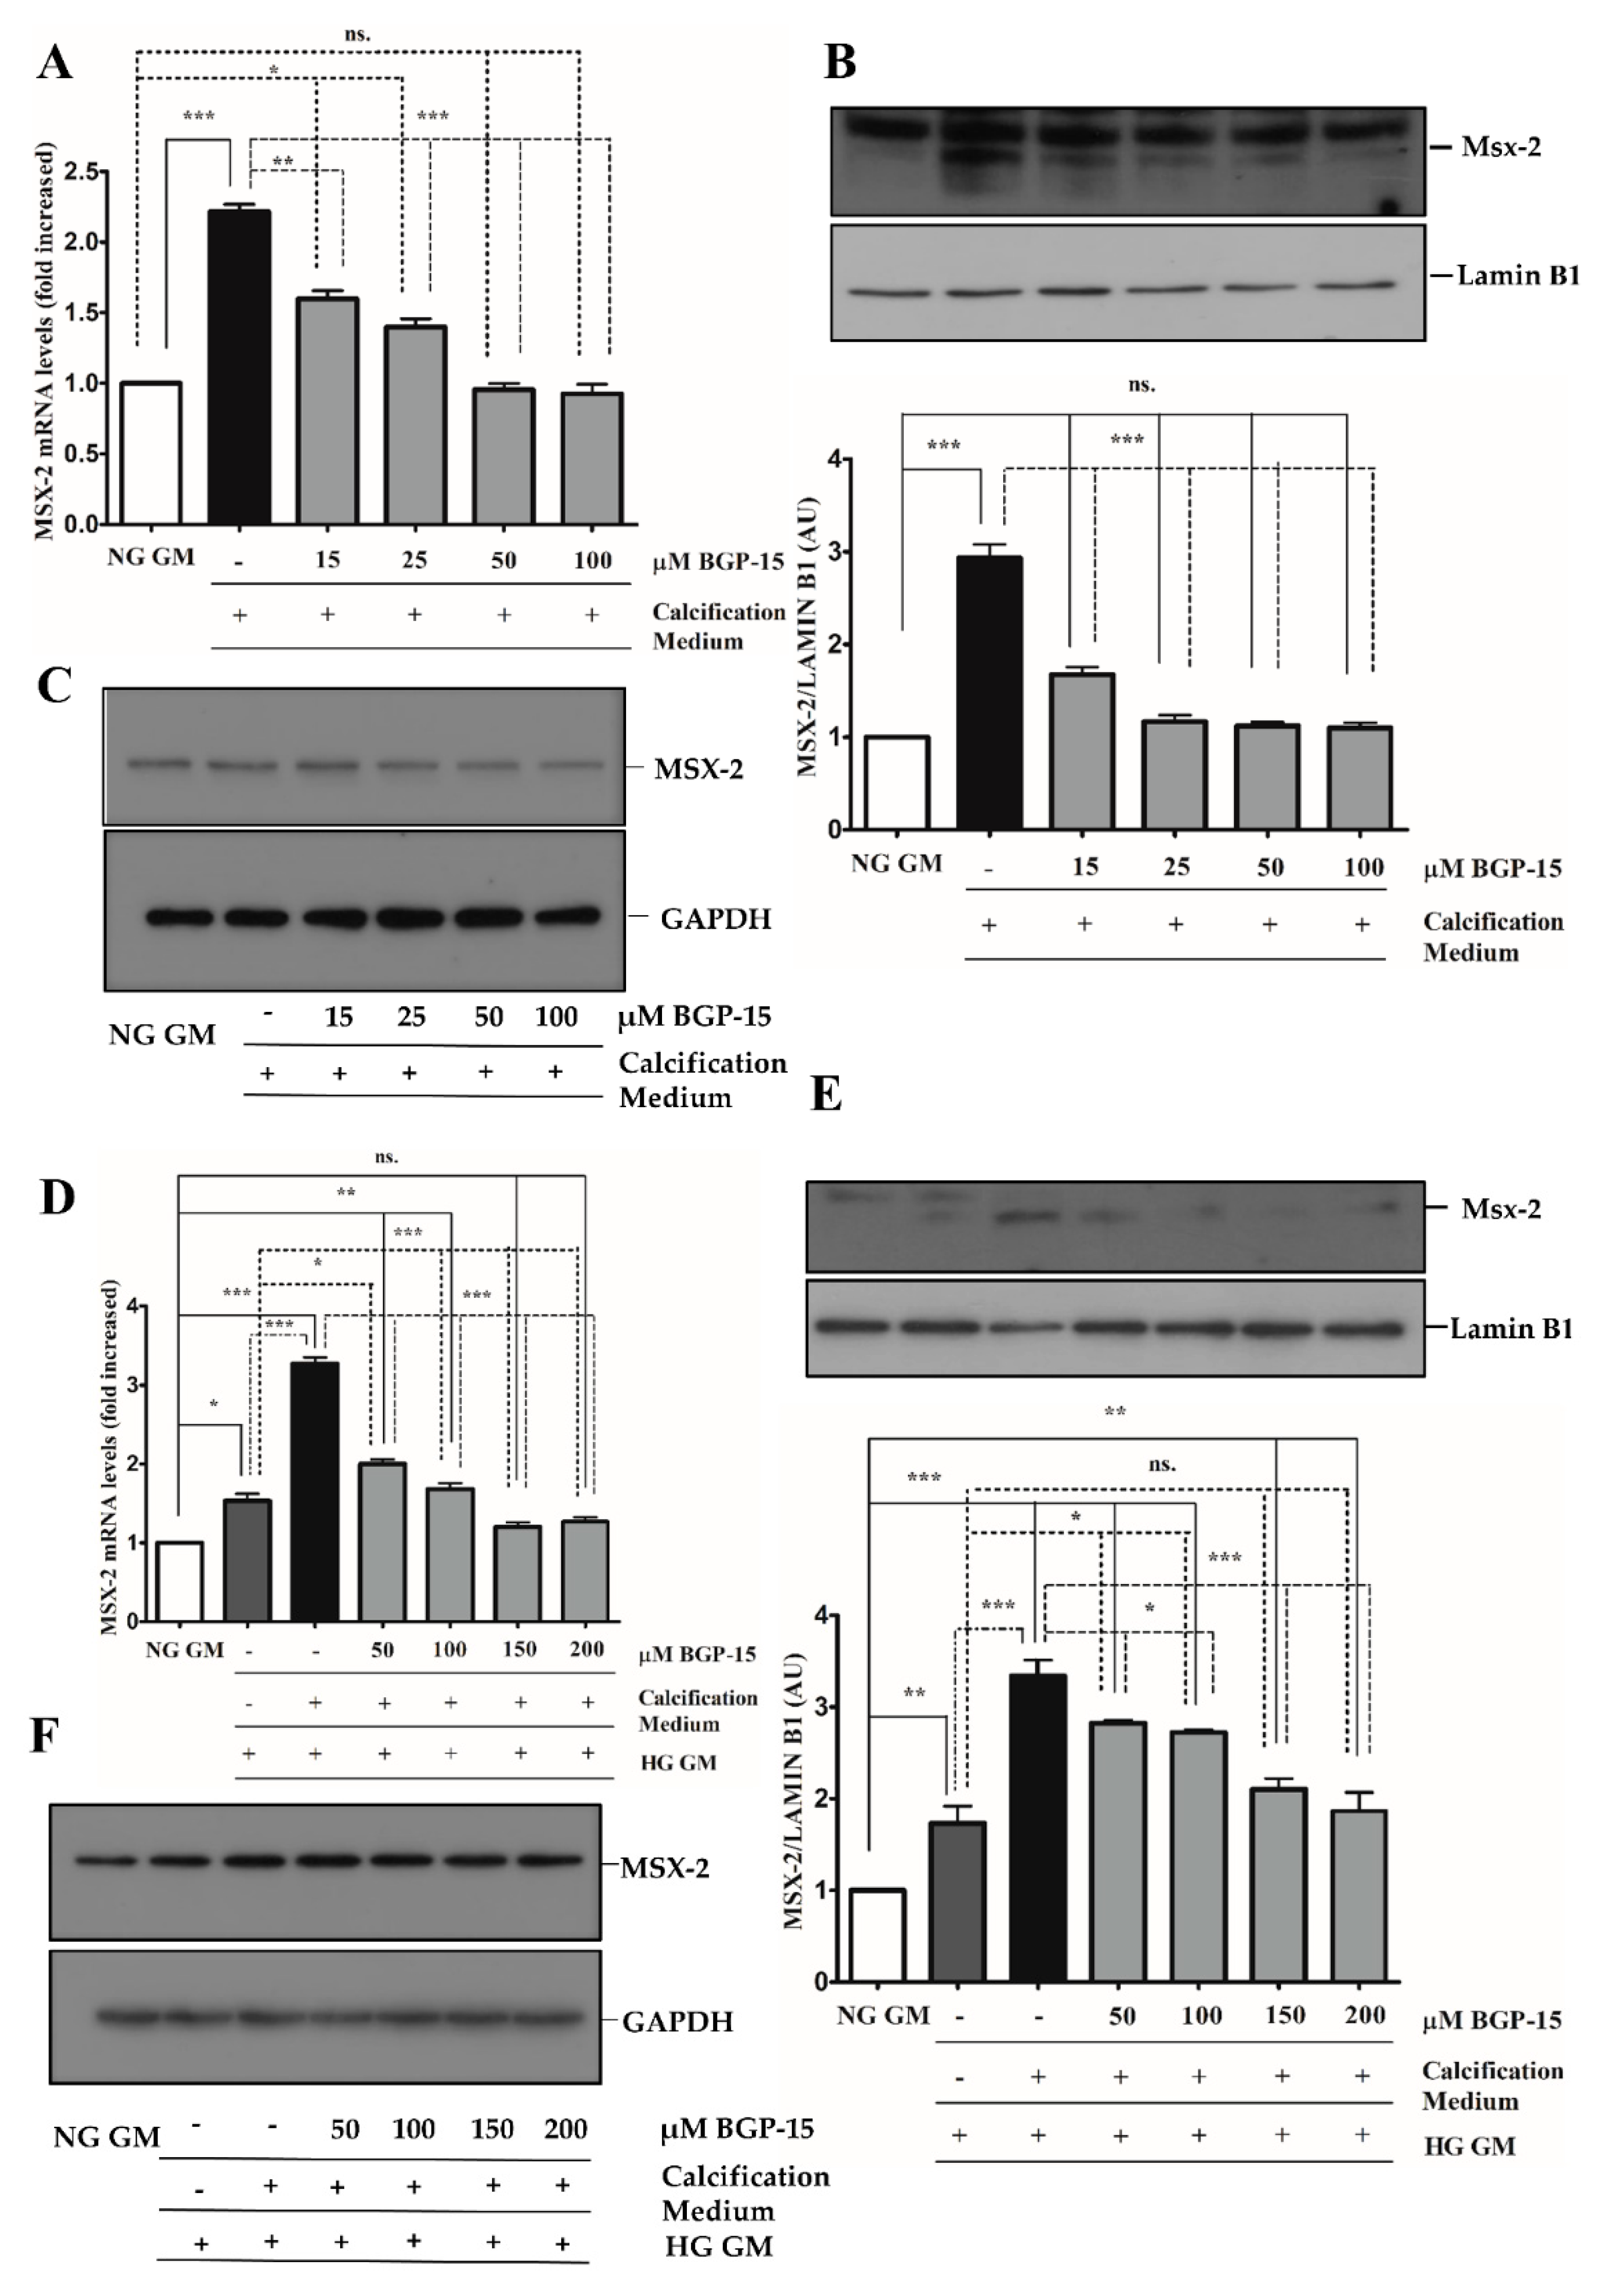
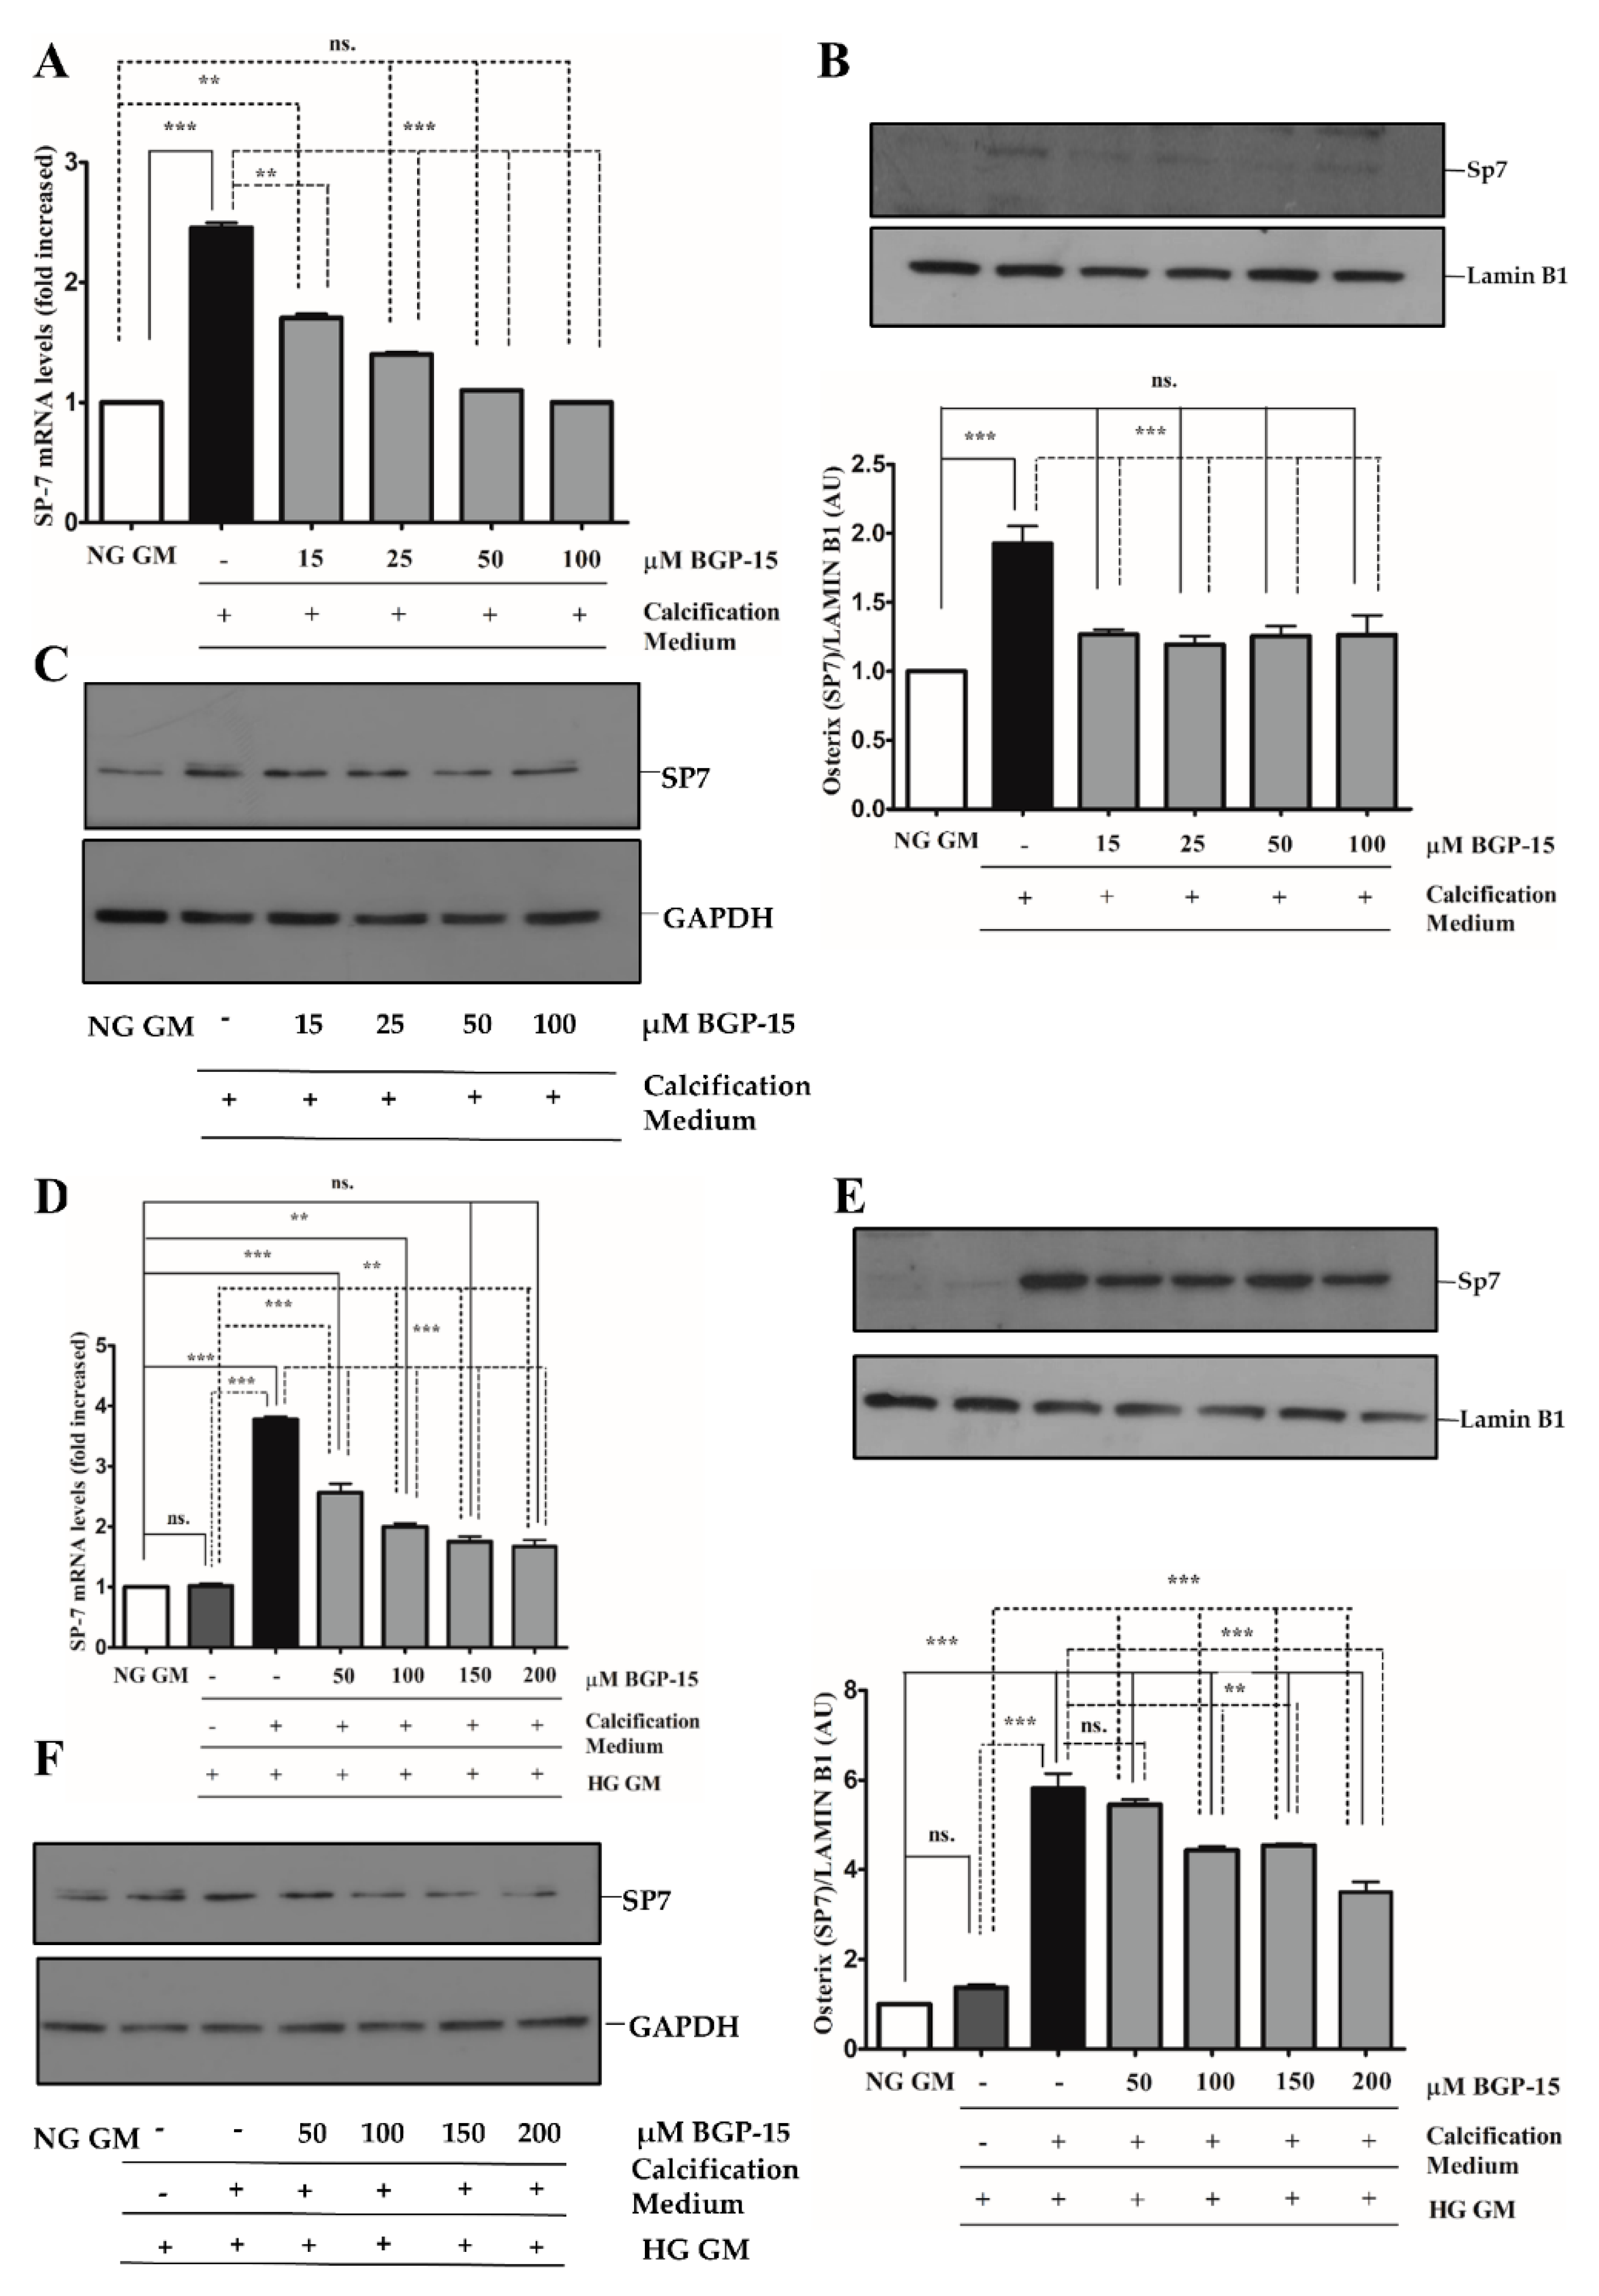
2.4. BGP-15 Inhibited Osteochondrogenic Gene Expression Induced by High Pi in Both NG and HG Conditions
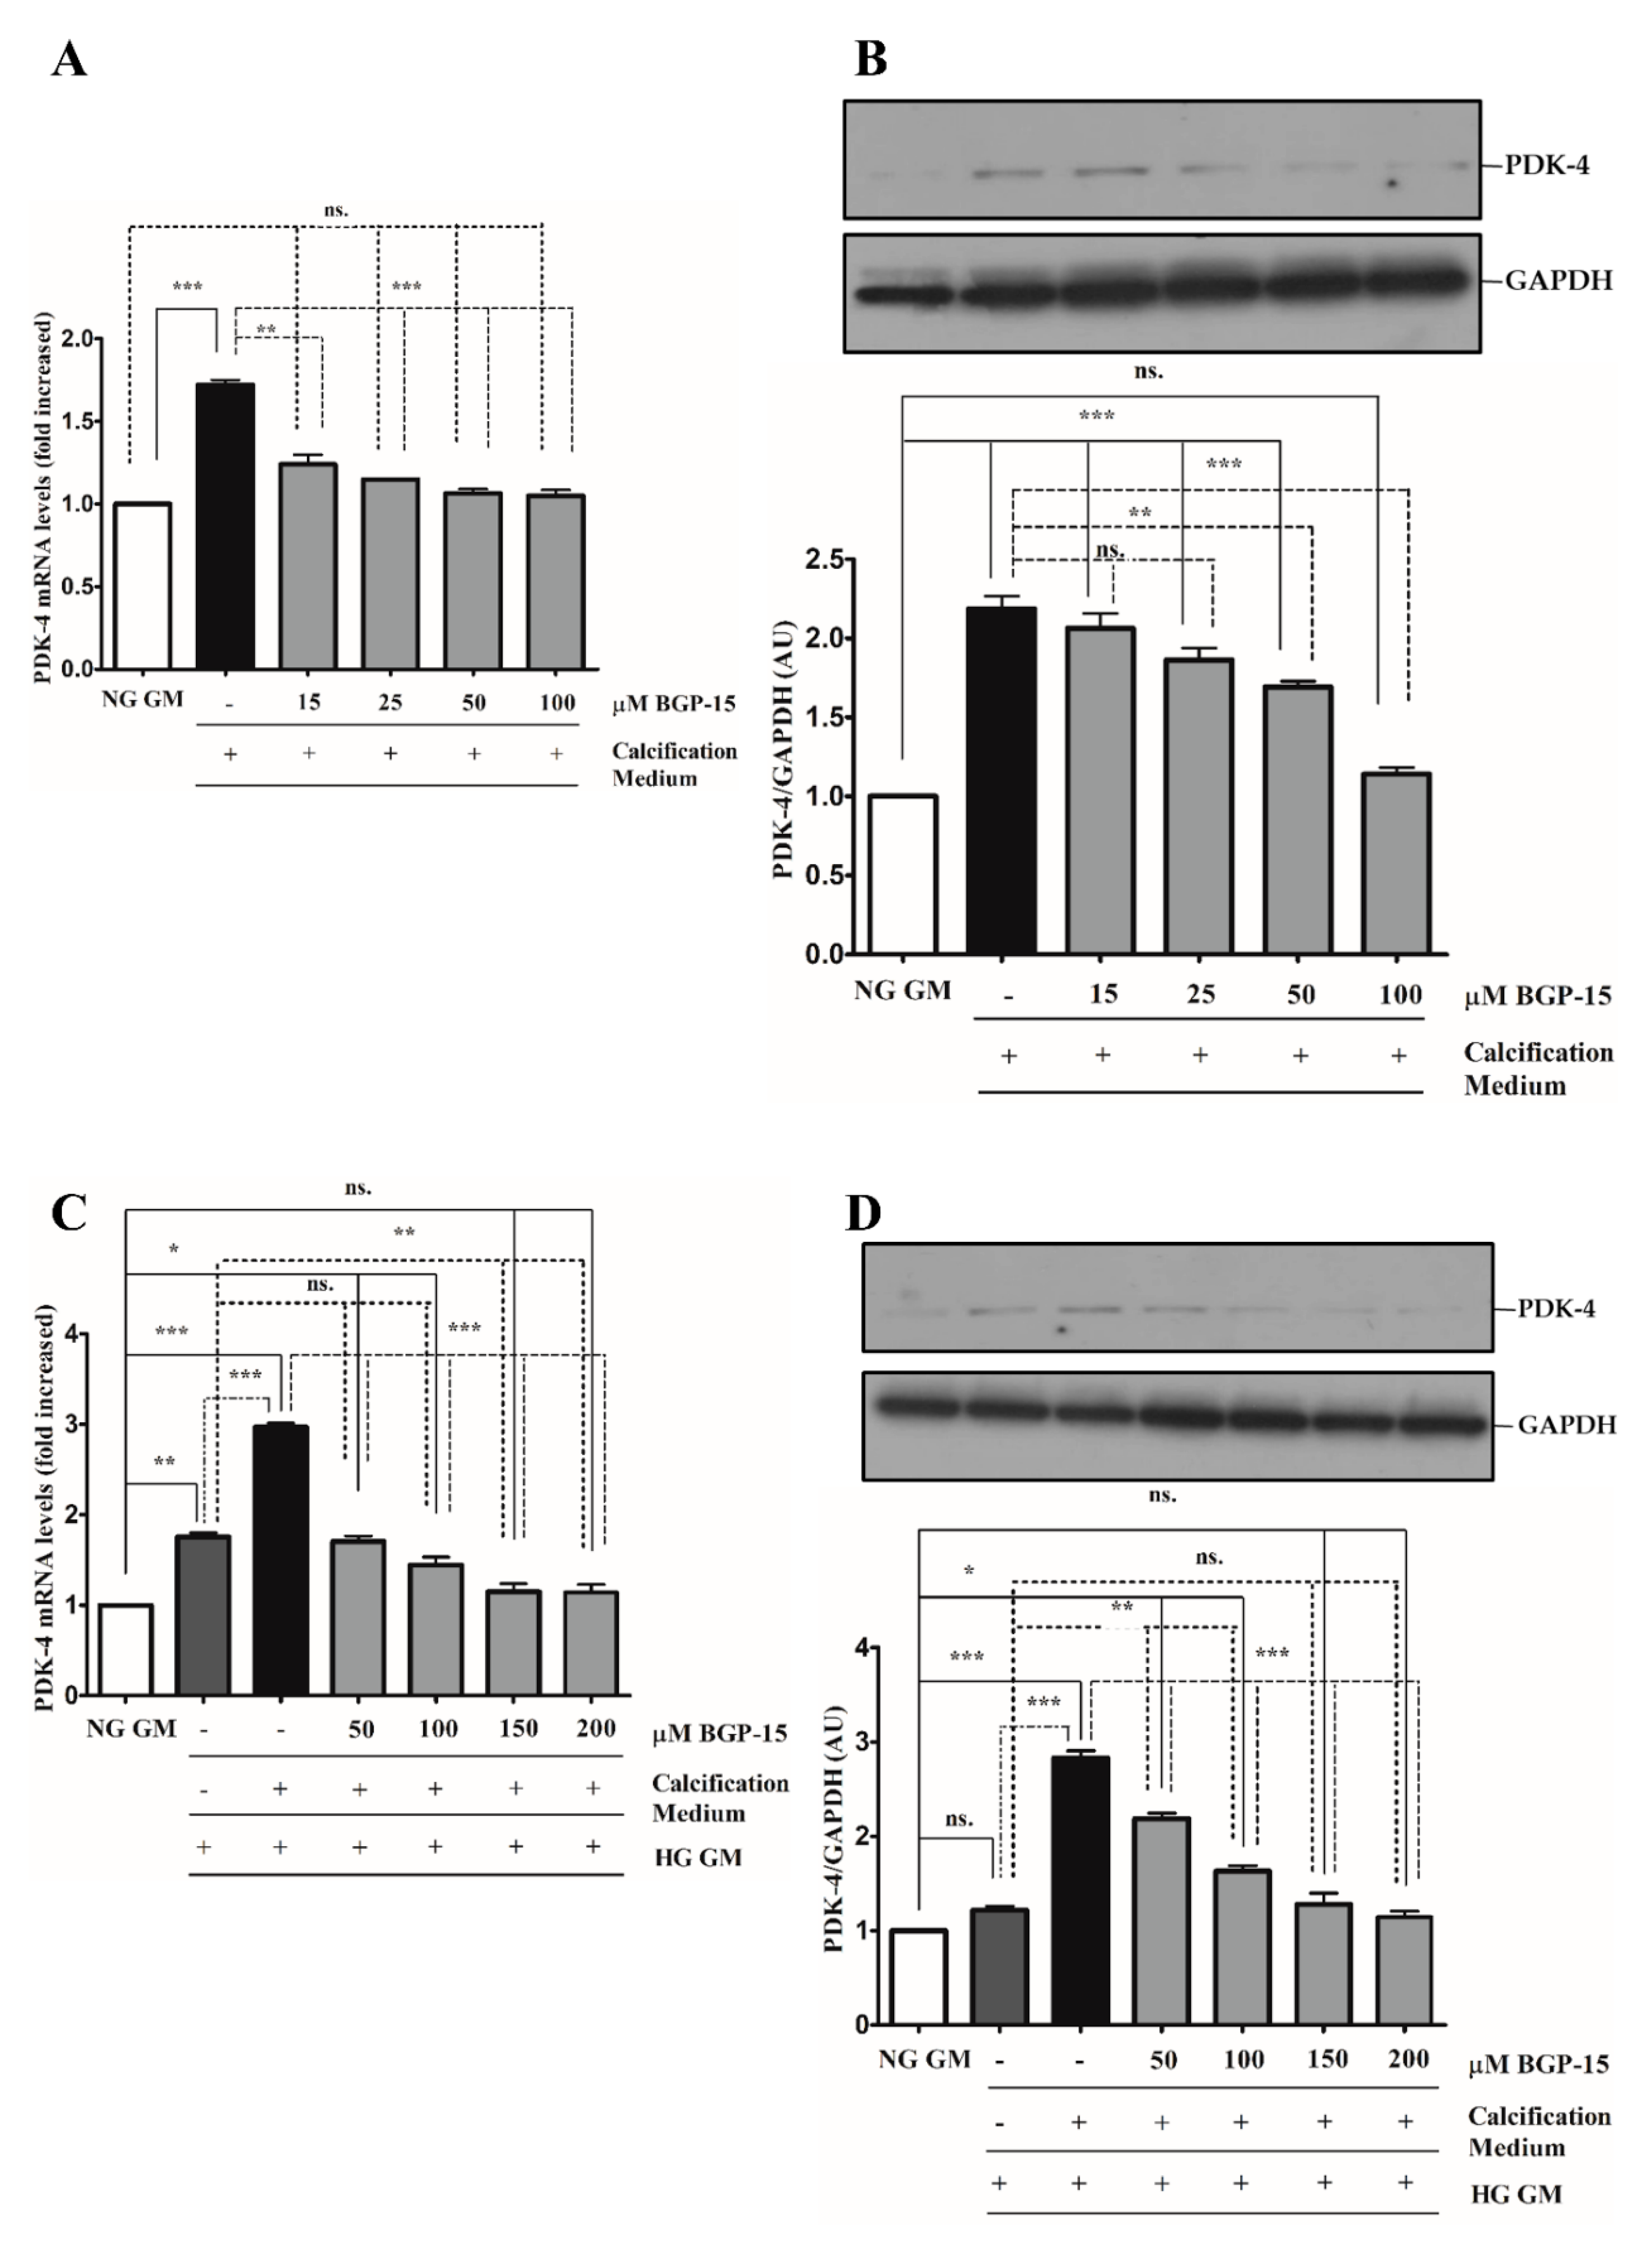
2.5. BGP-15 Inhibited PDK-4 Expression Induced by High Pi in Both NG and HG Conditions during the Osteochondrogenic Transformation of VSMCs to Osteoblast-Like Cells
3. Discussion
4. Materials and Methods
4.1. Reagents
4.2. Cell Culture
4.3. MTT Assay
4.4. Alizarin Red Staining
4.5. Quantification of Calcium Deposition
4.6. Measurement of Intracellular Inorganic Phosphate
4.7. RNA Isolation and Quantitative Reverse Transcription–Polymerase Chain Reaction
4.8. Preparation of Whole-Cell Lysates, Cytosolic and Nuclear Fractions
4.9. Immunoblotting
4.10. Confocal Microscopy
4.11. Isolation of EVs
4.12. Statistical Analysis
Supplementary Materials
Author Contributions
Funding
Institutional Review Board Statement
Informed Consent Statement
Data Availability Statement
Conflicts of Interest
References
- Vos, T.; Allen, C.; Arora, M.; Barber, R.M.; Bhutta, Z.A.; Brown, A.; Carter, A.; Casey, D.C.; Charlson, F.J.; Chen, A.Z.; et al. Global, regional, and national incidence, prevalence, and years lived with disability for 310 diseases and injuries, 1990–2015: A systematic analysis for the Global Burden of Disease Study. Lancet 2016, 388, 1545–1602. [Google Scholar] [CrossRef]
- Mayer-Davis, E.J.; Lawrence, J.; Dabelea, D.; Divers, J.; Isom, S.; Dolan, L.; Imperatore, G.; Linder, B.; Marcovina, S.; Pettitt, D.J.; et al. Incidence Trends of Type 1 and Type 2 Diabetes among Youths, 2002–2012. N. Engl. J. Med. 2017, 376, 1419–1429. [Google Scholar] [CrossRef] [PubMed]
- Stabley, J.N.; Towler, D.A. Arterial Calcification in Diabetes Mellitus. Arter. Thromb. Vasc. Biol. 2017, 37, 205–217. [Google Scholar] [CrossRef]
- Yahagi, K.; Kolodgie, F.D.; Lutter, C.; Mori, H.; Romero, M.E.; Finn, A.V.; Virmani, R. Pathology of Human Coronary and Carotid Artery Atherosclerosis and Vascular Calcification in Diabetes Mellitus. Arter. Thromb. Vasc. Biol. 2017, 37, 191–204. [Google Scholar] [CrossRef]
- Edmonds, M. Medial arterial calcification and diabetes mellitus. Zeitschrift für Kardiologie 2000, 89, S101–S104. [Google Scholar] [CrossRef]
- Manzoor, S.; Ahmed, S.; Ali, A.; Han, K.H.; Sechopoulos, I.; O’Neill, A.; Fei, B.; O’Neill, W.C. Progression of Medial Arterial Calcification in CKD. Kidney Int. Rep. 2018, 3, 1328–1335. [Google Scholar] [CrossRef] [PubMed]
- Chen, N.X.; Moe, S.M. Arterial calcification in diabetes. Curr. Diabetes Rep. 2003, 3, 28–32. [Google Scholar] [CrossRef]
- Neven, E.; De Schutter, T.M.; De Broe, M.E.; D’Haese, P.C. Cell biological and physicochemical aspects of arterial calcification. Kidney Int. 2011, 79, 1166–1177. [Google Scholar] [CrossRef]
- Giachelli, C.M. The emerging role of phosphate in vascular calcification. Kidney Int. 2009, 75, 890–897. [Google Scholar] [CrossRef] [PubMed]
- Tintut, Y.; Hsu, J.J.; Demer, L.L. Lipoproteins in Cardiovascular Calcification: Potential Targets and Challenges. Front. Cardiovasc. Med. 2018, 5, 172. [Google Scholar] [CrossRef]
- Bakhshian Nik, A.; Hutcheson, J.D.; Aikawa, E. Extracellular Vesicles as Mediators of Cardiovascular Calcification. Front. Cardiovasc. Med. 2017, 4, 78. [Google Scholar] [CrossRef]
- Duan, M.; Zhao, W.-L.; Zhou, L.; Novák, P.; Zhu, X.; Yin, K. Omics research in vascular calcification. Clin. Chim. Acta 2020, 511, 198–207. [Google Scholar] [CrossRef] [PubMed]
- Kapustin, A.N.; Chatrou, M.L.; Drozdov, I.; Zheng, Y.; Davidson, S.; Soong, D.; Furmanik, M.; Sanchis, P.; de Rosales, R.T.M.; Alvarez-Hernandez, D.; et al. Vascular Smooth Muscle Cell Calcification Is Mediated by Regulated Exosome Secretion. Circ. Res. 2015, 116, 1312–1323. [Google Scholar] [CrossRef] [PubMed]
- Krohn, J.B.; Hutcheson, J.D.; Martínez-Martínez, E.; Aikawa, E. Extracellular vesicles in cardiovascular calcification: Expanding current paradigms. J. Physiol. 2016, 594, 2895–2903. [Google Scholar] [CrossRef]
- Xiao, Y.; Zheng, L.; Zou, X.; Wang, J.; Zhong, J.; Zhong, T. Extracellular vesicles in type 2 diabetes mellitus: Key roles in pathogenesis, complications, and therapy. J. Extracell. Vesicles 2019, 8, 1625677. [Google Scholar] [CrossRef]
- Găman, M.-A.; Cozma, M.-A.; Dobrică, E.-C.; Crețoiu, S.; Găman, A.; Diaconu, C. Liquid Biopsy and Potential Liquid Biopsy-Based Biomarkers in Philadelphia-Negative Classical Myeloproliferative Neoplasms: A Systematic Review. Life 2021, 11, 677. [Google Scholar] [CrossRef] [PubMed]
- Kestenbaum, B.; Sampson, J.N.; Rudser, K.D.; Patterson, D.J.; Seliger, S.L.; Young, B.; Sherrard, D.J.; Andress, D.L. Serum Phosphate Levels and Mortality Risk among People with Chronic Kidney Disease. J. Am. Soc. Nephrol. 2004, 16, 520–528. [Google Scholar] [CrossRef]
- Cancela, A.L.E.; Santos, R.D.; Titan, S.M.; Goldenstein, P.T.; Rochitte, C.E.; Lemos, P.; Dos Reis, L.; Graciolli, F.G.; Jorgetti, V.; Moyses, R. Phosphorus Is Associated with Coronary Artery Disease in Patients with Preserved Renal Function. PLoS ONE 2012, 7, e36883. [Google Scholar] [CrossRef]
- Finch, J.L.; Lee, D.H.; Liapis, H.; Ritter, C.; Zhang, S.; Suarez, E.; Ferder, L.; Slatopolsky, E. Phosphate restriction significantly reduces mortality in uremic rats with established vascular calcification. Kidney Int. 2013, 84, 1145–1153. [Google Scholar] [CrossRef]
- Roman-Garcia, P.; Carrillo-Lopez, N.; Fernandez-Martin, J.L.; Naves-Díaz, M.; Ruiz-Torres, M.P.; Cannata-Andía, J.B. High phosphorus diet induces vascular calcification, a related decrease in bone mass and changes in the aortic gene expression. Bone 2010, 46, 121–128. [Google Scholar] [CrossRef]
- Wang, P.; Zhou, P.; Chen, W.; Peng, D. Combined effects of hyperphosphatemia and hyperglycemia on the calcification of cultured human aortic smooth muscle cells. Exp. Ther. Med. 2018, 17, 863–868. [Google Scholar] [CrossRef]
- Chen, N.X.; Duan, D.; O’Neill, K.D.; Moe, S.M. High glucose increases the expression of Cbfa1 and BMP-2 and enhances the calcification of vascular smooth muscle cells. Nephrol. Dial. Transplant. 2006, 21, 3435–3442. [Google Scholar] [CrossRef]
- Thomas, M.; Brownlee, M.; Susztak, K.; Sharma, K.; Jandeleit-Dahm, K.A.M.; Zoungas, S.; Rossing, P.; Groop, P.-H.; Cooper, M.E. Diabetic kidney disease. Nat. Rev. Dis. Prim. 2015, 1, 1–20. [Google Scholar] [CrossRef] [PubMed]
- Russo, D.; Morrone, L.F.P.; Imbriaco, M.; Pota, A.; Russo, L.; Scognamiglio, B.; Sorrentino, R. Coronary Artery Calcification and Outcomes in Diabetic Patients with and without Chronic Kidney Disease. Blood Purif. 2013, 36, 17–20. [Google Scholar] [CrossRef] [PubMed]
- Găman, M.-A.; Cozma, M.-A.; Dobrică, E.-C.; Bacalbașa, N.; Bratu, O.G.; Diaconu, C.C. Dyslipidemia: A Trigger for Coronary Heart Disease in Romanian Patients with Diabetes. Metabolites 2020, 10, 195. [Google Scholar] [CrossRef]
- Găman, M.-A.; Epîngeac, M.E.; Diaconu, C.C.; Găman, A.M. Evaluation of oxidative stress levels in obesity and diabetes by the free oxygen radical test and free oxygen radical defence assays and correlations with anthropometric and laboratory parameters. World J. Diabetes 2020, 11, 193–201. [Google Scholar] [CrossRef] [PubMed]
- Zhang, J.; Zheng, B.; Zhou, P.; Zhang, R.; He, M.; Yang, Z.; Wen, J. Vascular calcification is coupled with phenotypic conversion of vascular smooth muscle cells through Klf5-mediated transactivation of the Runx2 promoter. Biosci. Rep. 2014, 34, 663–672. [Google Scholar] [CrossRef] [PubMed]
- Steitz, S.A.; Speer, M.Y.; Curinga, G.; Yang, H.-Y.; Haynes, P.; Aebersold, R.; Schinke, T.; Karsenty, G.; Giachelli, C.M. Smooth Muscle Cell Phenotypic Transition Associated With Calcification. Circ. Res. 2001, 89, 1147–1154. [Google Scholar] [CrossRef]
- Peng, Y.; Shi, K.; Wang, L.; Lu, J.; Li, H.; Pan, S.; Ma, C. Characterization of Osterix Protein Stability and Physiological Role in Osteoblast Differentiation. PLoS ONE 2013, 8, e56451. [Google Scholar] [CrossRef]
- Shao, J.-S.; Cheng, S.-L.; Pingsterhaus, J.M.; Charlton-Kachigian, N.; Loewy, A.P.; Towler, D.A. Msx2 promotes cardiovascular calcification by activating paracrine Wnt signals. J. Clin. Investig. 2005, 115, 1210–1220. [Google Scholar] [CrossRef]
- Li, X.; Yang, H.-Y.; Giachelli, C.M. BMP-2 promotes phosphate uptake, phenotypic modulation, and calcification of human vascular smooth muscle cells. Atherosclerosis 2008, 199, 271–277. [Google Scholar] [CrossRef]
- Lee, S.J.; Jeong, J.Y.; Oh, C.J.; Park, S.; Kim, J.-Y.; Kim, H.-J.; Kim, N.D.; Choi, Y.-K.; Do, J.-Y.; Go, Y.; et al. Pyruvate Dehydrogenase Kinase 4 Promotes Vascular Calcification via SMAD1/5/8 Phosphorylation. Sci. Rep. 2015, 5, 1–17. [Google Scholar] [CrossRef]
- Ma, W.-Q.; Sun, X.-J.; Zhu, Y.; Liu, N.-F. PDK4 promotes vascular calcification by interfering with autophagic activity and metabolic reprogramming. Cell Death Dis. 2020, 11, 991. [Google Scholar] [CrossRef] [PubMed]
- Pető, Á.; Kósa, D.; Fehér, P.; Ujhelyi, Z.; Sinka, D.; Vecsernyés, M.; Szilvássy, Z.; Juhász, B.; Csanádi, Z.; Vígh, L.; et al. Pharmacological Overview of the BGP-15 Chemical Agent as a New Drug Candidate for the Treatment of Symptoms of Metabolic Syndrome. Molecules 2020, 25, 429. [Google Scholar] [CrossRef] [PubMed]
- Literáti-Nagy, B.; Kulcsár, E.; Literáti-Nagy, Z.; Buday, B.; Tory, K.; Kolonics, A.; Fleming, A.; Mandl, J.; Korányi, L.; Péterfai, É.; et al. Improvement of Insulin Sensitivity by a Novel Drug, BGP-15, in Insulin-resistant Patients: A Proof of Concept Randomized Double-blind Clinical Trial. Horm. Metab. Res. 2009, 41, 374–380. [Google Scholar] [CrossRef] [PubMed]
- Literáti-Nagy, B.; Tory, K.; Peitl, B.; Bajza, Á.; Korányi, L.; Literáti-Nagy, Z.; Hooper, P.L.; Vígh, L.; Szilvássy, Z. Improvement of Insulin Sensitivity by a Novel Drug Candidate, BGP-15, in Different Animal Studies. Metab. Syndr. Relat. Disord. 2014, 12, 125–131. [Google Scholar] [CrossRef] [PubMed]
- Bombicz, M.; Priksz, D.; Gesztelyi, R.; Kiss, R.; Hollos, N.; Varga, B.; Nemeth, J.; Toth, A.; Papp, Z.; Szilvassy, Z.; et al. The Drug Candidate BGP-15 Delays the Onset of Diastolic Dysfunction in the Goto-Kakizaki Rat Model of Diabetic Cardiomyopathy. Molecules 2019, 24, 586. [Google Scholar] [CrossRef]
- Wachal, Z.; Bombicz, M.; Priksz, D.; Hegedűs, C.; Kovács, D.; Szabó, A.M.; Kiss, R.; Németh, J.; Juhász, B.; Szilvássy, Z.; et al. Retinoprotection by BGP-15, a Hydroximic Acid Derivative, in a Type II Diabetic Rat Model Compared to Glibenclamide, Metformin, and Pioglitazone. Int. J. Mol. Sci. 2020, 21, 2124. [Google Scholar] [CrossRef]
- Li, X.; Yang, H.-Y.; Giachelli, C.M. Role of the Sodium-Dependent Phosphate Cotransporter, Pit-1, in Vascular Smooth Muscle Cell Calcification. Circ. Res. 2006, 98, 905–912. [Google Scholar] [CrossRef]
- Schurgin, S.; Rich, S.; Mazzone, T. Increased Prevalence of Significant Coronary Artery Calcification in Patients with Diabetes. Diabetes Care 2001, 24, 335–338. [Google Scholar] [CrossRef]
- Everhart, J.E.; Pettitt, D.J.; Knowler, W.C.; Rose, F.A.; Bennett, P.H. Medial arterial calcification and its association with mortality and complications of diabetes. Diabetologia 1988, 31, 16–23. [Google Scholar] [CrossRef]
- Zavaczki, E.; Jeney, V.; Agarwal, A.; Zarjou, A.; Oros, M.; Katkó, M.; Varga, Z.; Balla, G.; Balla, J. Hydrogen sulfide inhibits the calcification and osteoblastic differentiation of vascular smooth muscle cells. Kidney Int. 2011, 80, 731–739. [Google Scholar] [CrossRef]
- Nagy, A.; Pethő, D.; Gáll, T.; Zavaczki, E.; Nyitrai, M.; Posta, J.; Zarjou, A.; Agarwal, A.; Balla, G.; Balla, J. Zinc Inhibits HIF-Prolyl Hydroxylase Inhibitor-Aggravated VSMC Calcification Induced by High Phosphate. Front. Physiol. 2020, 10, 1584. [Google Scholar] [CrossRef]
- Zhou, Y.-B.; Zhou, H.; Li, L.; Kang, Y.; Cao, X.; Wu, Z.-Y.; Ding, L.; Sethi, G.; Bian, J.-S. Hydrogen Sulfide Prevents Elastin Loss and Attenuates Calcification Induced by High Glucose in Smooth Muscle Cells through Suppression of Stat3/Cathepsin S Signaling Pathway. Int. J. Mol. Sci. 2019, 20, 4202. [Google Scholar] [CrossRef] [PubMed]
- Liu, J.; Xie, X.; Yan, D.; Wang, Y.; Yuan, H.; Cai, Y.; Luo, J.; Xu, A.; Huang, Y.; Cheung, C.W.; et al. Up-regulation of FoxO1 contributes to adverse vascular remodelling in type 1 diabetic rats. J. Cell. Mol. Med. 2020, 24, 13727–13738. [Google Scholar] [CrossRef] [PubMed]
- An, X.-R.; Li, X.; Wei, W.; Li, X.-X.; Xu, M. Prostaglandin E1 Inhibited Diabetes-Induced Phenotypic Switching of Vascular Smooth Muscle Cells Through Activating Autophagy. Cell. Physiol. Biochem. 2018, 50, 745–756. [Google Scholar] [CrossRef]
- Wang, W.; Zhang, Y.; Wang, L.; Li, J.; Li, Y.; Yang, X.; Wu, Y. mircroRNA-152 prevents the malignant progression of atherosclerosis via down-regulation of KLF5. Biomed. Pharmacother. 2019, 109, 2409–2414. [Google Scholar] [CrossRef]
- Cheng, S.-L.; Behrmann, A.; Shao, J.-S.; Ramachandran, B.; Krchma, K.; Arredondo, Y.B.; Kovacs, A.; Mead, M.; Maxson, R.; Towler, D.A. Targeted Reduction of Vascular Msx1 and Msx2 Mitigates Arteriosclerotic Calcification and Aortic Stiffness in LDLR-Deficient Mice Fed Diabetogenic Diets. Diabetes 2014, 63, 4326–4337. [Google Scholar] [CrossRef]
- Gong, C.; Li, L.; Qin, C.; Wu, W.; Liu, Q.; Li, Y.; Gan, L.; Ou, S. The Involvement of Notch1-RBP-Jk/Msx2 Signaling Pathway in Aortic Calcification of Diabetic Nephropathy Rats. J. Diabetes Res. 2017, 2017, 1–11. [Google Scholar] [CrossRef] [PubMed]
- Zhang, M.; Sara, J.D.; Wang, F.-L.; Liu, L.-P.; Su, L.-X.; Zhe, J.; Wu, X.; Liu, J.-H. Increased plasma BMP-2 levels are associated with atherosclerosis burden and coronary calcification in type 2 diabetic patients. Cardiovasc. Diabetol. 2015, 14, 1–9. [Google Scholar] [CrossRef]
- Gong, Y.-C.; He, Y.; Wang, H.; Niu, W.-Q.; Ji, K.-D.; Li, H. Silencing of osterix expression by siRNA inhibits aldosterone-induced calcification of vascular smooth muscle cells in mice. Mol. Med. Rep. 2016, 14, 2111–2118. [Google Scholar] [CrossRef] [PubMed]
- Wu, P.; Sato, J.; Zhao, Y.; Jaskiewicz, J.; Popov, M.K.; Harris, A.R. Starvation and diabetes increase the amount of pyruvate dehydrogenase kinase isoenzyme 4 in rat heart. Biochem. J. 1998, 329, 197–201. [Google Scholar] [CrossRef]
- Tao, R.; Xiong, X.; Harris, R.A.; White, M.F.; Dong, X.C. Genetic Inactivation of Pyruvate Dehydrogenase Kinases Improves Hepatic Insulin Resistance Induced Diabetes. PLoS ONE 2013, 8, e71997. [Google Scholar] [CrossRef]
- Jeoung, N.H.; Harris, R.A. Pyruvate dehydrogenase kinase-4 deficiency lowers blood glucose and improves glucose tolerance in diet-induced obese mice. Am. J. Physiol. Metab. 2008, 295, E46–E54. [Google Scholar] [CrossRef]
- Luo, G.; Ducy, P.; McKee, M.D.; Pinero, G.J.; Loyer, E.; Behringer, R.R.; Karsenty, G. Spontaneous calcification of arteries and cartilage in mice lacking matrix GLA protein. Nature 1997, 386, 78–81. [Google Scholar] [CrossRef] [PubMed]
- Epstein, M. Matrix Gla-Protein (MGP) Not Only Inhibits Calcification in Large Arteries But Also May Be Renoprotective: Connecting the Dots. EBioMedicine 2016, 4, 16–17. [Google Scholar] [CrossRef][Green Version]
- Reynolds, J.L.; Joannides, A.J.; Skepper, J.N.; McNair, R.; Schurgers, L.J.; Proudfoot, D.; Jahnen-Dechent, W.; Weissberg, P.L.; Shanahan, C.M. Human Vascular Smooth Muscle Cells Undergo Vesicle-Mediated Calcification in Response to Changes in Extracellular Calcium and Phosphate Concentrations: A Potential Mechanism for Accelerated Vascular Calcification in ESRD. J. Am. Soc. Nephrol. 2004, 15, 2857–2867. [Google Scholar] [CrossRef] [PubMed]
- Kapustin, A.N.; Davies, J.D.; Reynolds, J.L.; McNair, R.; Jones, G.T.; Sidibe, A.; Schurgers, L.J.; Skepper, J.N.; Proudfoot, D.; Mayr, M.; et al. Calcium Regulates Key Components of Vascular Smooth Muscle Cell–Derived Matrix Vesicles to Enhance Mineralization. Circ. Res. 2011, 109, e1–e12. [Google Scholar] [CrossRef]
- Chen, N.X.; O’Neill, K.D.; Chen, X.; Moe, S.M. Annexin-Mediated Matrix Vesicle Calcification in Vascular Smooth Muscle Cells. J. Bone Miner. Res. 2008, 23, 1798–1805. [Google Scholar] [CrossRef] [PubMed]
- Lee, J.; Hong, S.-W.; Kim, M.-J.; Kwon, H.; Park, S.E.; Rhee, E.-J.; Lee, W.-Y. Metformin, resveratrol, and exendin-4 inhibit high phosphate-induced vascular calcification via AMPK-RANKL signaling. Biochem. Biophys. Res. Commun. 2020, 530, 374–380. [Google Scholar] [CrossRef] [PubMed]
- Ma, W.-Q.; Sun, X.-J.; Wang, Y.; Zhu, Y.; Han, X.-Q.; Liu, N.-F. Restoring mitochondrial biogenesis with metformin attenuates β-GP-induced phenotypic transformation of VSMCs into an osteogenic phenotype via inhibition of PDK4/oxidative stress-mediated apoptosis. Mol. Cell. Endocrinol. 2019, 479, 39–53. [Google Scholar] [CrossRef] [PubMed]
- Gao, M.; Chen, T.; Wu, L.; Zhao, X.; Mao, H.; Xing, C. Effect of pioglitazone on the calcification of rat vascular smooth muscle cells through the downregulation of the Wnt/β-catenin signaling pathway. Mol. Med. Rep. 2017, 16, 6208–6213. [Google Scholar] [CrossRef] [PubMed]


Publisher’s Note: MDPI stays neutral with regard to jurisdictional claims in published maps and institutional affiliations. |
© 2021 by the authors. Licensee MDPI, Basel, Switzerland. This article is an open access article distributed under the terms and conditions of the Creative Commons Attribution (CC BY) license (https://creativecommons.org/licenses/by/4.0/).
Share and Cite
Nagy, A.; Pethő, D.; Gesztelyi, R.; Juhász, B.; Balla, G.; Szilvássy, Z.; Balla, J.; Gáll, T. BGP-15 Inhibits Hyperglycemia-Aggravated VSMC Calcification Induced by High Phosphate. Int. J. Mol. Sci. 2021, 22, 9263. https://doi.org/10.3390/ijms22179263
Nagy A, Pethő D, Gesztelyi R, Juhász B, Balla G, Szilvássy Z, Balla J, Gáll T. BGP-15 Inhibits Hyperglycemia-Aggravated VSMC Calcification Induced by High Phosphate. International Journal of Molecular Sciences. 2021; 22(17):9263. https://doi.org/10.3390/ijms22179263
Chicago/Turabian StyleNagy, Annamária, Dávid Pethő, Rudolf Gesztelyi, Béla Juhász, György Balla, Zoltán Szilvássy, József Balla, and Tamás Gáll. 2021. "BGP-15 Inhibits Hyperglycemia-Aggravated VSMC Calcification Induced by High Phosphate" International Journal of Molecular Sciences 22, no. 17: 9263. https://doi.org/10.3390/ijms22179263
APA StyleNagy, A., Pethő, D., Gesztelyi, R., Juhász, B., Balla, G., Szilvássy, Z., Balla, J., & Gáll, T. (2021). BGP-15 Inhibits Hyperglycemia-Aggravated VSMC Calcification Induced by High Phosphate. International Journal of Molecular Sciences, 22(17), 9263. https://doi.org/10.3390/ijms22179263