
The Changes in the p53 Protein across the Animal Kingdom Point to Its Involvement in Longevity

 ,
,  ,
, 

 and
and 
Abstract
1. Introduction
2. Results
3. Discussion
4. Materials and Methods
4.1. Searches of Maximal Lifespan
4.2. Protein Similarity Searches
4.3. Transcriptome Assemblies
4.4. p53 Protein Tree and Real Phylogenetic Tree Construction
4.5. Prediction and Statistical Evaluation Using PROVEAN
4.6. Modeling of 3D Protein Structures
4.7. Correlation of the Maximal Lifespan and Alterations within the p53 Core Domain in Vertebrates
4.8. Convergent Evolution
4.9. Gene Gain and Losses
5. Conclusions
Supplementary Materials
Author Contributions
Funding
Institutional Review Board Statement
Informed Consent Statement
Data Availability Statement
Acknowledgments
Conflicts of Interest
References
- Whittemore, K.; Vera, E.; Martínez-Nevado, E.; Sanpera, C.; Blasco, M.A. Telomere Shortening Rate Predicts Species Life Span. Proc. Natl. Acad. Sci. USA 2019, 116, 15122–15127. [Google Scholar] [CrossRef]
- Hughes, B.G.; Hekimi, S. Many Possible Maximum Lifespan Trajectories. Nature 2017, 546, E8. [Google Scholar] [CrossRef] [PubMed]
- Barbi, E.; Lagona, F.; Marsili, M.; Vaupel, J.W.; Wachter, K.W. The Plateau of Human Mortality: Demography of Longevity Pioneers. Science 2018, 360, 1459–1461. [Google Scholar] [CrossRef] [PubMed]
- Hägg, S.; Jylhävä, J. Sex Differences in Biological Aging with a Focus on Human Studies. eLife 2021, 10, e63425. [Google Scholar] [CrossRef] [PubMed]
- Harman, D. Aging: A Theory Based on Free Radical and Radiation Chemistry. J. Gerontol. 1956, 11, 298–300. [Google Scholar] [CrossRef] [PubMed]
- Sohal, R.S.; Weindruch, R. Oxidative Stress, Caloric Restriction, and Aging. Science 1996, 273, 59–63. [Google Scholar] [CrossRef] [PubMed]
- Storci, G.; Carolis, S.D.; Papi, A.; Bacalini, M.G.; Gensous, N.; Marasco, E.; Tesei, A.; Fabbri, F.; Arienti, C.; Zanoni, M.; et al. Genomic Stability, Anti-Inflammatory Phenotype, and up-Regulation of the RNAseH2 in Cells from Centenarians. Cell Death Differ. 2019, 26, 1845–1858. [Google Scholar] [CrossRef]
- Campisi, J. Senescent Cells, Tumor Suppression, and Organismal Aging: Good Citizens, Bad Neighbors. Cell 2005, 120, 513–522. [Google Scholar] [CrossRef] [PubMed]
- Bennett, W.P.; Hussain, S.P.; Vahakangas, K.H.; Khan, M.A.; Shields, P.G.; Harris, C.C. Molecular Epidemiology of Human Cancer Risk: Gene–Environment Interactions and p53 Mutation Spectrum in Human Lung Cancer. J. Pathol. 1999, 187, 8–18. [Google Scholar] [CrossRef]
- Kandoth, C.; McLellan, M.D.; Vandin, F.; Ye, K.; Niu, B.; Lu, C.; Xie, M.; Zhang, Q.; McMichael, J.F.; Wyczalkowski, M.A. Mutational Landscape and Significance across 12 Major Cancer Types. Nature 2013, 502, 333–339. [Google Scholar] [CrossRef]
- Levine, A.J.; Oren, M. The First 30 Years of p53: Growing Ever More Complex. Nat. Rev. Cancer 2009, 9, 749–758. [Google Scholar] [CrossRef]
- Petitjean, A.; Mathe, E.; Kato, S.; Ishioka, C.; Tavtigian, S.V.; Hainaut, P.; Olivier, M. Impact of Mutant p53 Functional Properties on Tp53 Mutation Patterns and Tumor Phenotype: Lessons from Recent Developments in the IARC Tp53 Database. Hum. Mutat. 2007, 28, 622–629. [Google Scholar] [CrossRef] [PubMed]
- Bray, F.; Ferlay, J.; Soerjomataram, I.; Siegel, R.L.; Torre, L.A.; Jemal, A. Global Cancer Statistics 2018: GLOBOCAN Estimates of Incidence and Mortality Worldwide for 36 Cancers in 185 Countries. A Cancer J. Clin. 2018, 68, 394–424. [Google Scholar] [CrossRef] [PubMed]
- Timmis, A.; Townsend, N.; Gale, C.; Grobbee, R.; Maniadakis, N.; Flather, M.; Wilkins, E.; Wright, L.; Vos, R.; Bax, J. European Society of Cardiology: Cardiovascular Disease Statistics 2017. Eur. Heart J. 2018, 39, 508–579. [Google Scholar] [CrossRef]
- Schmidt-Kastner, P.K.; Jardine, K.; Cormier, M.; McBurney, M.W. Absence of p53-Dependent Cell Cycle Regulation in Pluripotent Mouse Cell Lines. Oncogene 1998, 16, 3003–3011. [Google Scholar] [CrossRef] [PubMed]
- Stiewe, T.; Haran, T.E. How Mutations Shape p53 Interactions with the Genome to Promote Tumorigenesis and Drug Resistance. Drug Resist. Updates 2018, 38, 27–43. [Google Scholar] [CrossRef]
- Levine, A.J. p53, the Cellular Gatekeeper for Growth and Division. Cell 1997, 88, 323–331. [Google Scholar] [CrossRef]
- Rufini, A.; Tucci, P.; Celardo, I.; Melino, G. Senescence and Aging: The Critical Roles of p53. Oncogene 2013, 32, 5129. [Google Scholar] [CrossRef]
- Sabapathy, K.; Lane, D.P. Therapeutic Targeting of p53: All Mutants Are Equal, but Some Mutants Are More Equal than Others. Nat. Rev. Clin. Oncol. 2018, 15, 13. [Google Scholar] [CrossRef]
- Vousden, K.H.; Lane, D.P. p53 in Health and Disease. Nat. Rev. Mol. Cell Biol. 2007, 8, 275–283. [Google Scholar] [CrossRef]
- Chen, J. The Cell-Cycle Arrest and Apoptotic Functions of p53 in Tumor Initiation and Progression. Cold Spring Harb. Perspect. Med. 2016, 6, a026104. [Google Scholar] [CrossRef] [PubMed]
- Hafner, A.; Bulyk, M.L.; Jambhekar, A.; Lahav, G. The Multiple Mechanisms That Regulate p53 Activity and Cell Fate. Nat. Rev. Mol. Cell Biol. 2019, 20, 199–210. [Google Scholar] [CrossRef] [PubMed]
- Aubrey, B.J.; Kelly, G.L.; Janic, A.; Herold, M.J.; Strasser, A. How Does p53 Induce Apoptosis and How Does This Relate to p53-Mediated Tumour Suppression? Cell Death Differ. 2018, 25, 104–113. [Google Scholar] [CrossRef]
- Pfaff, M.J.; Mukhopadhyay, S.; Hoofnagle, M.; Chabasse, C.; Sarkar, R. Tumor Suppressor Protein p53 Negatively Regulates Ischemia-Induced Angiogenesis and Arteriogenesis. J. Vasc. Surg. 2018, 68, 222S–233S. [Google Scholar] [CrossRef] [PubMed]
- Nicolai, S.; Rossi, A.; Di Daniele, N.; Melino, G.; Annicchiarico-Petruzzelli, M.; Raschellà, G. DNA Repair and Aging: The Impact of the p53 Family. Aging 2015, 7, 1050. [Google Scholar] [CrossRef]
- Itahana, K.; Dimri, G.; Campisi, J. Regulation of Cellular Senescence by p53. Eur. J. Biochem. 2001, 268, 2784–2791. [Google Scholar] [CrossRef]
- Brázda, V.; Fojta, M. The Rich World of p53 DNA Binding Targets: The Role of DNA Structure. Int. J. Mol. Sci. 2019, 20, 5605. [Google Scholar] [CrossRef]
- El-Deiry, W.S.; Kern, S.E.; Pietenpol, J.A.; Kinzler, K.W.; Vogelstein, B. Definition of a Consensus Binding Site for p53. Nat. Genet. 1992, 1, 45–49. [Google Scholar] [CrossRef]
- Vyas, P.; Beno, I.; Xi, Z.; Stein, Y.; Golovenko, D.; Kessler, N.; Rotter, V.; Shakked, Z.; Haran, T.E. Diverse p53/DNA Binding Modes Expand the Repertoire of p53 Response Elements. Proc. Natl. Acad. Sci. USA 2017, 114, 10624–10629. [Google Scholar] [CrossRef]
- Lane, D.P. Cancer. p53, Guardian of the Genome. Nature 1992, 358, 15–16. [Google Scholar] [CrossRef]
- Toufektchan, E.; Toledo, F. The Guardian of the Genome Revisited: p53 Downregulates Genes Required for Telomere Maintenance, DNA Repair, and Centromere Structure. Cancers 2018, 10, 135. [Google Scholar] [CrossRef]
- Bartas, M.; Brázda, V.; Červeň, J.; Pečinka, P. Characterization of p53 Family Homologs in Evolutionary Remote Branches of Holozoa. Int. J. Mol. Sci. 2020, 21, 6. [Google Scholar] [CrossRef] [PubMed]
- Belyi, V.A.; Levine, A.J. One Billion Years of p53/P63/P73 Evolution. Proc. Natl. Acad. Sci. USA 2009, 106, 17609–17610. [Google Scholar] [CrossRef] [PubMed]
- Engelmann, D.; Meier, C.; Alla, V.; Pützer, B.M. A Balancing Act: Orchestrating Amino-Truncated and Full-Length P73 Variants as Decisive Factors in Cancer Progression. Oncogene 2015, 34, 4287–4299. [Google Scholar] [CrossRef]
- Jiang, L.; Zawacka-Pankau, J. The p53/MDM2/MDMX-Targeted Therapies—a Clinical Synopsis. Cell Death Dis. 2020, 11, 1–4. [Google Scholar] [CrossRef] [PubMed]
- Tyner, S.D.; Venkatachalam, S.; Choi, J.; Jones, S.; Ghebranious, N.; Igelmann, H.; Lu, X.; Soron, G.; Cooper, B.; Brayton, C.; et al. p53 Mutant Mice That Display Early Ageing-Associated Phenotypes. Nature 2002, 415, 45–53. [Google Scholar] [CrossRef]
- Moore, L.; Lu, X.; Ghebranious, N.; Tyner, S.; Donehower, L.A. Aging-Associated Truncated Form of p53 Interacts with Wild-Type p53 and Alters p53 Stability, Localization, and Activity. Mech. Ageing Dev. 2007, 128, 717–730. [Google Scholar] [CrossRef] [PubMed]
- García-Cao, I.; García-Cao, M.; Martín-Caballero, J.; Criado, L.M.; Klatt, P.; Flores, J.M.; Weill, J.-C.; Blasco, M.A.; Serrano, M. ’Super p53′mice Exhibit Enhanced DNA Damage Response, Are Tumor Resistant and Age Normally. EMBO J. 2002, 21, 6225–6235. [Google Scholar] [CrossRef]
- Lessel, D.; Wu, D.; Trujillo, C.; Ramezani, T.; Lessel, I.; Alwasiyah, M.K.; Saha, B.; Hisama, F.M.; Rading, K.; Goebel, I. Dysfunction of the MDM2/p53 Axis Is Linked to Premature Aging. J. Clin. Investig. 2017, 127, 3598–3608. [Google Scholar] [CrossRef]
- Gannon, H.S.; Donehower, L.A.; Lyle, S.; Jones, S.N. Mdm2–p53 Signaling Regulates Epidermal Stem Cell Senescence and Premature Aging Phenotypes in Mouse Skin. Dev. Biol. 2011, 353, 1–9. [Google Scholar] [CrossRef]
- Sahin, E.; DePinho, R.A. Axis of Ageing: Telomeres, p53 and Mitochondria. Nat. Rev. Mol. Cell Biol. 2012, 13, 397–404. [Google Scholar] [CrossRef]
- De Keizer, P.L.; Laberge, R.-M.; Campisi, J. p53: Pro-Aging or pro-Longevity? Aging 2010, 2, 377. [Google Scholar] [CrossRef] [PubMed]
- Maier, B.; Gluba, W.; Bernier, B.; Turner, T.; Mohammad, K.; Guise, T.; Sutherland, A.; Thorner, M.; Scrable, H. Modulation of Mammalian Life Span by the Short Isoform of p53. Genes Dev. 2004, 18, 306–319. [Google Scholar] [CrossRef] [PubMed]
- Olivares-Illana, V.; Fåhraeus, R. p53 Isoforms Gain Functions. Oncogene 2010, 29, 5113–5119. [Google Scholar] [CrossRef]
- De Magalhaes, J.P.; Costa, J. A Database of Vertebrate Longevity Records and Their Relation to Other Life-History Traits. J. Evol. Biol. 2009, 22, 1770–1774. [Google Scholar] [CrossRef]
- Keane, M.; Semeiks, J.; Webb, A.E.; Li, Y.I.; Quesada, V.; Craig, T.; Madsen, L.B.; van Dam, S.; Brawand, D.; Marques, P.I.; et al. Insights into the Evolution of Longevity from the Bowhead Whale Genome. Cell Rep. 2015, 10, 112–122. [Google Scholar] [CrossRef] [PubMed]
- Edgar, R.C. MUSCLE: Multiple Sequence Alignment with High Accuracy and High Throughput. Nucleic Acids Res. 2004, 32, 1792–1797. [Google Scholar] [CrossRef] [PubMed]
- Deuter, R.; Müller, O. Detection of APC Mutations in Stool DNA of Patients with Colorectal Cancer by HD-PCR. Hum. Mutat. 1998, 11, 84–89. [Google Scholar] [CrossRef]
- Pellegata, N.S.; Sessa, F.; Renault, B.; Bonato, M.; Leone, B.E.; Solcia, E.; Ranzani, G.N. K-Ras and p53 Gene Mutations in Pancreatic Cancer: Ductal and Nonductal Tumors Progress through Different Genetic Lesions. Cancer Res. 1994, 54, 1556–1560. [Google Scholar]
- Giacomelli, A.O.; Yang, X.; Lintner, R.E.; McFarland, J.M.; Duby, M.; Kim, J.; Howard, T.P.; Takeda, D.Y.; Ly, S.H.; Kim, E. Mutational Processes Shape the Landscape of Tp53 Mutations in Human Cancer. Nat. Genet. 2018, 50, 1381. [Google Scholar] [CrossRef]
- Wilkinson, G.S.; South, J.M. Life History, Ecology and Longevity in Bats. Aging Cell 2002, 1, 124–131. [Google Scholar] [CrossRef] [PubMed]
- Kleiber, M. Body Size and Metabolism. Hilgardia 1932, 6, 315–353. [Google Scholar] [CrossRef]
- Jessen, L.E.; Hoof, I.; Lund, O.; Nielsen, M. SigniSite: Identification of Residue-Level Genotype-Phenotype Correlations in Protein Multiple Sequence Alignments. Nucleic Acids Res. 2013, 41, W286–W291. [Google Scholar] [CrossRef] [PubMed]
- Olivier, M.; Eeles, R.; Hollstein, M.; Khan, M.A.; Harris, C.C.; Hainaut, P. The IARC Tp53 Database: New Online Mutation Analysis and Recommendations to Users. Hum. Mutat. 2002, 19, 607–614. [Google Scholar] [CrossRef] [PubMed]
- Passow, C.N.; Bronikowski, A.M.; Blackmon, H.; Parsai, S.; Schwartz, T.S.; McGaugh, S.E. Contrasting Patterns of Rapid Molecular Evolution within the p53 Network across Mammal and Sauropsid Lineages. Genome Biol. Evol. 2019, 11, 629–643. [Google Scholar] [CrossRef]
- Ong, A.L.C.; Ramasamy, T.S. Role of Sirtuin1-p53 Regulatory Axis in Aging, Cancer and Cellular Reprogramming. Ageing Res. Rev. 2018, 43, 64–80. [Google Scholar] [CrossRef] [PubMed]
- Liu, J.; Guan, D.; Dong, M.; Yang, J.; Wei, H.; Liang, Q.; Song, L.; Xu, L.; Bai, J.; Liu, C.; et al. UFMylation Maintains Tumour Suppressor p53 Stability by Antagonizing Its Ubiquitination. Nat. Cell Biol. 2020, 22, 1056–1063. [Google Scholar] [CrossRef] [PubMed]
- Qian, Y.; Chen, X. Senescence Regulation by the p53 Protein Family. Cell Senescence 2013, 9, 37–61. [Google Scholar] [CrossRef]
- Soussi, T.; Wiman, K.G. Tp53: An Oncogene in Disguise. Cell Death Differ. 2015, 22, 1239–1249. [Google Scholar] [CrossRef]
- Kubota, S. Repeating Rejuvenation in Turritopsis, an Immortal Hydrozoan (Cnidaria, Hydrozoa). Biogeography 2011, 12, 101–103. [Google Scholar]
- Hasegawa, Y.; Watanabe, T.; Takazawa, M.; Ohara, O.; Kubota, S. De Novo Assembly of the Transcriptome of Turritopsis, a Jellyfish That Repeatedly Rejuvenates. Zool. Sci. 2016, 33, 366–372. [Google Scholar] [CrossRef] [PubMed]
- Choi, Y.; Chan, A.P. PROVEAN Web Server: A Tool to Predict the Functional Effect of Amino Acid Substitutions and Indels. Bioinformatics 2015, 31, 2745–2747. [Google Scholar] [CrossRef] [PubMed]
- Lukman, S.; Lane, D.P.; Verma, C.S. Mapping the Structural and Dynamical Features of Multiple p53 DNA Binding Domains: Insights into Loop 1 Intrinsic Dynamics. PLoS ONE 2013, 8, e80221. [Google Scholar] [CrossRef] [PubMed]
- Linnér, R.K.; Biroli, P.; Kong, E.; Meddens, S.F.W.; Wedow, R.; Fontana, M.A.; Lebreton, M.; Tino, S.P.; Abdellaoui, A.; Hammerschlag, A.R. Genome-Wide Association Analyses of Risk Tolerance and Risky Behaviors in over 1 Million Individuals Identify Hundreds of Loci and Shared Genetic Influences. Nat. Genet. 2019, 51, 245–257. [Google Scholar] [CrossRef]
- Berkel, C.; Cacan, E. Analysis of Longevity in Chordata Identifies Species with Exceptional Longevity among Taxa and Points to the Evolution of Longer Lifespans. Biogerontology 2021, 22, 329–343. [Google Scholar] [CrossRef] [PubMed]
- Arum, O.; Johnson, T.E. Reduced Expression of the Caenorhabditis Elegans p53 Ortholog Cep-1 Results in Increased Longevity. J. Gerontol. Ser. Biol. Sci. Med. Sci. 2007, 62, 951–959. [Google Scholar] [CrossRef] [PubMed]
- Bauer, J.H.; Poon, P.C.; Glatt-Deeley, H.; Abrams, J.M.; Helfand, S.L. Neuronal Expression of p53 Dominant-Negative Proteins in Adult Drosophila Melanogaster Extends Life Span. Curr. Biol. 2005, 15, 2063–2068. [Google Scholar] [CrossRef]
- Bonafè, M.; Olivieri, F.; Mari, D.; Baggio, G.; Mattace, R.; Sansoni, P.; De Benedictis, G.; De Luca, M.; Bertolini, S.; Barbi, C. p53 Variants Predisposing to Cancer Are Present in Healthy Centenarians. Am. J. Hum. Genet. 1999, 64, 292. [Google Scholar] [CrossRef][Green Version]
- Van Heemst, D.; Mooijaart, S.P.; Beekman, M.; Schreuder, J.; de Craen, A.J.M.; Brandt, B.W.; Eline Slagboom, P.; Westendorp, R.G.J. Variation in the Human Tp53 Gene Affects Old Age Survival and Cancer Mortality. Exp. Gerontol. 2005, 40, 11–15. [Google Scholar] [CrossRef]
- Zhao, Y.; Wu, L.; Yue, X.; Zhang, C.; Wang, J.; Li, J.; Sun, X.; Zhu, Y.; Feng, Z.; Hu, W. A Polymorphism in the Tumor Suppressor p53 Affects Aging and Longevity in Mouse Models. Elife 2018, 7, e34701. [Google Scholar] [CrossRef]
- Sulak, M.; Fong, L.; Mika, K.; Chigurupati, S.; Yon, L.; Mongan, N.P.; Emes, R.D.; Lynch, V.J. Tp53 Copy Number Expansion Is Associated with the Evolution of Increased Body Size and an Enhanced DNA Damage Response in Elephants. Elife 2016, 5, e11994. [Google Scholar] [CrossRef]
- Tejada-Martinez, D.; de Magalhães, J.P.; Opazo, J.C. Positive Selection and Gene Duplications in Tumour Suppressor Genes Reveal Clues about How Cetaceans Resist Cancer. Proc. R. Soc. B Biol. Sci. 2021, 288, 20202592. [Google Scholar] [CrossRef]
- Deuker, M.M.; Lewis, K.N.; Ingaramo, M.; Kimmel, J.; Buffenstein, R.; Settleman, J. Unprovoked Stabilization and Nuclear Accumulation of the Naked Mole-Rat p53 Protein. Sci. Rep. 2020, 10, 6966. [Google Scholar] [CrossRef]
- Boughey, H.; Jurga, M.; El-Khamisy, S.F. DNA Homeostasis and Senescence: Lessons from the Naked Mole Rat. Int. J. Mol. Sci. 2021, 22, 6011. [Google Scholar] [CrossRef] [PubMed]
- Bai, G.-L.; Wang, P.; Huang, X.; Wang, Z.-Y.; Cao, D.; Liu, C.; Liu, Y.-Y.; Li, R.-L.; Chen, A.-J. Rapamycin Protects Skin Fibroblasts from UVA-Induced Photoaging by Inhibition of p53 and Phosphorylated HSP27. Front. Cell Dev. Biol. 2021, 9, 134. [Google Scholar] [CrossRef] [PubMed]
- Frey, K.; Hafner, A.; Pucker, B. The Reuse of Public Datasets in the Life Sciences: Potential Risks and Rewards. Peer J. 2020, 22, e9954. [Google Scholar] [CrossRef]
- Okonechnikov, K.; Golosova, O.; Fursov, M.; Team, U. Unipro UGENE: A Unified Bioinformatics Toolkit. Bioinformatics 2012, 28, 1166–1167. [Google Scholar] [CrossRef]
- Grabherr, M.G.; Haas, B.J.; Yassour, M.; Levin, J.Z.; Thompson, D.A.; Amit, I.; Adiconis, X.; Fan, L.; Raychowdhury, R.; Zeng, Q. Full-Length Transcriptome Assembly from RNA-Seq Data without a Reference Genome. Nat. Biotechnol. 2011, 29, 644. [Google Scholar] [CrossRef]
- Afgan, E.; Baker, D.; Batut, B.; Van Den Beek, M.; Bouvier, D.; Čech, M.; Chilton, J.; Clements, D.; Coraor, N.; Grüning, B.A. The Galaxy Platform for Accessible, Reproducible and Collaborative Biomedical Analyses: 2018 Update. Nucleic Acids Res. 2018, 46, W537–W544. [Google Scholar] [CrossRef] [PubMed]
- Dereeper, A.; Guignon, V.; Blanc, G.; Audic, S.; Buffet, S.; Chevenet, F.; Dufayard, J.-F.; Guindon, S.; Lefort, V.; Lescot, M. Phylogeny. Fr: Robust Phylogenetic Analysis for the Non-Specialist. Nucleic Acids Res. 2008, 36, W465–W469. [Google Scholar] [CrossRef]
- Dereeper, A.; Audic, S.; Claverie, J.-M.; Blanc, G. BLAST-EXPLORER Helps You Building Datasets for Phylogenetic Analysis. BMC Evol. Biol. 2010, 10, 8. [Google Scholar] [CrossRef]
- Castresana, J. Selection of Conserved Blocks from Multiple Alignments for Their Use in Phylogenetic Analysis. Mol. Biol. Evol. 2000, 17, 540–552. [Google Scholar] [CrossRef] [PubMed]
- Anisimova, M.; Gascuel, O. Approximate Likelihood-Ratio Test for Branches: A Fast, Accurate, and Powerful Alternative. Syst. Biol. 2006, 55, 539–552. [Google Scholar] [CrossRef]
- Guindon, S.; Gascuel, O. A Simple, Fast, and Accurate Algorithm to Estimate Large Phylogenies by Maximum Likelihood. Syst. Biol. 2003, 52, 696–704. [Google Scholar] [CrossRef] [PubMed]
- Chevenet, F.; Brun, C.; Bañuls, A.-L.; Jacq, B.; Christen, R. TreeDyn: Towards Dynamic Graphics and Annotations for Analyses of Trees. BMC Bioinform. 2006, 7, 439. [Google Scholar] [CrossRef] [PubMed]
- Letunic, I.; Bork, P. Interactive Tree Of Life (ITOL) v4: Recent Updates and New Developments. Nucleic Acids Res. 2019, 47, W256–W259. [Google Scholar] [CrossRef] [PubMed]
- Choi, Y.; Sims, G.E.; Murphy, S.; Miller, J.R.; Chan, A.P. Predicting the Functional Effect of Amino Acid Substitutions and Indels. PLoS ONE 2012, 7, e46688. [Google Scholar] [CrossRef]
- Waterhouse, A.; Bertoni, M.; Bienert, S.; Studer, G.; Tauriello, G.; Gumienny, R.; Heer, F.T.; de Beer, T.A.P.; Rempfer, C.; Bordoli, L.; et al. SWISS-MODEL: Homology Modelling of Protein Structures and Complexes. Nucleic Acids Res. 2018, 46, W296–W303. [Google Scholar] [CrossRef]
- Emamzadah, S.; Tropia, L.; Vincenti, I.; Falquet, B.; Halazonetis, T.D. Reversal of the DNA-Binding-Induced Loop L1 Conformational Switch in an Engineered Human p53 Protein. J. Mol. Biol. 2014, 426, 936–944. [Google Scholar] [CrossRef]
- Pettersen, E.F.; Goddard, T.D.; Huang, C.C.; Couch, G.S.; Greenblatt, D.M.; Meng, E.C.; Ferrin, T.E. UCSF Chimera—a Visualization System for Exploratory Research and Analysis. J. Comput. Chem. 2004, 25, 1605–1612. [Google Scholar] [CrossRef]
- Källberg, M.; Wang, H.; Wang, S.; Peng, J.; Wang, Z.; Lu, H.; Xu, J. Template-Based Protein Structure Modeling Using the RaptorX Web Server. Nat. Protoc. 2012, 7, 1511–1522. [Google Scholar] [CrossRef] [PubMed]
- Simonetti, F.L.; Teppa, E.; Chernomoretz, A.; Nielsen, M.; Marino Buslje, C. MISTIC: Mutual Information Server to Infer Coevolution. Nucleic Acids Res. 2013, 41, W8–W14. [Google Scholar] [CrossRef] [PubMed]
- Herrero, J.; Muffato, M.; Beal, K.; Fitzgerald, S.; Gordon, L.; Pignatelli, M.; Vilella, A.J.; Searle, S.M.; Amode, R.; Brent, S. Ensembl Comparative Genomics Resources. Database 2016, 2016, 96. [Google Scholar] [CrossRef] [PubMed]


| Organism Classification | Maximal Lifespan (y) | Adult Weight (kg) | p53 Oddities | Effect Predicted by PROVEAN |
|---|---|---|---|---|
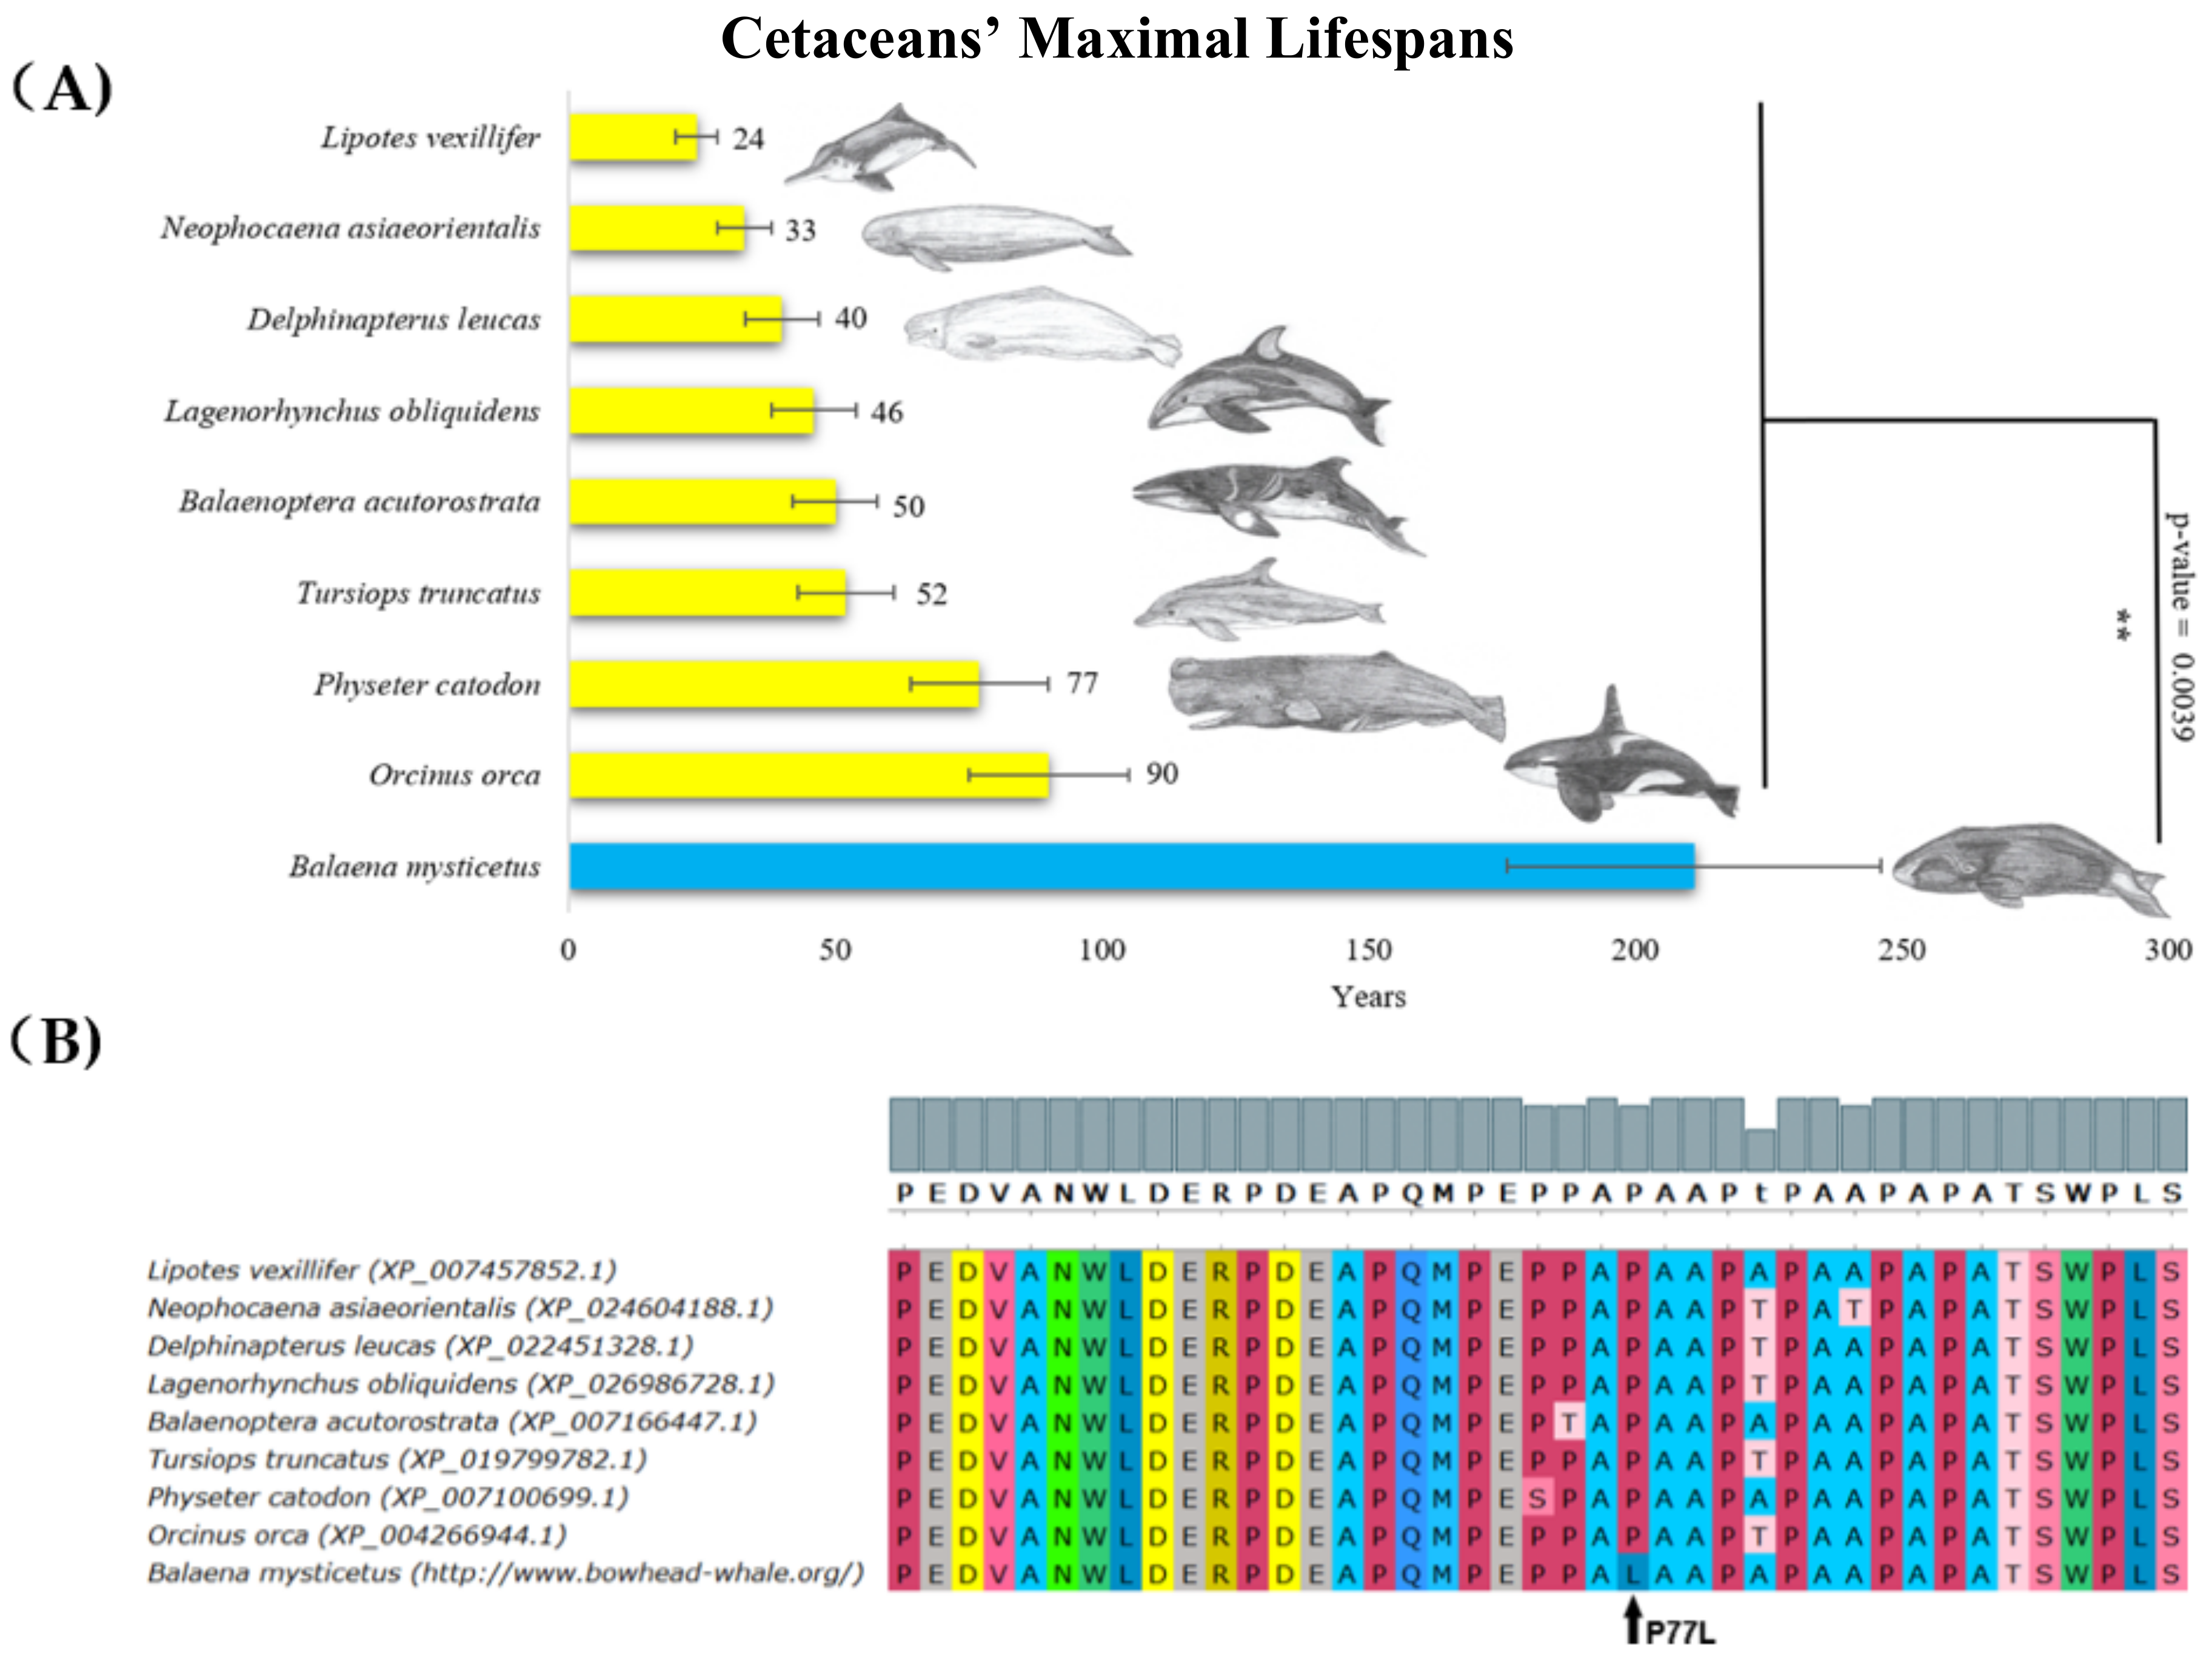
| Balaena mysticetus Mammalia, Cetacea | 211 | 100,000 | Unique substitution in proline rich region | Neutral (P77L, score = −0.993) |
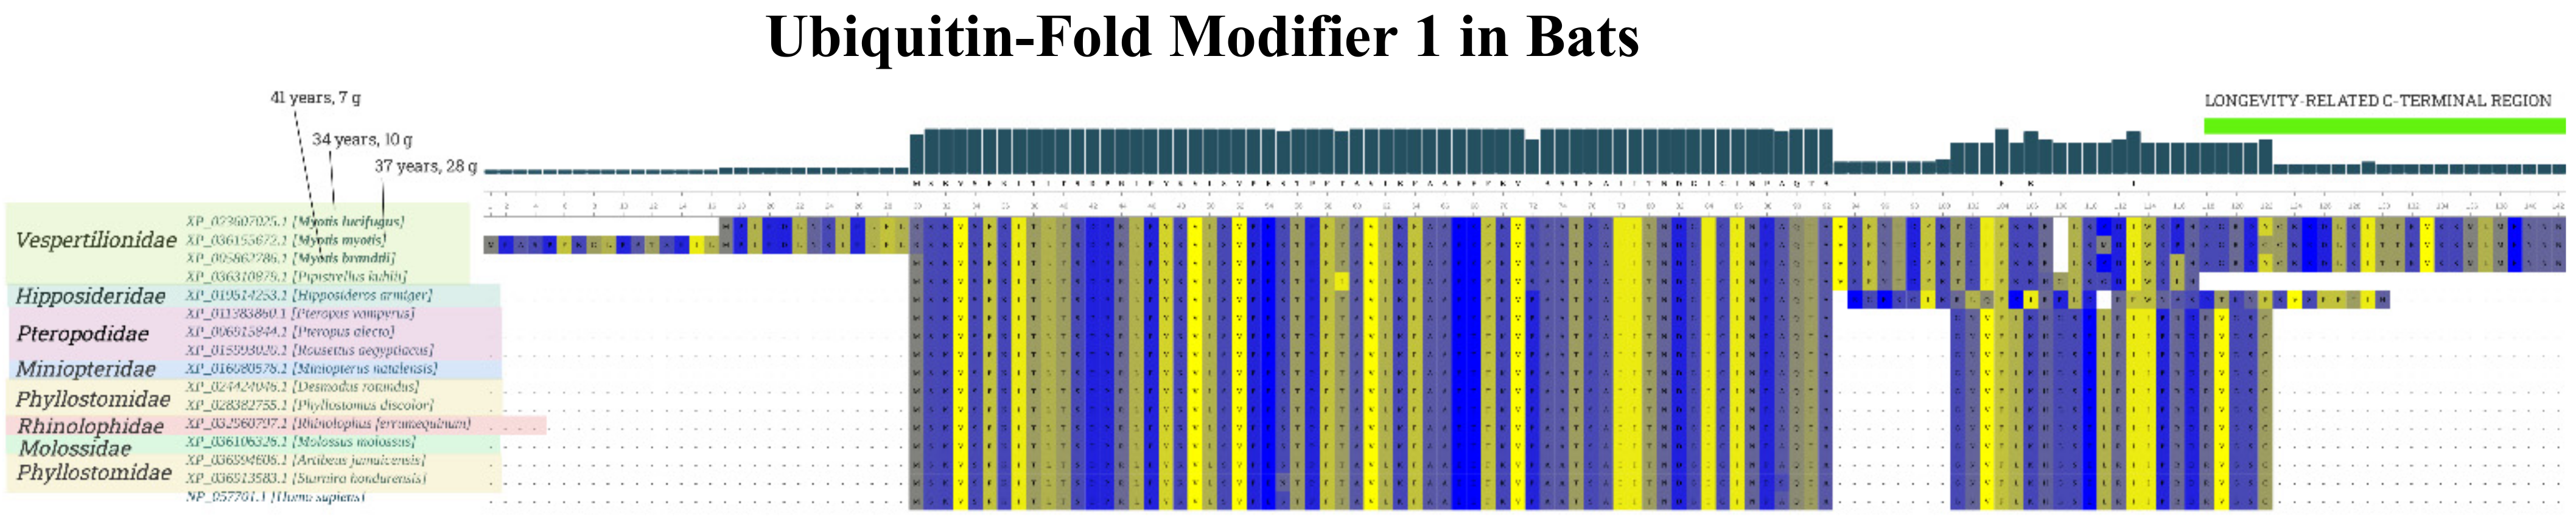
| Myotis brandtii, Myotis lucifugus Mammalia, Chiroptera | 41 | 0.007 | Insertion in DNA-binding domain | Deleterious (P295_H296insPKQPPGS, score = −2.526) * |
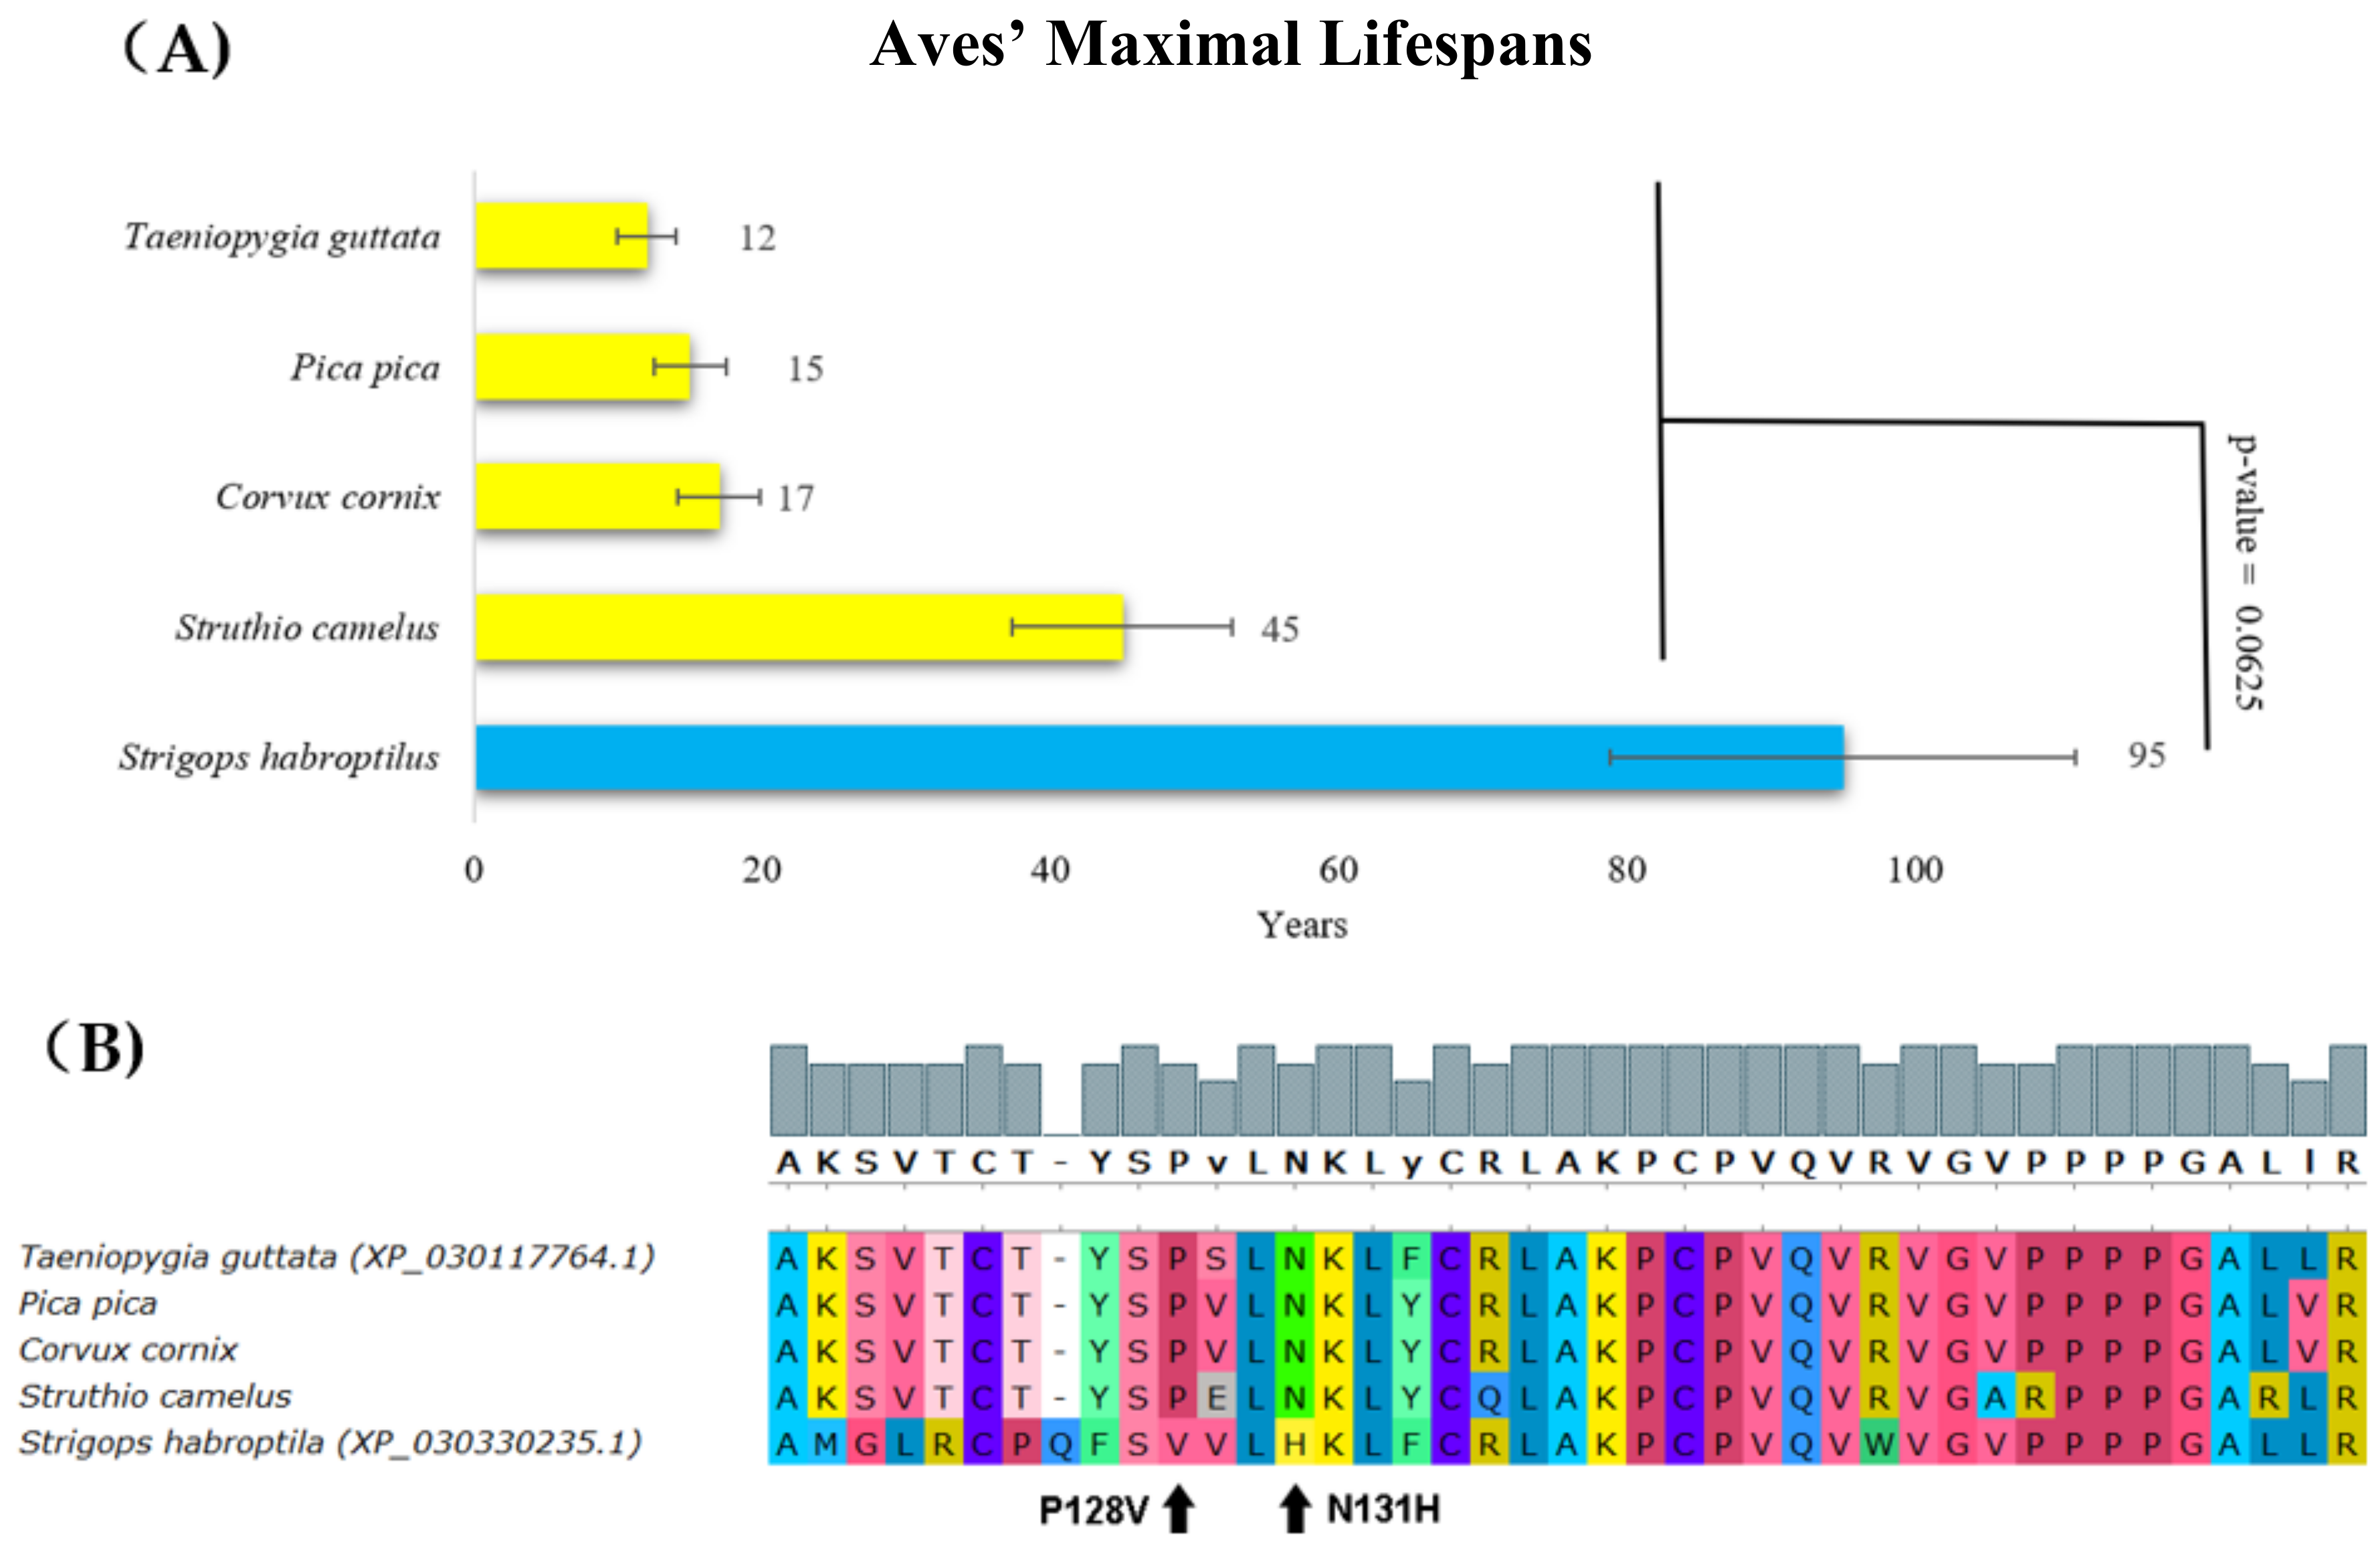
| Strigops habroptila Aves, Psittaciformes | 95 | 1.75 | Substitution in core domain | Deleterious (N131H, score = −3.162) * |
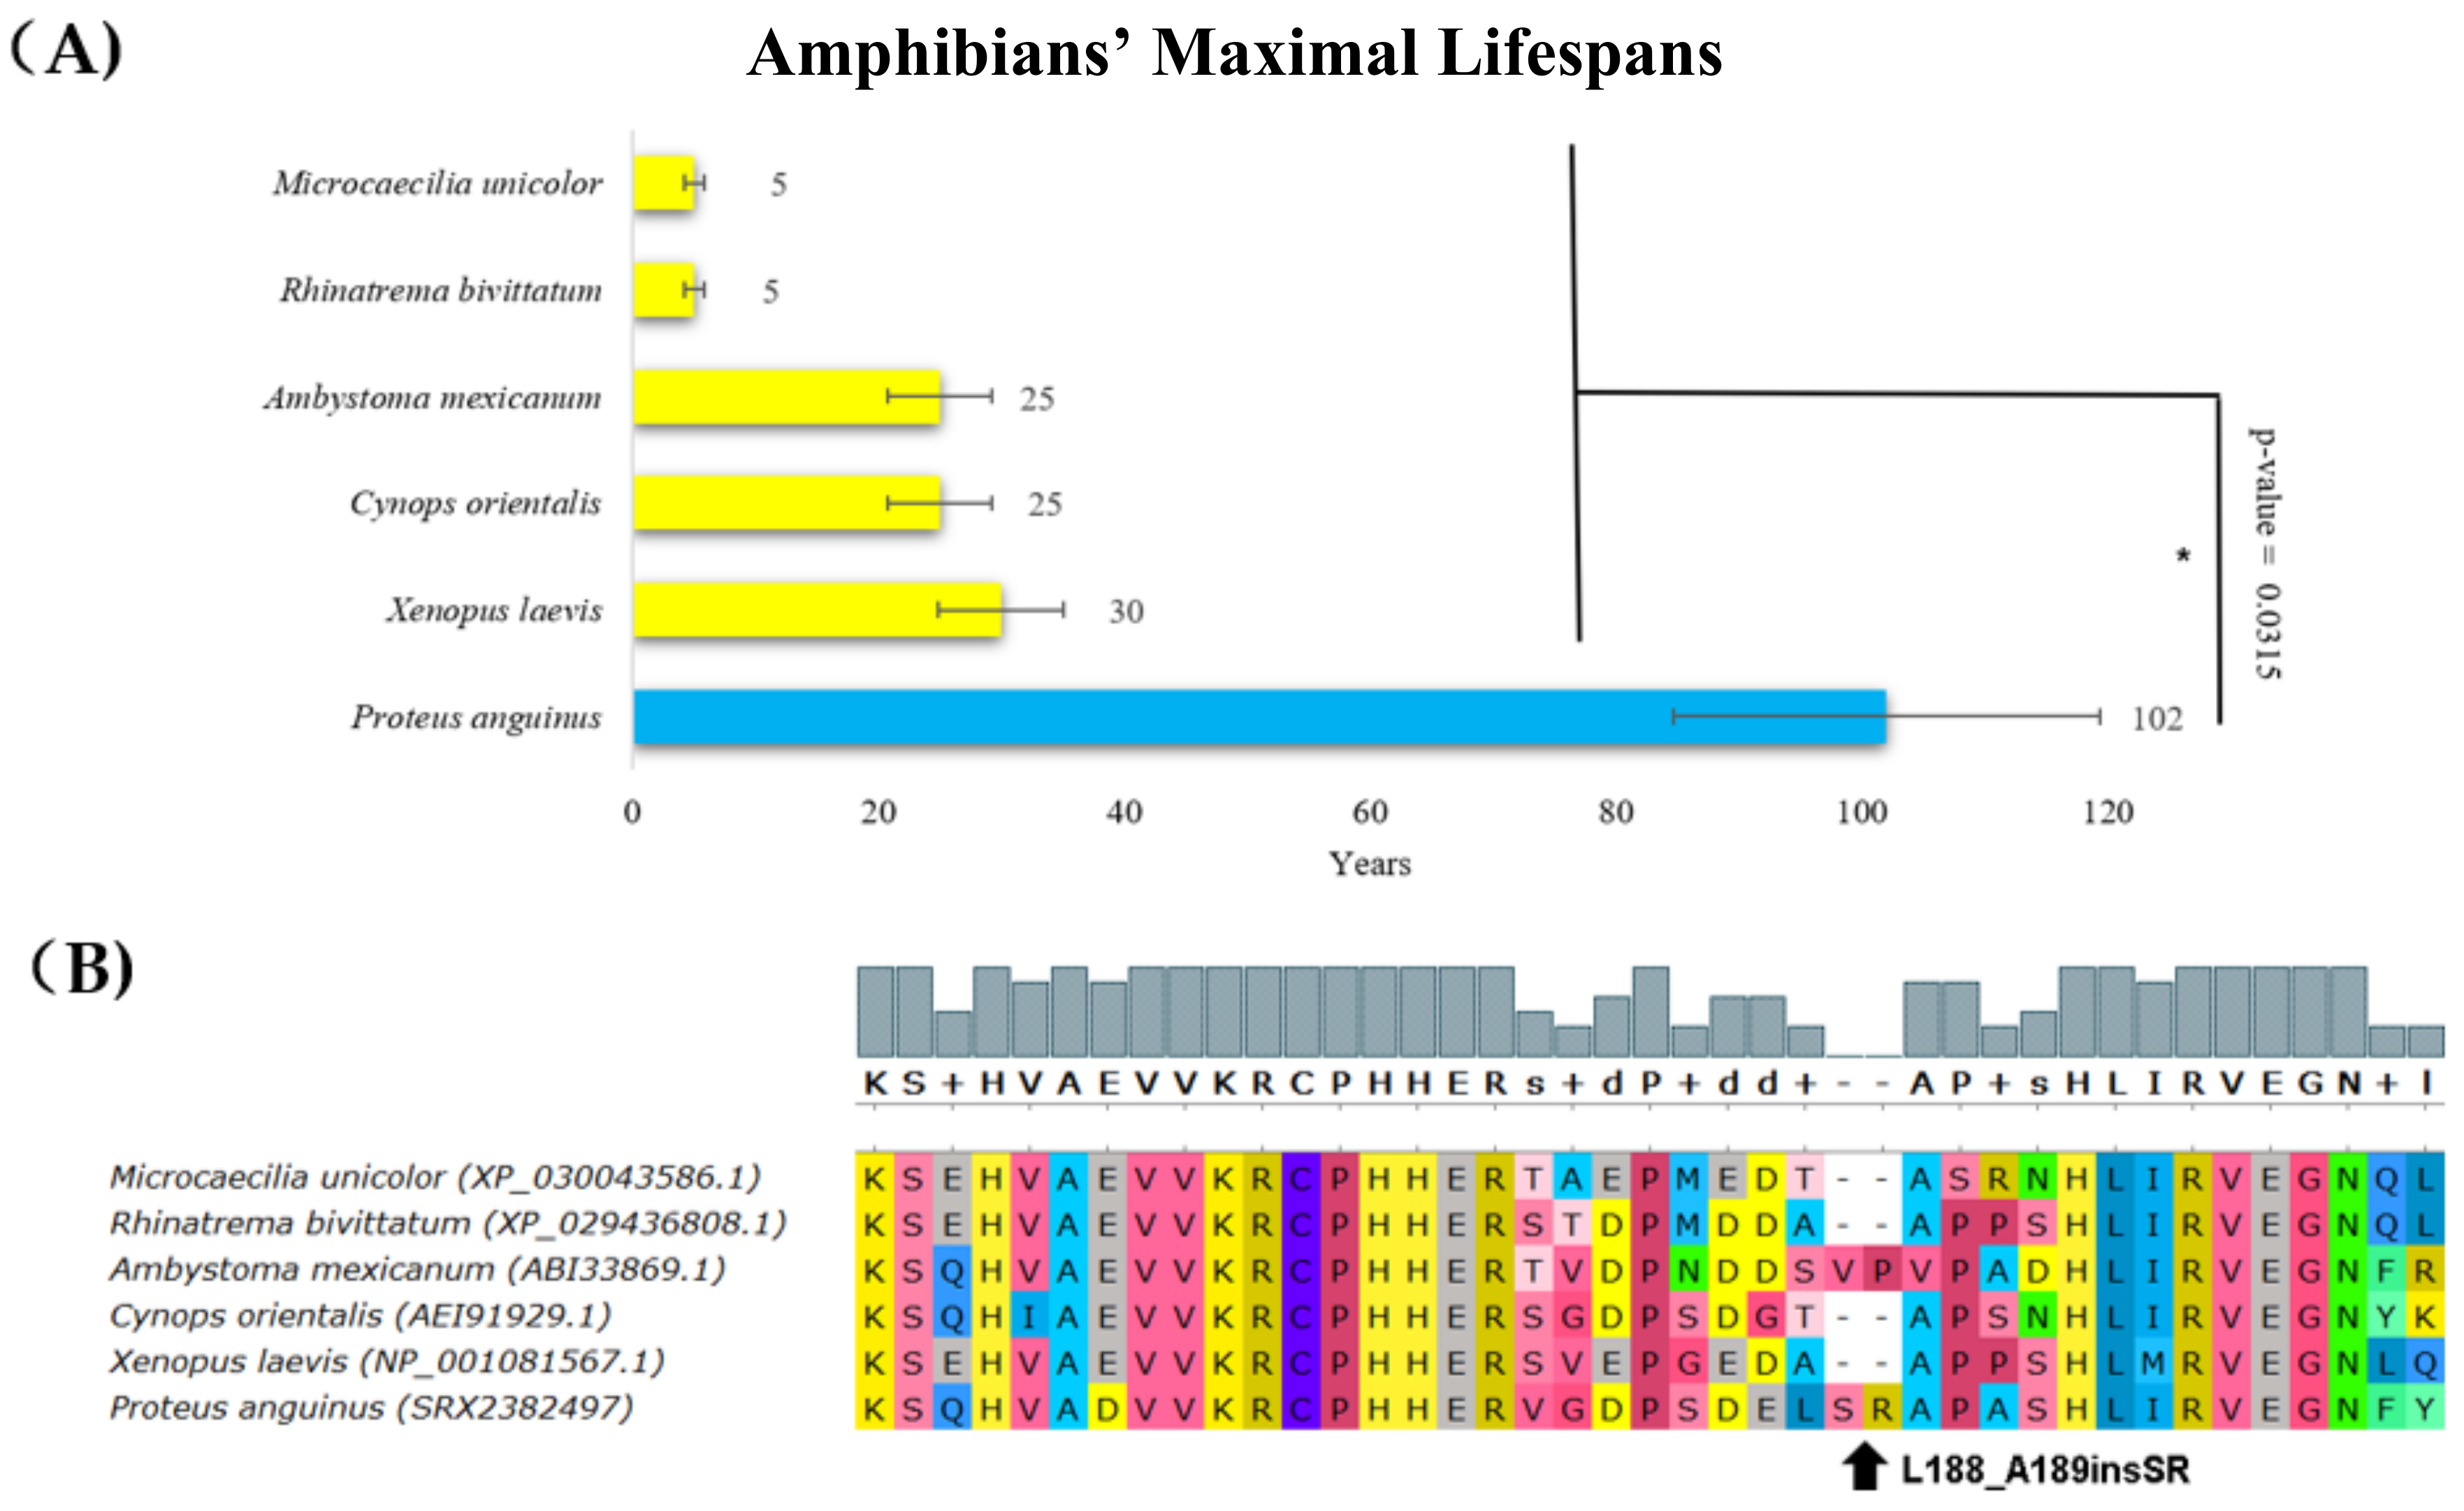
| Proteus anguinus Amphibia, Urodela | 102 | 0.017 | Insertion nearby dimerization region | Deleterious (L188_A189insSR, score = −3.357) * |
| Turritopsis sp. Cnidaria | ∞ rejuvenation | 0.001 | No p53/63/73 protein expressed (unprecedented phenomenon in the whole animal kingdom) | Not applicable |
Publisher’s Note: MDPI stays neutral with regard to jurisdictional claims in published maps and institutional affiliations. |
© 2021 by the authors. Licensee MDPI, Basel, Switzerland. This article is an open access article distributed under the terms and conditions of the Creative Commons Attribution (CC BY) license (https://creativecommons.org/licenses/by/4.0/).
Share and Cite
Bartas, M.; Brázda, V.; Volná, A.; Červeň, J.; Pečinka, P.; Zawacka-Pankau, J.E. The Changes in the p53 Protein across the Animal Kingdom Point to Its Involvement in Longevity. Int. J. Mol. Sci. 2021, 22, 8512. https://doi.org/10.3390/ijms22168512
Bartas M, Brázda V, Volná A, Červeň J, Pečinka P, Zawacka-Pankau JE. The Changes in the p53 Protein across the Animal Kingdom Point to Its Involvement in Longevity. International Journal of Molecular Sciences. 2021; 22(16):8512. https://doi.org/10.3390/ijms22168512
Chicago/Turabian StyleBartas, Martin, Václav Brázda, Adriana Volná, Jiří Červeň, Petr Pečinka, and Joanna E. Zawacka-Pankau. 2021. "The Changes in the p53 Protein across the Animal Kingdom Point to Its Involvement in Longevity" International Journal of Molecular Sciences 22, no. 16: 8512. https://doi.org/10.3390/ijms22168512
APA StyleBartas, M., Brázda, V., Volná, A., Červeň, J., Pečinka, P., & Zawacka-Pankau, J. E. (2021). The Changes in the p53 Protein across the Animal Kingdom Point to Its Involvement in Longevity. International Journal of Molecular Sciences, 22(16), 8512. https://doi.org/10.3390/ijms22168512