
Anticancer Activity and Mechanisms of Action of New Chimeric EGFR/HDAC-Inhibitors


 , , and
Abstract
:1. Introduction
2. Results
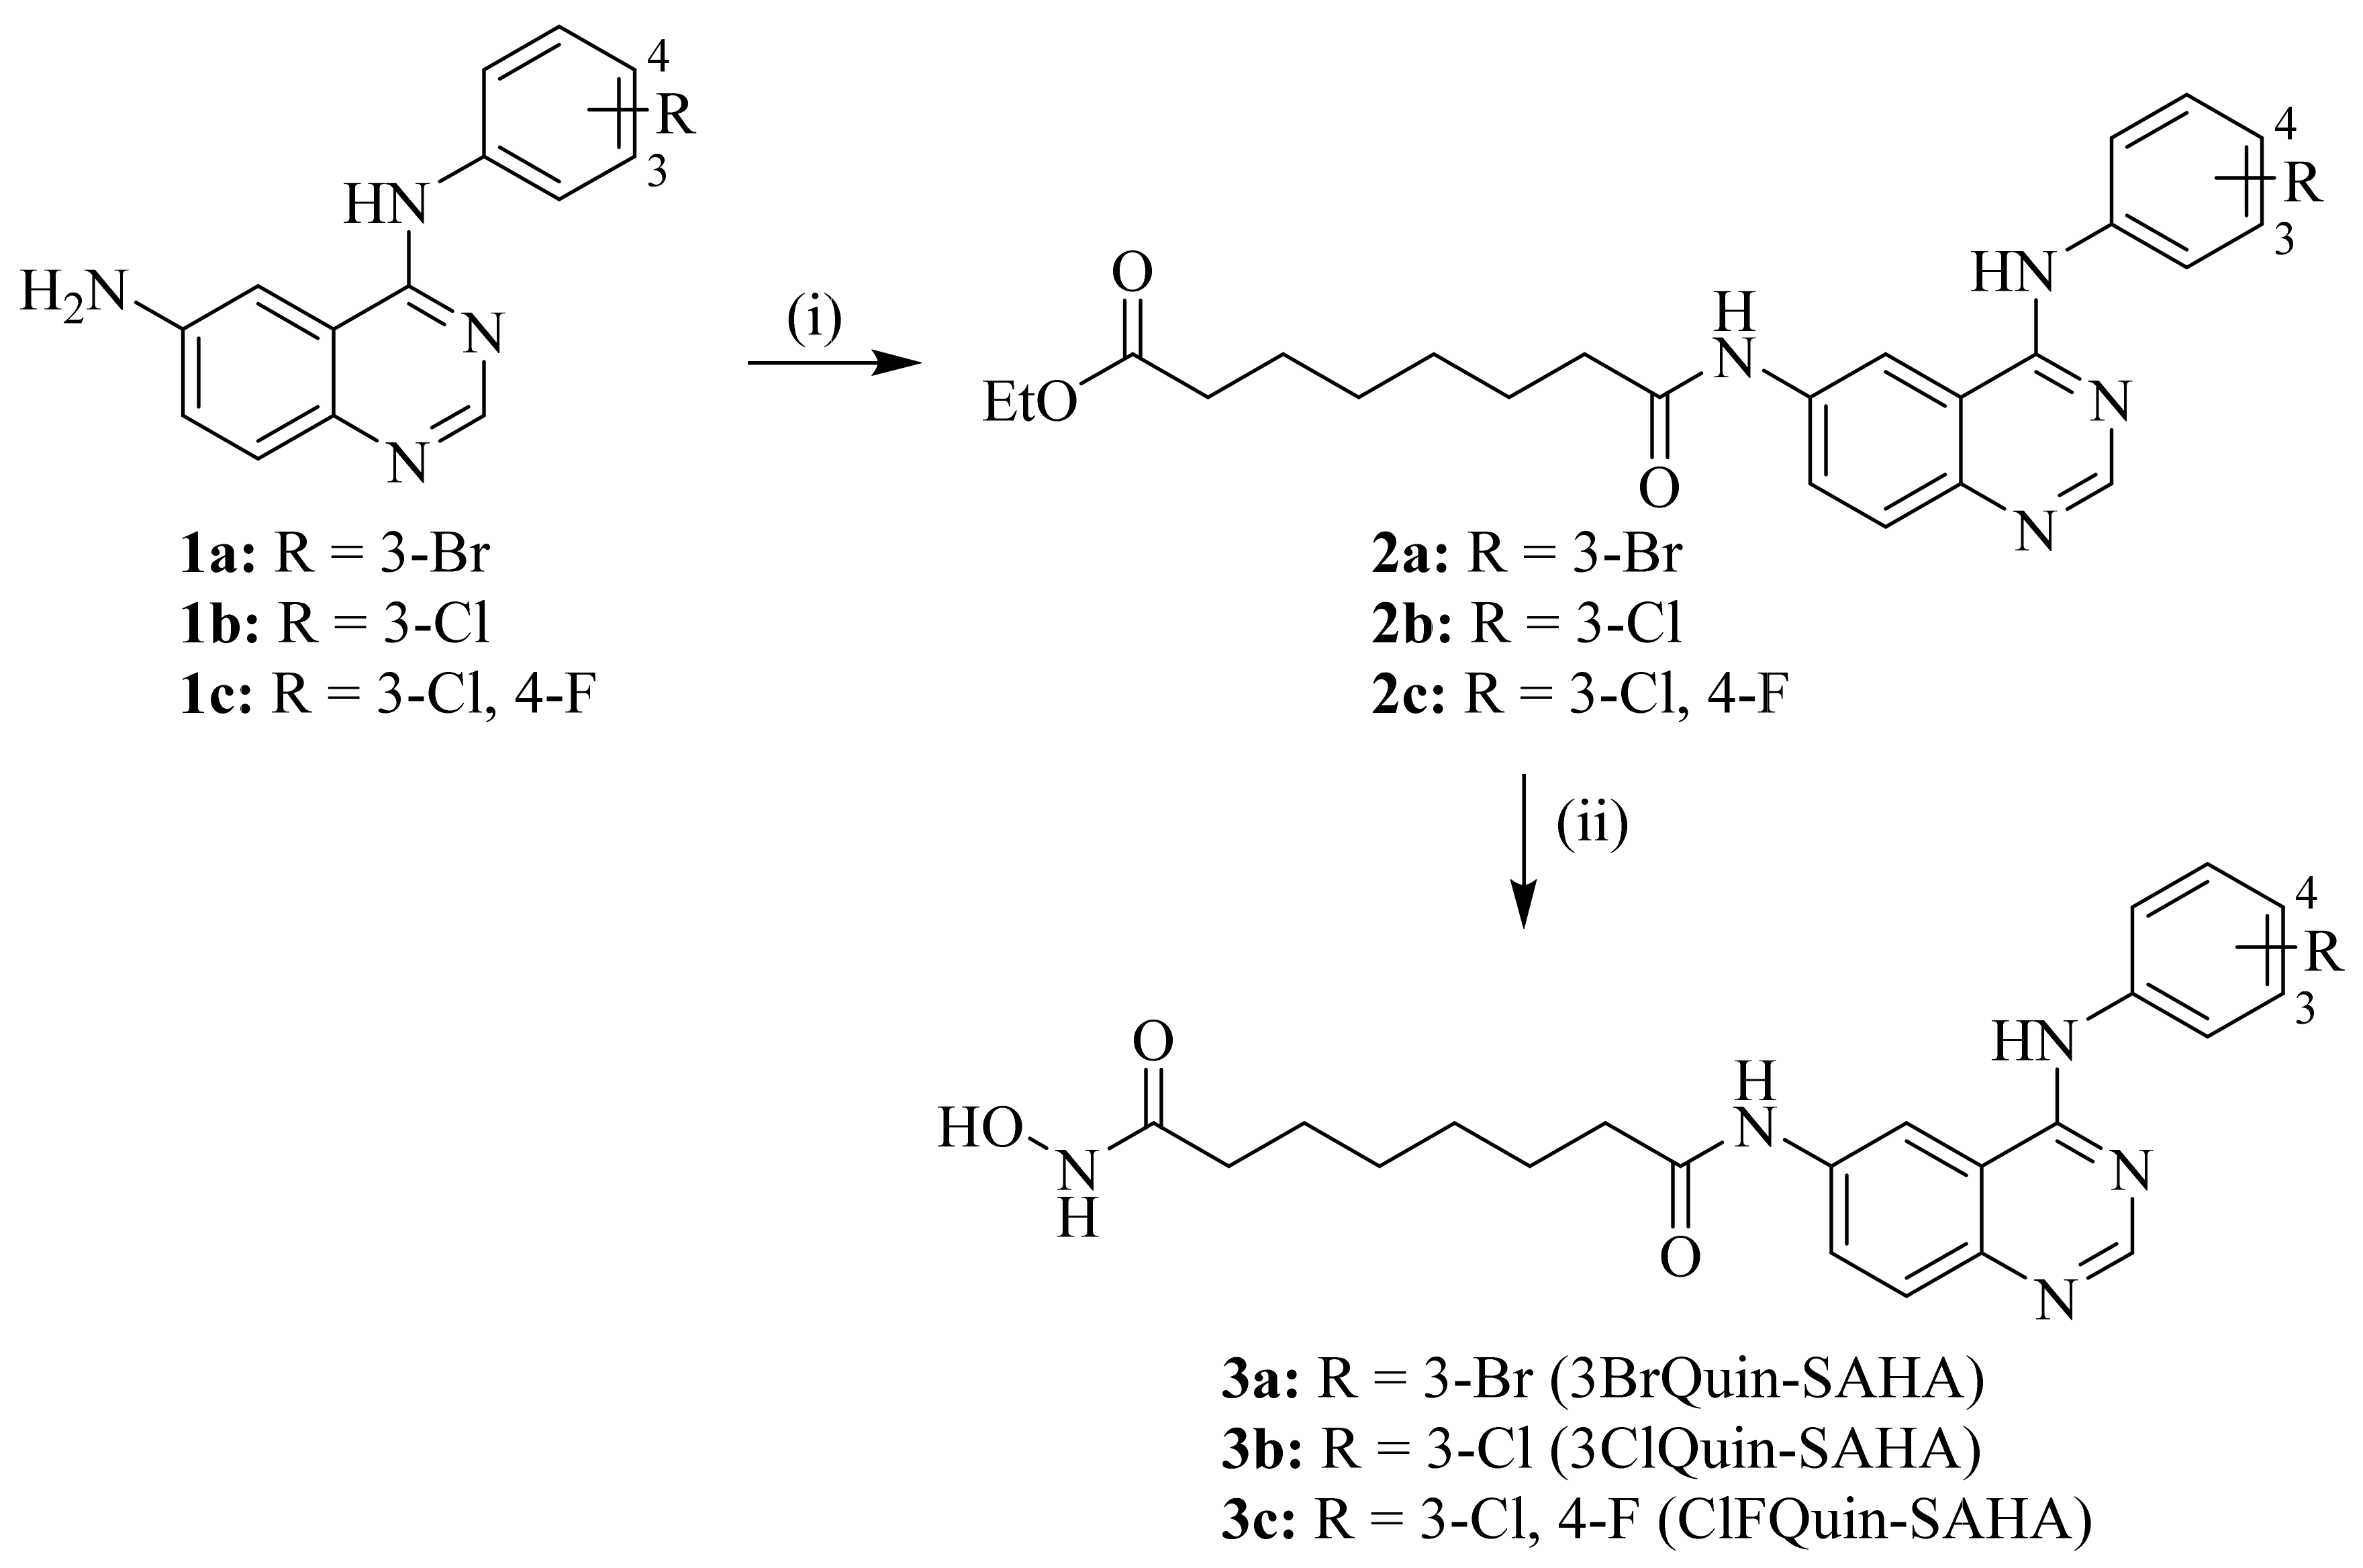
2.1. Chemistry
2.2. Biological Evaluation
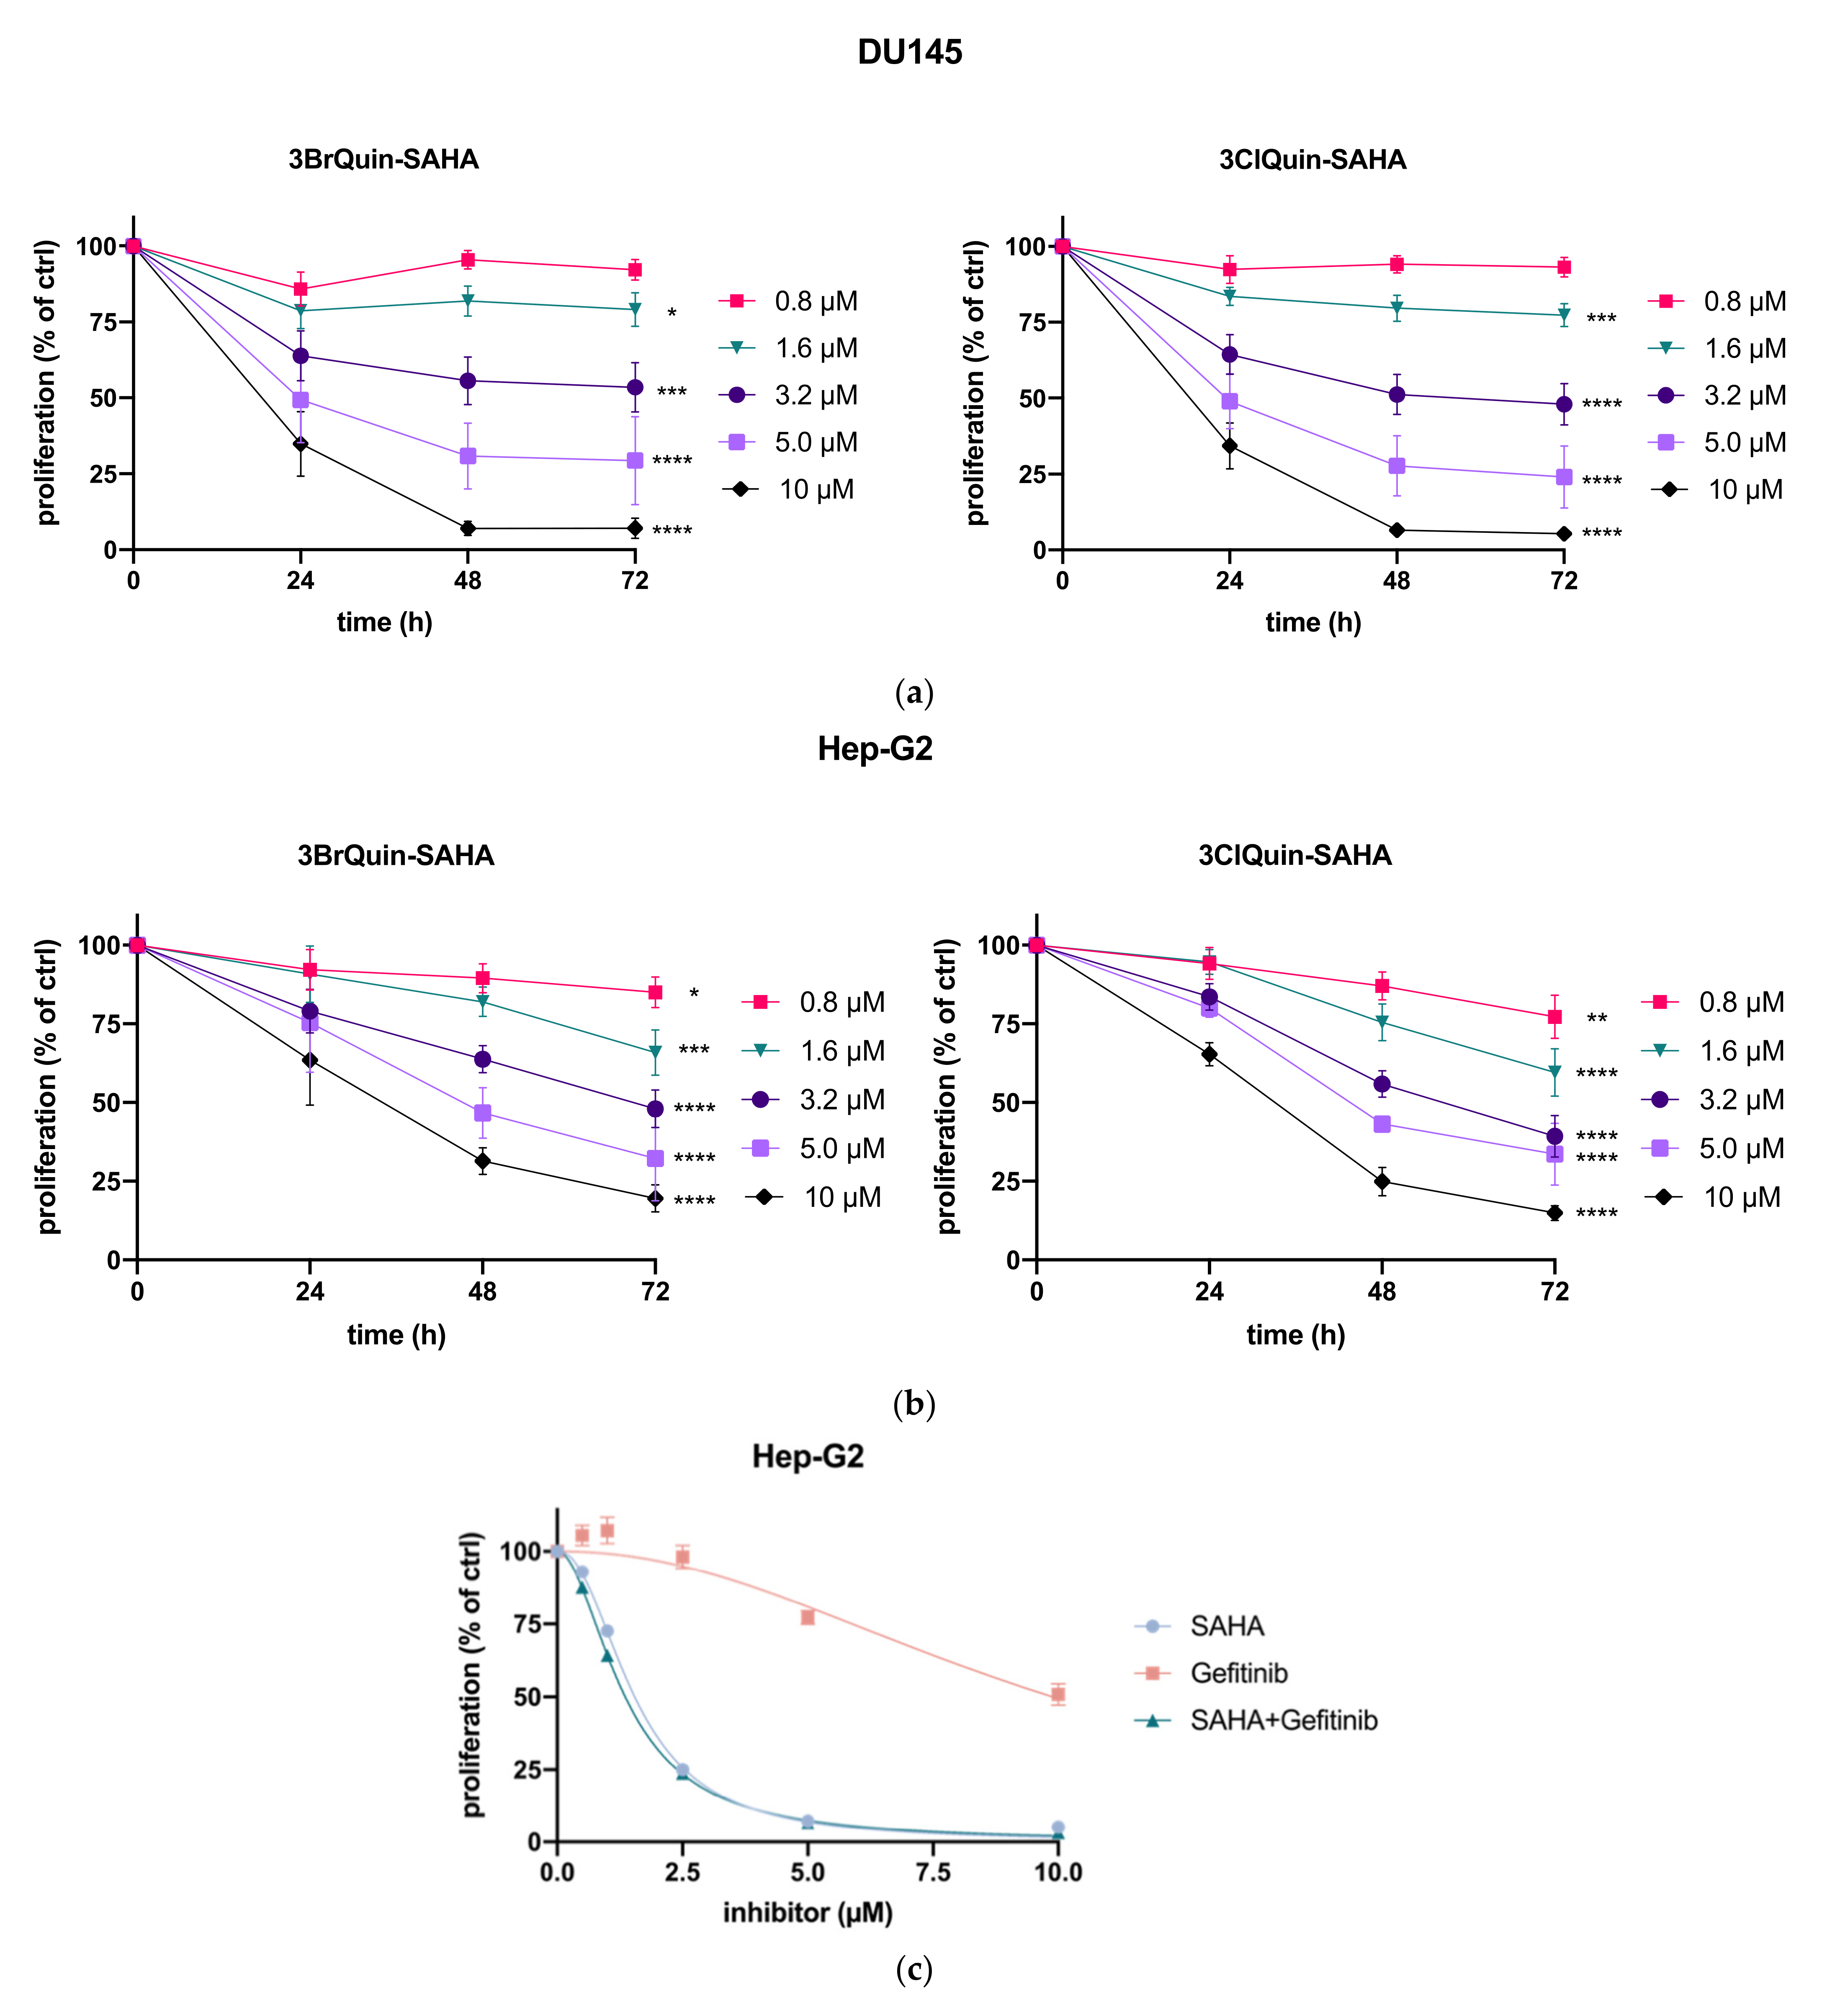
2.2.1. Antiproliferative Effects
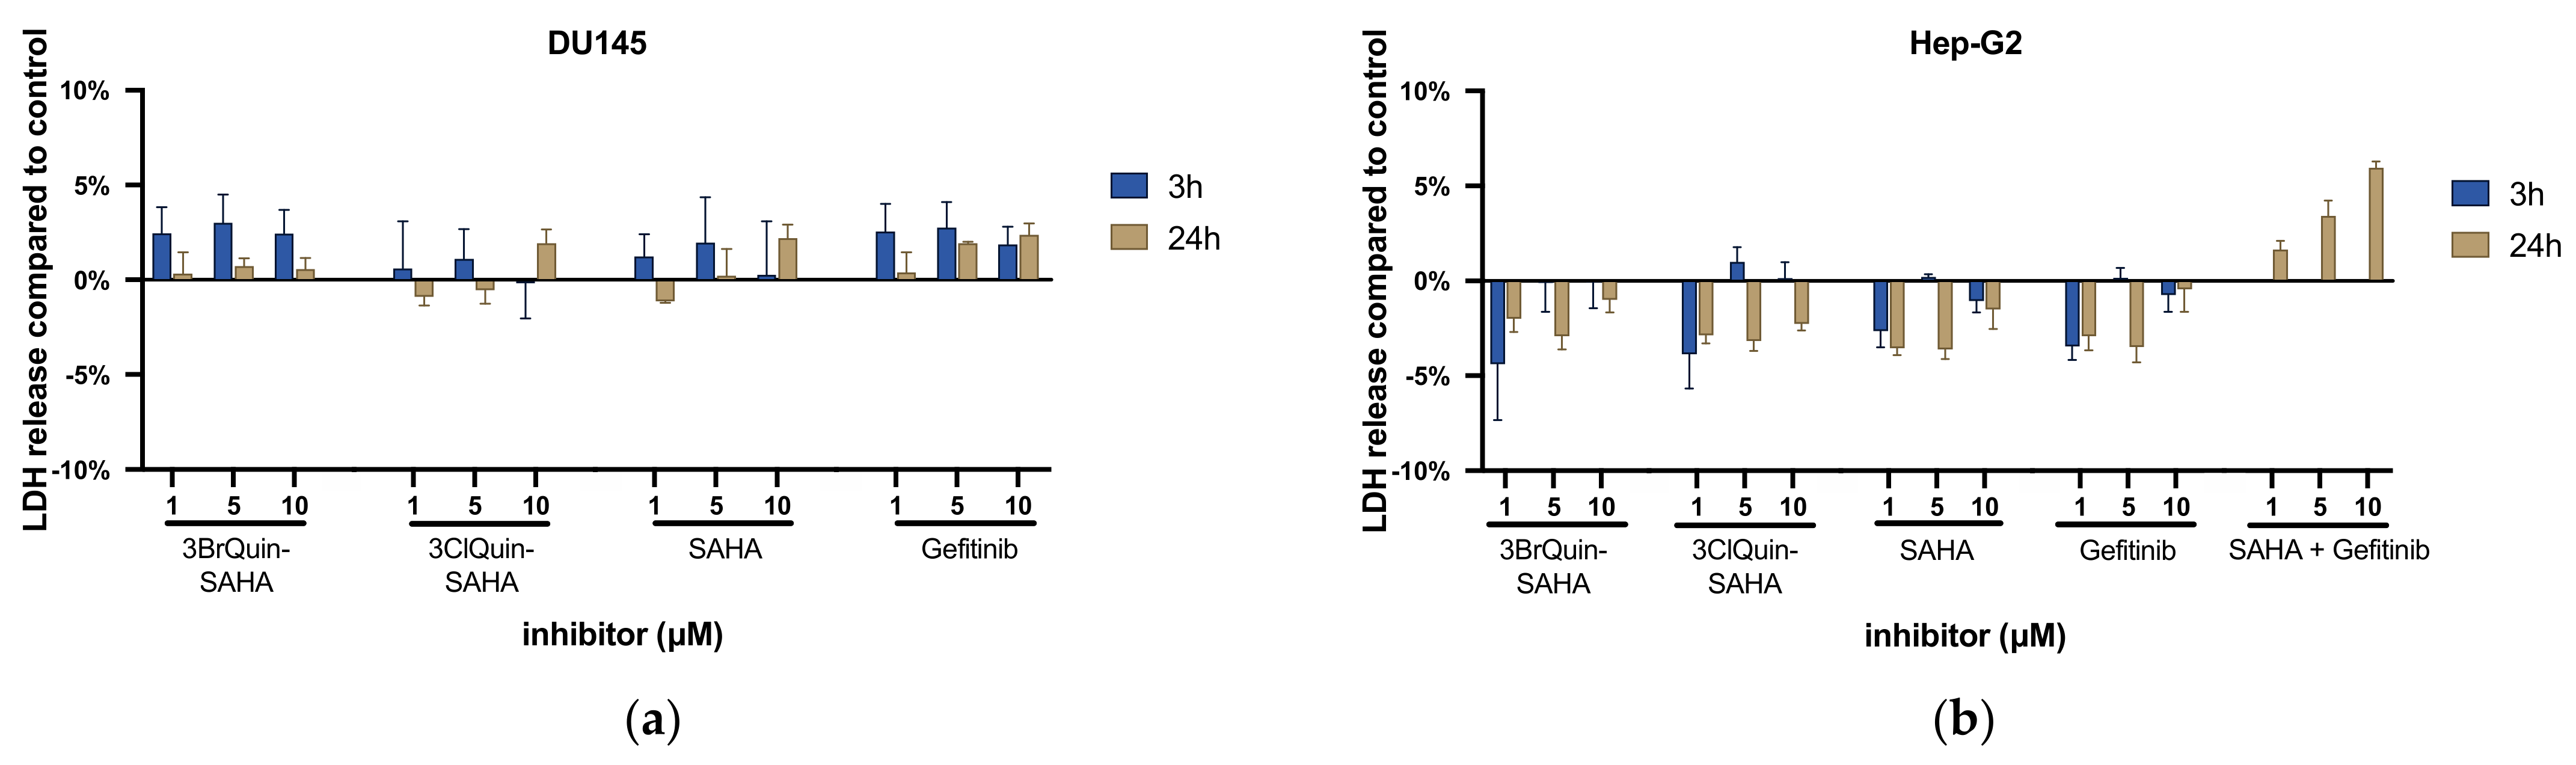
2.2.2. Cytotoxicity of 3BrQuin-SAHA and 3ClQuin-SAHA
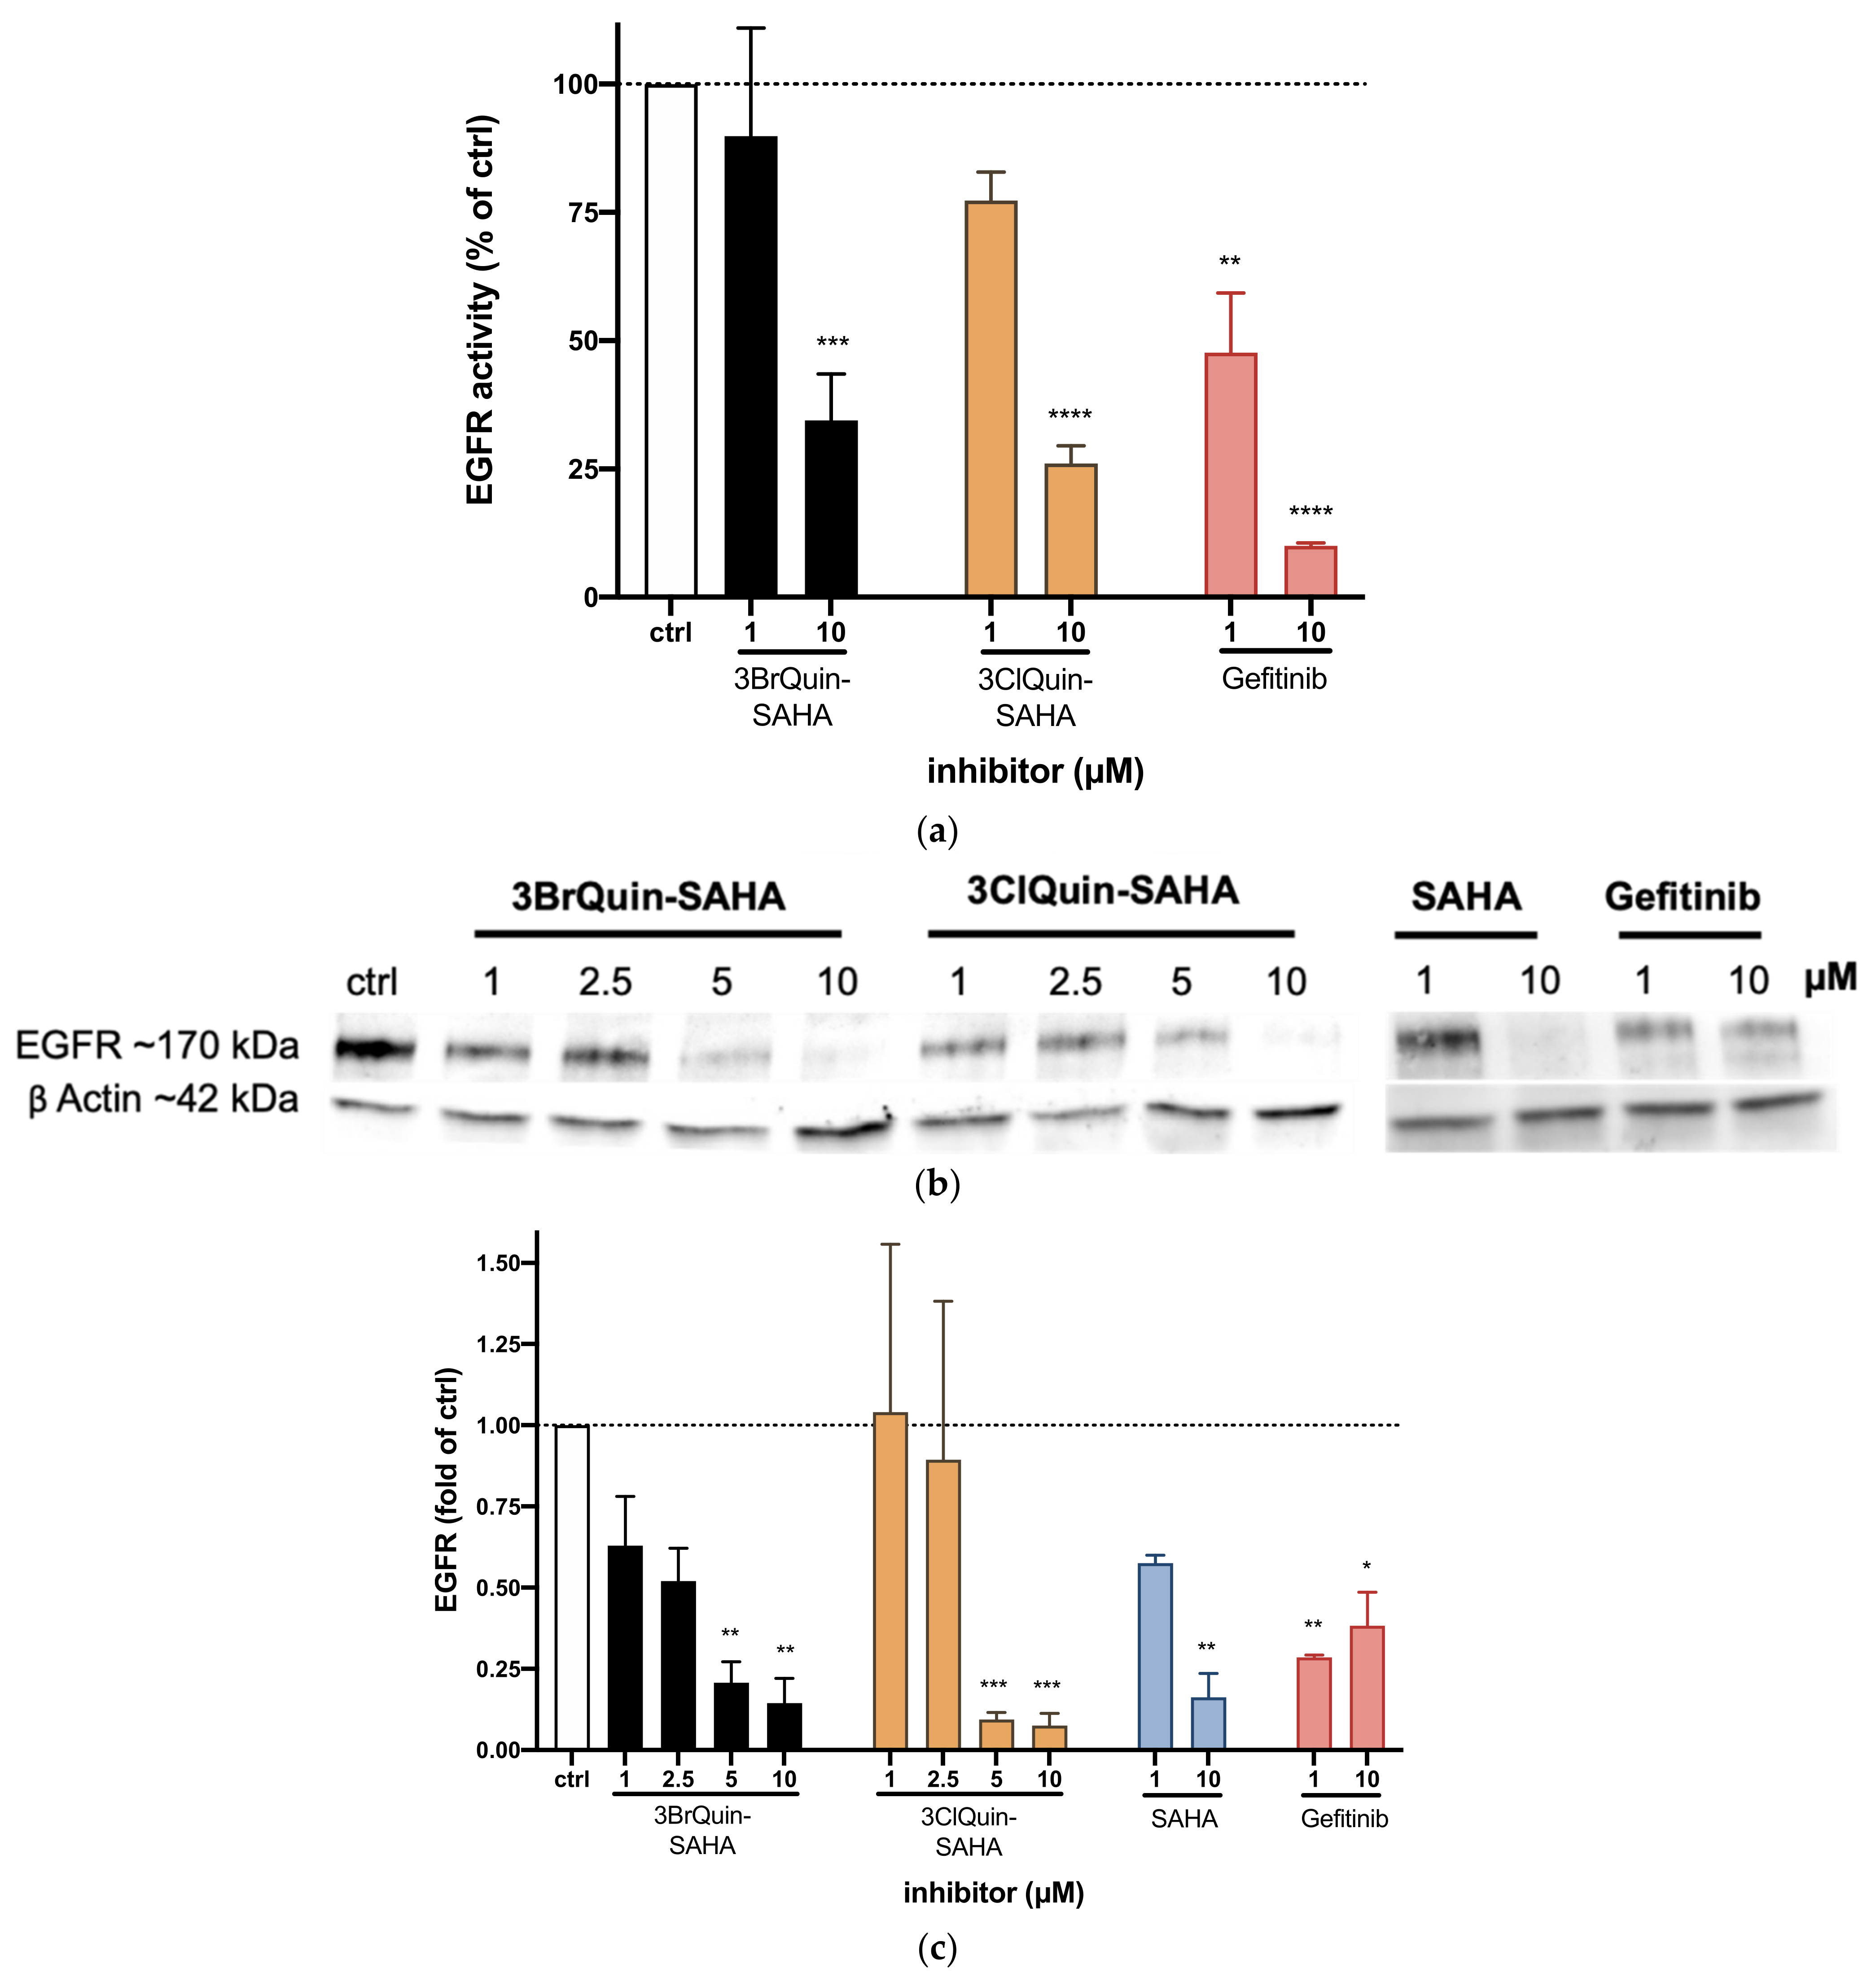
2.2.3. EGFR Tyrosine Kinase Inhibition by 3BrQuin-SAHA and 3ClQuin-SAHA
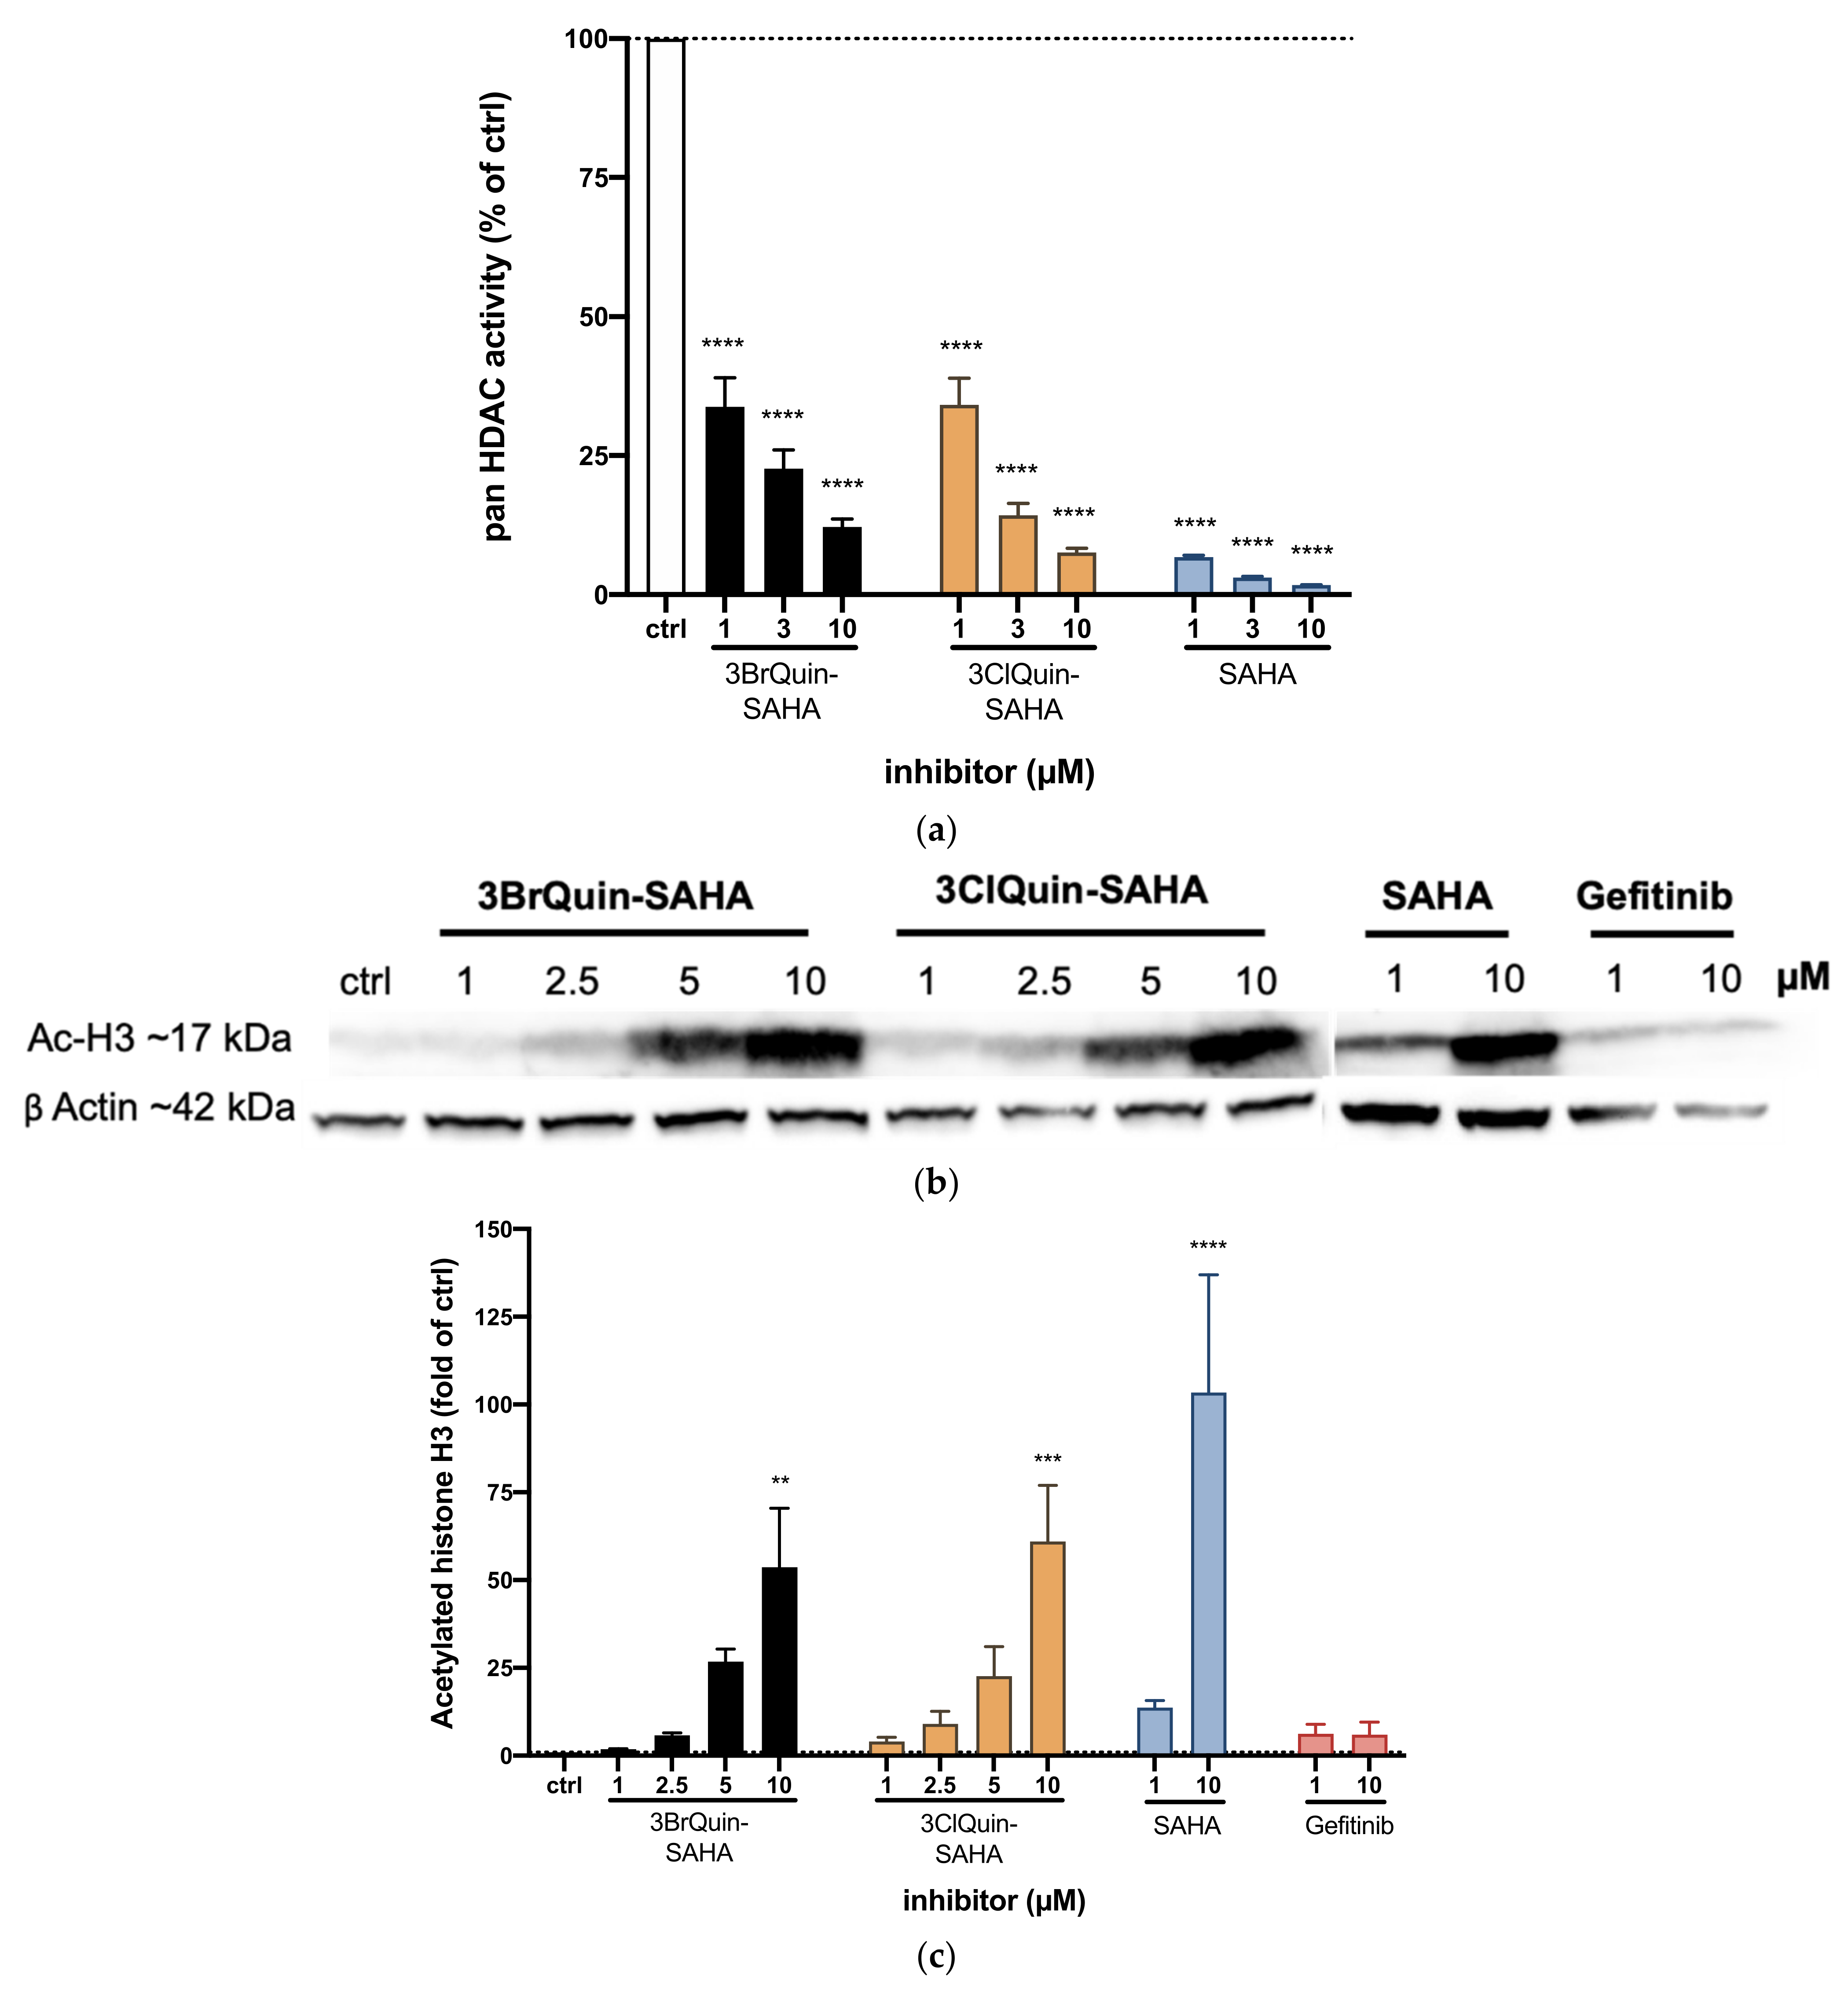
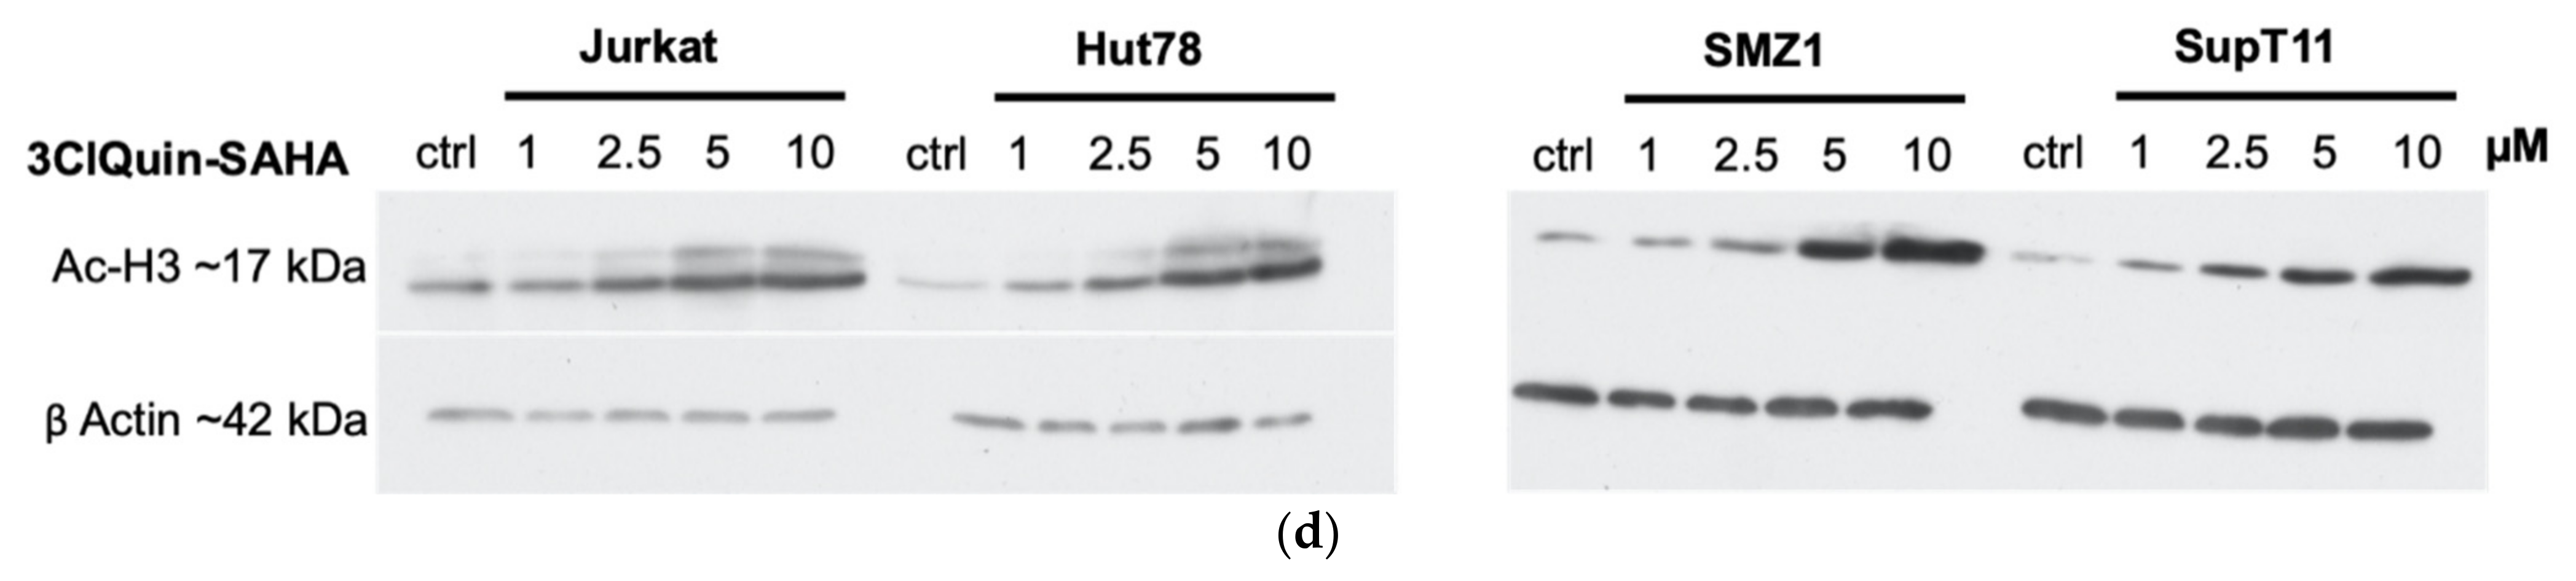
2.2.4. HDAC Inhibition by 3BrQuin-SAHA and 3ClQuin-SAHA
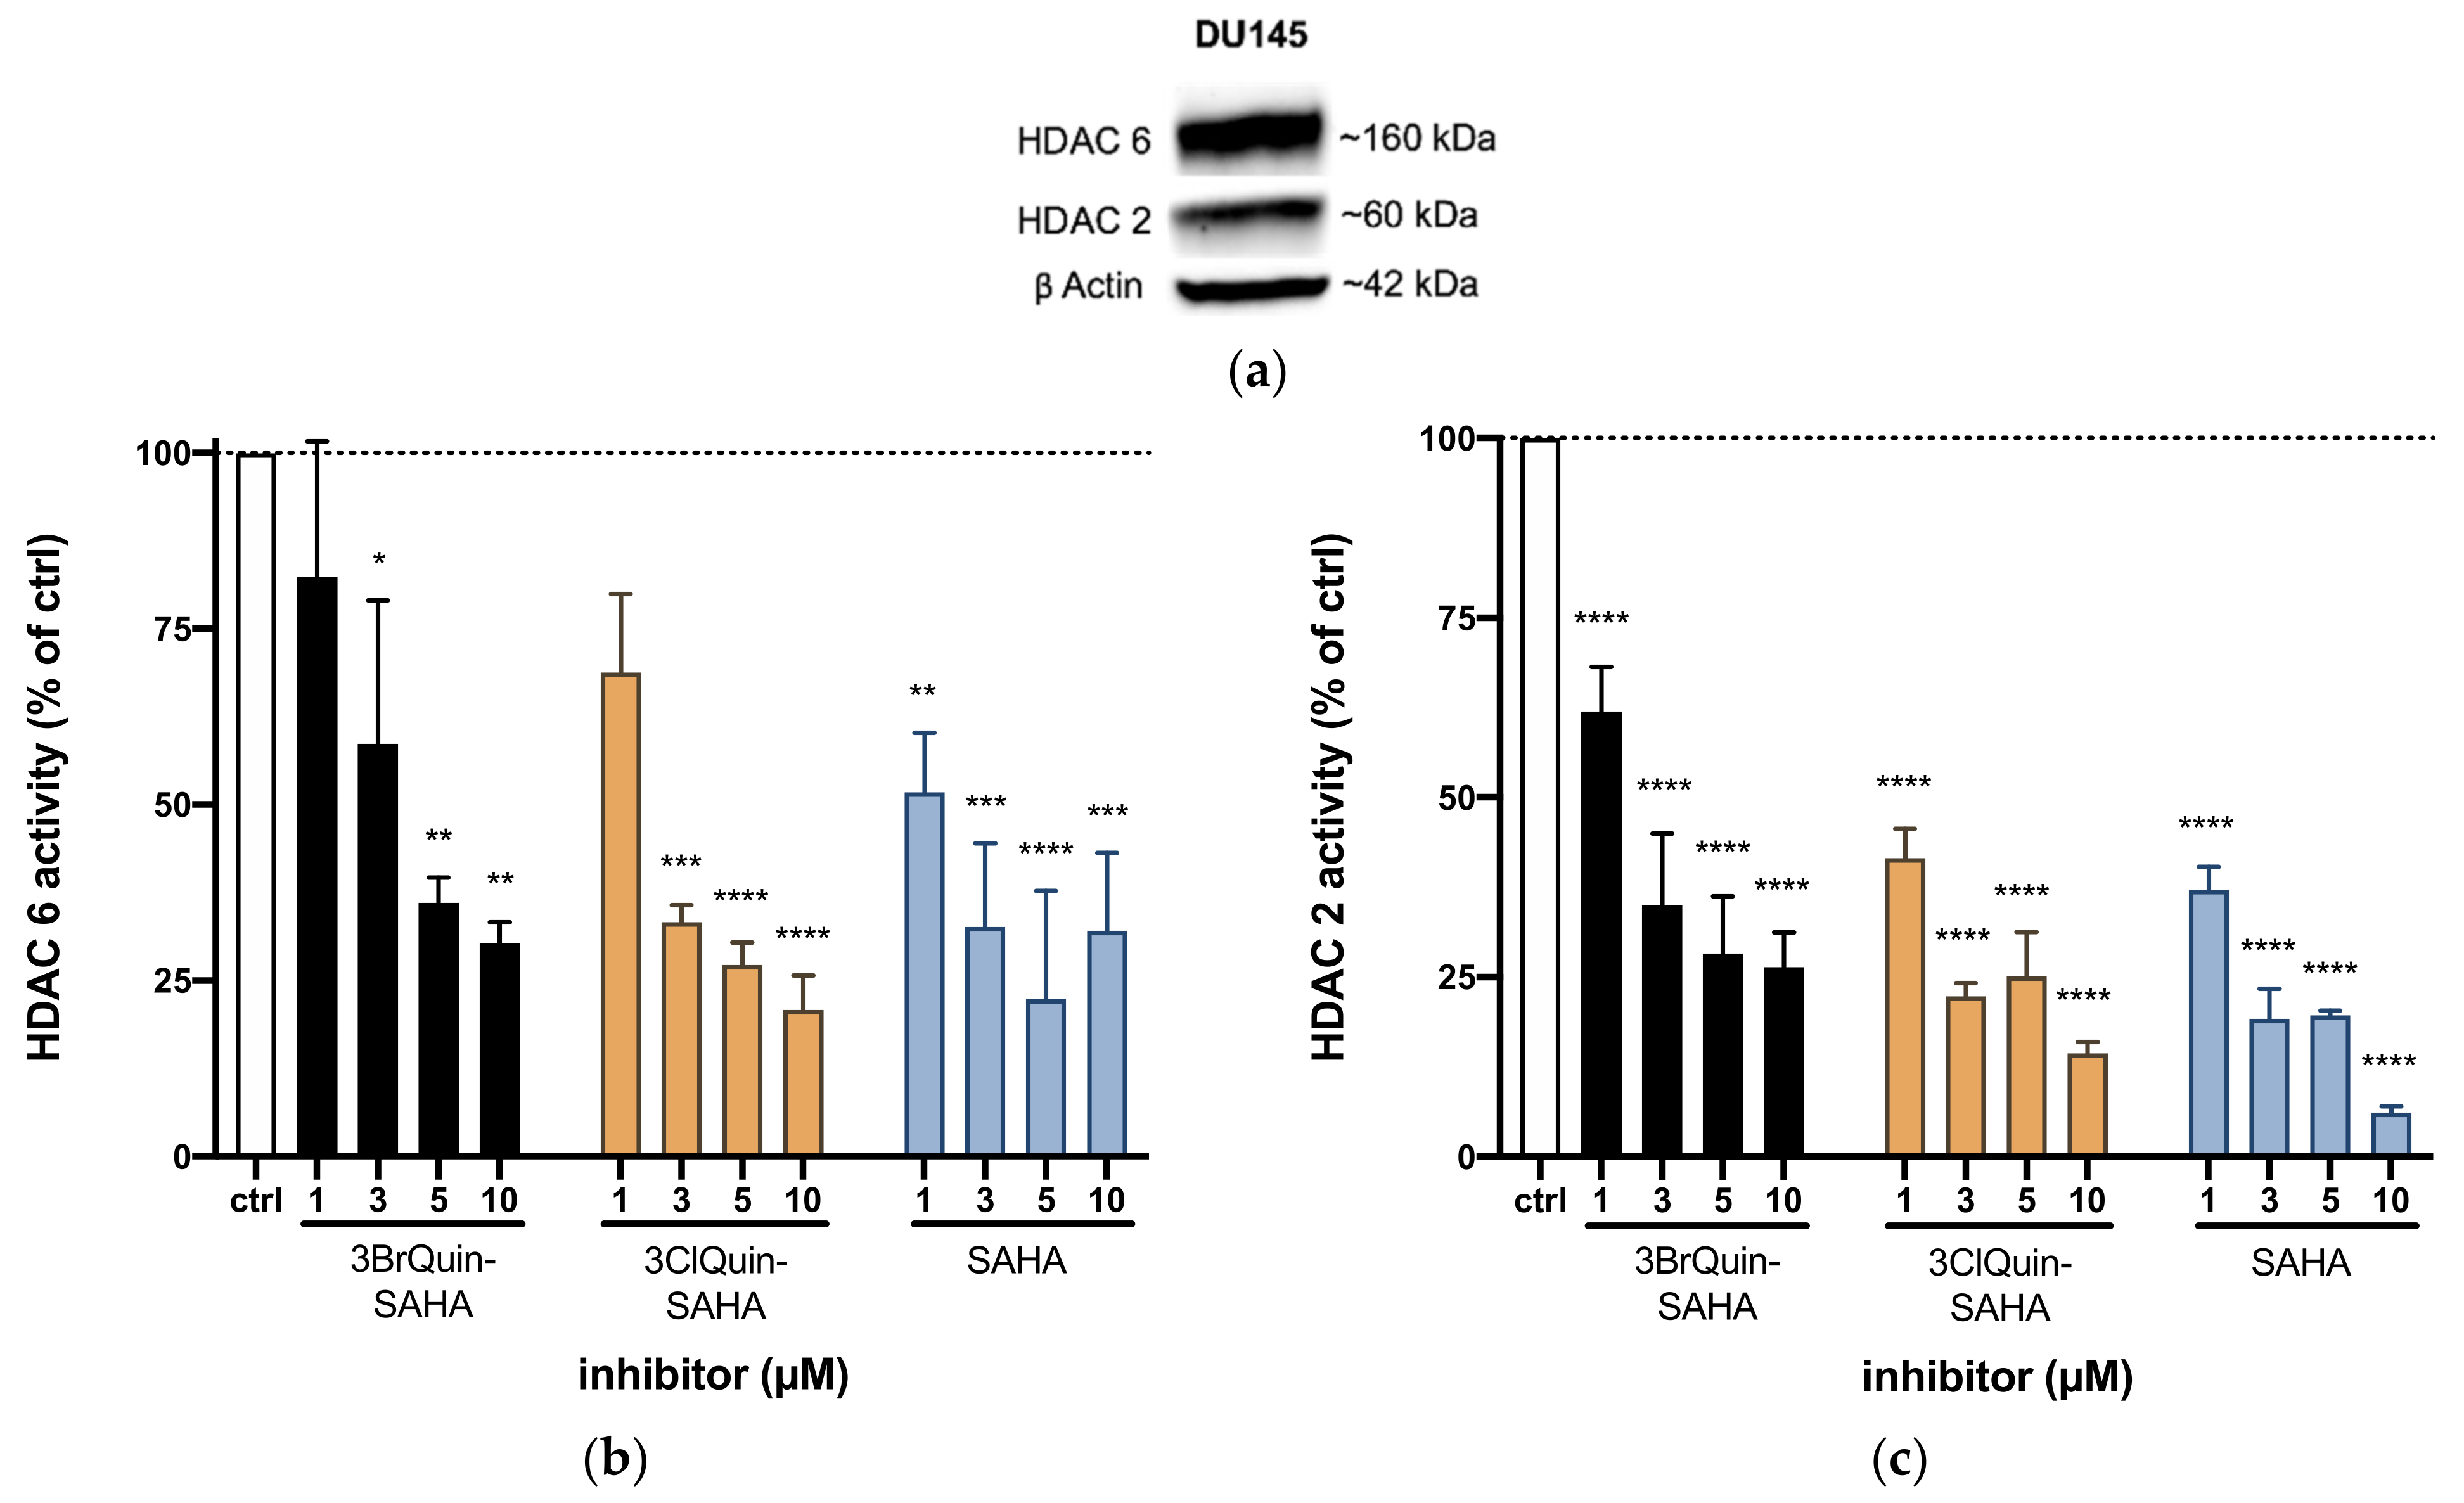
2.2.5. Subtype Specific HDAC Inhibition of 3BrQuin-SAHA and 3ClQuin-SAHA
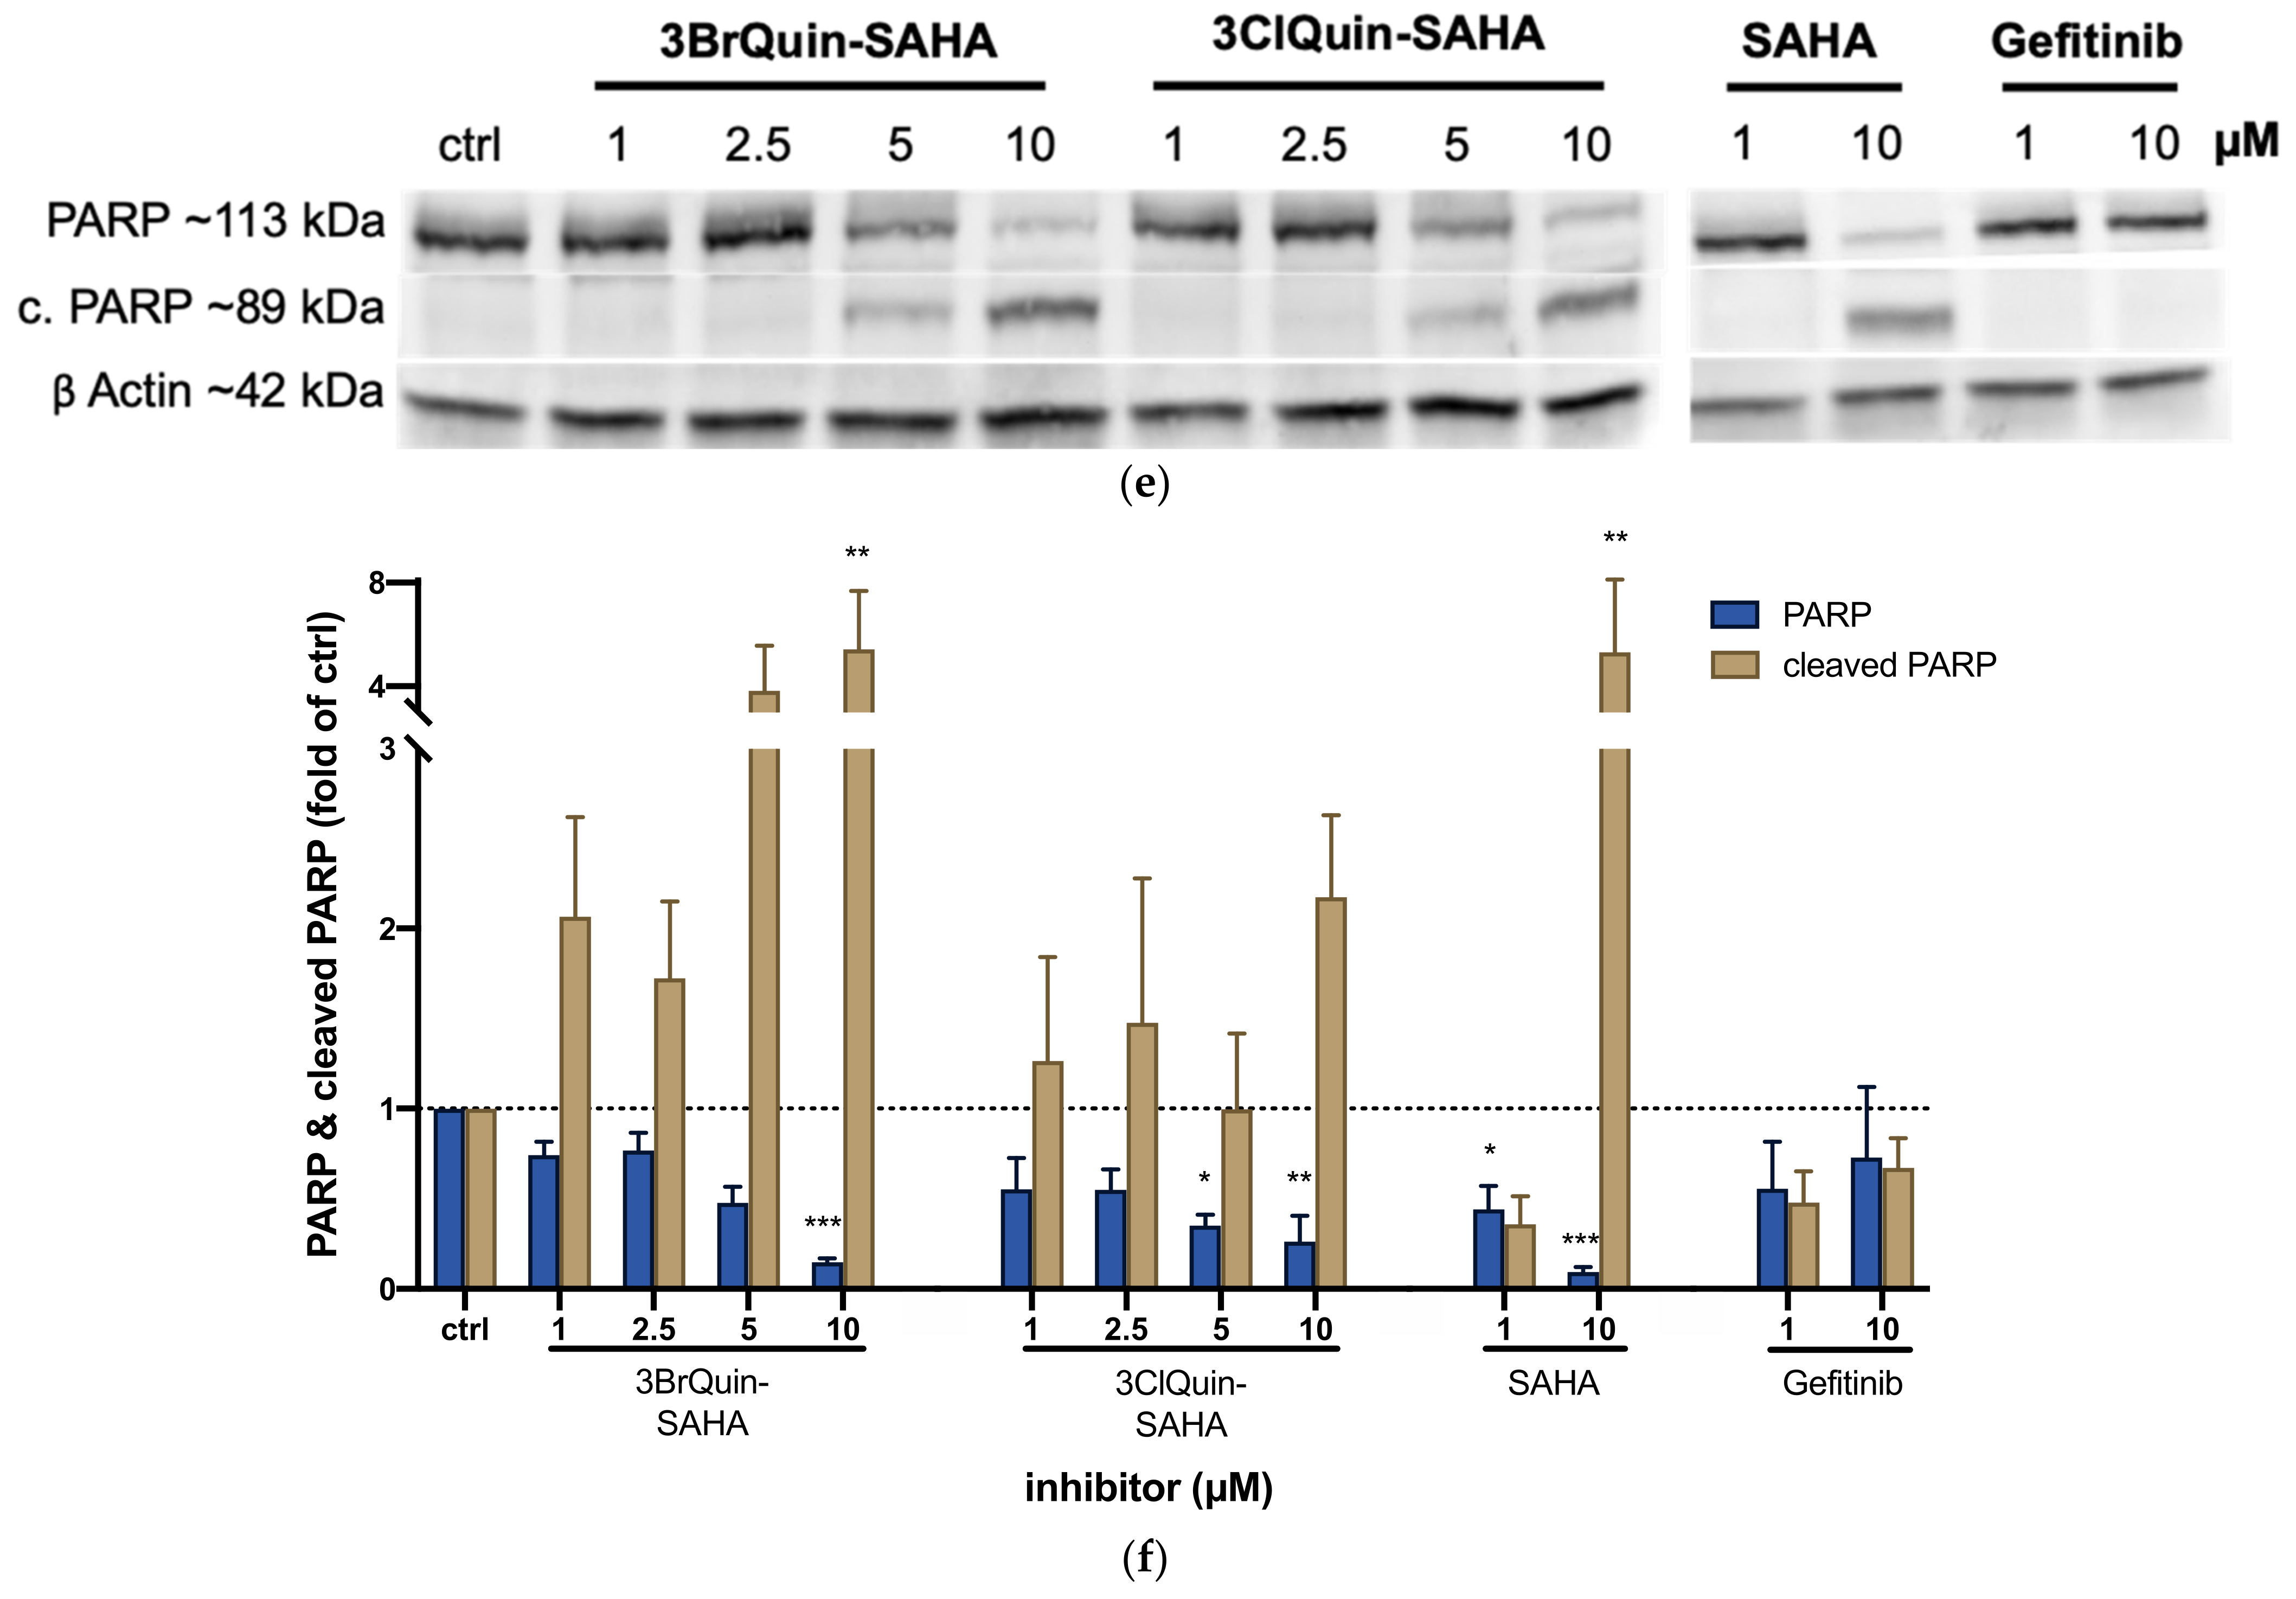
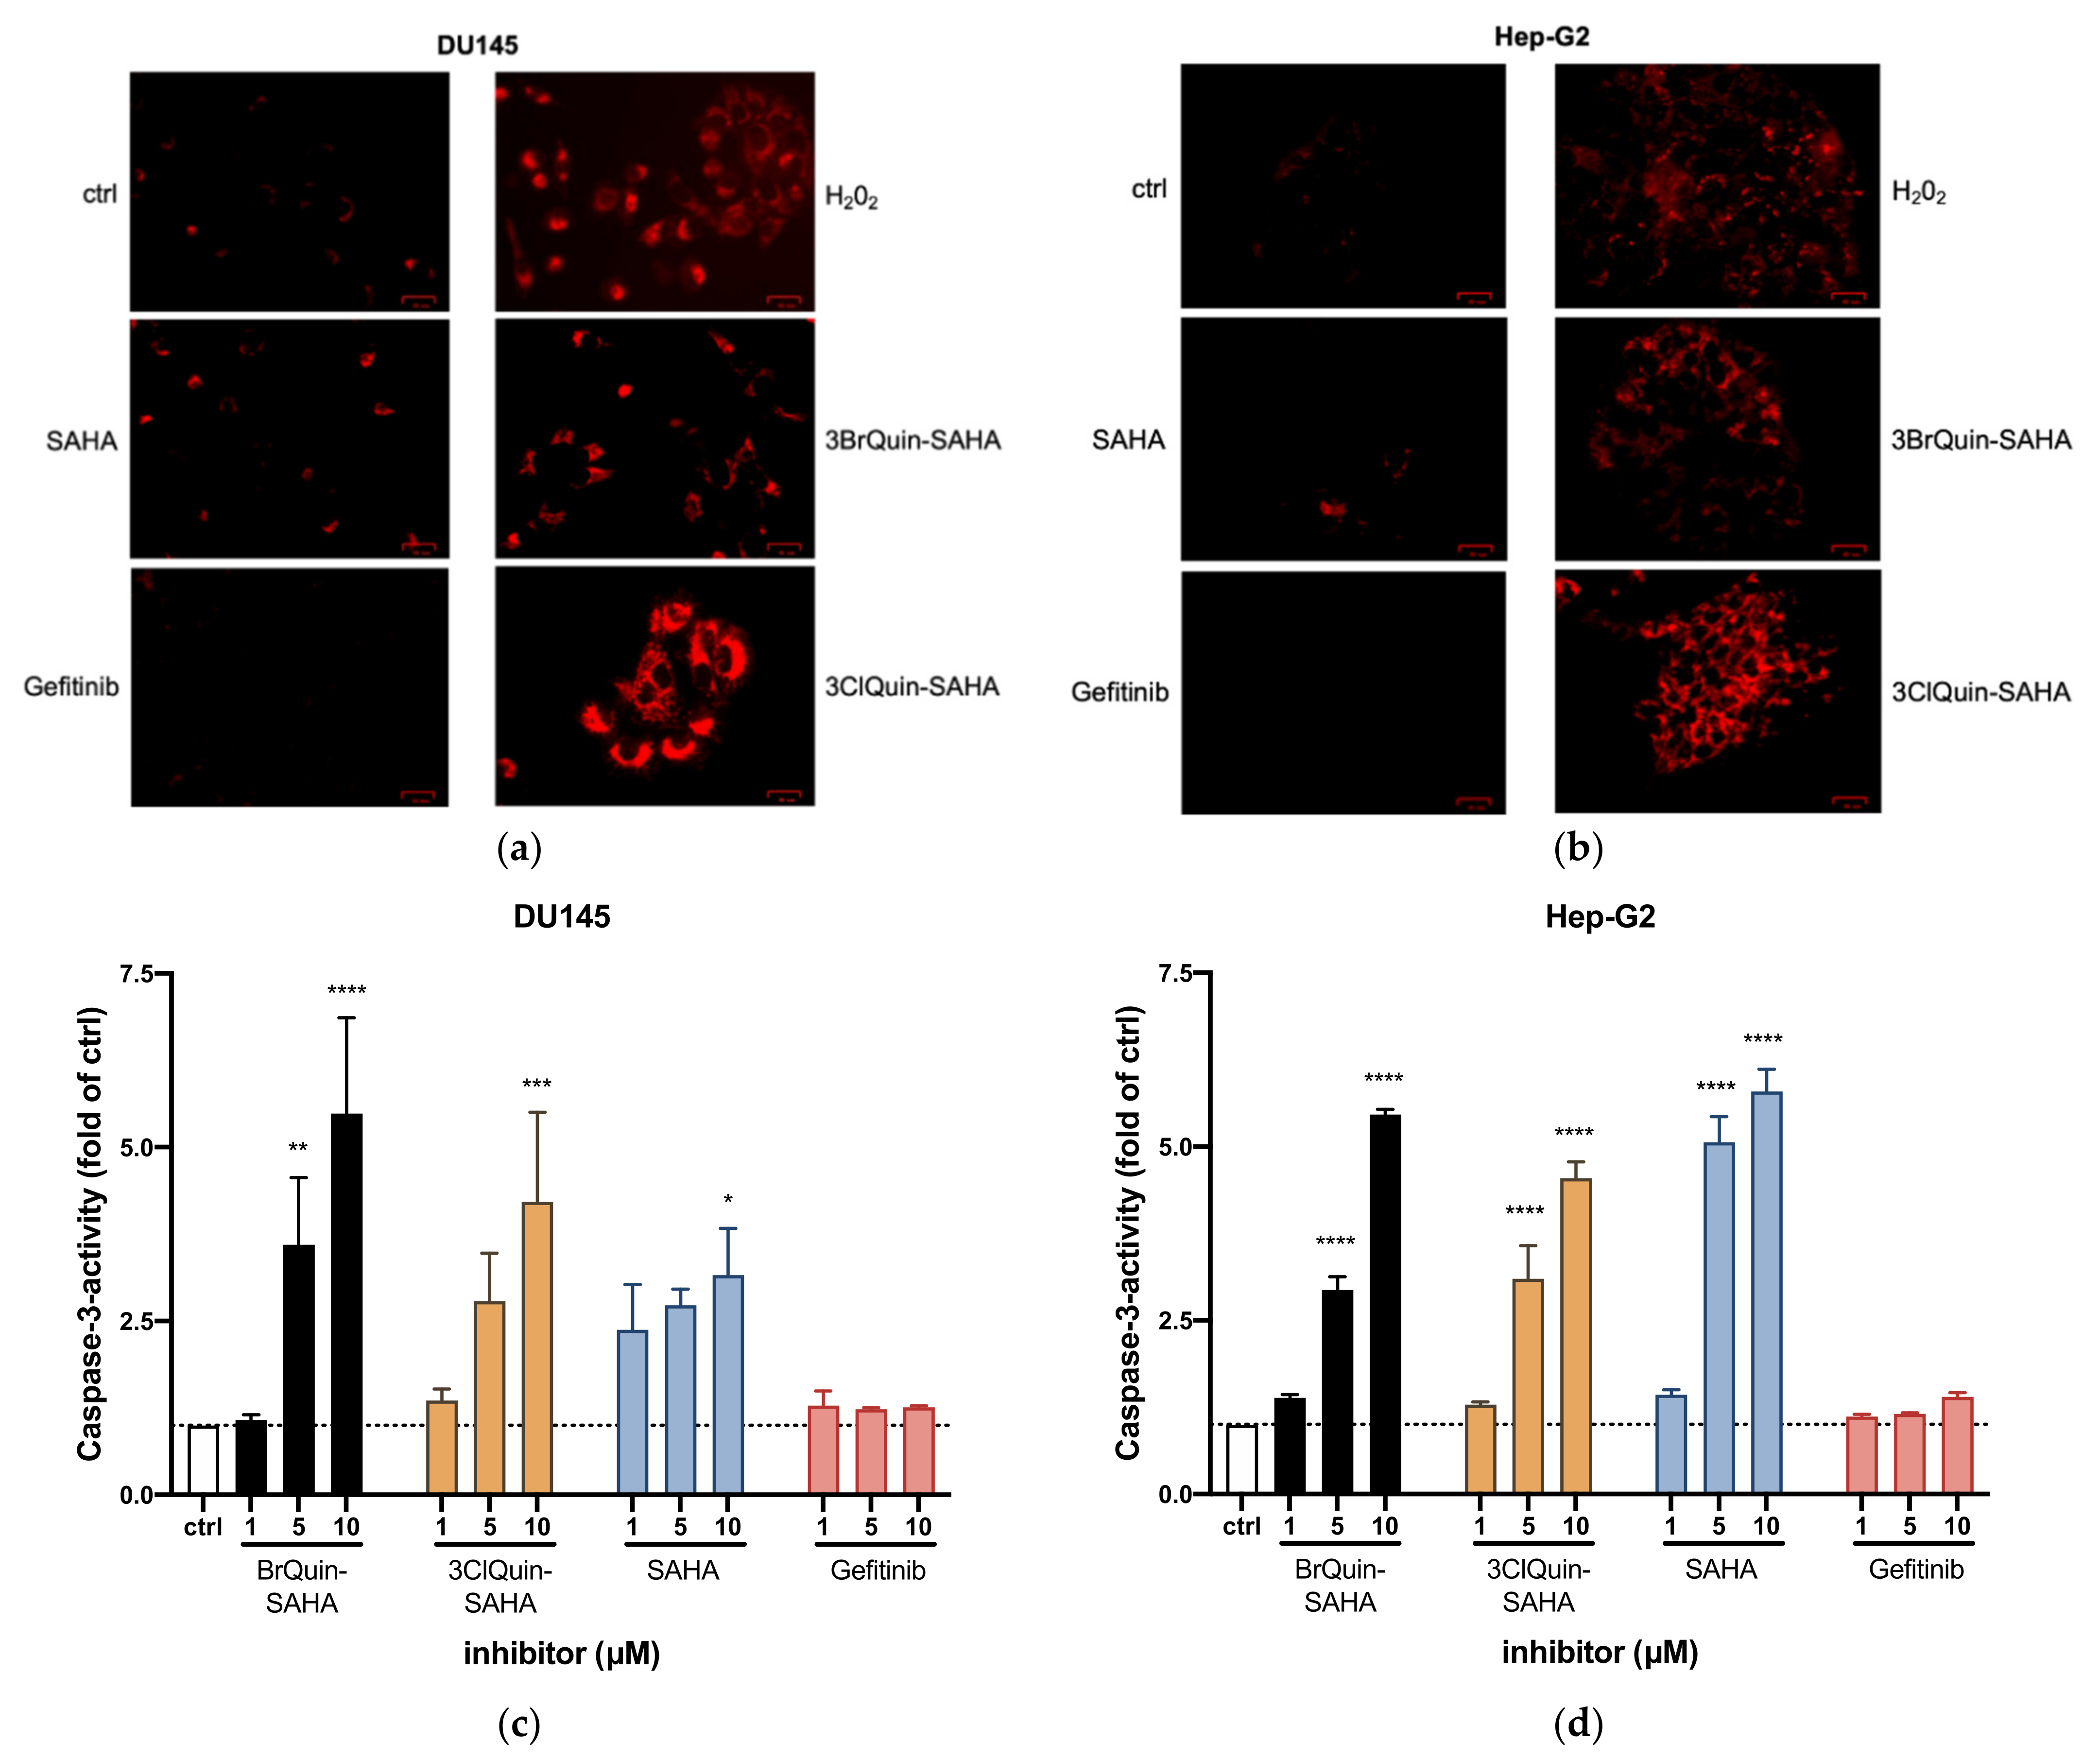
2.2.6. Induction of ROS and Apoptosis by 3BrQuin-SAHA and 3ClQuin-SAHA
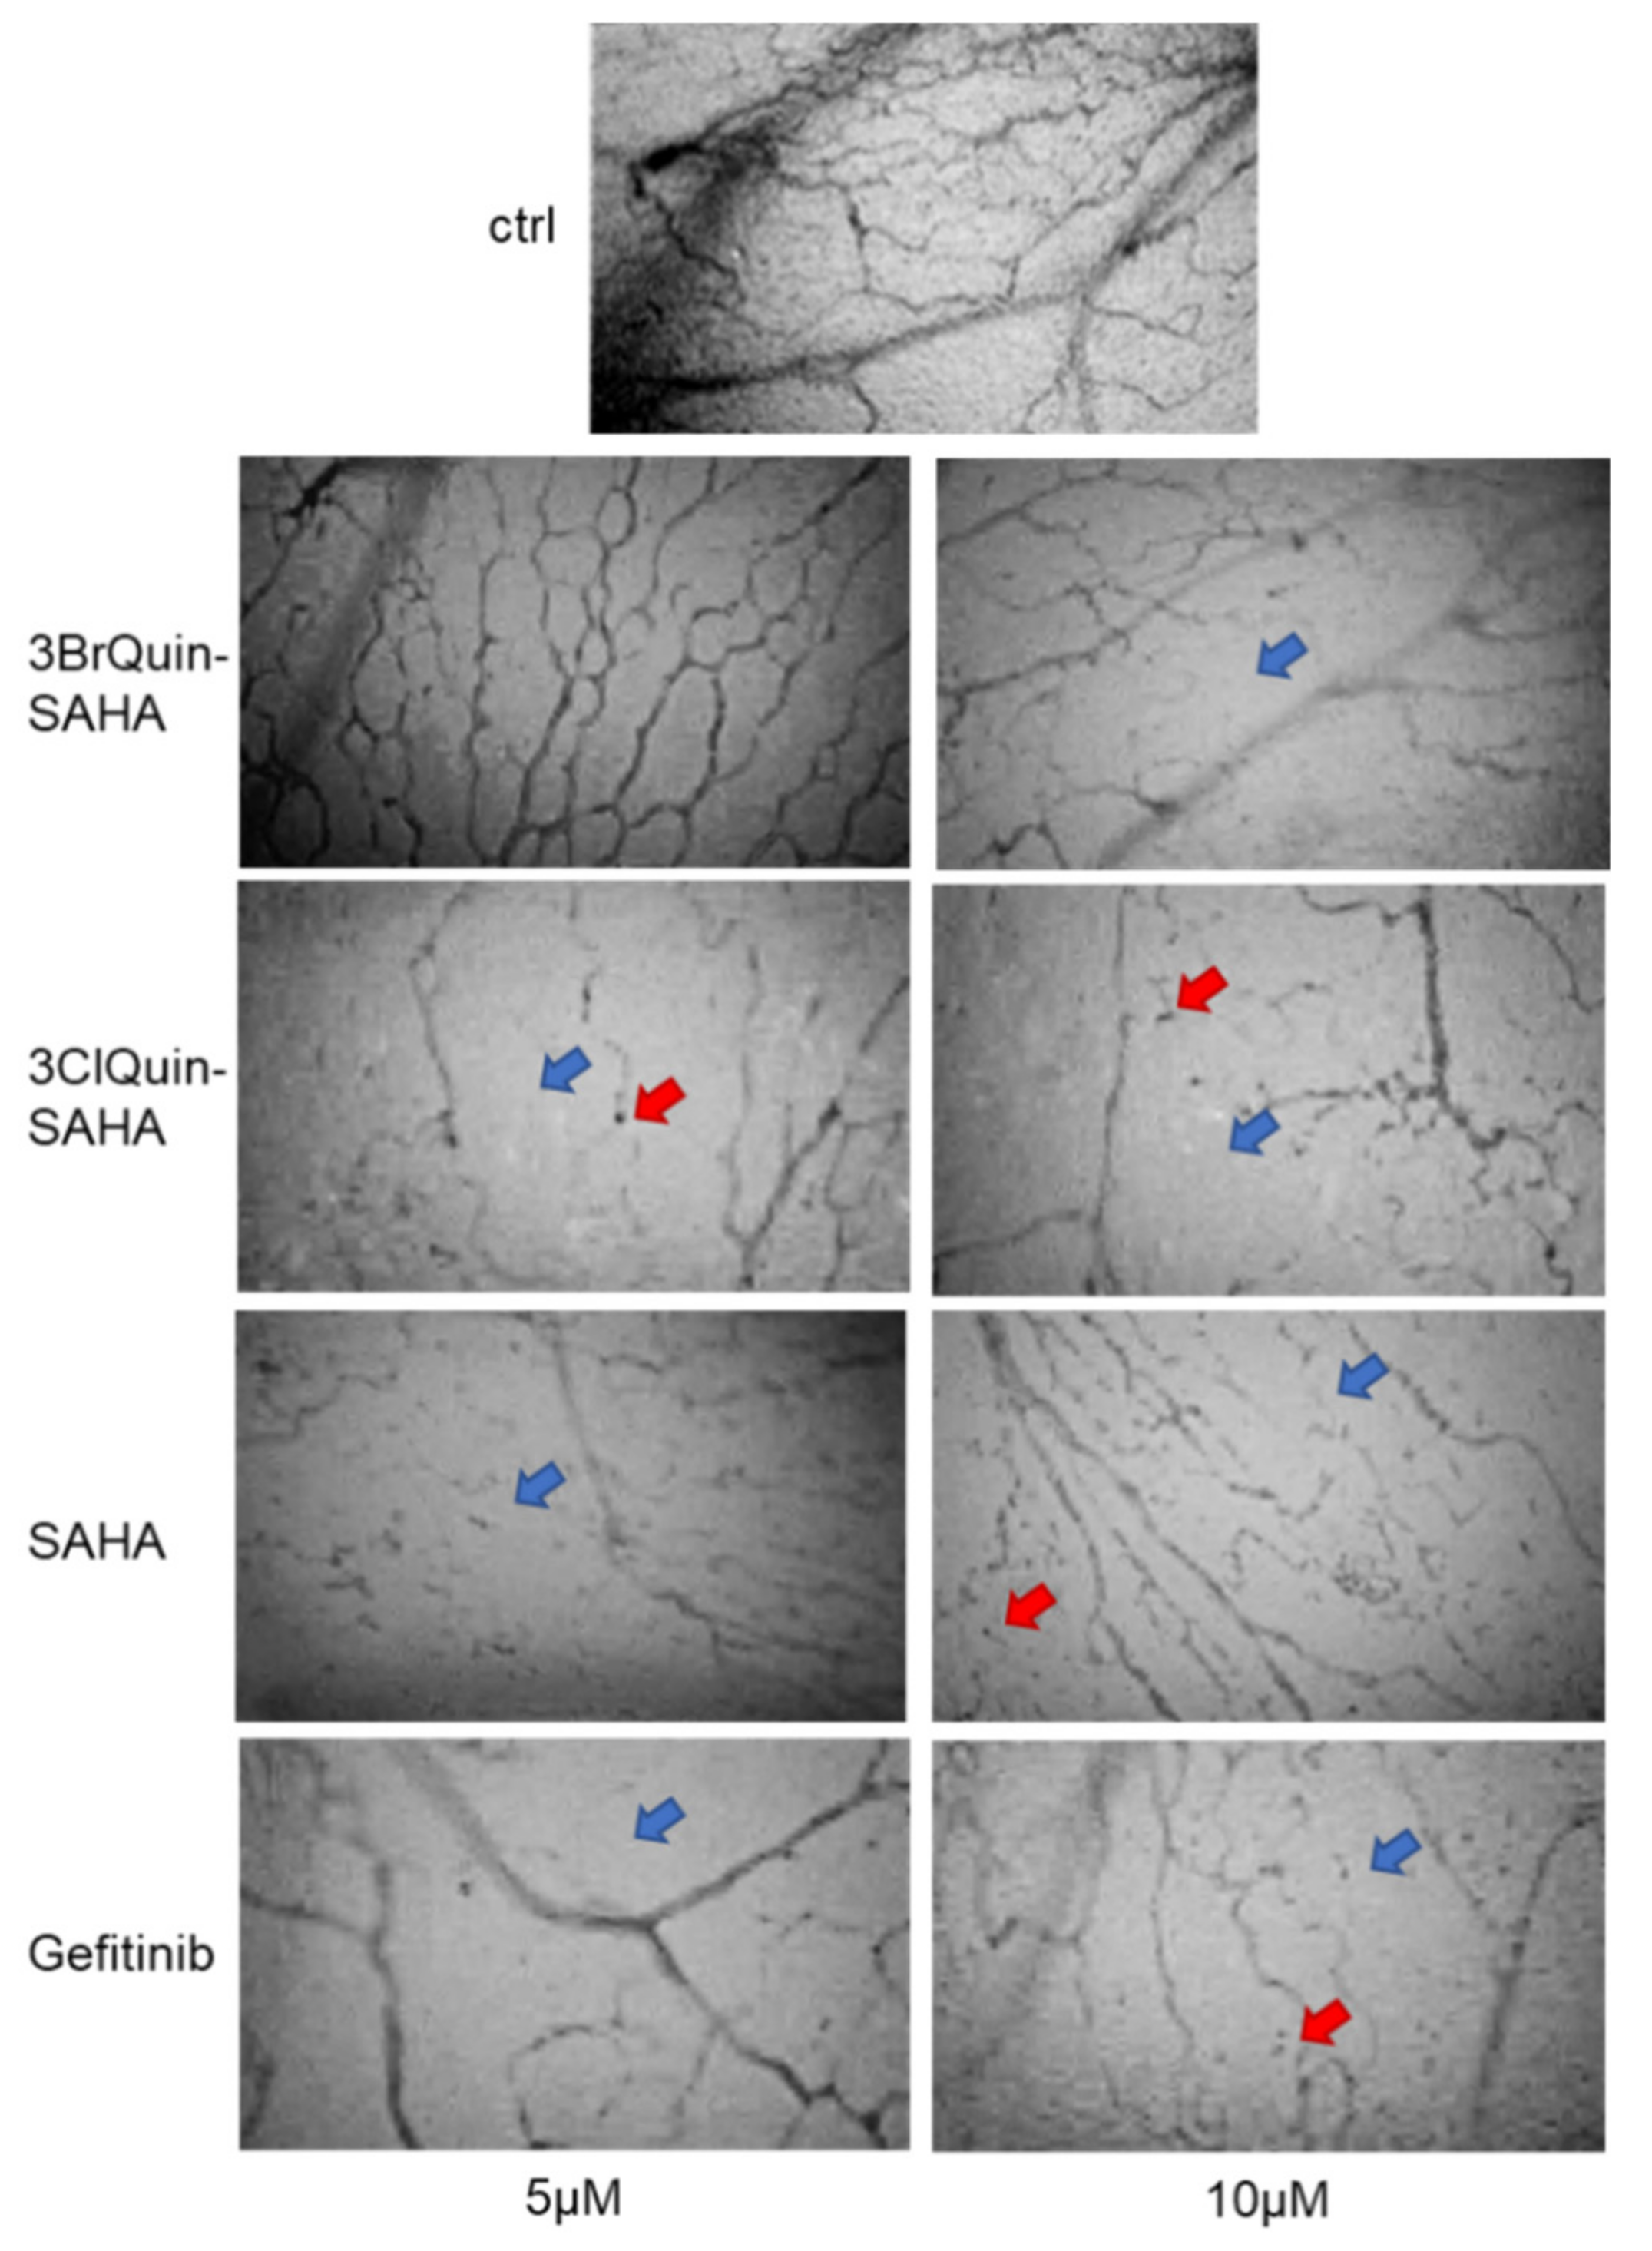
2.2.7. In Vivo Assessment of Antiangiogenetic Effects of 3BrQuin-SAHA and 3ClQuin-SAHA on the CAM of Fertilized Chicken Eggs
3. Discussion
4. Materials and Methods
4.1. General Procedures and Materials
4.2. Synthesis of Novel Chimeric HDAC/EGFR Inhibitors
4.3. Biological Evaluations
4.3.1. Cell Culture
4.3.2. Compounds
4.3.3. Determination of Growth Inhibition
4.3.4. Determination of Unspecific Cytotoxicity
4.3.5. EGFR Kinase Inhibition
4.3.6. Inhibition of HDAC Activity
4.3.7. Measurement of Apoptosis-Specific Caspase-3 Activity
4.3.8. Measurement of Reactive Oxygen Species (ROS)
4.3.9. Western Blot
4.3.10. In Vivo/Ovo Evaluation of Angiogenesis
4.3.11. Statistical Analysis
Supplementary Materials
Author Contributions
Funding
Institutional Review Board Statement
Informed Consent Statement
Data Availability Statement
Conflicts of Interest
Abbreviations
| CAM | Chorioallantoic membrane |
| EGFR | Epidermal growth factor receptor |
| HCC | Hepatocellular carcinoma |
| HDAC | Histone deacetylase |
| LDH | Lactate dehydrogenase |
| PCa | Prostate cancer |
| ROS | Reactive oxygen species |
References
- Hesham, H.M.; Lasheen, D.; Abouzid, K.A. Chimeric HDAC inhibitors: Comprehensive review on the HDAC-based strategies developed to combat cancer. Med. Res. Rev. 2018, 38, 2058–2109. [Google Scholar] [CrossRef]
- Dong, H.; Yin, H.; Zhao, C.; Cao, J.; Xu, W.; Zhang, Y. Design, Synthesis and Biological Evaluation of Novel Osimertinib-Based HDAC and EGFR Dual Inhibitors. Molecules 2019, 24, 2407. [Google Scholar] [CrossRef] [Green Version]
- Steinemann, G.; Dittmer, A.; Schmidt, J.; Josuttis, D.; Fähling, M.; Biersack, B.; Beindorff, N.; Koziolek, E.J.; Schobert, R.; Brenner, W.; et al. Antitumor and antiangiogenic activity of the novel chimeric inhibitor animacroxam in testicular germ cell cancer. Mol. Oncol. 2019, 13, 2679–2696. [Google Scholar] [CrossRef]
- Biersack, B.; Polat, S.; Höpfner, M. Anticancer properties of chimeric HDAC and kinase inhibitors. Semin. Cancer Biol. 2020. [Google Scholar] [CrossRef]
- Mann, B.S.; Johnson, J.R.; Cohen, M.H.; Justice, R.; Pazdur, R. FDA Approval Summary: Vorinostat for Treatment of Advanced Primary Cutaneous T-Cell Lymphoma. Oncologist 2007, 12, 1247–1252. [Google Scholar] [CrossRef]
- Ito, Y.; Takeda, T.; Sakon, M.; Tsujimoto, M.; Higashiyama, S.; Noda, K.; Miyoshi, E.; Monden, M.; Matsuura, N. Expression and clinical significance of erb-B receptor family in hepatocellular carcinoma. Br. J. Cancer 2001, 84, 1377–1383. [Google Scholar] [CrossRef] [Green Version]
- Thomas, R.; Srivastava, S.; Katreddy, R.; Sobieski, J.; Weihua, Z. Kinase-Inactivated EGFR Is Required for the Survival of Wild-Type EGFR-Expressing Cancer Cells Treated with Tyrosine Kinase Inhibitors. Int. J. Mol. Sci. 2019, 20, 2515. [Google Scholar] [CrossRef] [Green Version]
- Kazandjian, D.; Blumenthal, G.M.; Yuan, W.; He, K.; Keegan, P.; Pazdur, R. FDA Approval of Gefitinib for the Treatment of Patients with Metastatic EGFR Mutation–Positive Non–Small Cell Lung Cancer. Clin. Cancer Res. 2016, 22, 1307–1312. [Google Scholar] [CrossRef] [Green Version]
- Ryan, Q.; Ibrahim, A.; Cohen, M.H.; Johnson, J.; Ko, C.; Sridhara, R.; Justice, R.; Pazdur, R. FDA Drug Approval Summary: Lapatinib in Combination with Capecitabine for Previously Treated Metastatic Breast Cancer that Overexpresses HER-2. Oncologist 2008, 13, 1114–1119. [Google Scholar] [CrossRef]
- Schrader, A.G.; Crispatzu, S.; Oberbeck, P.; Mayer, S.; Pützer, J.; von Jan, E.; Vasyutina, K.; Warner, N.; Weit, N.; Pflug, T.; et al. Actionable Perturbations of Damage Responses by Tcl1/Atm and Epigenetic Lesions Form the Basis of T-Pll. Nat. Commun. 2018, 9, 697. [Google Scholar] [CrossRef]
- Parhamifar, L.; Andersen, H.; Moghimi, S.M. Lactate Dehydrogenase Assay for Assessment of Polycation Cytotoxicity. Methods Mol. Biol. 2019, 1943, 291–299. [Google Scholar]
- Burhenne, J.; Liu, L.; Heilig, C.E.; Meid, A.D.; Leisen, M.; Schmitt, T.; Kasper, B.; Haefeli, W.E.; Mikus, G.; Egerer, G. Intracellular vorinostat accumulation and its relationship to histone deacetylase activity in soft tissue sarcoma patients. Cancer Chemother. Pharmacol. 2017, 80, 433–439. [Google Scholar] [CrossRef]
- Boucherat, O.; Chabot, S.; Paulin, R.; Trinh, I.; Bourgeois, A.; Potus, F.; Lampron, M.-C.; Lambert, C.; Breuils-Bonnet, S.; Nadeau, V.; et al. HDAC6: A Novel Histone Deacetylase Implicated in Pulmonary Arterial Hypertension. Sci. Rep. 2017, 7, 4546. [Google Scholar] [CrossRef] [Green Version]
- Weichert, W.; Röske, A.; Gekeler, V.; Beckers, T.; Stephan, C.; Jung, K.; Fritzsche, F.R.; Niesporek, S.; Denkert, C.; Dietel, M.; et al. Histone Deacetylases 1, 2 and 3 Are Highly Expressed in Prostate Cancer and HDAC2 Expression Is Associated with Shorter Psa Relapse Time after Radical Prostatectomy. Br. J. Cancer 2008, 98, 604–610. [Google Scholar] [CrossRef] [PubMed] [Green Version]
- Freese, K.; Seitz, T.; Dietrich, P.; Lee, S.M.; Thasler, W.E.; Bosserhoff, A.; Hellerbrand, C. Histone Deacetylase Expressions in Hepatocellular Carcinoma and Functional Effects of Histone Deacetylase Inhibitors on Liver Cancer Cells In Vitro. Cancers 2019, 11, 1587. [Google Scholar] [CrossRef] [Green Version]
- Newbold, A.; Falkenberg, K.J.; Prince, H.M.; Johnstone, R.W. How Do Tumor Cells Respond to HDAC Inhibition? FEBS J. 2016, 283, 4032–4046. [Google Scholar] [CrossRef] [Green Version]
- Gupta, S.C.; Hevia, D.; Patchva, S.; Park, B.; Koh, W.; Aggarwal, B.B. Upsides and Downsides of Reactive Oxygen Species for Cancer: The Roles of Reactive Oxygen Species in Tumorigenesis, Prevention, and Therapy. Antioxid. Redox Signal. 2012, 16, 1295–1322. [Google Scholar] [CrossRef] [PubMed] [Green Version]
- Kaufmann, S.H.; Desnoyers, S.; Ottaviano, Y.; Davidson, N.E.; Poirier, G.G. Specific Proteolytic Cleavage of Poly(Adp-Ribose) Polymerase: An Early Marker of Chemotherapy-Induced Apoptosis. Cancer Res. 1993, 53, 3976–3985. [Google Scholar]
- Boulares, A.H.; Yakovlev, A.G.; Ivanova, V.; Stoica, B.A.; Wang, G.; Iyer, S.; Smulson, M. Role of Poly(Adp-Ribose) Polymerase (PARP) Cleavage in Apoptosis. Caspase 3-Resistant Parp Mutant Increases Rates of Apoptosis in Transfected Cells. J. Biol. Chem. 1999, 274, 22932–22940. [Google Scholar] [CrossRef] [Green Version]
- Ribatti, D. The chick embryo chorioallantoic membrane as a model for tumor biology. Exp. Cell Res. 2014, 328, 314–324. [Google Scholar] [CrossRef]
- Zhu, Y.-J.; Zheng, B.; Wang, H.-Y.; Chen, L. New knowledge of the mechanisms of sorafenib resistance in liver cancer. Acta Pharmacol. Sin. 2017, 38, 614–622. [Google Scholar] [CrossRef] [Green Version]
- Antonarakis, E.S.; Schweizer, M.T. Chemotherapy and its evolving role in the management of advanced prostate cancer. Asian J. Androl. 2014, 16, 334–340. [Google Scholar] [CrossRef]
- Evan, G.I.; Vousden, K.H. Proliferation, Cell Cycle and Apoptosis in Cancer. Nature 2001, 411, 342–348. [Google Scholar] [CrossRef] [PubMed]
- Robert, J.; Reßing, N.; Finn, K.; Hansen, A.A.; Büch, T. Anticancer Therapy with HDAC Inhibitors: Mechanism-Based Combination Strategies and Future Perspectives. Cancers 2021, 13, 634. [Google Scholar]
- Bruzzese, F.; Leone, A.; Rocco, M.; Carbone, C.; Piro, G.; Caraglia, M.; Di Gennaro, E.; Budillon, A. HDAC inhibitor vorinostat enhances the antitumor effect of gefitinib in squamous cell carcinoma of head and neck by modulating ErbB receptor expression and reverting EMT. J. Cell. Physiol. 2010, 226, 2378–2390. [Google Scholar] [CrossRef] [PubMed]
- Citro, S.; Bellini, A.; Miccolo, C.; Ghiani, L.; Carey, T.E.; Chiocca, S. Synergistic antitumour activity of HDAC inhibitor SAHA and EGFR inhibitor gefitinib in head and neck cancer: A key role for ΔNp63α. Br. J. Cancer 2019, 120, 658–667. [Google Scholar] [CrossRef] [Green Version]
- Duque, M.B.; Pinheiro, K.D.V.; Thomaz, A.; Da Silva, C.A.; Freire, N.H.; Brunetto, A.T.; Schwartsmann, G.; Jaeger, M.; de Farias, C.; Roesler, R. Combined Inhibition of HDAC and EGFR Reduces Viability and Proliferation and Enhances STAT3 mRNA Expression in Glioblastoma Cells. J. Mol. Neurosci. 2019, 68, 49–57. [Google Scholar] [CrossRef]
- Huang, B.H.; Laban, M.; Leung, C.H.; Lee, L.; Lee, C.K.; Salto-Tellez, M.; Raju, G.C.; Hooi, S.C. Inhibition of Histone Deacetylase 2 Increases Apoptosis and P21cip1/Waf1 Expression, Independent of Histone Deacetylase 1. Cell Death Differ. 2005, 12, 395–404. [Google Scholar] [CrossRef] [Green Version]
- Weichert, W.; Röske, A.; Niesporek, S.; Noske, A.; Buckendahl, A.-C.; Dietel, M.; Gekeler, V.; Boehm, M.; Beckers, T.; Denkert, C. Class I Histone Deacetylase Expression Has Independent Prognostic Impact in Human Colorectal Cancer: Specific Role of Class I Histone Deacetylases In vitro and In vivo. Clin. Cancer Res. 2008, 14, 1669–1677. [Google Scholar] [CrossRef] [PubMed] [Green Version]
- Quint, K.; Agaimy, A.; Di Fazio, P.; Montalbano, R.; Steindorf, C.; Jung, R.; Hellerbrand, C.; Hartmann, A.; Sitter, H.; Neureiter, D.; et al. Clinical significance of histone deacetylases 1, 2, 3, and 7: HDAC2 is an independent predictor of survival in HCC. Virchows Arch. 2011, 459, 129–139. [Google Scholar] [CrossRef]
- Butler, L.M.; Agus, D.B.; Scher, H.I.; Higgins, B.; Rose, A.; Cordon-Cardo, C.; Thaler, H.T.; Rifkind, R.A.; Marks, P.A.; Richon, V.M. Suberoylanilide Hydroxamic Acid, an Inhibitor of Histone Deacetylase, Suppresses the Growth of Prostate Cancer Cells in Vitro and in Vivo. Cancer Res. 2000, 60, 5165–5170. [Google Scholar]
- Shi, X.-Y.; Ding, W.; Li, T.-Q.; Zhang, Y.-X.; Zhao, S.-C. Histone Deacetylase (HDAC) Inhibitor, Suberoylanilide Hydroxamic Acid (SAHA), Induces Apoptosis in Prostate Cancer Cell Lines via the Akt/FOXO3a Signaling Pathway. Med. Sci. Monit. 2017, 23, 5793–5802. [Google Scholar] [CrossRef]
- Rachid, Z.; Brahimi, F.; Domarkas, J.; Jean-Claude, B.J. Synthesis of half-mustard combi-molecules with fluorescence properties: Correlation with EGFR status. Bioorg. Med. Chem. Lett. 2005, 15, 1135–1138. [Google Scholar] [CrossRef] [PubMed]
- Zheng, Y.-G.; Zhang, W.-Q.; Meng, L.; Wu, X.-Q.; Zhang, L.; An, L.; Li, C.-L.; Gao, C.-Y.; Xu, L.; Liu, Y. Design, synthesis and biological evaluation of 4-aniline quinazoline derivatives conjugated with hydrogen sulfide (H2S) donors as potent EGFR inhibitors against L858R resistance mutation. Eur. J. Med. Chem. 2020, 202, 112522. [Google Scholar] [CrossRef]
- Gillies, R.; Didier, N.; Denton, M. Determination of cell number in monolayer cultures. Anal. Biochem. 1986, 159, 109–113. [Google Scholar] [CrossRef]
- Anevski, A.; Giri, A.K.; Aittokallio, T. SynergyFinder 2.0: Visual analytics of multi-drug combination synergies. Nucleic Acids Res. 2020, 48, W488–W493. [Google Scholar] [CrossRef] [PubMed]
- Schaller, E.; Ma, A.; Gosch, L.; Klefenz, A.; Schaller, D.; Goehringer, N.; Kaps, L.; Schuppan, D.; Volkamer, A.; Schobert, R.; et al. New 3-Aryl-2-(2-thienyl)acrylonitriles with High Activity Against Hepatoma Cells. Int. J. Mol. Sci. 2021, 22, 2243. [Google Scholar] [CrossRef] [PubMed]
- Zegzouti, H.; Zdanovskaia, M.; Hsiao, K.; Goueli, S.A. ADP-Glo: A Bioluminescent and Homogeneous ADP Monitoring Assay for Kinases. ASSAY Drug Dev. Technol. 2009, 7, 560–572. [Google Scholar] [CrossRef] [PubMed]
- Ramalho-Santos, J.; Escada-Rebelo, S.; Mora, F.; Sousa, A.; Almeida-Santos, T.; Paiva, A. Fluorescent probes for the detection of reactive oxygen species in human spermatozoa. Asian J. Androl. 2020, 22, 465–471. [Google Scholar] [CrossRef] [PubMed]
- Laemmli, U.K. Cleavage of Structural Proteins during the Assembly of the Head of Bacteriophage T4. Nature 1970, 227, 680–685. [Google Scholar] [CrossRef] [PubMed]
- Maibier, M.; Bintig, W.; Goede, A.; Höpfner, M.; Kuebler, W.M.; Secomb, T.W.; Nitzsche, B.; Pries, A.R. Gap junctions regulate vessel diameter in chick chorioallantoic membrane vasculature by both tone—Dependent and structural mechanisms. Microcirculation 2019, 27. [Google Scholar] [CrossRef] [Green Version]


| Compounds | DU145 | Hep-G2 | Jurkat | Hut78 | SupT11 | SMZ1 |
|---|---|---|---|---|---|---|
| 3BrQuin-SAHA (3a) | 3.53 ± 0.23 | 4.94 ± 0.38 | n.d. | n.d. | n.d. | n.d. |
| 3ClQuin-SAHA (3b) | 3.23 ± 0.18 | 3.92 ± 0.25 | 1.40 ± 0.12 | 1.18 ± 0.22 | 6.22 ± 0.25 | 2.24 ± 0.17 |
| ClFQuin-SAHA (3c) | 5.57 ± 0.38 | >10 | n.d. | n.d. | n.d. | n.d. |
| SAHA | 0.68 ± 0.04 | 3.22 ± 0.44 | 1.7 ± 0.17 | 5.07 ± 0.42 | 4.67 ± 0.31 | 2.87 ± 0.33 |
| Gefitinib | 11.88 ± 2.13 | 18.53 ± 1.78 | 10.95 ± 0.28 | >20 | >20 | >20 |
Publisher’s Note: MDPI stays neutral with regard to jurisdictional claims in published maps and institutional affiliations. |
© 2021 by the authors. Licensee MDPI, Basel, Switzerland. This article is an open access article distributed under the terms and conditions of the Creative Commons Attribution (CC BY) license (https://creativecommons.org/licenses/by/4.0/).
Share and Cite
Goehringer, N.; Biersack, B.; Peng, Y.; Schobert, R.; Herling, M.; Ma, A.; Nitzsche, B.; Höpfner, M. Anticancer Activity and Mechanisms of Action of New Chimeric EGFR/HDAC-Inhibitors. Int. J. Mol. Sci. 2021, 22, 8432. https://doi.org/10.3390/ijms22168432
Goehringer N, Biersack B, Peng Y, Schobert R, Herling M, Ma A, Nitzsche B, Höpfner M. Anticancer Activity and Mechanisms of Action of New Chimeric EGFR/HDAC-Inhibitors. International Journal of Molecular Sciences. 2021; 22(16):8432. https://doi.org/10.3390/ijms22168432
Chicago/Turabian StyleGoehringer, Nils, Bernhard Biersack, Yayi Peng, Rainer Schobert, Marco Herling, Andi Ma, Bianca Nitzsche, and Michael Höpfner. 2021. "Anticancer Activity and Mechanisms of Action of New Chimeric EGFR/HDAC-Inhibitors" International Journal of Molecular Sciences 22, no. 16: 8432. https://doi.org/10.3390/ijms22168432
APA StyleGoehringer, N., Biersack, B., Peng, Y., Schobert, R., Herling, M., Ma, A., Nitzsche, B., & Höpfner, M. (2021). Anticancer Activity and Mechanisms of Action of New Chimeric EGFR/HDAC-Inhibitors. International Journal of Molecular Sciences, 22(16), 8432. https://doi.org/10.3390/ijms22168432