
Transcriptome-Based WGCNA Analysis Reveals Regulated Metabolite Fluxes between Floral Color and Scent in Narcissus tazetta Flower

 , , and
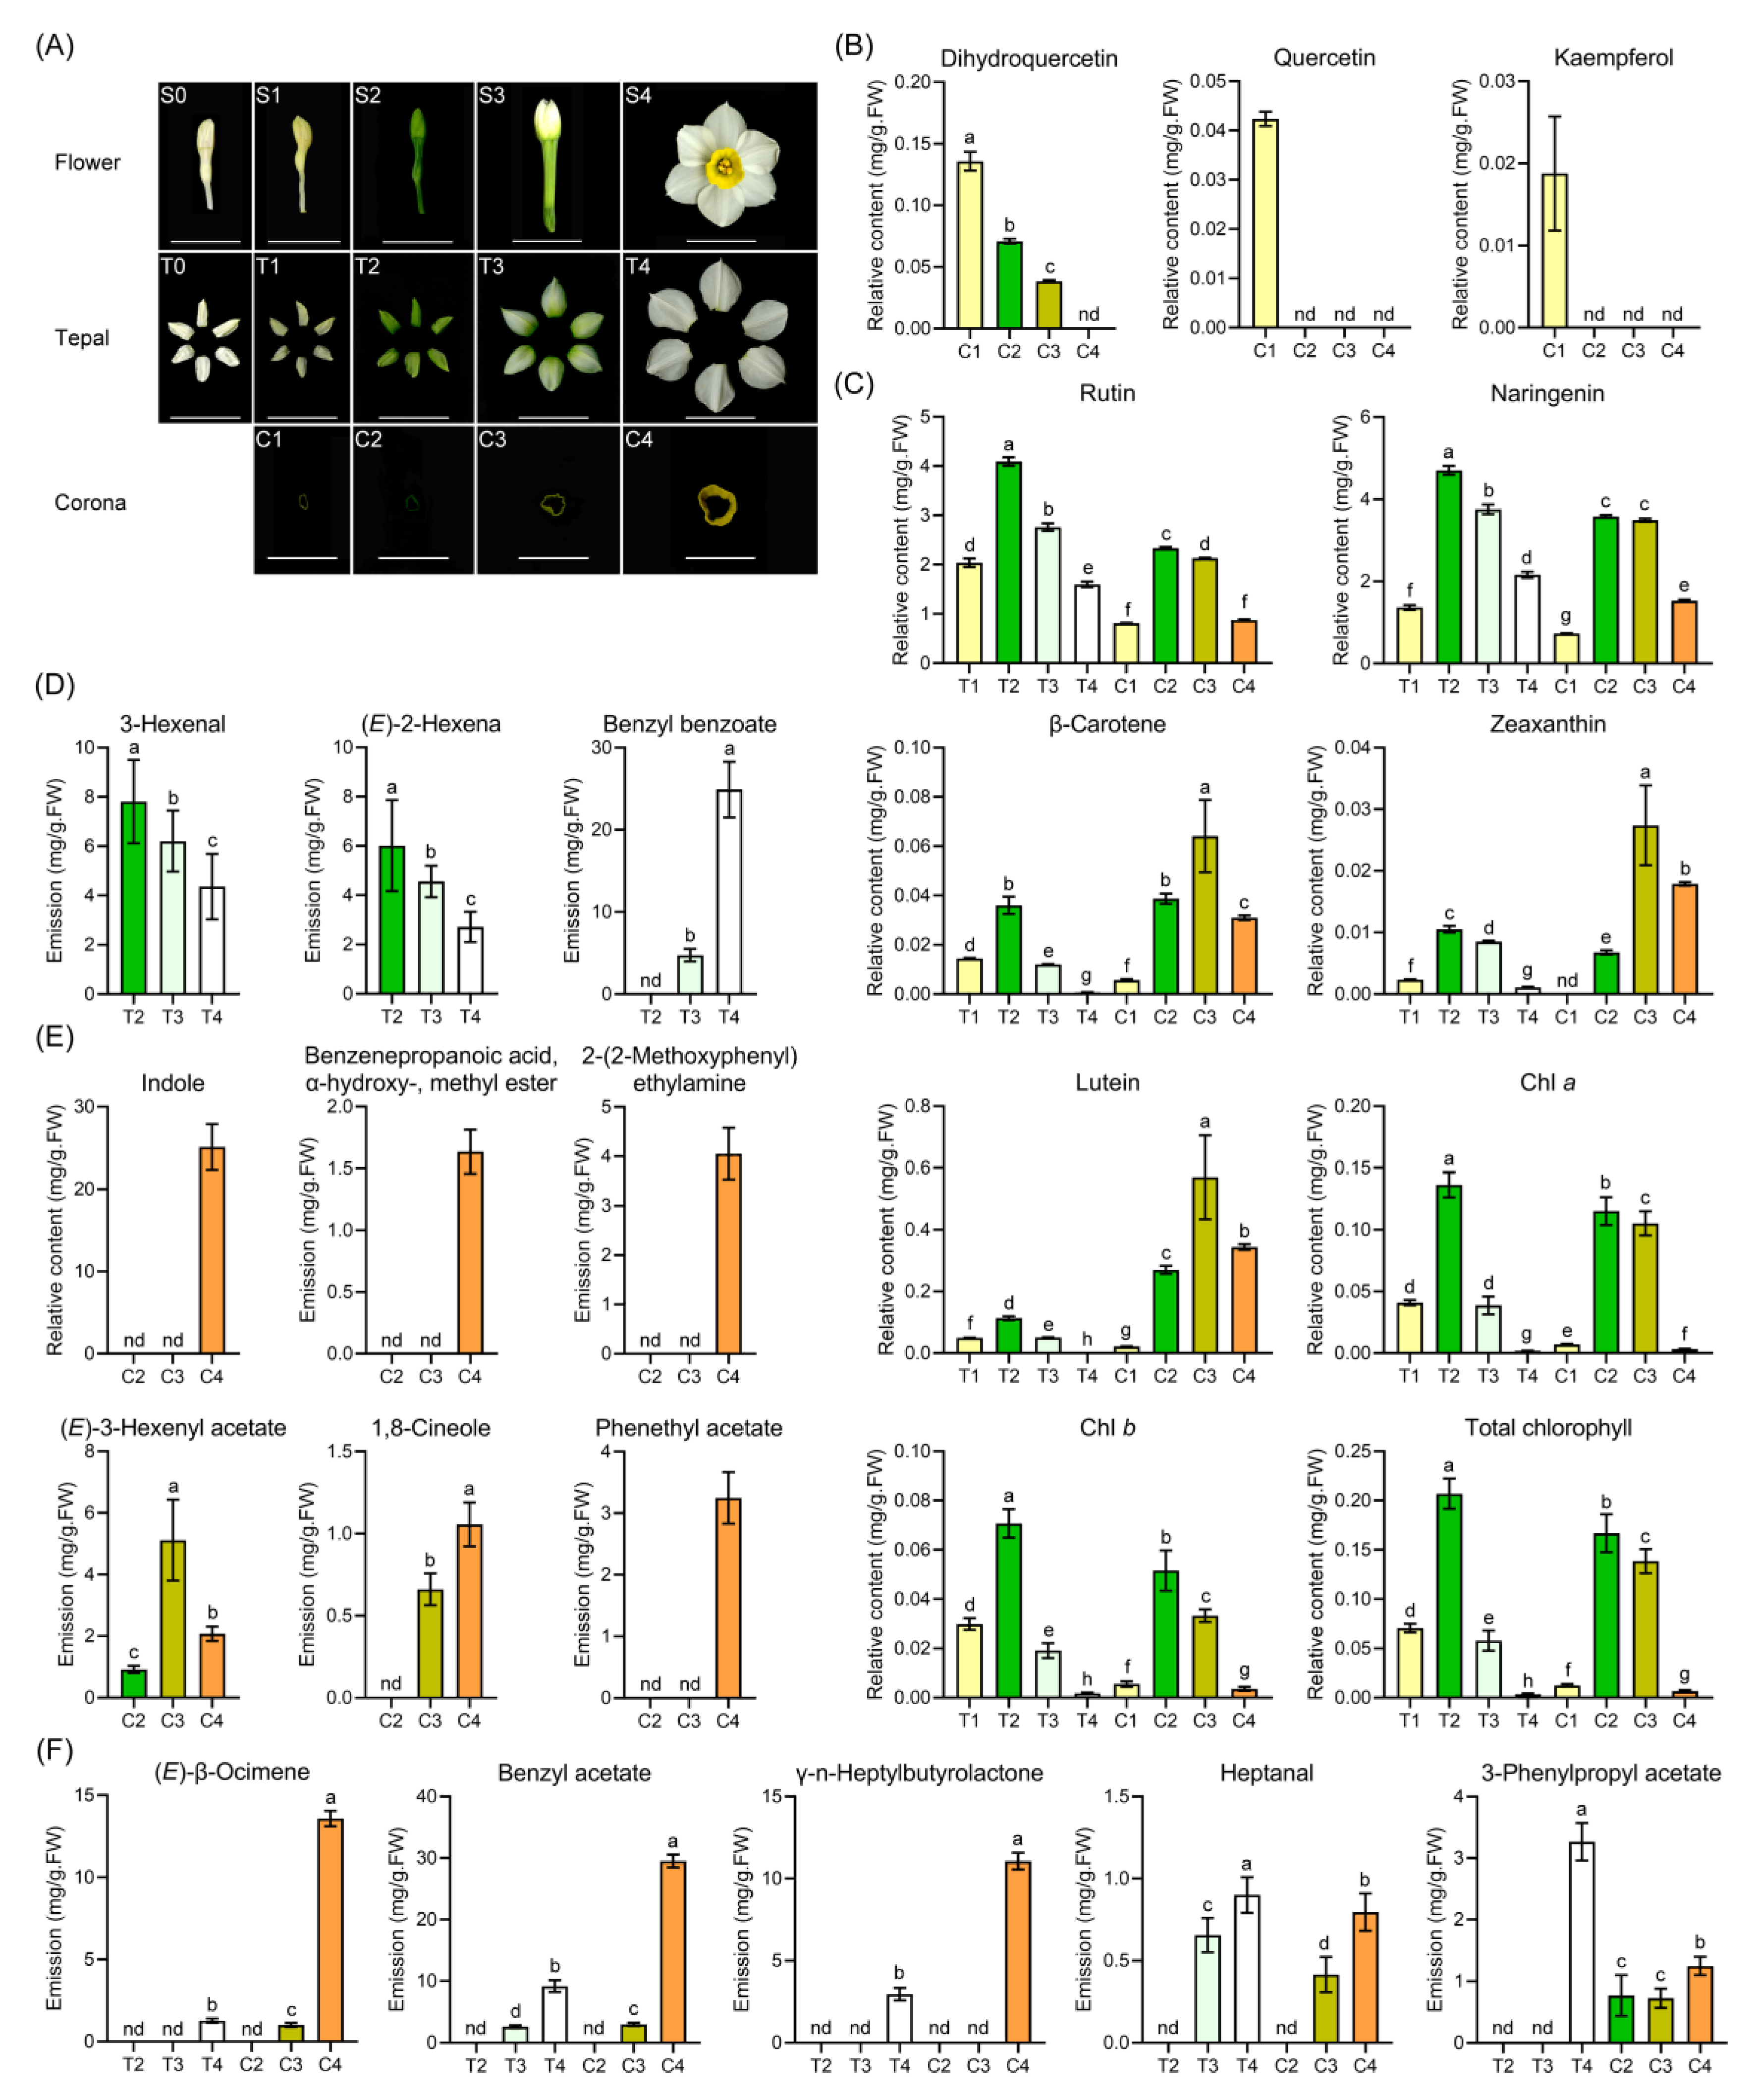
Abstract
:1. Introduction
2. Results
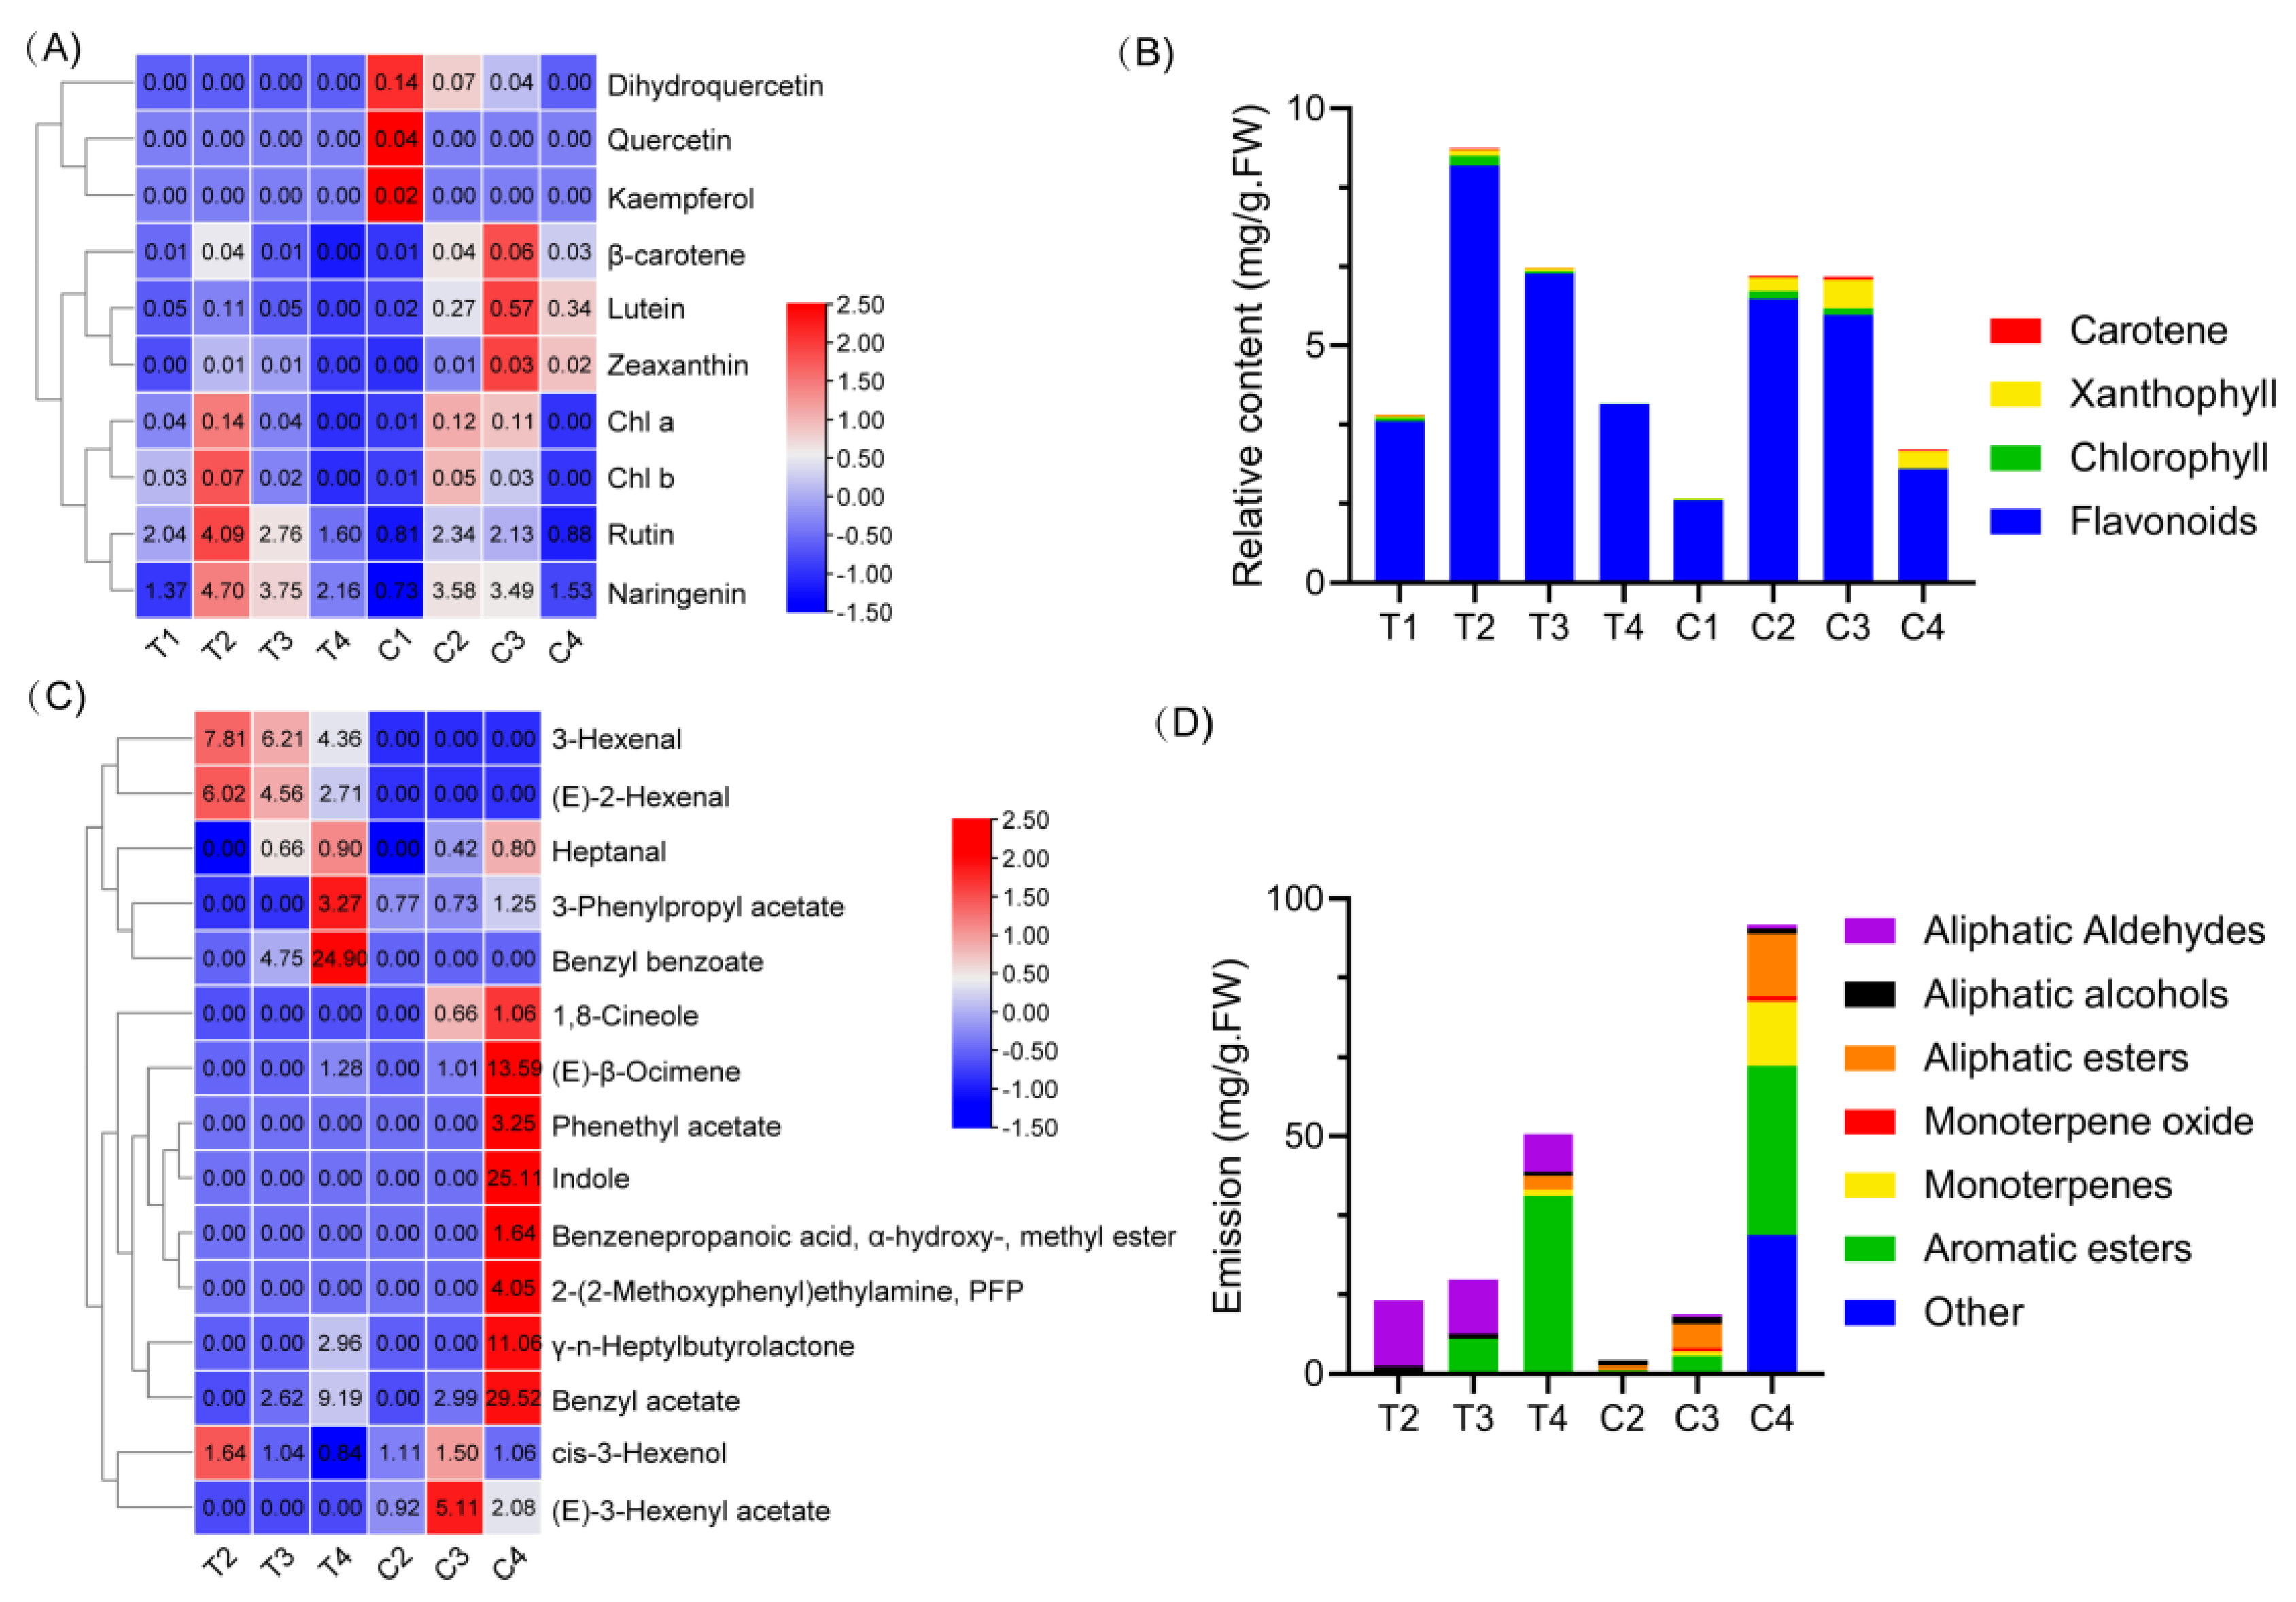
2.1. Floral Color and Scent Trait Profile in Narcissus Tepals and Coronas
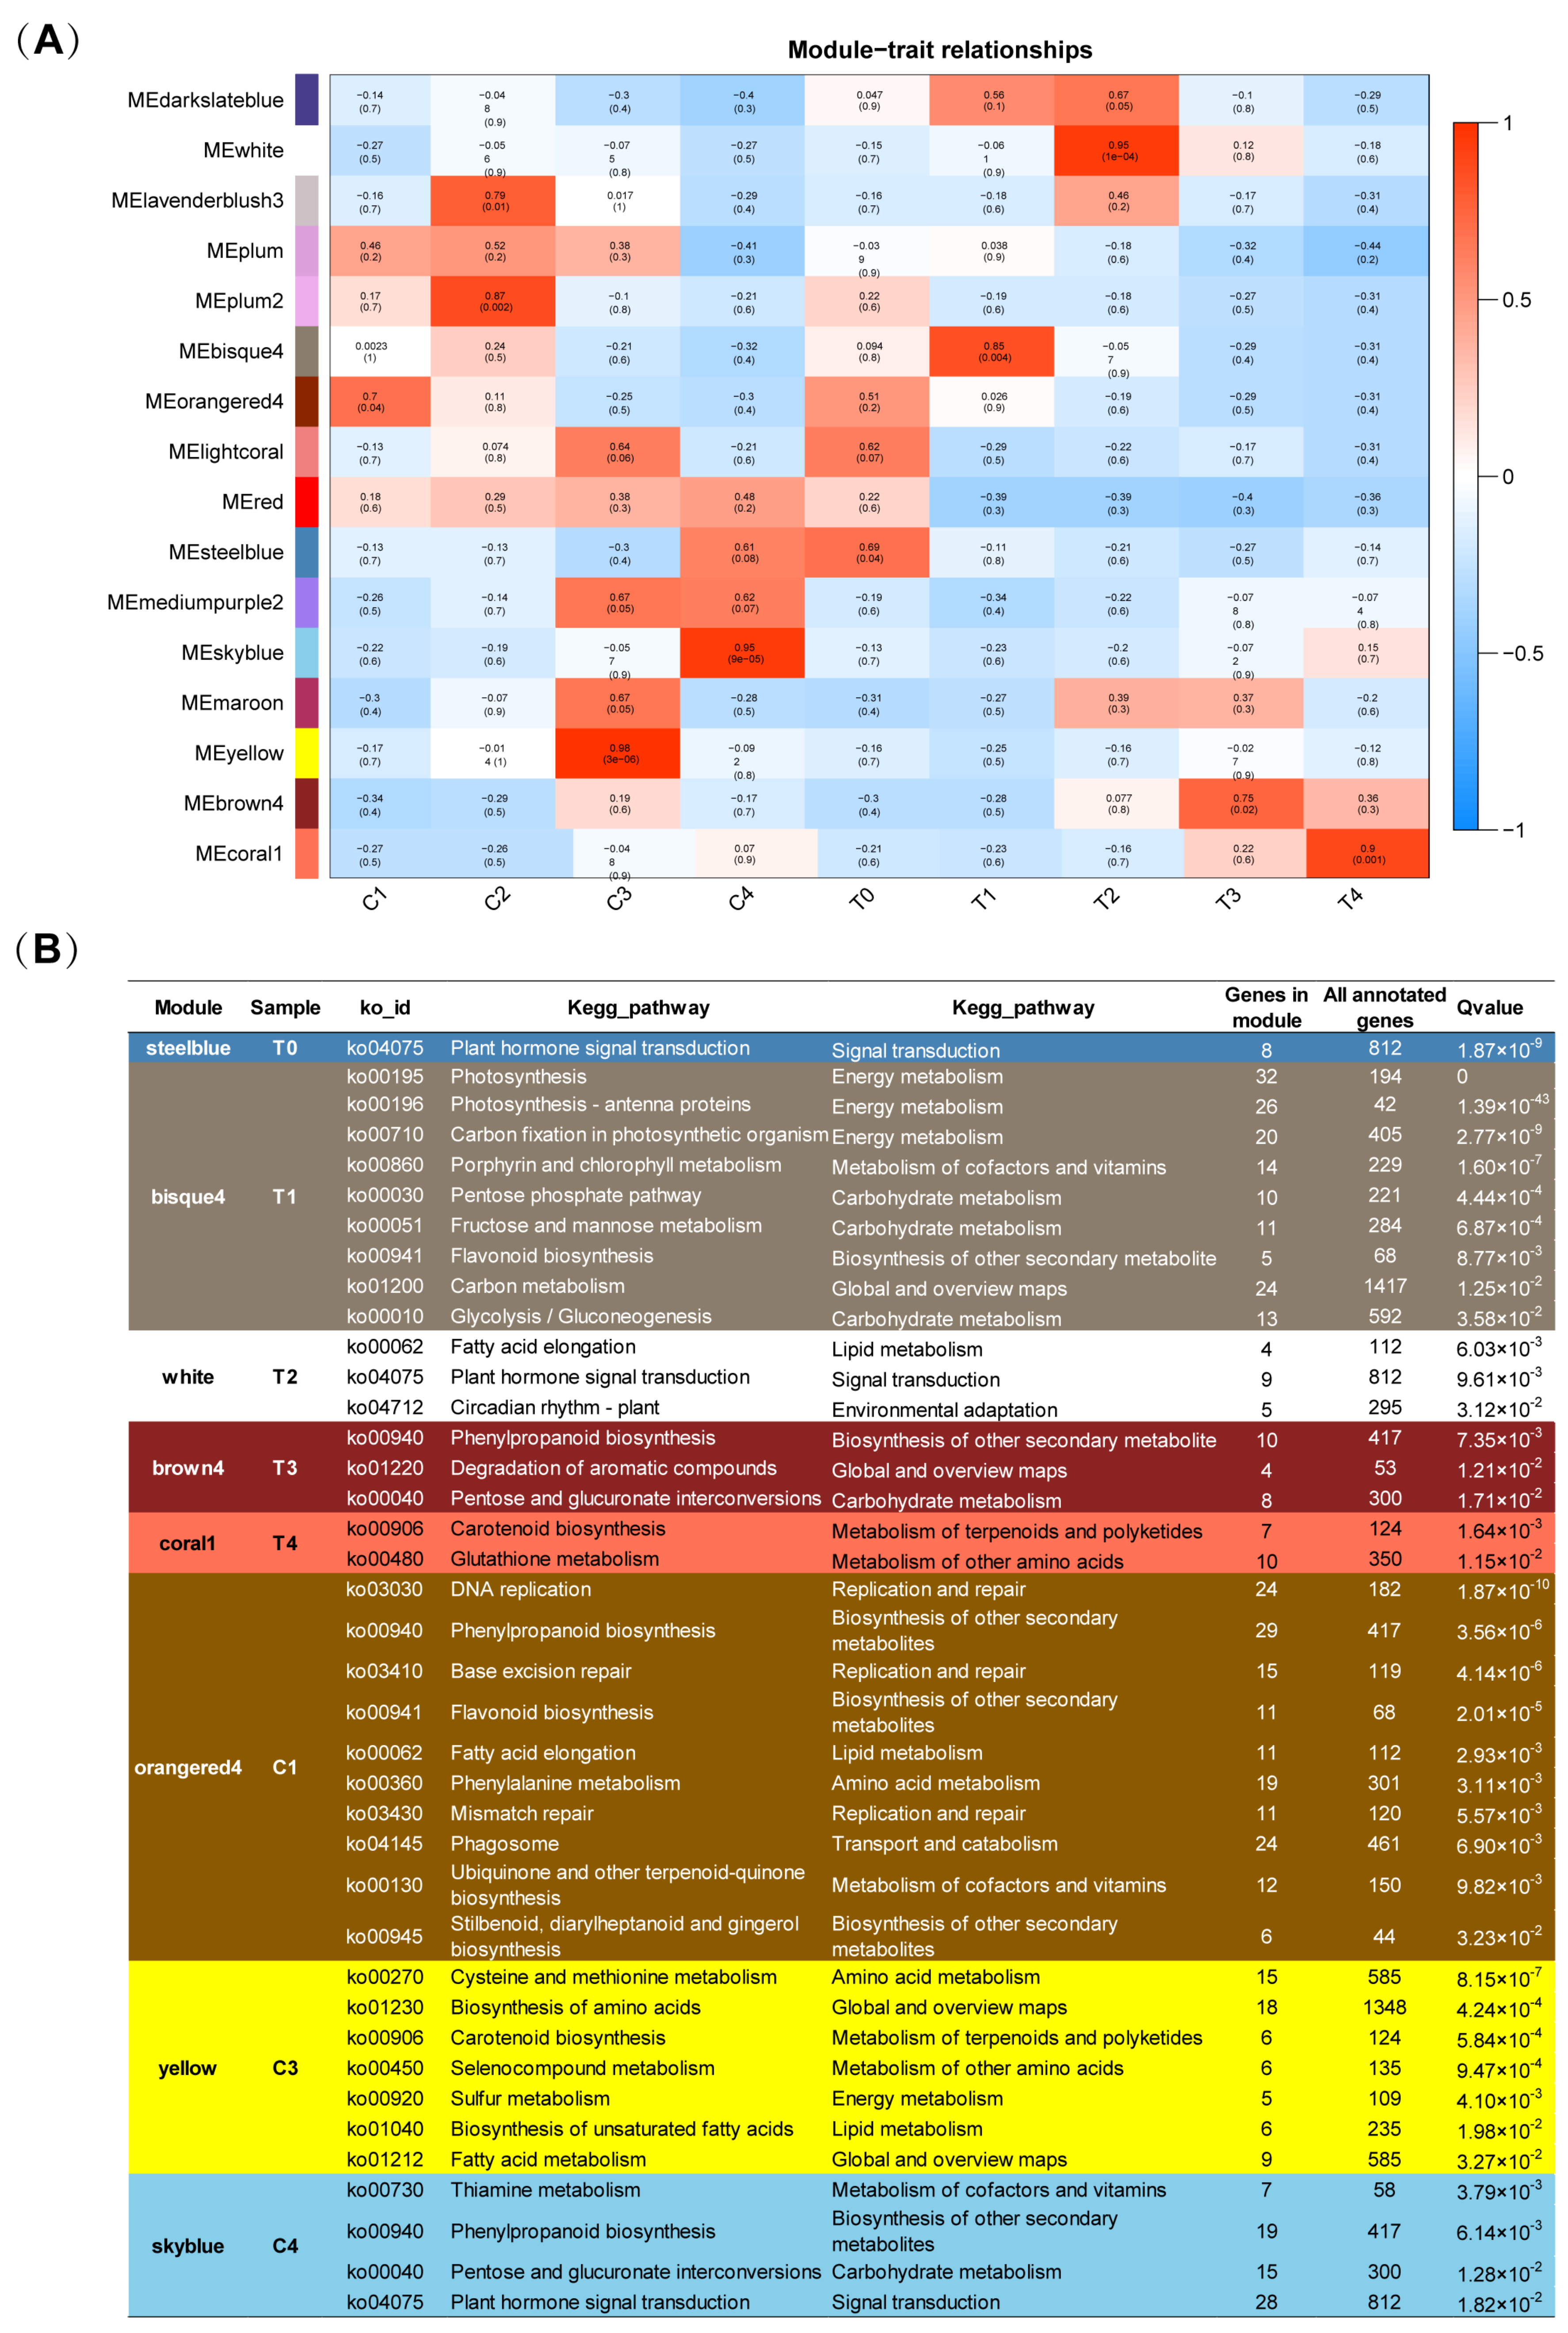
2.2. WGCNA Analysis Displays Various Pigment and Fragrance Metabolism Enrichment Pathway during Tepal and Corona Development of Narcissus tazetta
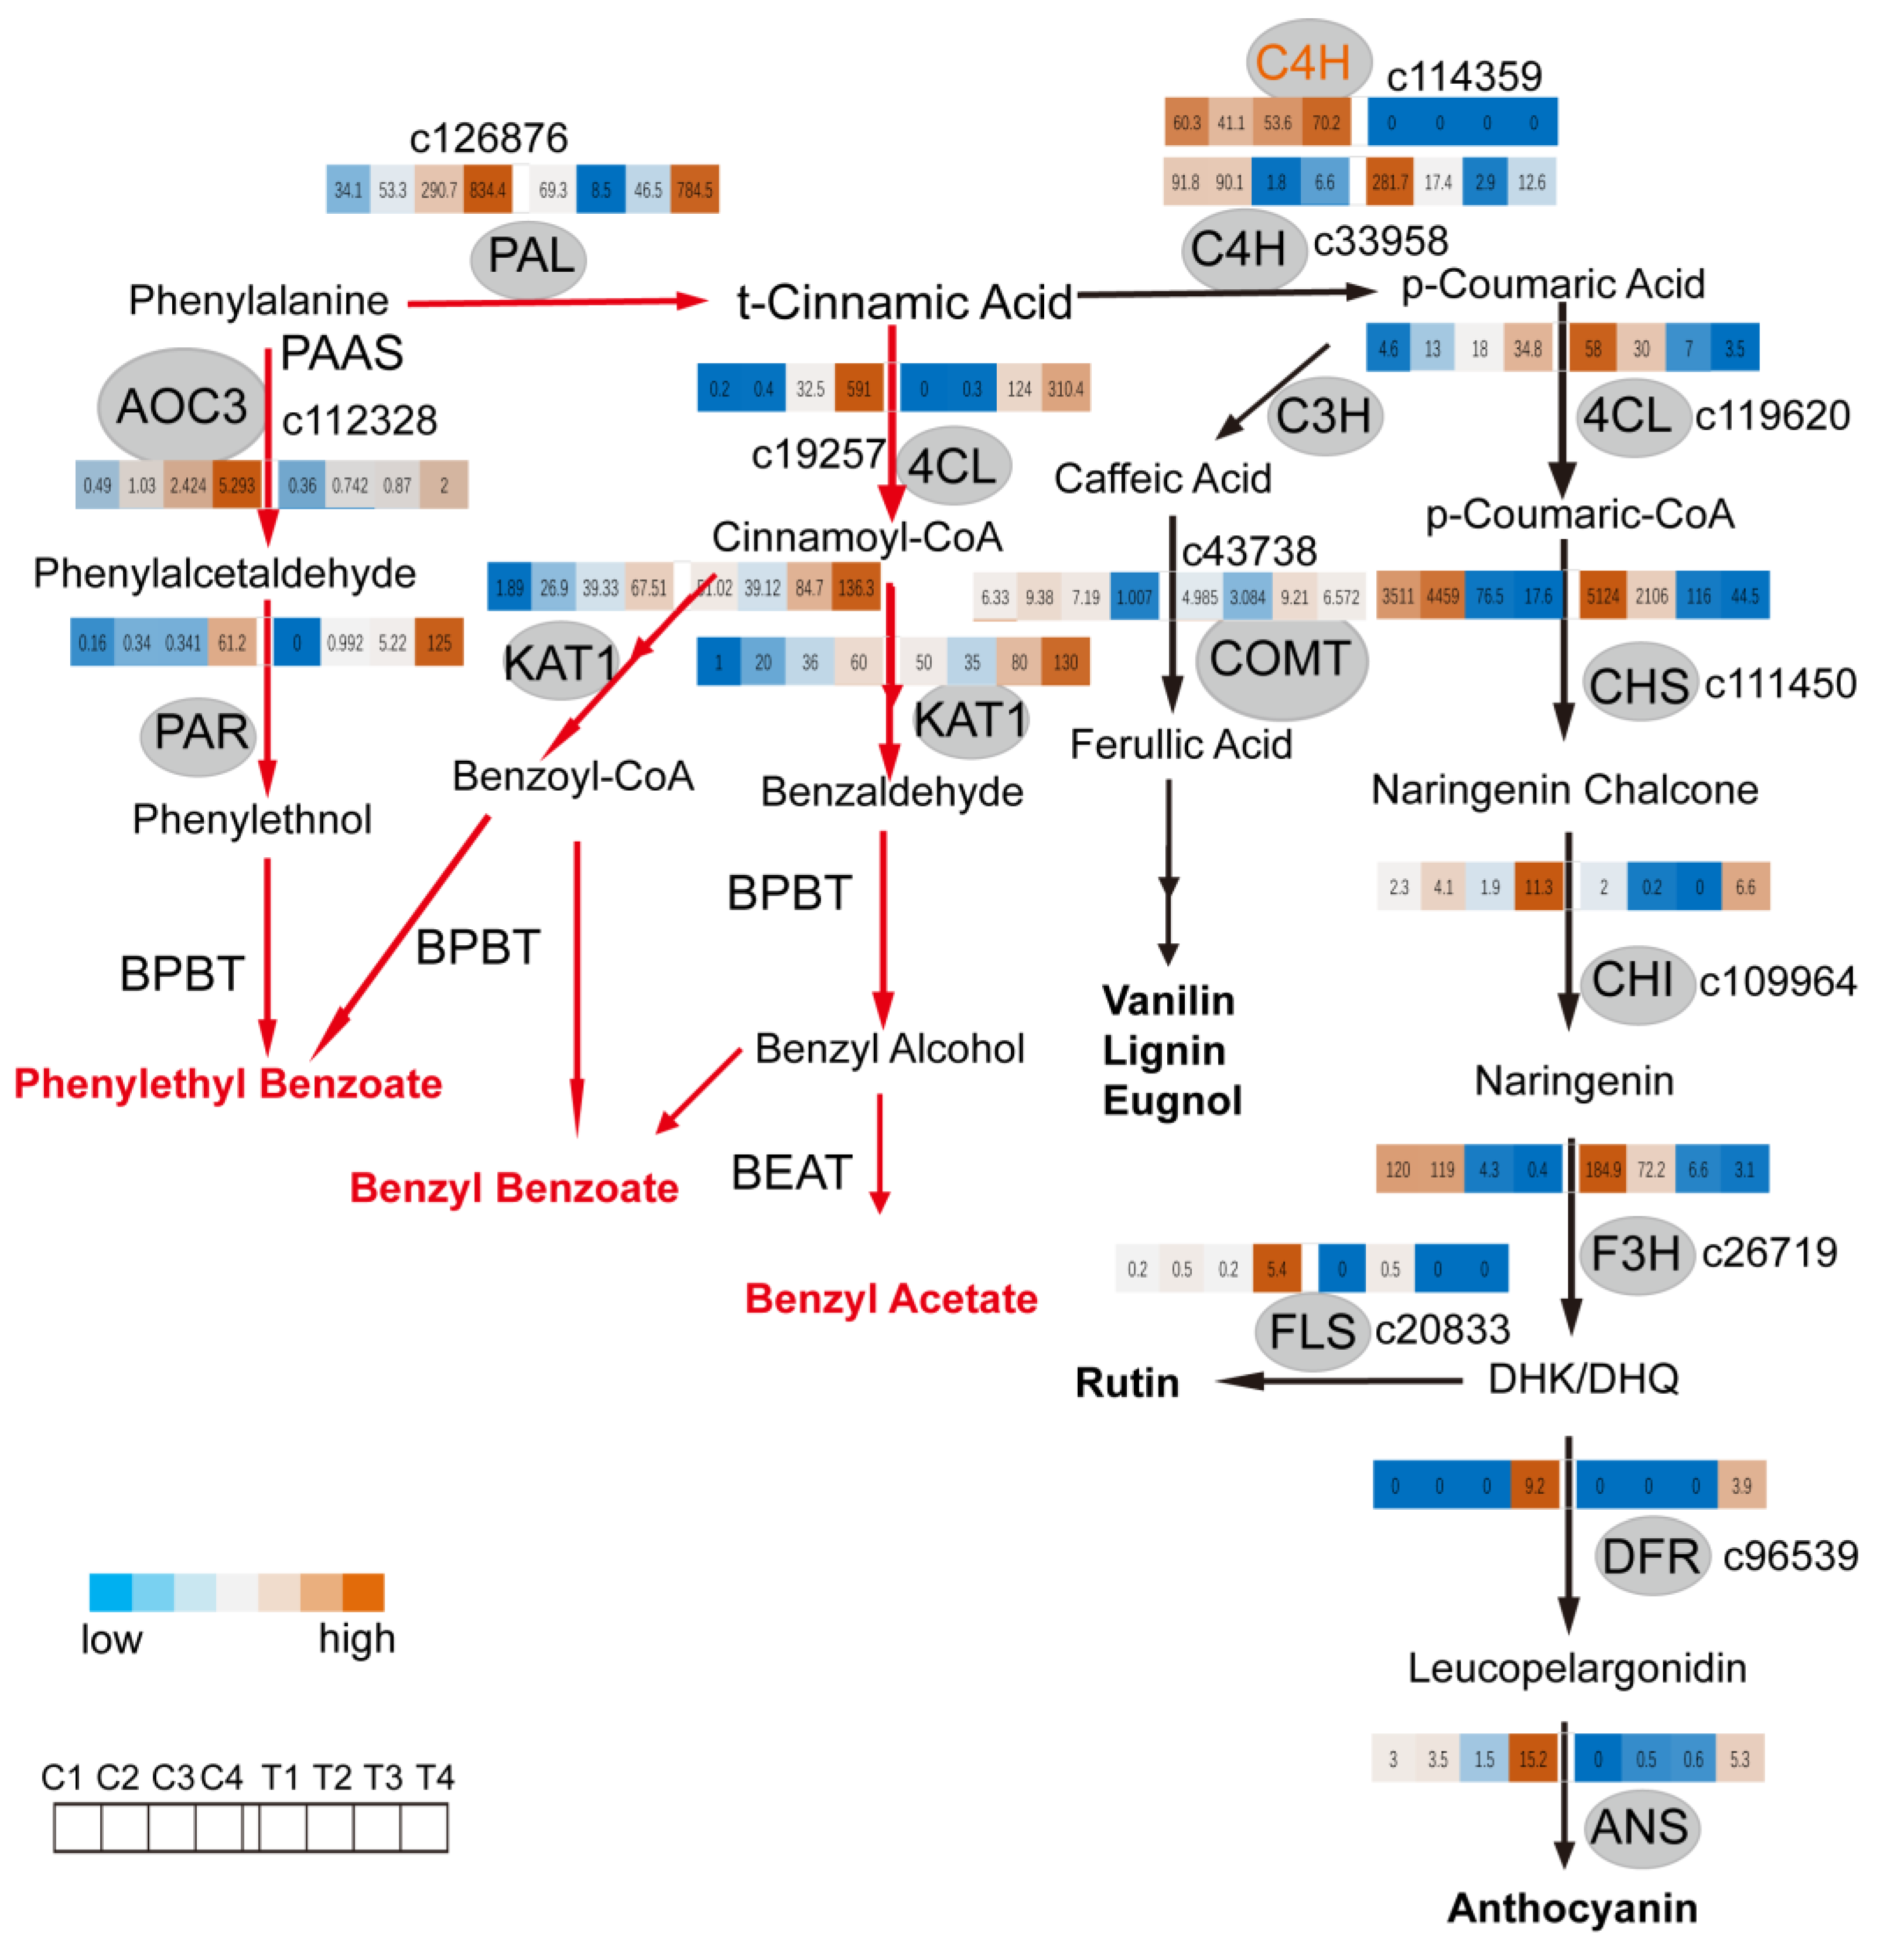
2.3. C4H and 4CL Transcript Levels Determines Metabolite Flux between Anthocyanin/Flavonol Biosynthesis and the Formation of Benzenoid/Phenylpropanoid Components
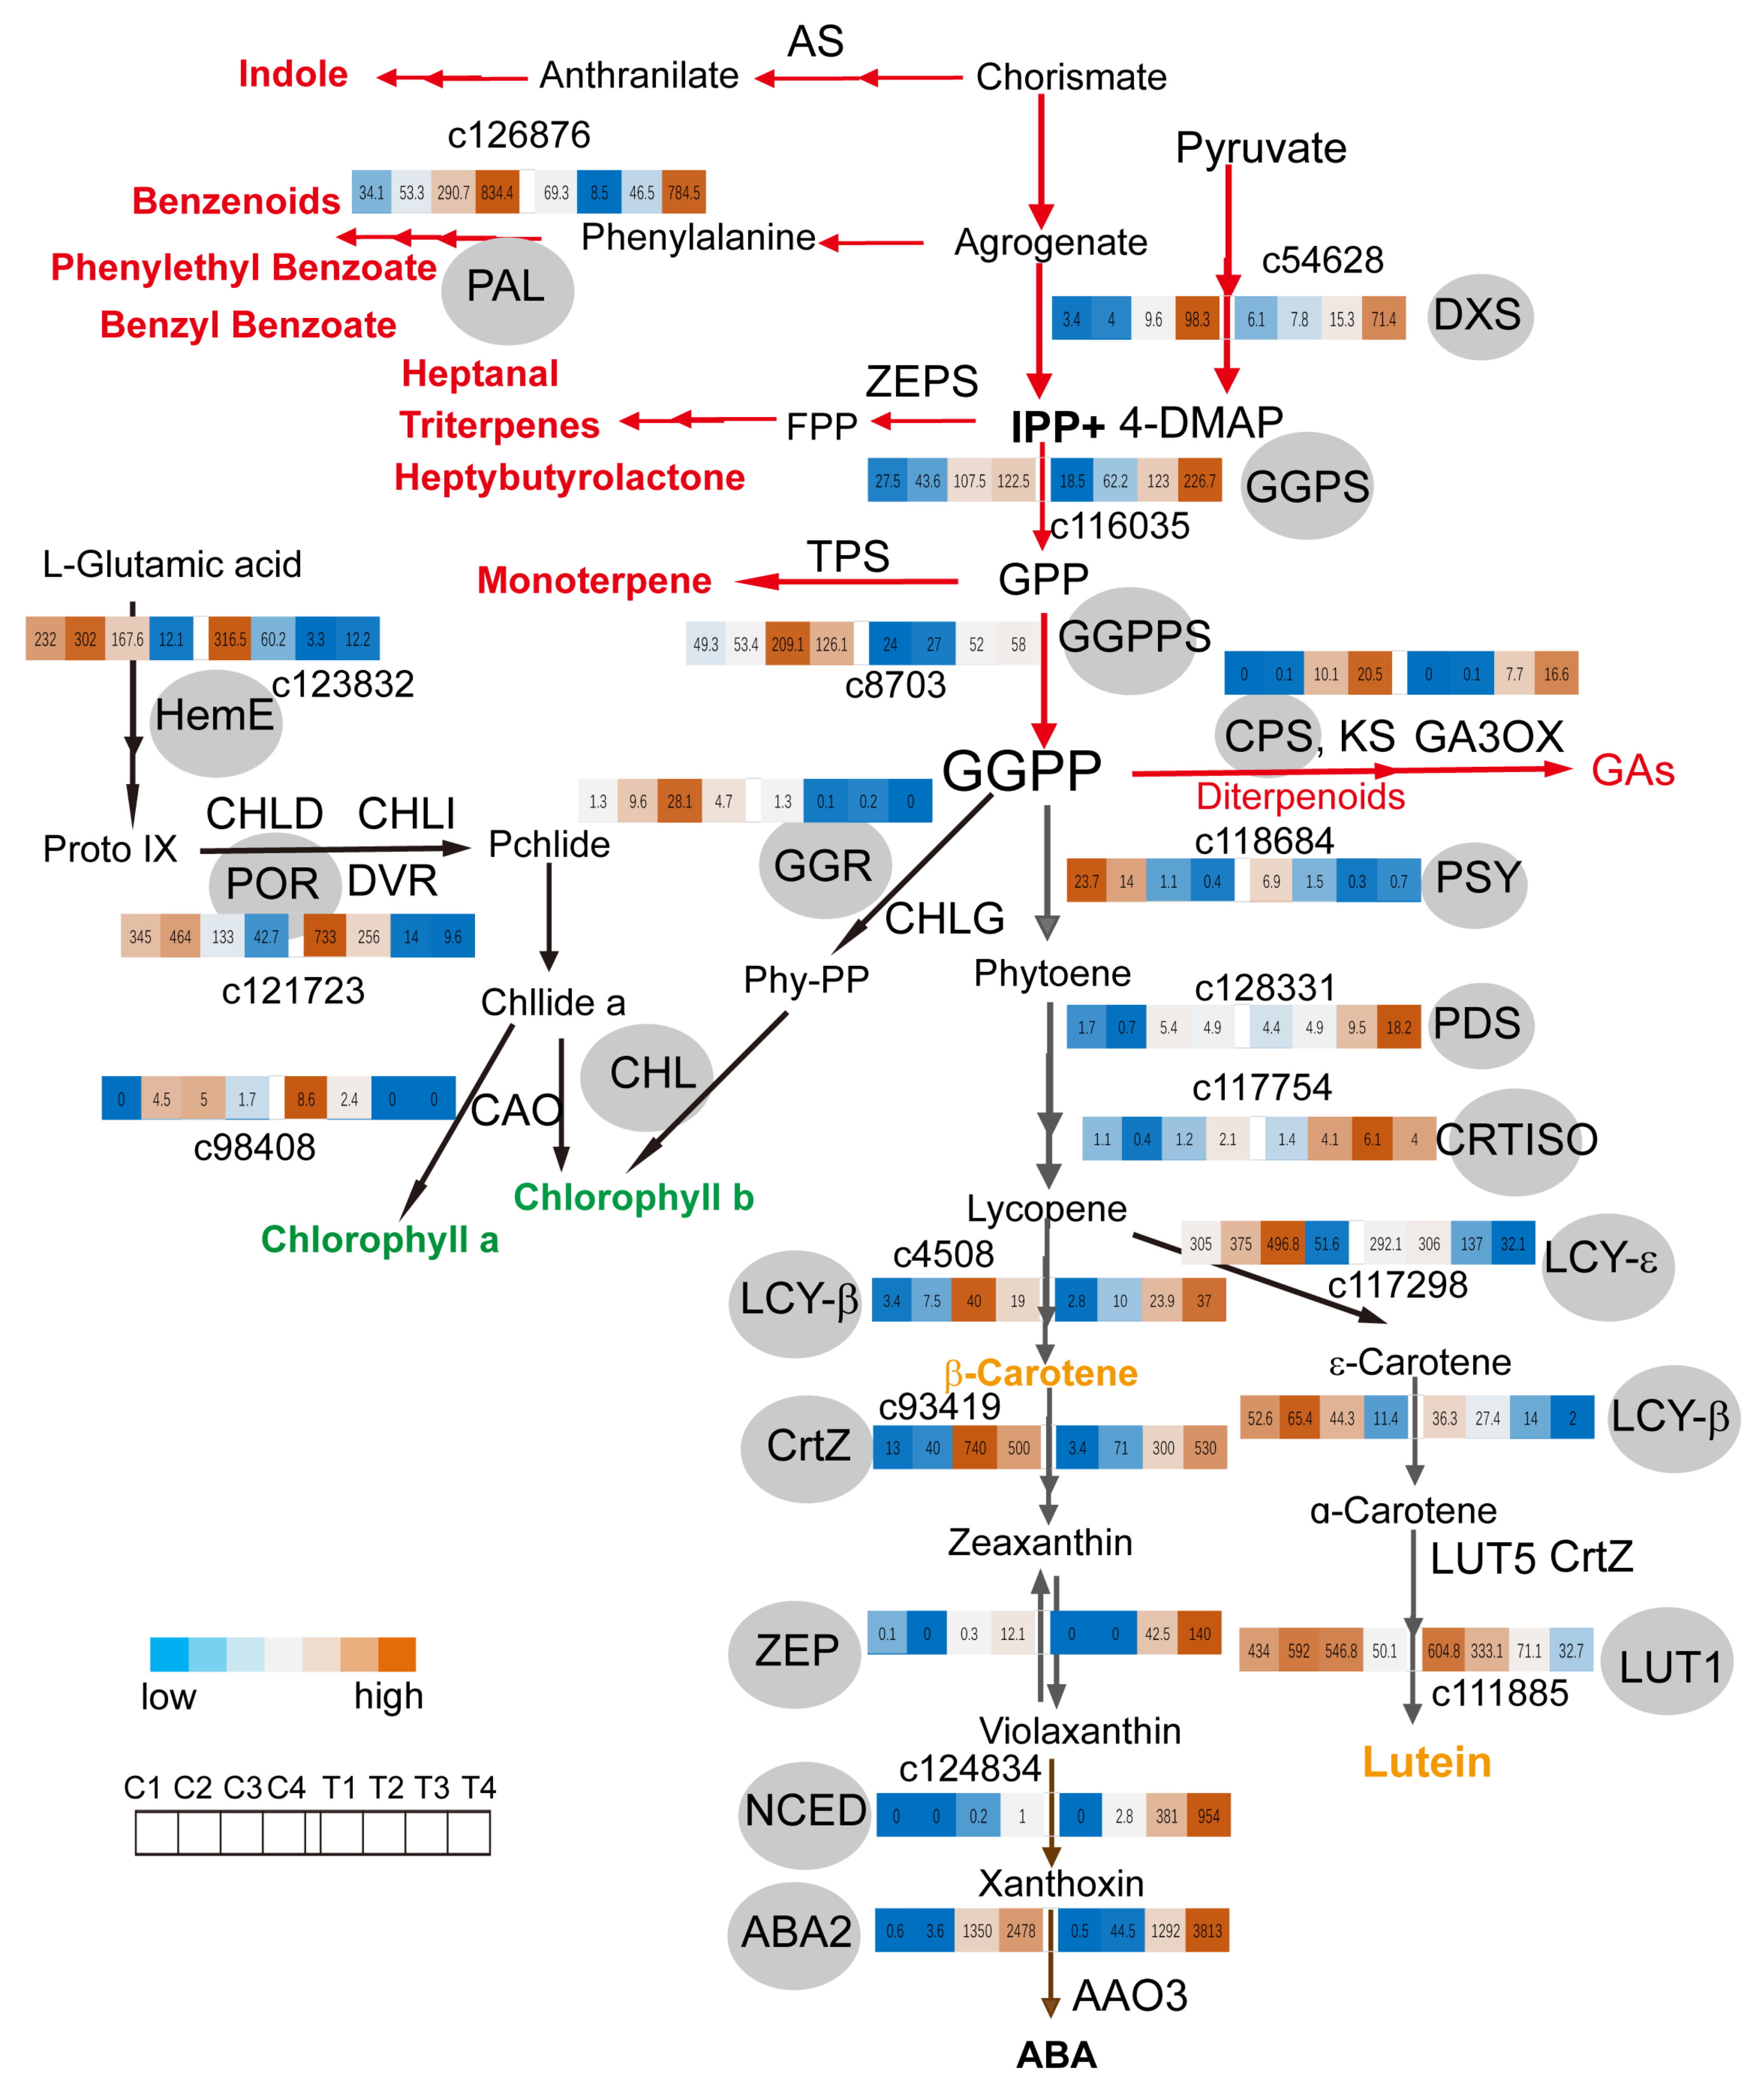
2.4. GGPPs Transcript Levels Coordinate Metabolite Flux between Monoterpene and Carotenoids Biosynthesis Pathway in Coronas
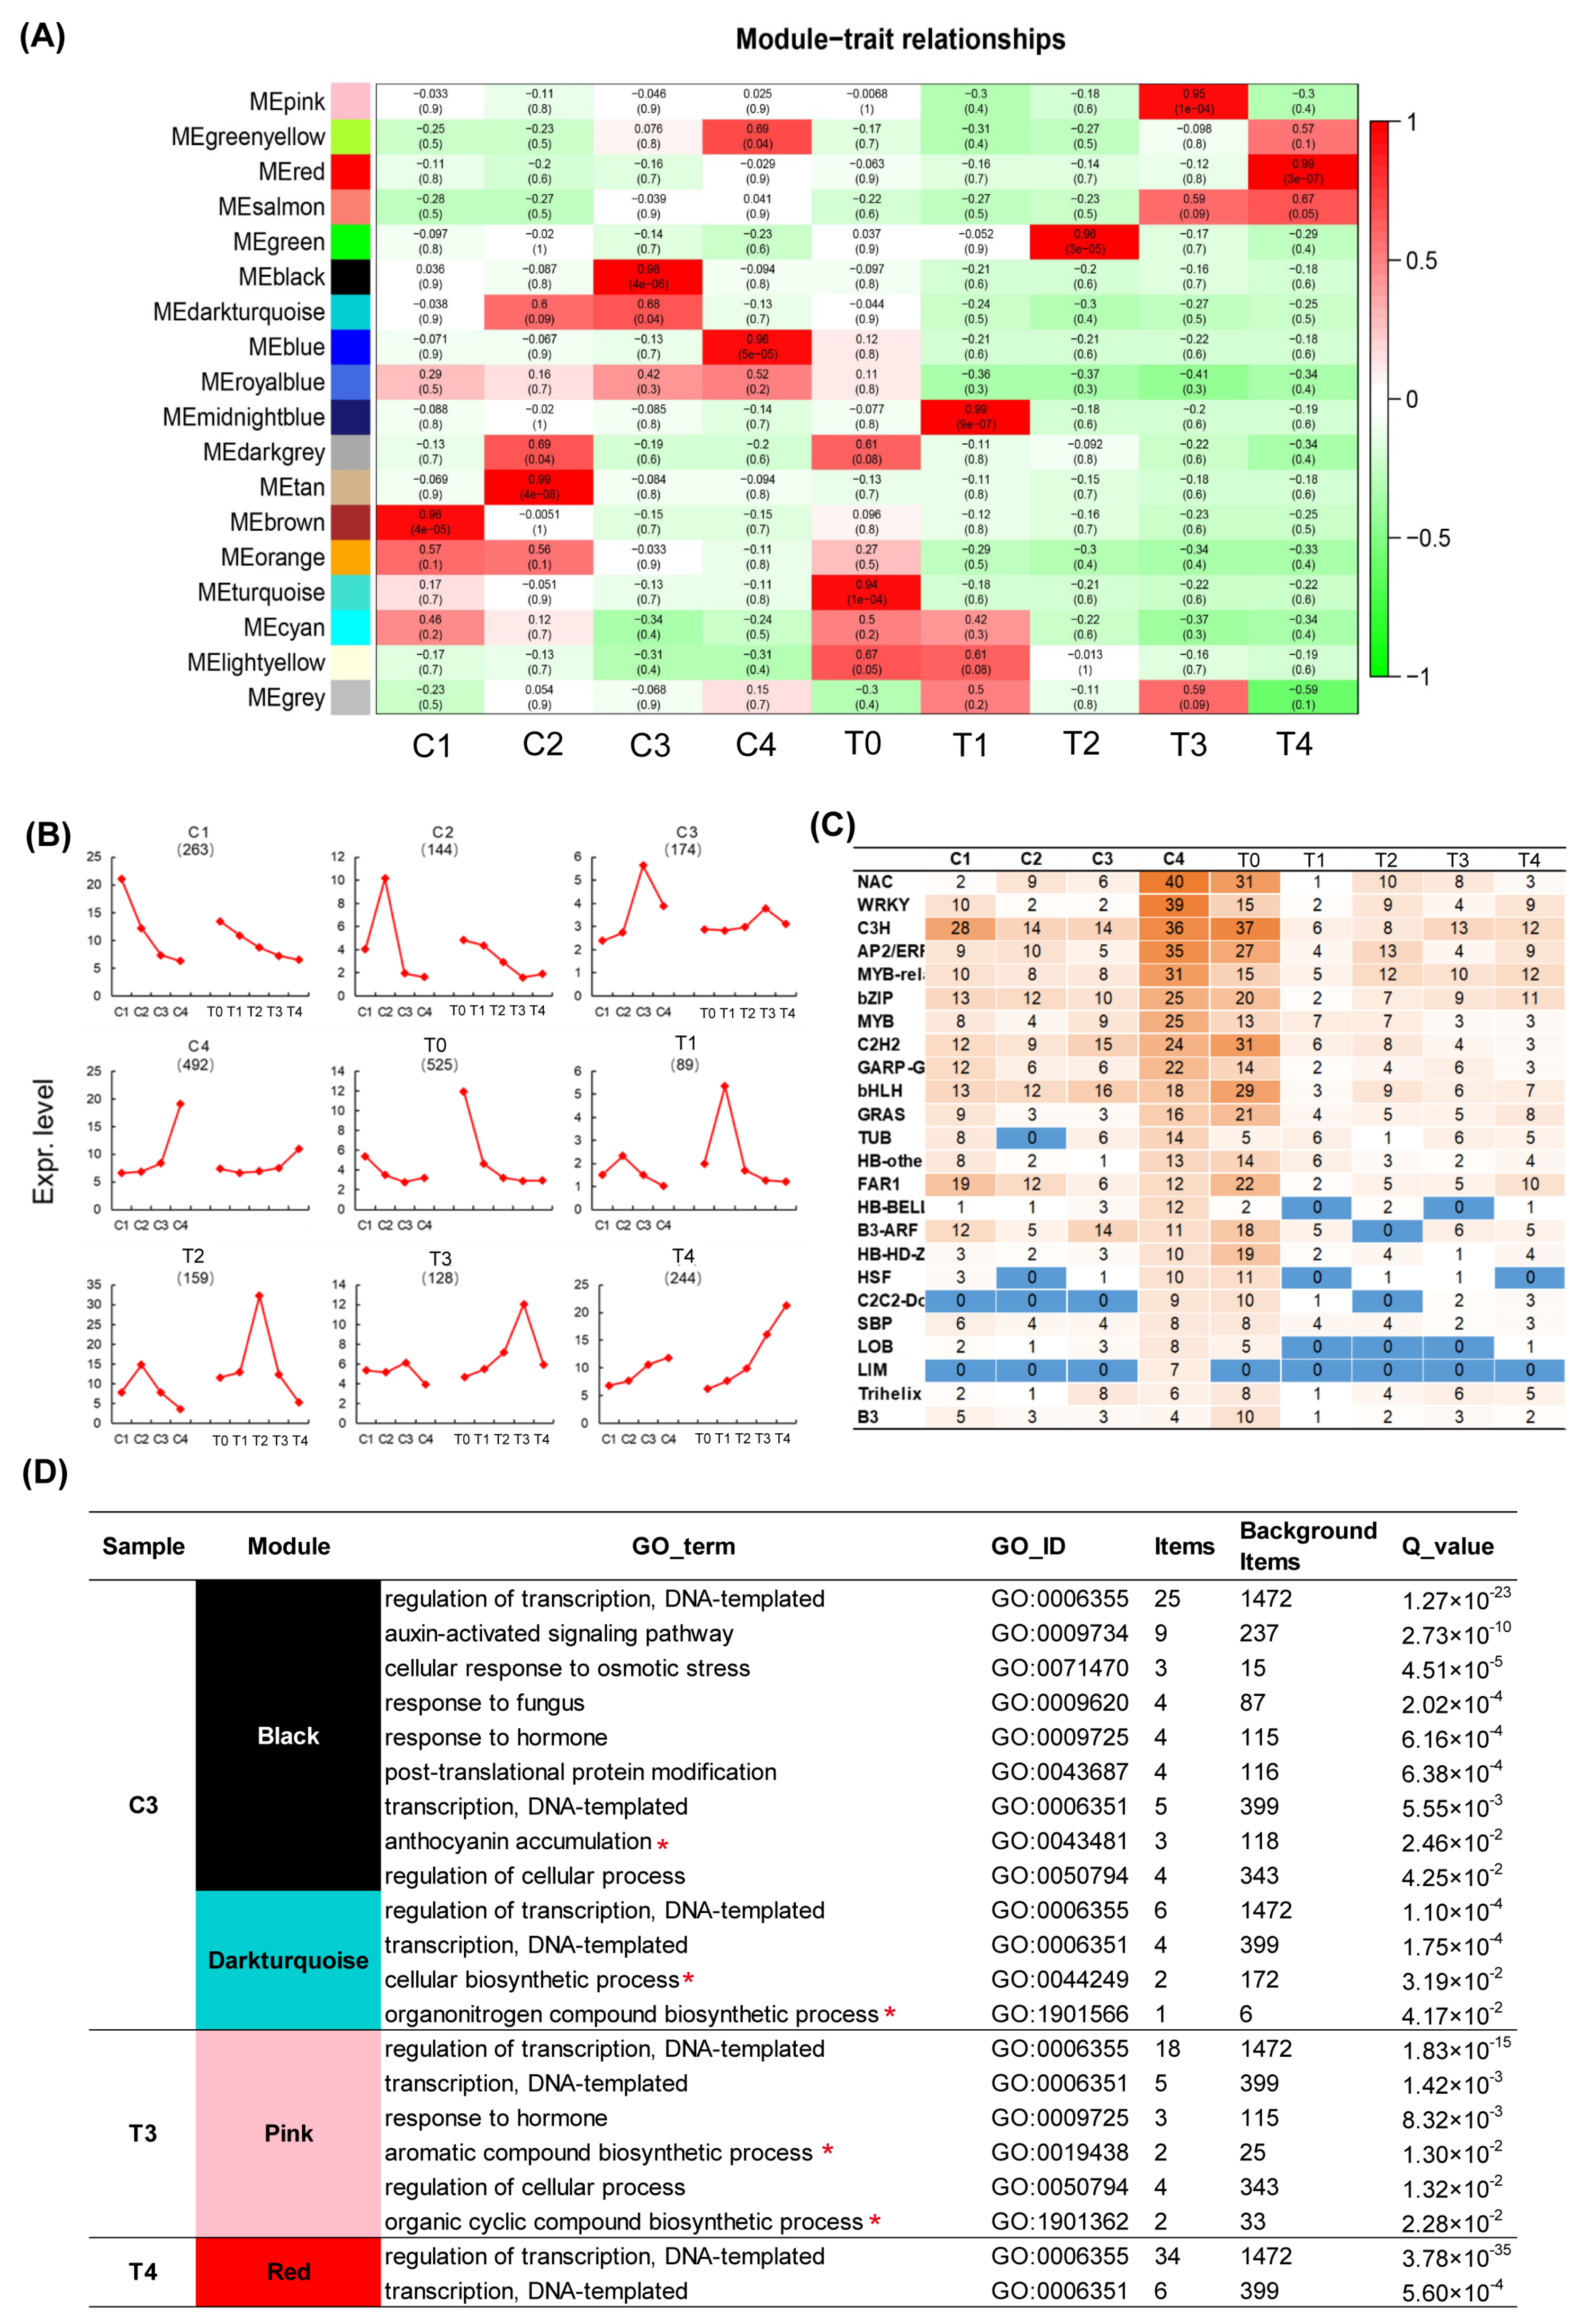
2.5. WGCNA Analysis of Transcription Factors Related to Color and Scent Biosynthesis Enrichment Term of Narcissus Flower Development
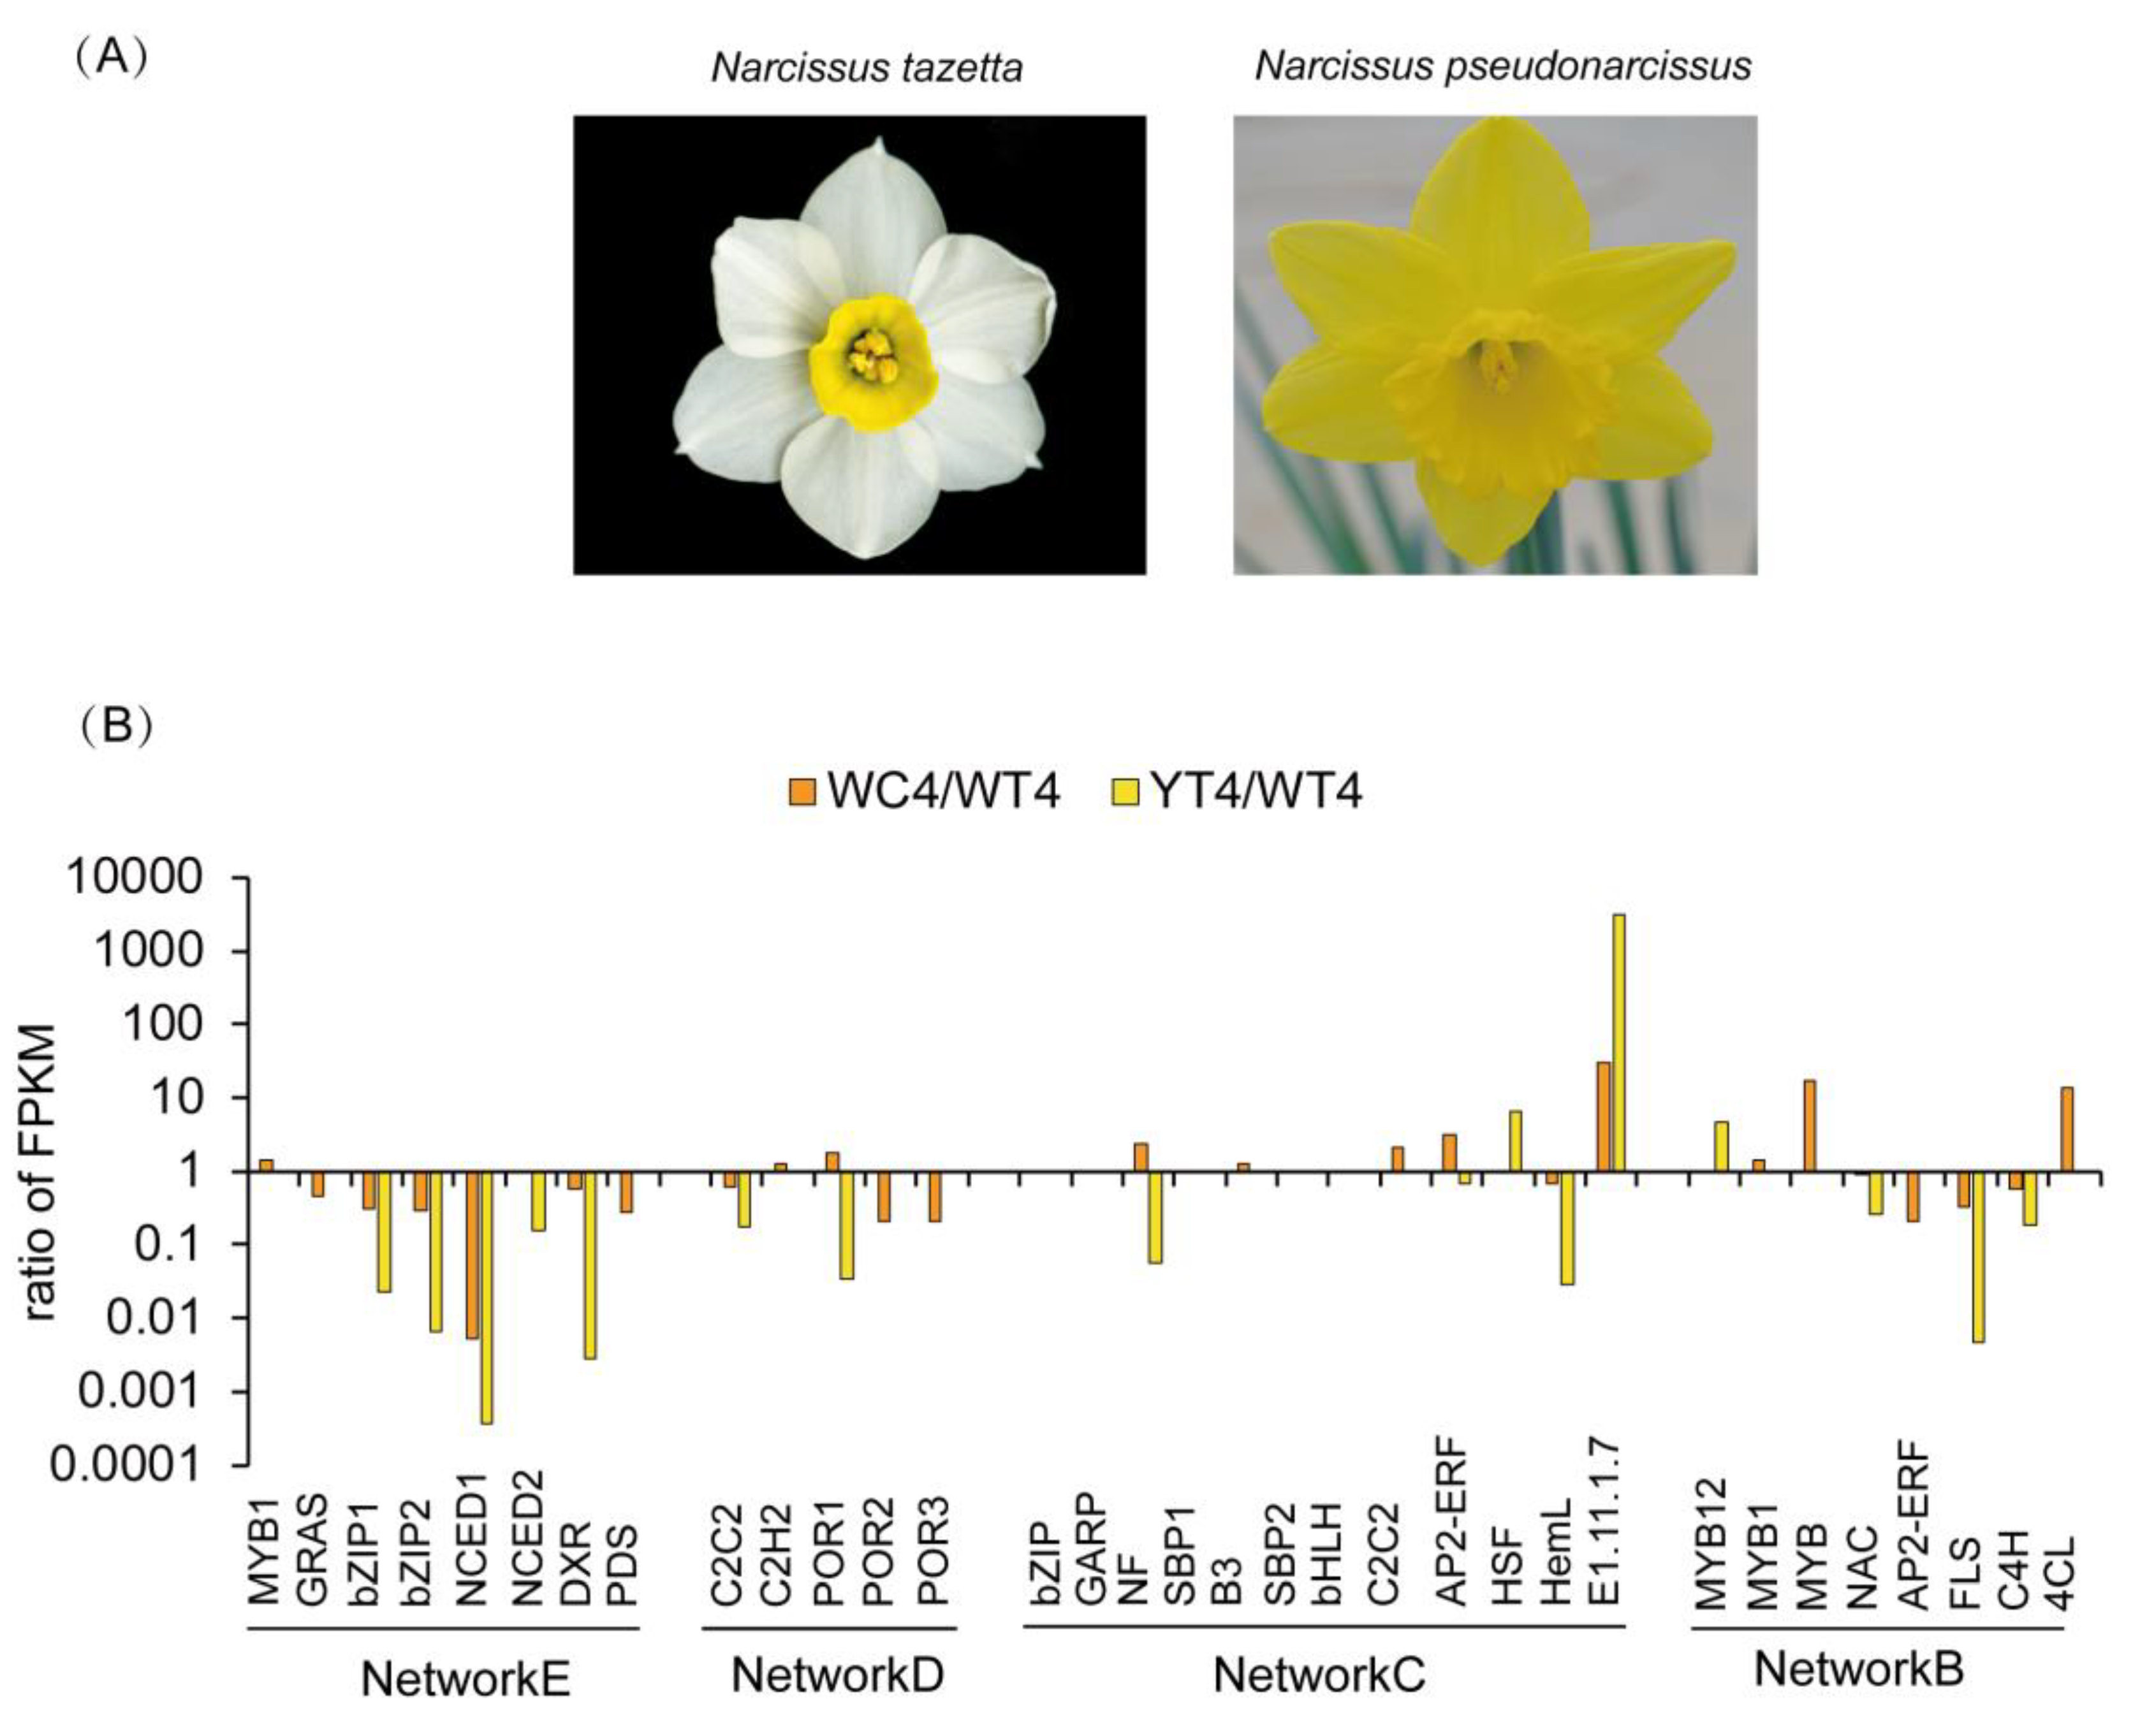
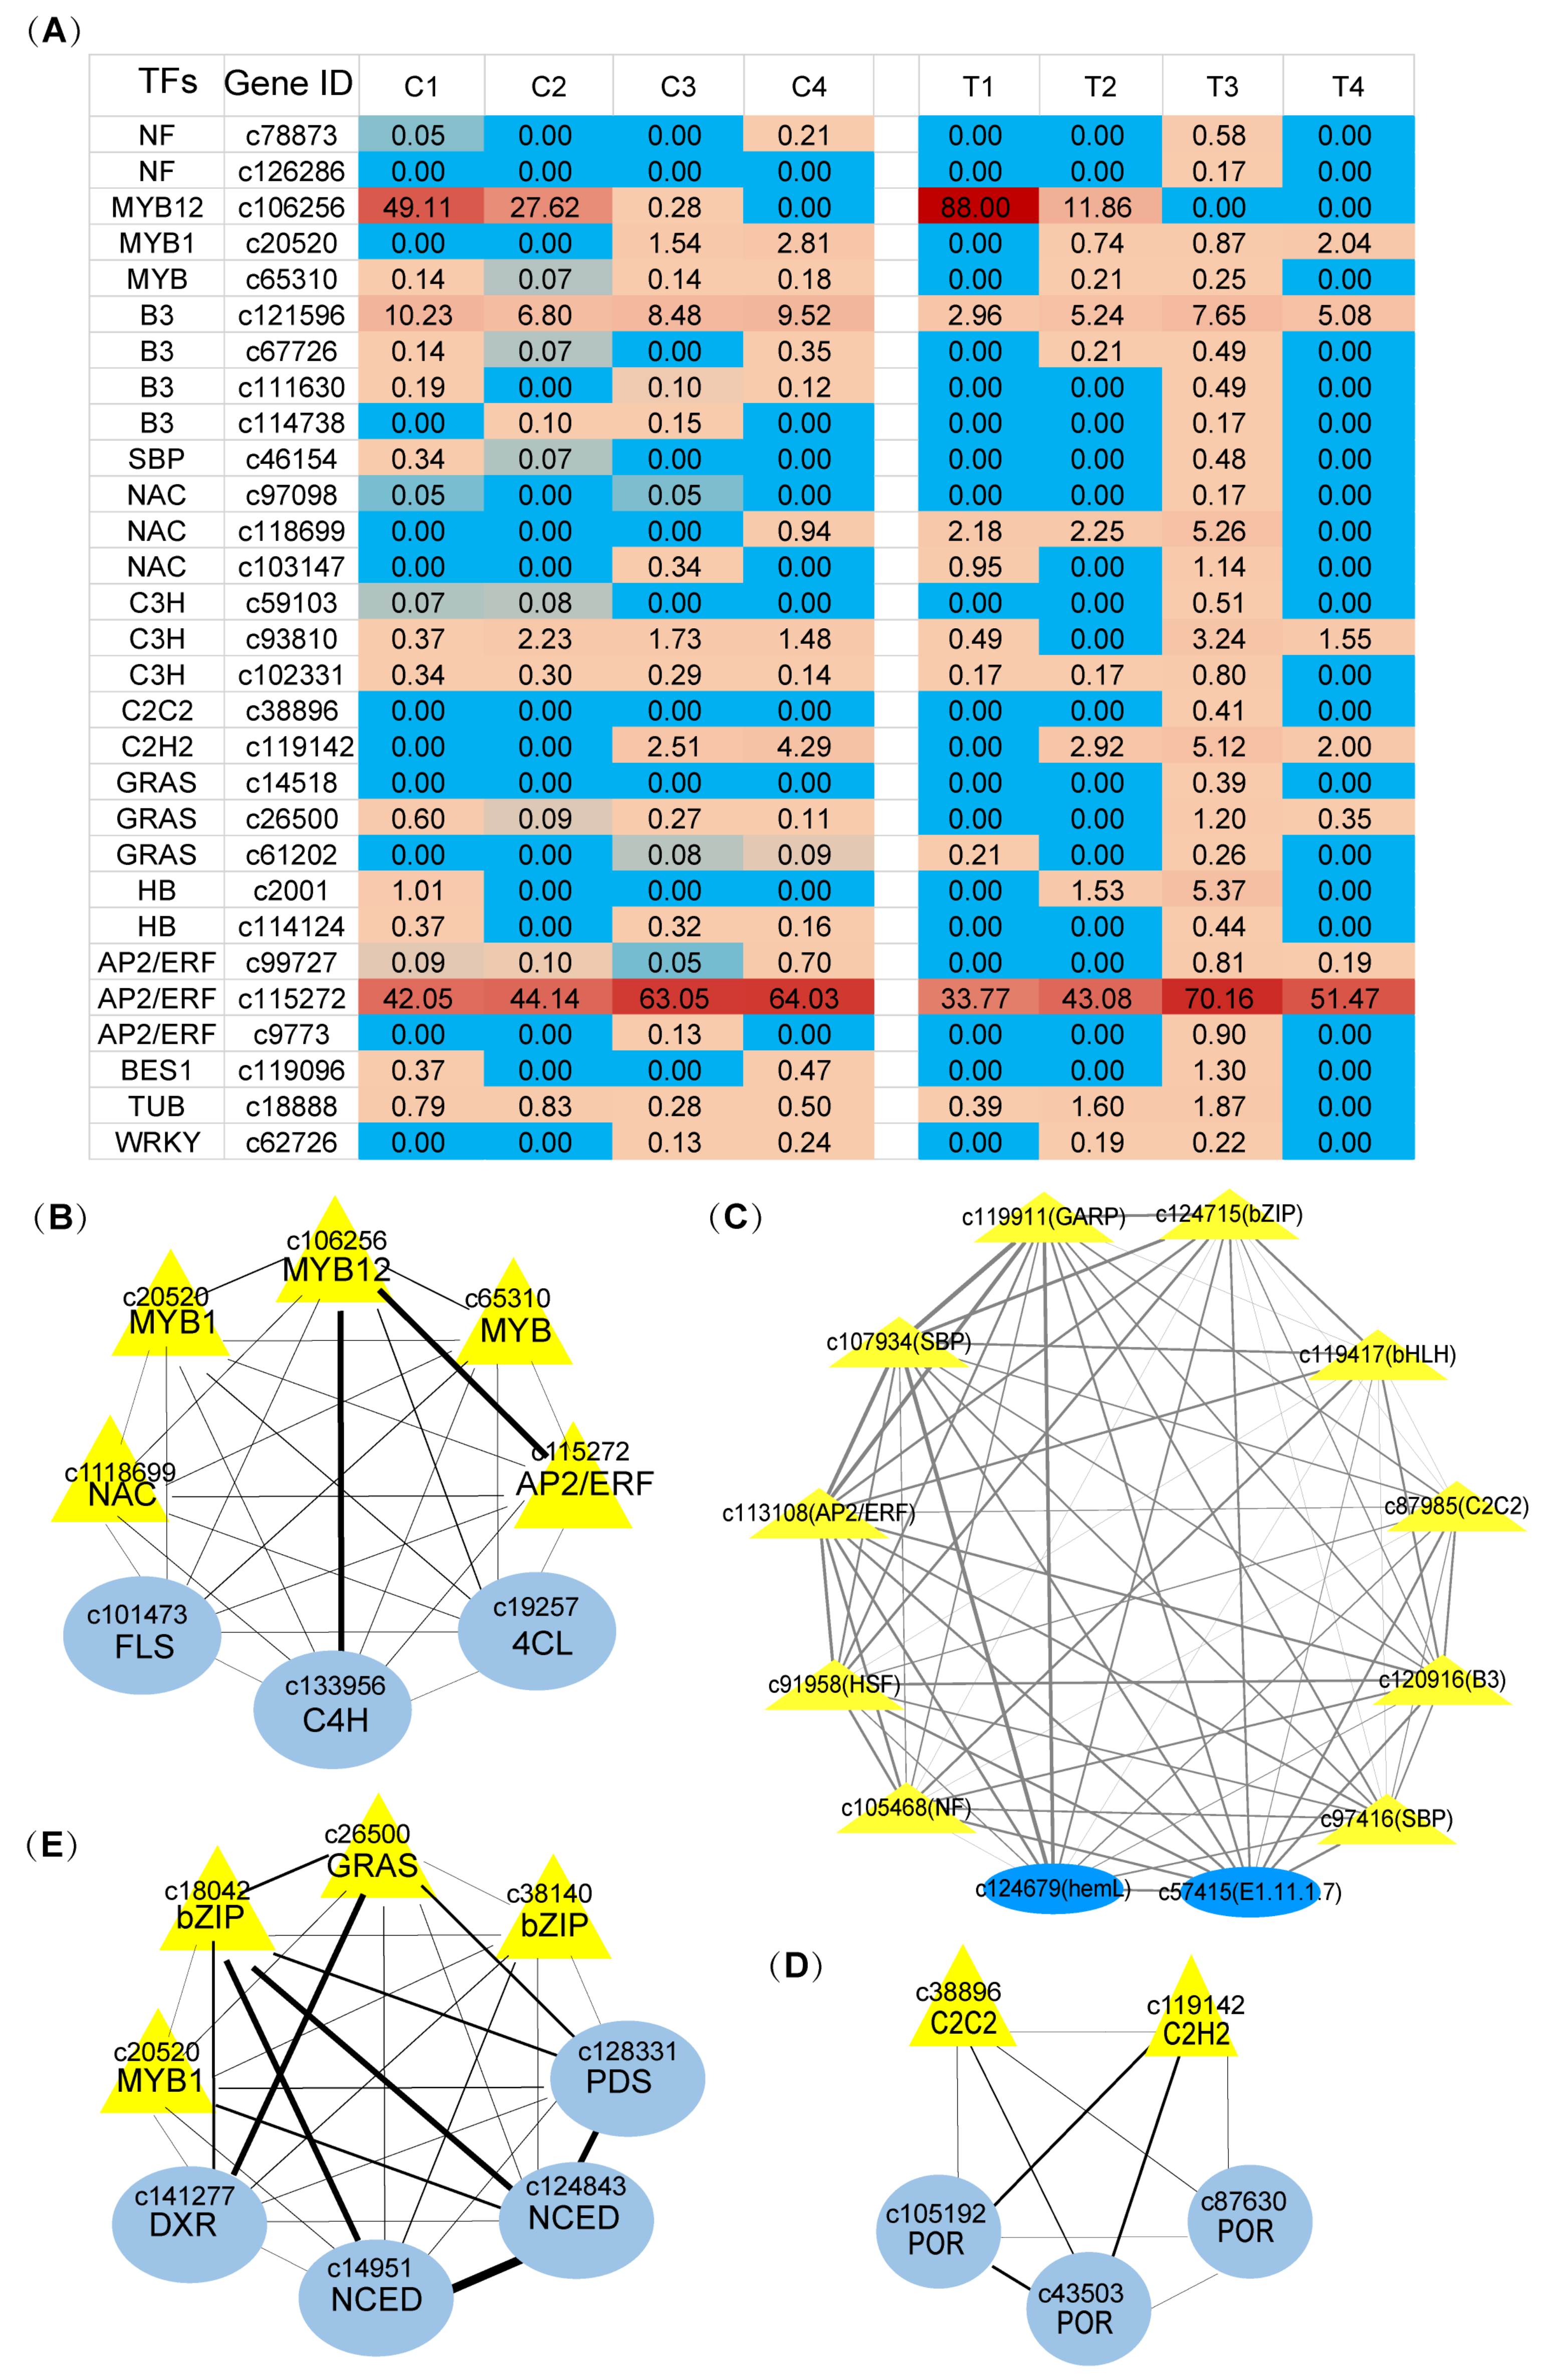
2.6. Identification of Transcription Factors Related to Color and Scent Biosynthesis during Narcissus Flower Development
3. Discussion
4. Materials and Methods
4.1. Plant Materials
4.2. Measurement of Contents of Flavonoids and Carotenoids Metabolites in Tepals and Coronas by HPLC Analysis
4.3. Measurement of Chlorophyll and the Total Carotenoids Contents in Tepals and Coronas
4.4. Measurement of VOCs Component in Tepals and Coronas
4.5. PacBio Iso-Seq Library Preparation and Sequencing
4.6. RNA-Seq and Data Analysis
4.7. Identification of Co-Expression Modules and Visualization of Gene Expression
4.8. Gene Expression Validation
4.9. Statistical Analyses
Supplementary Materials
Author Contributions
Funding
Informed Consent Statement
Data Availability Statement
Conflicts of Interest
References
- Remy, C. Narcissus in perfumery. In Narcissus and Daffodil: The Genus Narcissus; Hanks, G.H., Ed.; Taylor and Francis E-Library: London, UK, 2004; p. 452. [Google Scholar]
- Ren, Y.; Yang, J.; Luo, B.; Jiang, Y.; Chen, H.; Hong, Y.; Wu, B.; Miao, Y. Structure of Pigment Metabolic Pathways and Their Contributions to White Tepal Color Formation of Chinese Narcissus tazetta var. chinensis cv Jinzhanyintai. Int. J. Mol. Sci. 2017, 18, 1923. [Google Scholar] [CrossRef] [Green Version]
- Hoballah, M.E.; Gubitz, T.; Stuurman, J.; Broger, L.; Barone, M.; Mandel, T.; Dell’Olivo, A.; Arnold, M.; Kuhlemeier, C. Single gene-mediated shift in pollinator attraction in Petunia. Plant Cell 2007, 19, 779–790. [Google Scholar] [CrossRef] [Green Version]
- Amrad, A.; Moser, M.; Mandel, T.; de Vries, M.; Schuurink, R.C.; Freitas, L.; Kuhlemeier, C. Gain and loss of floral scent production through changes in structural genes during pollinator-mediated speciation. Curr. Biol. 2016, 26, 3303–3312. [Google Scholar] [CrossRef] [Green Version]
- Gaskett, A.C. Orchid pollination by sexual deception: Pollinator perspectives. Biol. Rev. Camb. Philos. Soc. 2011, 86, 33–75. [Google Scholar] [CrossRef]
- Shang, Y.; Venail, J.; Mackay, S.; Bailey, P.C.; Schwinn, K.E.; Jameson, P.E.; Martin, C.R.; Davies, K.M. The molecular basis for venation patterning of pigmentation and its effect on pollinator attraction in flowers of Antirrhinum. New Phytol. 2011, 189, 602–615. [Google Scholar] [CrossRef]
- Peng, F.; Byers, K.J.; Bradshaw, H.D. Less is more: Independent loss-of-function OCIMENE SYNTHASE alleles parallel pollination syndrome diversification in monkeyflowers (Mimulus). Am. J. Bot. 2017, 104, 1055–1059. [Google Scholar] [CrossRef] [Green Version]
- Zvi, M.M.; Shklarman, E.; Masci, T.; Kalev, H.; Debener, T.; Shafir, S.; Vainstein, A. PAP1 transcription factor enhances production of phenylpropanoid and terpenoid scent compounds in rose flowers. New Phytologist. 2012, 195, 335–345. [Google Scholar] [CrossRef] [PubMed]
- Dudareva, N.; Pichersky, E.; Gershenzon, J. Biochemistry of plant volatiles. Plant Physiol. 2004, 135, 1893–1902. [Google Scholar] [CrossRef] [PubMed] [Green Version]
- Van Schie, C.C.N.; Haring, M.A.; Schuurink, R.C. Regulation of terpenoid and benzenoid production in flowers. Curr. Opin. Plant Biol. 2006, 9, 203–208. [Google Scholar] [CrossRef]
- Schuurink, R.C.; Haring, M.A.; Clark, D.G. Regulation of volatile benzenoid biosynthesis in petunia flowers. Trends Plant Sci. 2006, 11, 20–25. [Google Scholar] [CrossRef] [PubMed]
- Boatright, J.; Negre, F.; Chen, X.; Kish, C.M.; Wood, B.; Pel, G.; Orlova, I.; Gang, D.; Rhodes, D.; Dudareva, N. Understanding in vivo benzenoid metabolism in petunia petal tissue. Plant Physiol. 2004, 135, 1993–2011. [Google Scholar] [CrossRef] [Green Version]
- Kaminaga, Y.; Schnepp, J.; Pee, G.; Kish, C.M.; Ben-Nissan, G.; Weiss, D.; Orlova, I.; Lavie, O.; Rhodes, D.; Wood, K.; et al. Plant phenylacetaldehyde synthase is a bifunctional homotetrameric enzyme that catalyzes phenylalanine decarboxylation and oxidation. J. Biol. Chem. 2006, 281, 23357–23366. [Google Scholar] [CrossRef] [PubMed] [Green Version]
- Tieman, D.; Taylor, M.; Schauer, N.; Fernie, A.R.; Hanson, A.D.; Klee, H.J. Tomato aromatic amino acid decarboxylases participate in synthesis of the flavor volatiles 2-phenylethanol and 2-phenylacetaldehyde. Proc. Natl. Acad. Sci. USA 2006, 103, 8287–8292. [Google Scholar] [CrossRef] [PubMed] [Green Version]
- Dexter, R.; Qualley, A.; Kish, C.M.; Ma, C.J.; Koeduka, T.; Nagegowda, D.A.; Dudareva, N.; Pichersky, E.; Clark, D. Characterization of a petunia acetyltransferase involved in the biosynthesis of the floral volatile isoeugenol. Plant J. 2007, 49, 265–275. [Google Scholar] [CrossRef] [Green Version]
- Magnard, J.L.; Roccia, A.; Caissard, J.C.; Vergne, P.; Sun, P.; Hecquet, R.; Dubois, A.; Hibrand-Saint Oyant, L.; Jullien, F.; Nicolè, F.; et al. PLANT VOLATILES. Biosynthesis of monoterpene scent compounds in roses. Science 2015, 349, 81–83. [Google Scholar] [CrossRef] [Green Version]
- Liu, M.; Lu, S. Plastoquinone and ubiquinone in plants: Biosynthesis, physiological function and metabolic engineering. Front. Plant Sci. 2016, 7, 1898. [Google Scholar] [CrossRef] [Green Version]
- Ruiz-Sola, M.Á.; Rodríguez-Concepción, M. Carotenoid biosynthesis in Arabidopsis: A colorful pathway. Arab. Book 2012, 10, e0158. [Google Scholar] [CrossRef] [Green Version]
- Bergman, M.E.; Chávez, A.; Ferrer, A.; Phillips, M.A. Distinct metabolic pathways drive monoterpenoid biosynthesis in a natural population of Pelargonium graveolens. J. Exp. Bot. 2020, 71, 258–271. [Google Scholar] [CrossRef]
- Kumar, S.R.; Rai, A.; Bomzan, D.P.; Kumar, K.; Hemmerlin, A.; Dwivedi, V.; Godbole, R.C.; Barvkar, V.; Shanker, K.; Shilpashree, H.B.; et al. A plastid-localized bona fide geranylgeranyl diphosphate synthase plays a necessary role in monoterpene indole alkaloid biosynthesis in Catharanthus roseus. Plant J. 2020, 103, 248–265. [Google Scholar] [CrossRef] [PubMed]
- Verdonk, J.C.; Haring, M.A.; van Tunen, A.J.; Schuurink, R.C. ODORANT1 regulates fragrance biosynthesis in petunia flowers. Plant Cell 2005, 17, 1612–1624. [Google Scholar] [CrossRef] [Green Version]
- Spitzer-Rimon, B.; Marhevka, E.; Barkai, O.; Marton, I.; Edelbaum, O.; Masci, T.; Prathapani, N.K.; Shklarman, E.; Ovadis, M.; Vainstein, A. EOBII, a Gene Encoding a Flower-Specific Regulator of Phenylpropanoid Volatiles’ Biosynthesis in Petunia. Plant Cell 2010, 22, 1961–1976. [Google Scholar] [CrossRef] [Green Version]
- Colquhoun, T.A.; Kim, J.Y.; Wedde, A.E.; Levin, L.A.; Schmitt, K.C.; Schuurink, R.C.; Clark, D.G. PhMYB4 fine-tunes the floral volatile signature of Petunia x hybrida through PhC4H. J. Exp. Bot. 2011, 62, 1133–1143. [Google Scholar] [CrossRef] [PubMed]
- Winkel-Shirley, B. Flavonoid biosynthesis. A colorful model for genetics, biochemistry, cell biology, and biotechnology. Plant Physiol. 2001, 126, 485–493. [Google Scholar] [CrossRef] [PubMed] [Green Version]
- Chandler, S.; Tanaka, Y. Genetic modification in floriculture. Crit. Rev. Plant Sci. 2007, 26, 169–197. [Google Scholar] [CrossRef]
- Koes, R.; Verweij, W.; Quattrocchio, F. Flavonoids: A colorful model for the regulation and evolution of biochemical pathways. Trends Plant Sci. 2005, 10, 236–242. [Google Scholar] [CrossRef]
- Zuker, A.; Tzfira, T.; Ben-Meir, H.; Ovadis, M.; Shklarman, E.; Itzhaki, H.; Forkmann, G.; Martens, S.; Neta-Sharir, I.; Weiss, D.; et al. Modification of flower color and fragrance by antisense suppression of the flavanone 3-hydroxylase gene. Mol. Breed. 2002, 9, 33–41. [Google Scholar] [CrossRef]
- Schwinn, K.; Venail, J.; Shang, Y.; Mackay, S.; Alm, V.; Butelli, E.; Oyama, R.; Bailey, P.; Davies, K.; Martin, C. A small family of MYB-regulatory genes controls floral pigmentation intensity and patterning in the genus Antirrhinum. Plant Cell 2006, 18, 831–851. [Google Scholar] [CrossRef] [Green Version]
- Albert, N.W.; Lewis, D.H.; Zhang, H.; Schwinn, K.E.; Jameson, P.E.; Davies, K.M. Members of an R2R3-MYB transcription factor family in Petunia are developmentally and environmentally regulated to control complex floral and vegetative pigmentation patterning. Plant J. 2011, 65, 771–784. [Google Scholar] [CrossRef]
- Yuan, Y.W.; Rebochod, A.B.; Sagawaa, J.M.; Stanley, L.E.; Bradshaw Jr, H.D. Competition between anthocyanin and flavonol biosynthesis produces spatial pattern variation of floral pigments between Mimulus species. Proc. Natl. Acad. Sci. USA 2016, 113, 2448–2453. [Google Scholar] [CrossRef] [Green Version]
- Li, X.; Lu, M.; Tang, D.; Shi, Y. Composition of Carotenoids and Flavonoids in Narcissus Cultivars and their Relationship with Flower Color. PLoS ONE 2015, 10, e0142074. [Google Scholar] [CrossRef] [Green Version]
- Terry, M.I.; Ruiz-Hernández, V.; Águila, D.J.; Weiss, J.; Egea-Cortines, M. The Effect of Postharvest Conditions in Narcissus sp. Cut Flowers Scent Profile. Front. Plant Sci. 2021, 11, 540821. [Google Scholar] [CrossRef] [PubMed]
- Langfelder, P.; Horvath, S. WGCNA: An R package for weighted correlation network analysis. BMC Bioinform. 2008, 9, 559. [Google Scholar] [CrossRef] [PubMed] [Green Version]
- Cazzonelli, C.I.; Pogson, B.J. Source to sink: Regulation of carotenoid biosynthesis in plants. Trends Plant Sci. 2010, 15, 266–274. [Google Scholar] [CrossRef]
- Vranová, E.; Coman, D.; Gruissem, W. Network analysis of the MVA and MEP pathways for isoprenoid synthesis. Annu. Rev. Plant Biol. 2013, 64, 665–700. [Google Scholar] [CrossRef]
- Lange, B.M.; Ghassemian, M. Genome organization in Arabidopsis thaliana a survey for genes involved in isoprenoid and chlorophyll metabolism. Plant Mol. Biol. 2003, 51, 925–948. [Google Scholar] [CrossRef]
- Zhou, F.; Wang, C.-Y.; Gutensohn, M.; Jiang, L.; Zhang, P.; Zhang, D.; Dudareva, N.; Lu, S. A recruiting protein of geranylgeranyl diphosphate synthase controls metabolic flux toward chlorophyll biosynthesis in rice. Proc. Natl. Acad. Sci. USA 2017, 114, 6866–6871. [Google Scholar] [CrossRef] [Green Version]
- Yang, L.-E.; Huang, X.-Q.; Lu, Q.-Q.; Zhu, J.-Y.; Lu, S. Cloning and characterization of the geranylgeranyl diphosphate synthase (GGPS) responsible for carotenoid biosynthesis in Pyropia umbilicalis. J. Appl. Phycol. 2016, 28, 671–678. [Google Scholar] [CrossRef]
- Wang, G.; Dixon, R.A. Heterodimeric geranyl(geranyl)-diphosphate synthase from hop (Humulus lupulus) and the evolution of monoterpene biosynthesis. Proc. Natl. Acad. Sci. USA 2009, 106, 9914–9919. [Google Scholar] [CrossRef] [Green Version]
- Chen, Q.; Fan, D.; Wang, G. Heteromeric geranyl(geranyl) diphosphate synthase is involved in monoterpene biosynthesis in Arabidopsis flowers. Mol. Plant 2015, 8, 1434–1437. [Google Scholar] [CrossRef] [PubMed] [Green Version]
- Wang, G.; Yang, B.; Wu, J.; Luo, P.; Anwar, M.; Allan, A.C.; Lin-Wang, K.; Espley, R.V.; Zeng, L. Identification of genes involved in flavonoid biosynthesis of Chinese Narcissus (Narcissus tazetta L. var. chinensis). Plant Mol. Biol. Rep. 2018, 36, 812–821. [Google Scholar] [CrossRef]
- Barja, M.V.; Ezquerro, M.; Beretta, S.; Diretto, G.; Florez-Sarasa, I.; Feixes, E.; Fiore, A.; Karlova, R.; Fernie, A.R.; Beekwilder, J.; et al. Several geranylgeranyl diphosphate synthase isoforms supply metabolic substrates for carotenoid biosynthesis in tomato. New Phytol. 2021. [Google Scholar] [CrossRef]
- Lu, C.; Pu, Y.; Liu, Y.; Li, Y.; Qu, J.; Huang, H.; Dai, S. Comparative transcriptomics and weighted gene co-expression correlation network analysis (WGCNA) reveal potential regulation mechanism of carotenoid accumulation in Chrysanthemum × morifolium. Plant Physiol. Biochem. 2019, 142, 415–428. [Google Scholar] [CrossRef]
- Shannon, P.; Markiel, A.; Ozier, O.; Baliga, N.S.; Wang, J.T.; Ramage, D.; Amin, N.; Schwikowski, B.; Ideker, T. Cytoscape: A software environment for integrated models of biomolecular interaction networks. Genome Res. 2003, 13, 2498–2504. [Google Scholar] [CrossRef] [PubMed]
- Dormont, L.; Delle-Vedove, R.; Bessiere, J.M.; Schatz, B. Floral scent emitted by white and coloured morphs in orchids. Phytochemistry 2014, 100, 51–59. [Google Scholar] [CrossRef]
- Raguso, R.A. Wake up and smell the roses: The ecology and evolution of floral scent. Annu. Rev. Ecol. Evol. Syst. 2008, 39, 549–569. [Google Scholar] [CrossRef]
- Colquhoun, T.A.; Verdonk, J.C.; Schimmel, B.C.; Tieman, D.M.; Underwood, B.A.; Clark, D.G. Petunia floral volatile benzenoid/phenylpropanoid genes are regulated in a similar manner. Phytochemistry 2010, 71, 158–167. [Google Scholar] [CrossRef] [PubMed]
- Van Moerkercke, A.; Haring, M.A.; Schuurink, R.C. The transcription factor EMISSION OF BENZENOIDS II activates the MYB ODORANT1 promoter at a MYB binding site specific for fragrant petunias. Plant J. 2011, 67, 917–928. [Google Scholar] [CrossRef]
- Battat, M.; Eitan, A.; Rogachev, I.; Hanhineva, K.; Fernie, A.; Tohge, T.; Beekwilder, J.; Aharoni, A. AMYB Triad controls primary and phenylpropanoid metabolites for pollen coat patterning. Plant Physiol. 2019, 180, 87–108. [Google Scholar] [CrossRef] [Green Version]
- Anwar, M.; Yu, W.; Yao, H.; Zhou, P.; Allan, A.; Zeng, L. NtMYB3, an R2R3-MYB from Narcissus, Regulates Flavonoid Biosynthesis. Int. J. Mol. Sci. 2019, 20, 5456. [Google Scholar] [CrossRef] [Green Version]
- Pandey, A.; Misra, P.; Choudhary, D.; Yadav, R.; Goel, R.; Bhambhan Si Sanyal, I.; Trivedi, R.; Trivedi, P.K. AtMYB12 expression in tomato leads to large scale differential modulation in transcriptome and flavonoid content in leaf and fruit tissues. Sci. Rep. 2015, 5, 12412. [Google Scholar] [CrossRef] [Green Version]
- Gu, K.; Wang, C.-K.; Hu, D.; Hao, Y. How do anthocyanins paint our horticultural products? Sci. Hortic. 2019, 249, 257–262. [Google Scholar] [CrossRef]
- Ramsay, N.; Beverley, J.G. MYB–bHLH–WD40 protein complex and the evolution of cellular diversity. Trends Plant Sci. 2005, 10, 63–70. [Google Scholar] [CrossRef]
- Gonzalez, A.; Zhao, M.; Leavitt, J.M.; Lloyd, A.M. Regulation of the anthocyanin biosynthetic pathway by the TTG1/bHLH/Myb transcriptional complex in Arabidopsis seedlings. Plant J. 2008, 53, 814–827. [Google Scholar] [CrossRef] [PubMed]
- Jaakola, L. New insights into the regulation of anthocyanin biosynthesis in fruits. Trends Plant Sci. 2013, 18, 477–483. [Google Scholar] [CrossRef] [PubMed] [Green Version]
- Morishita, T.; Kojima, Y.; Maruta, T.; Nishizawa-Yokoi, A.; Yabuta, Y.; Shigeoka, S. Arabidopsis NAC Transcription Factor, ANAC078, Regulates Flavonoid Biosynthesis under High-light. Plant Cell Physiol. 2009, 50, 2210–2222. [Google Scholar] [CrossRef] [PubMed] [Green Version]
- Tang, Y.; Zhao, C.T.; Tan, S.T.; Xue, H. Arabidopsis Type II Phosphatidylinositol 4- Kinase PI4Kγ5 Regulates Auxin Biosynthesis and Leaf Margin Development through Interacting with Membrane-Bound Transcription Factor ANAC078. PLoS Genet. 2016, 12, e1006252. [Google Scholar] [CrossRef] [PubMed] [Green Version]
- Underwood, B.A.; Tieman, D.M.; Shibuya, K.; Dexter, R.J.; Loucas, H.M.; Simkin, A.J.; Sims, C.A.; Schmelz, E.A.; Klee, H.J.; Clark, D.G. Ethylene-regulated floral volatile synthesis in petunia corollas. Plant Physiol. 2005, 138, 255–266. [Google Scholar] [CrossRef] [Green Version]
- Miao, L.; Di, Q.; Sun, T.; Li, Y.; Duan, Y.; Wang, J.; Yan, Y.; He, C.; Wang, C.; Yu, X. Integrated Metabolome and Transcriptome Analysis Provide Insights into the Effects of Grafting on Fruit Flavor of Cucumber with Different Rootstocks. Int. J. Mol. Sci. 2019, 20, 3592. [Google Scholar] [CrossRef] [Green Version]
- Allan, A.C. Domestication: Colour and Flavour Joined by a Shared Transcription Factor. Curr. Biol. 2019, 29, R57–R59. [Google Scholar] [CrossRef] [Green Version]
- Trapnell, C.; Williams, B.A.; Pertea, G.; Mortazavi, A.; Kwan, G.; van Baren, M.J.; Salzberg, S.L.; Wold, B.J.; Pachter, L. Transcript assembly and quantification by RNA-Seq reveals unannotated transcripts and isoform switching during cell differentiation. Nat. Biotechnol. 2010, 28, 511–515. [Google Scholar] [CrossRef] [PubMed] [Green Version]
- Haas, B.J.; Papanicolaou, A.; Yassour, M.; Grabherr, M.; Blood, P.D.; Bowden, J.; Couger, M.B.; Eccles, D.; Li, B.; Lieber, M.; et al. De novo transcript sequence reconstruction from RNA-seq using the Trinity platform for reference generation and analysis. Nat. Protoc. 2013, 8, 1494–1512. [Google Scholar] [CrossRef] [PubMed]
- Leng, N.; Dawson, J.A.; Thomson, J.A.; Ruotti, V.; Rissman, A.I.; Smits, B.M.G.; Haag, J.D.; Gould, M.N.; Stewart, R.M.; Kendziorski, C. EBSeq: An empirical Bayes hierarchical model for inference in RNA-seq experiments. Bioinformatics 2013, 29, 1035–1043. [Google Scholar] [CrossRef] [PubMed] [Green Version]


Publisher’s Note: MDPI stays neutral with regard to jurisdictional claims in published maps and institutional affiliations. |
© 2021 by the authors. Licensee MDPI, Basel, Switzerland. This article is an open access article distributed under the terms and conditions of the Creative Commons Attribution (CC BY) license (https://creativecommons.org/licenses/by/4.0/).
Share and Cite
Yang, J.; Ren, Y.; Zhang, D.; Chen, X.; Huang, J.; Xu, Y.; Aucapiña, C.B.; Zhang, Y.; Miao, Y. Transcriptome-Based WGCNA Analysis Reveals Regulated Metabolite Fluxes between Floral Color and Scent in Narcissus tazetta Flower. Int. J. Mol. Sci. 2021, 22, 8249. https://doi.org/10.3390/ijms22158249
Yang J, Ren Y, Zhang D, Chen X, Huang J, Xu Y, Aucapiña CB, Zhang Y, Miao Y. Transcriptome-Based WGCNA Analysis Reveals Regulated Metabolite Fluxes between Floral Color and Scent in Narcissus tazetta Flower. International Journal of Molecular Sciences. 2021; 22(15):8249. https://doi.org/10.3390/ijms22158249
Chicago/Turabian StyleYang, Jingwen, Yujun Ren, Deyu Zhang, Xuewei Chen, Jiazhi Huang, Yun Xu, Cristina Belén Aucapiña, Yu Zhang, and Ying Miao. 2021. "Transcriptome-Based WGCNA Analysis Reveals Regulated Metabolite Fluxes between Floral Color and Scent in Narcissus tazetta Flower" International Journal of Molecular Sciences 22, no. 15: 8249. https://doi.org/10.3390/ijms22158249
APA StyleYang, J., Ren, Y., Zhang, D., Chen, X., Huang, J., Xu, Y., Aucapiña, C. B., Zhang, Y., & Miao, Y. (2021). Transcriptome-Based WGCNA Analysis Reveals Regulated Metabolite Fluxes between Floral Color and Scent in Narcissus tazetta Flower. International Journal of Molecular Sciences, 22(15), 8249. https://doi.org/10.3390/ijms22158249