
The Course of AαVal541 as a Proteinase 3 Specific Neo-Epitope after Alpha-1-Antitrypsin Augmentation in Severe Deficient Patients


 , and
, and
Abstract
: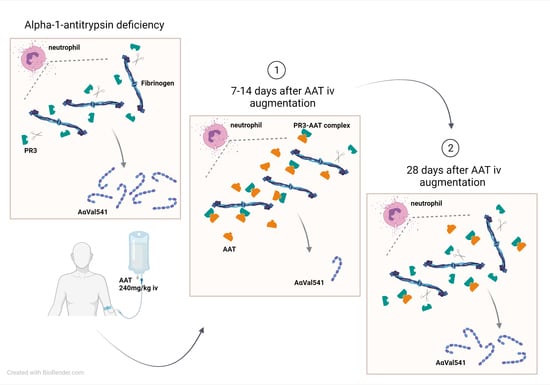
1. Introduction
2. Results
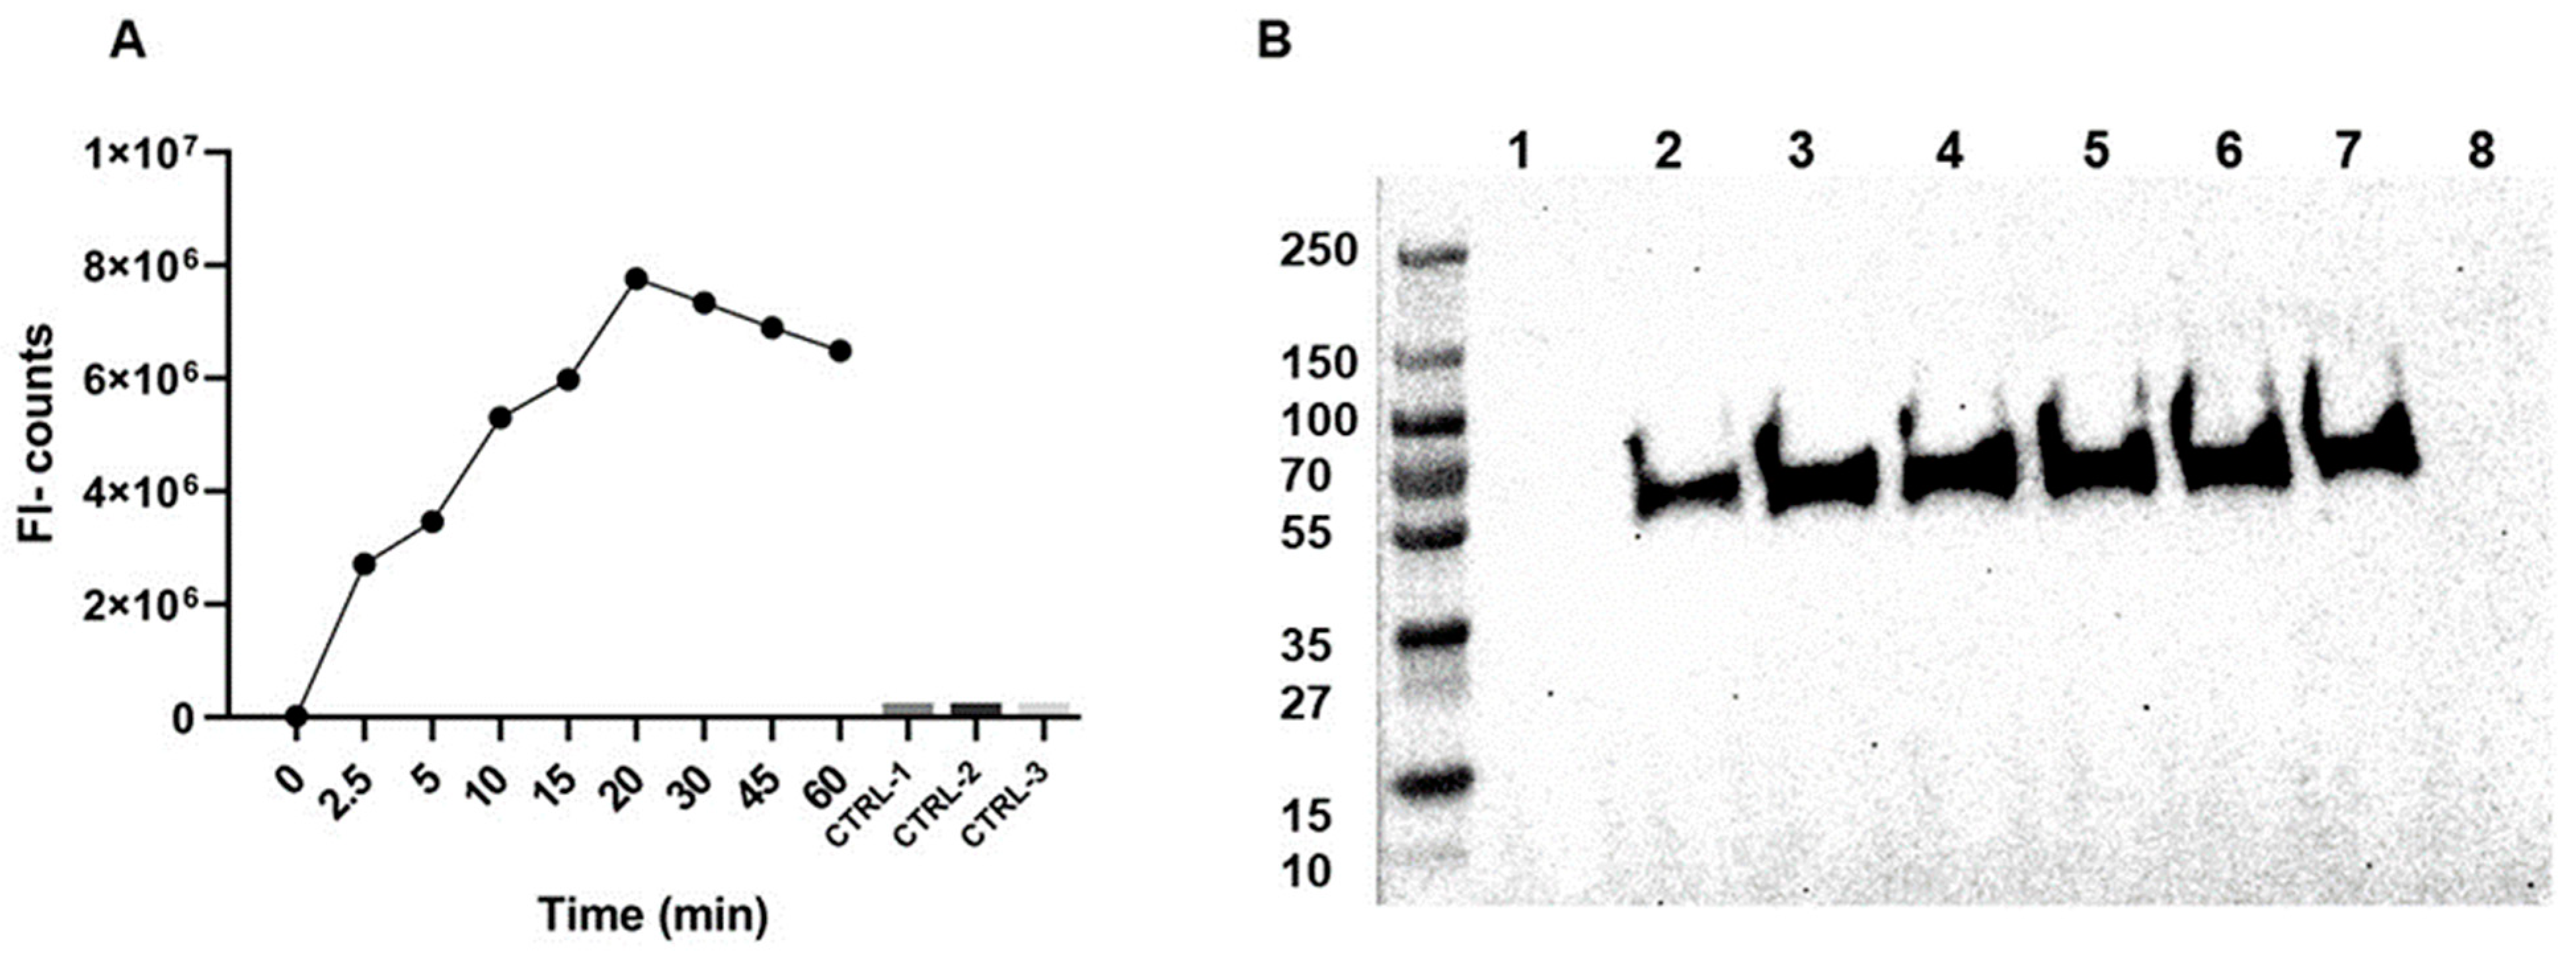
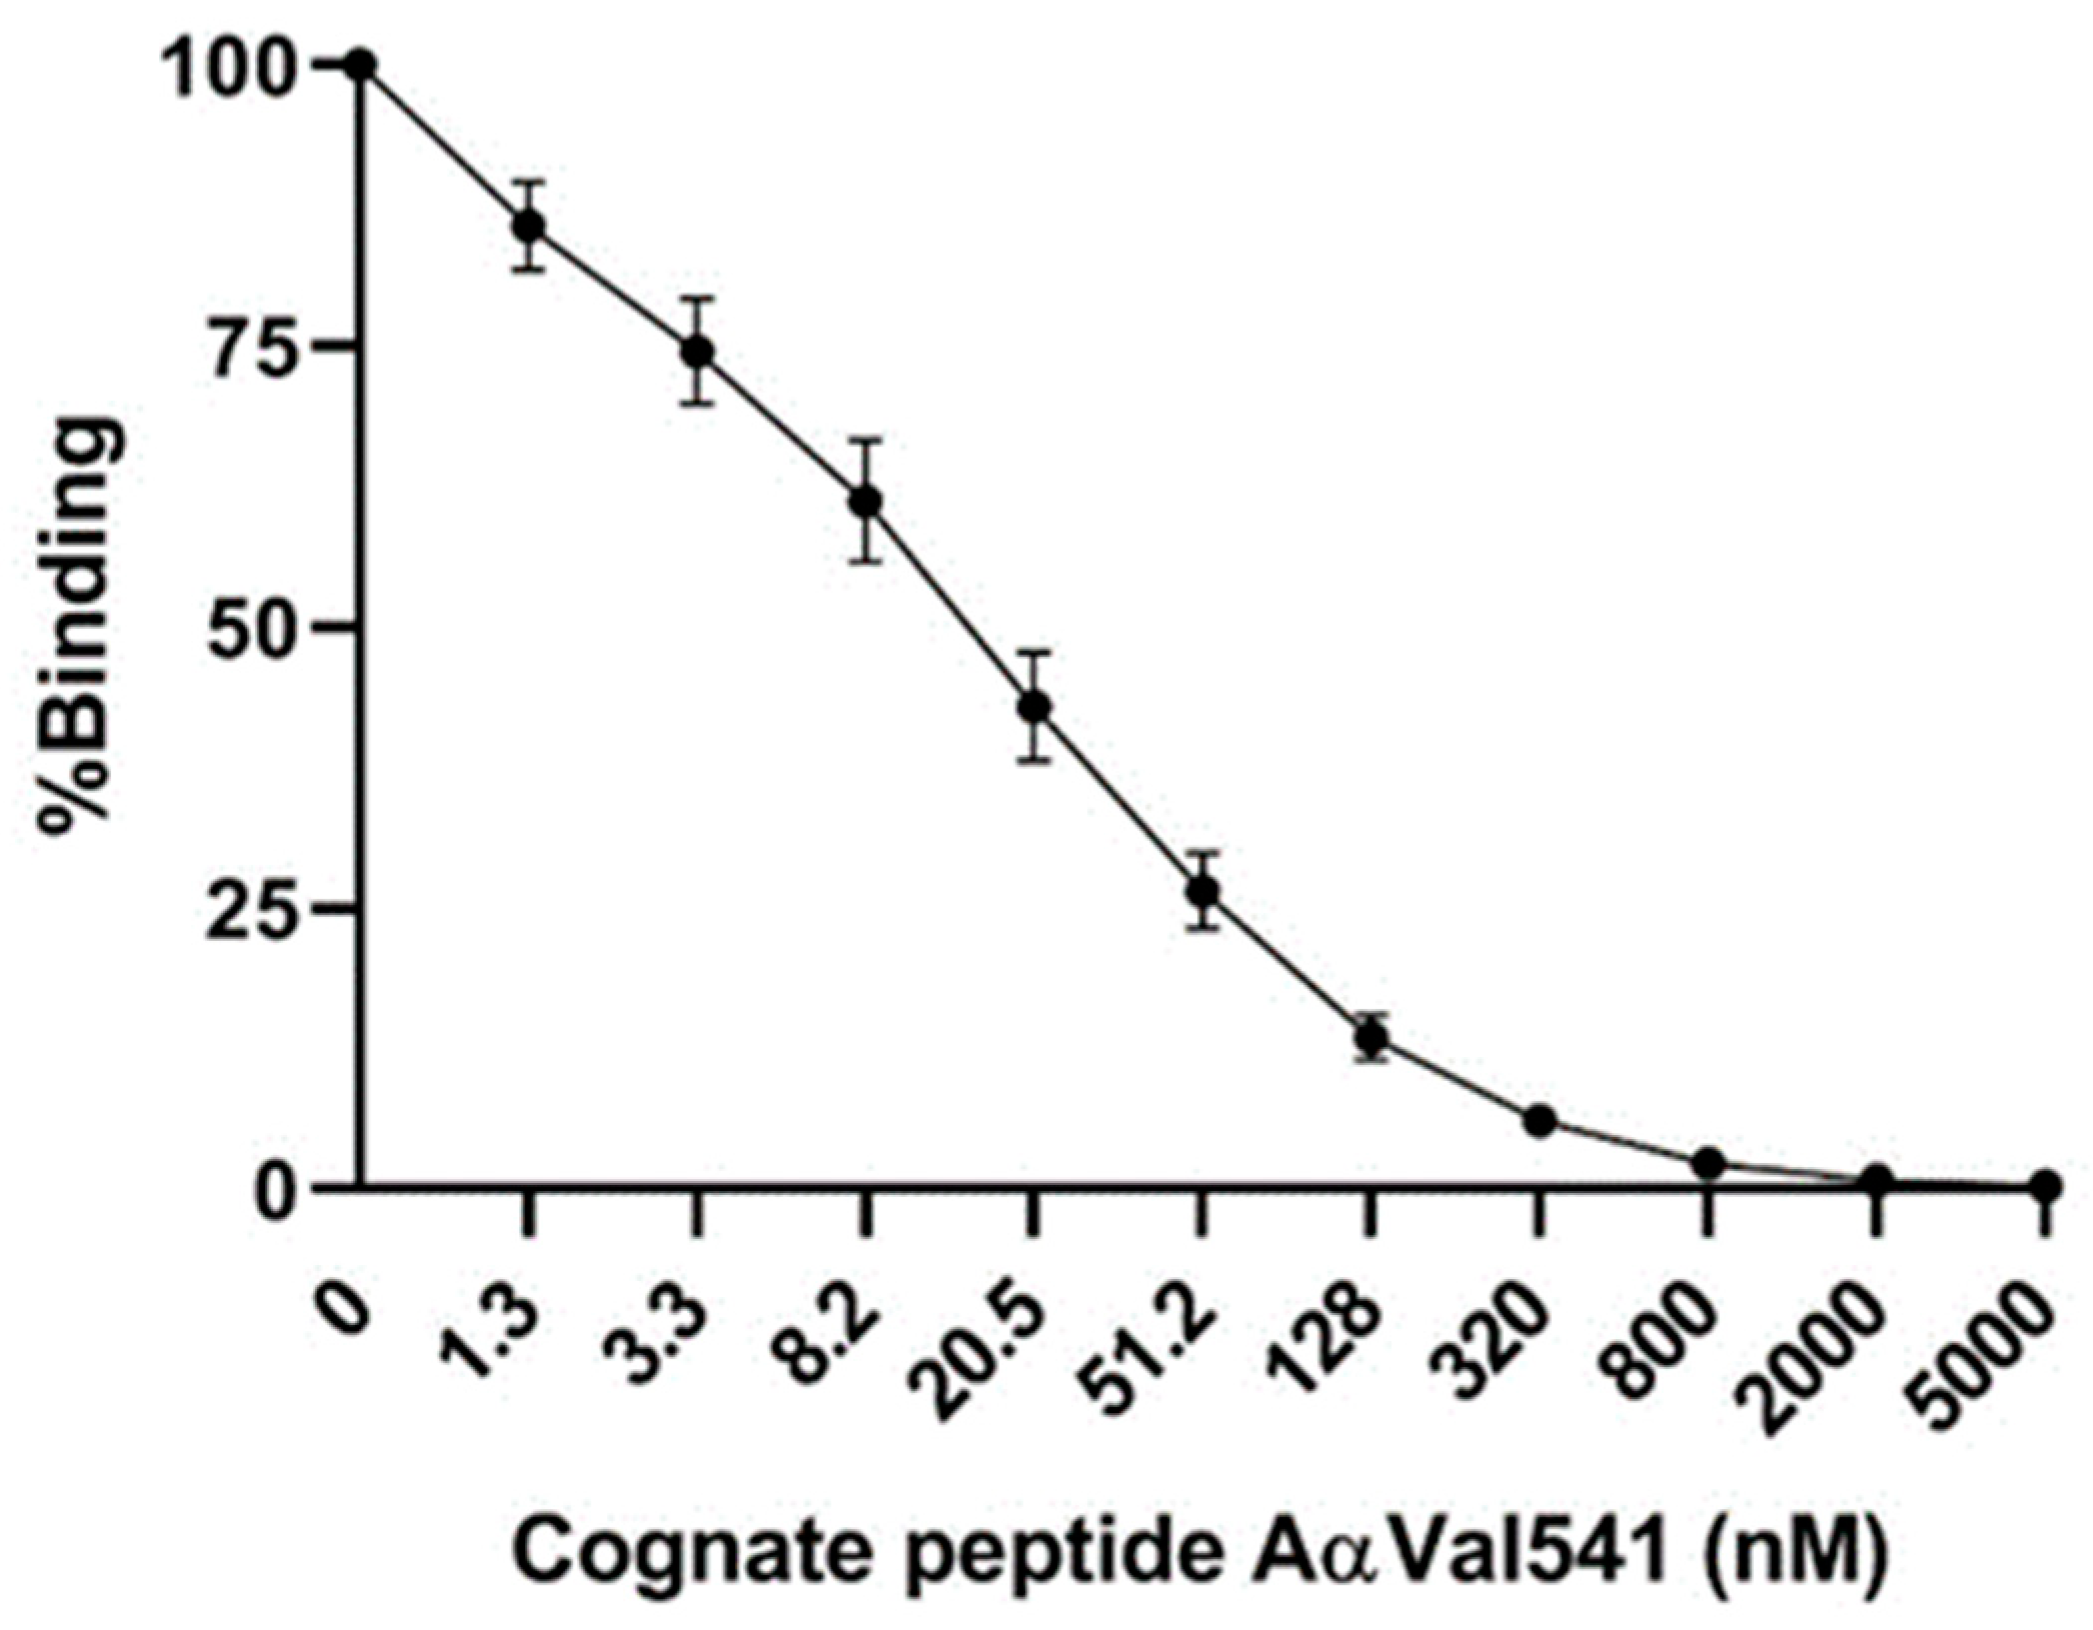
2.1. AαVal541 Assay Development and Validation
2.2. Study Population and Baseline Characteristics
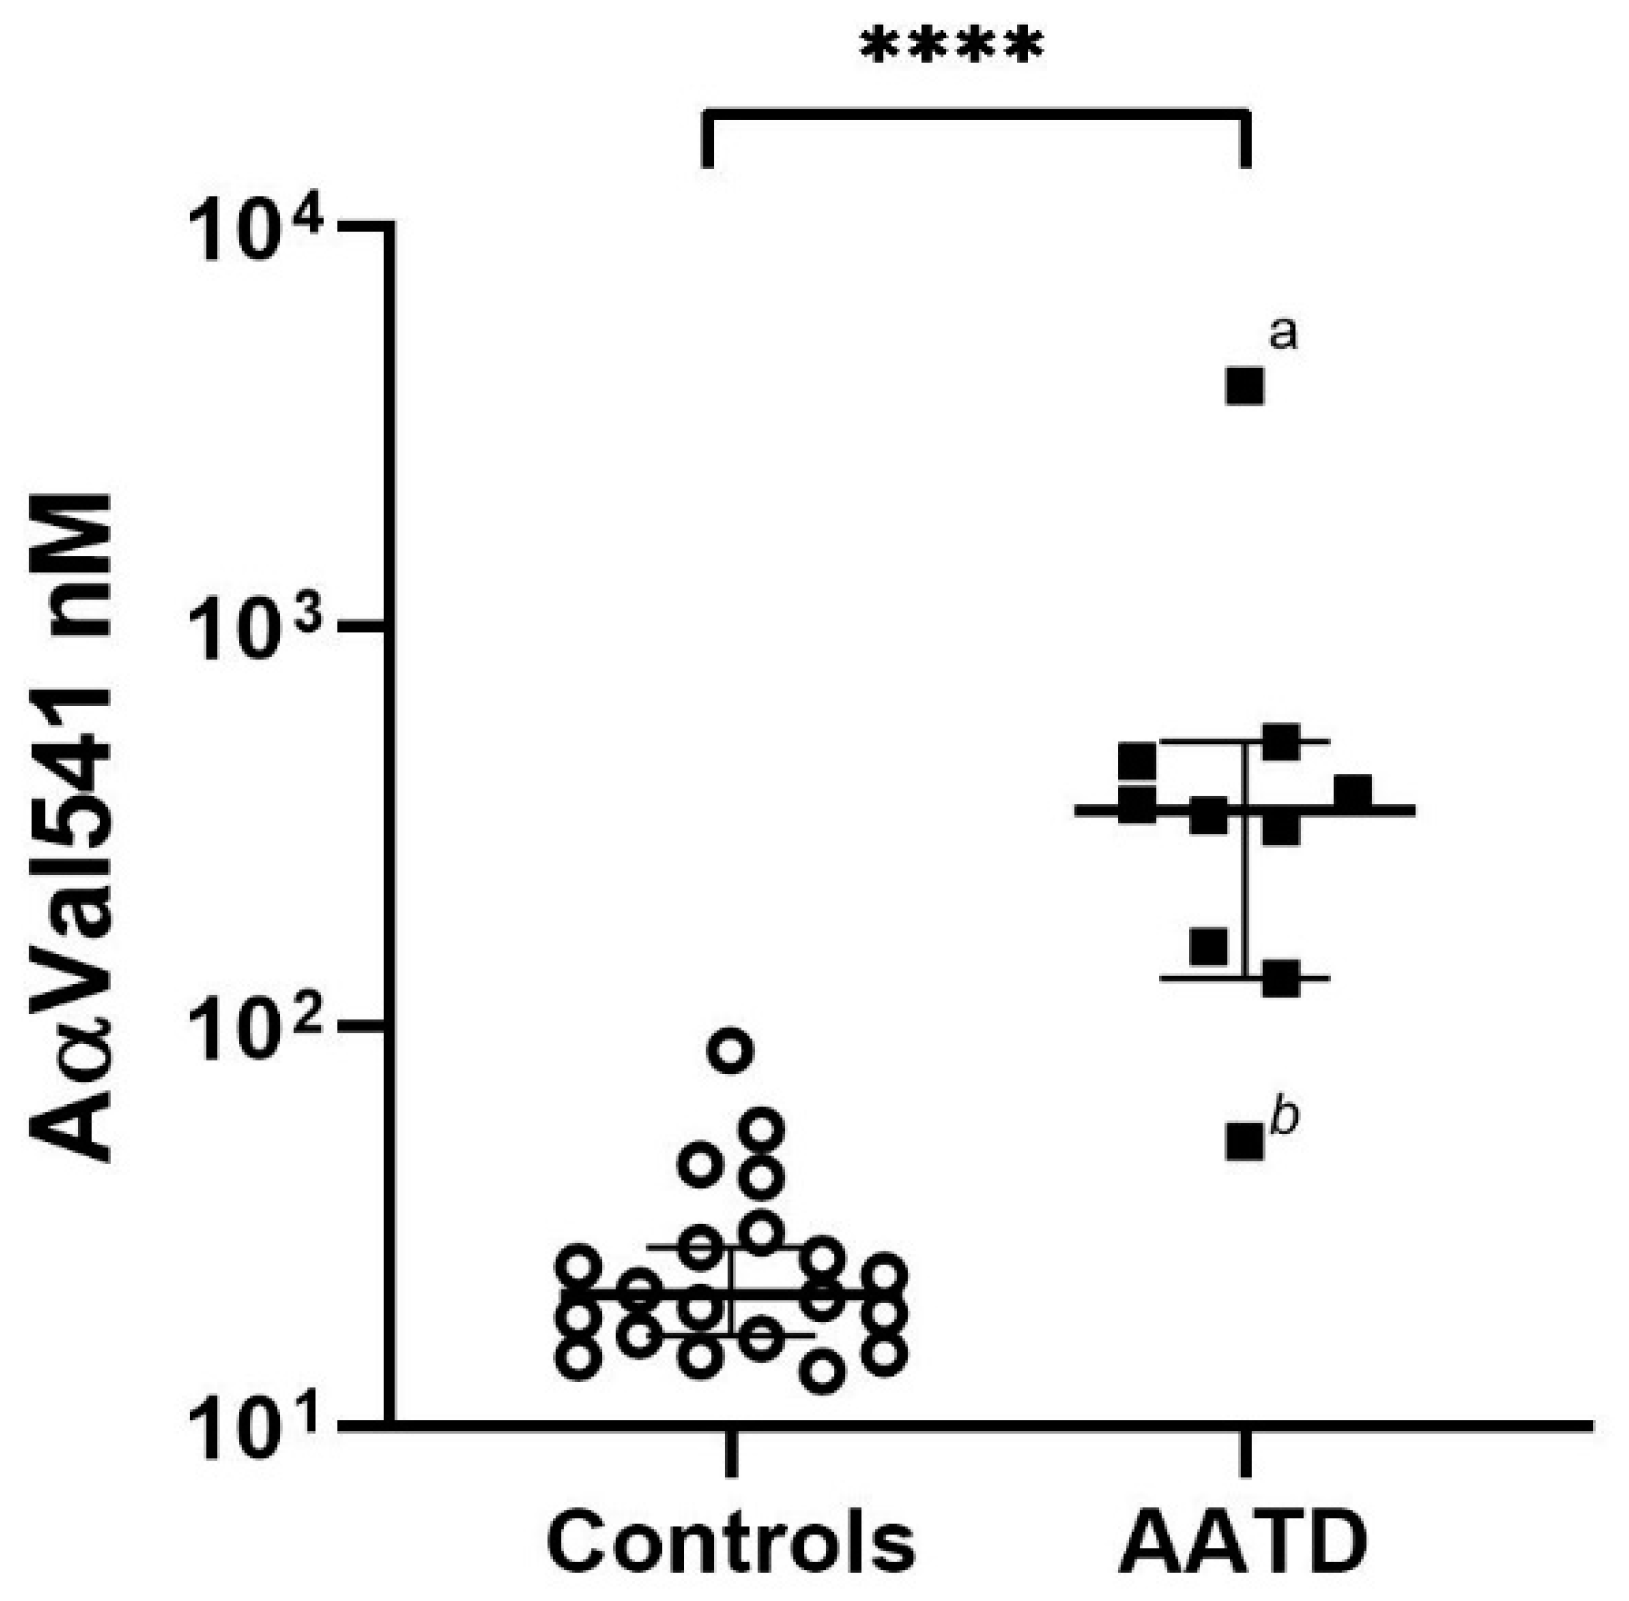
2.3. AαVal541 Levels before Start AAT Augmentation Therapy
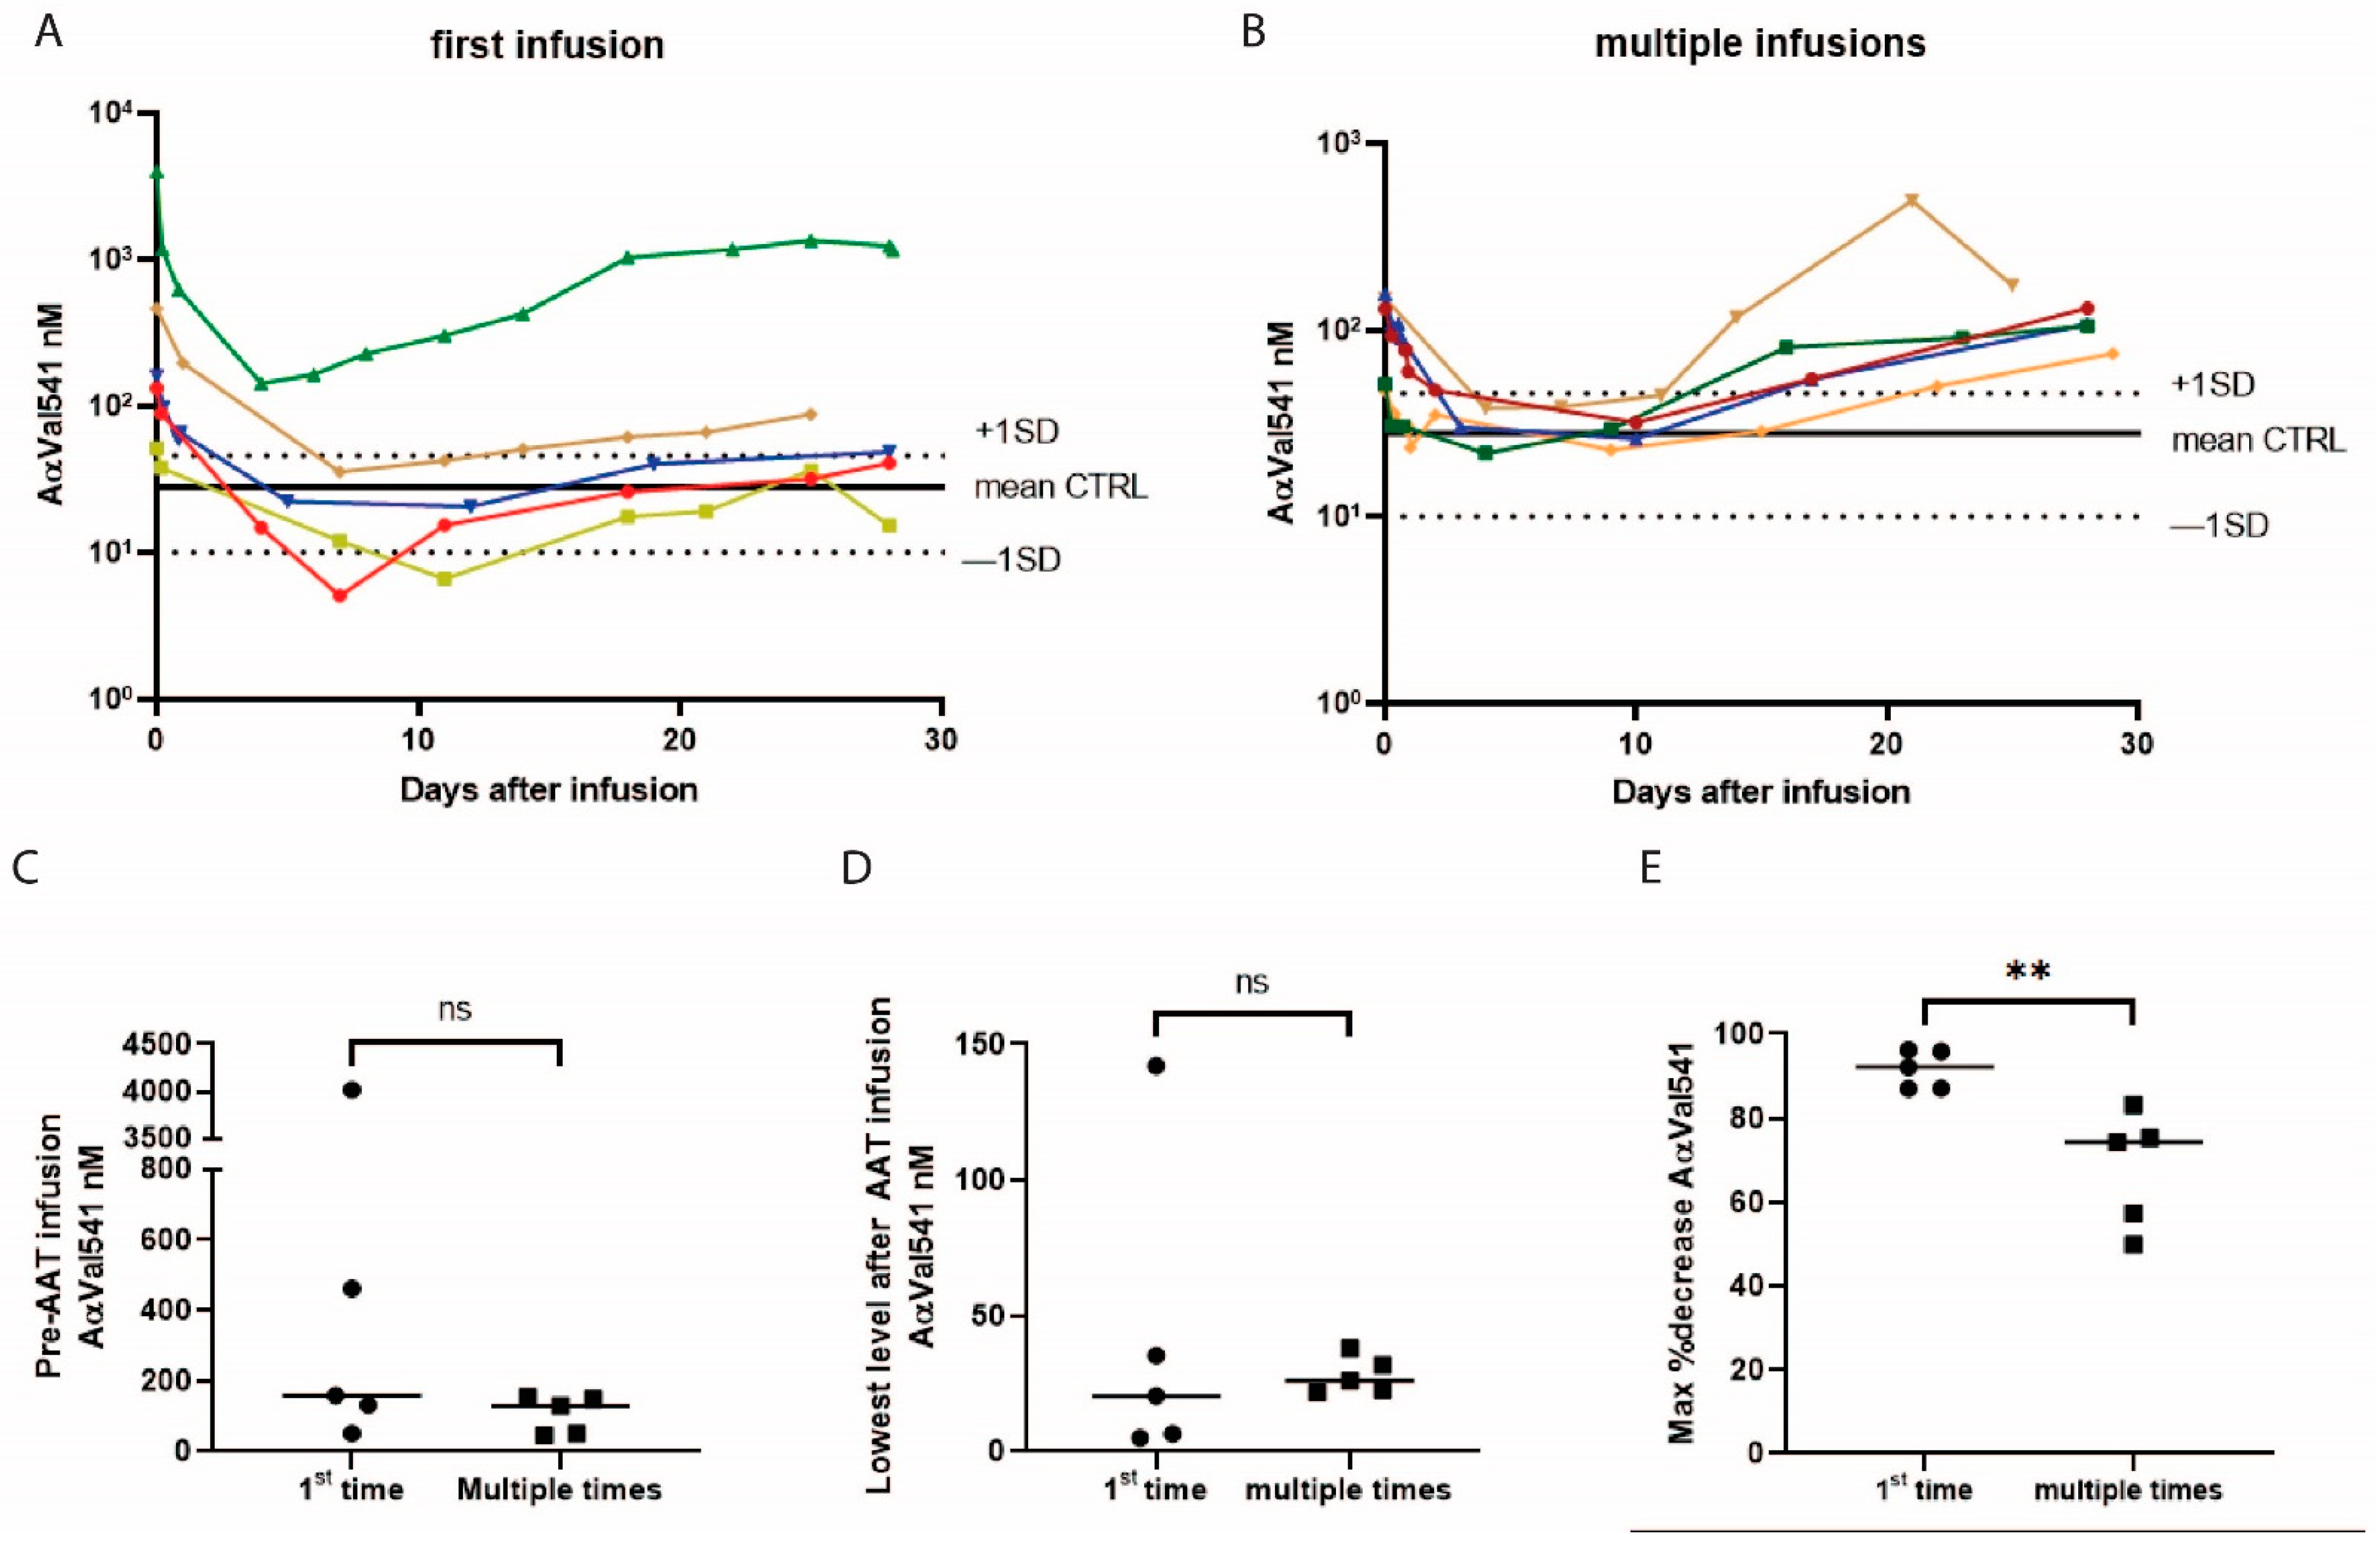
2.4. The Effect of AAT Infusion on AαVal541 Levels
2.5. Pharmacokinetic Modelling AAT after Single Infusion
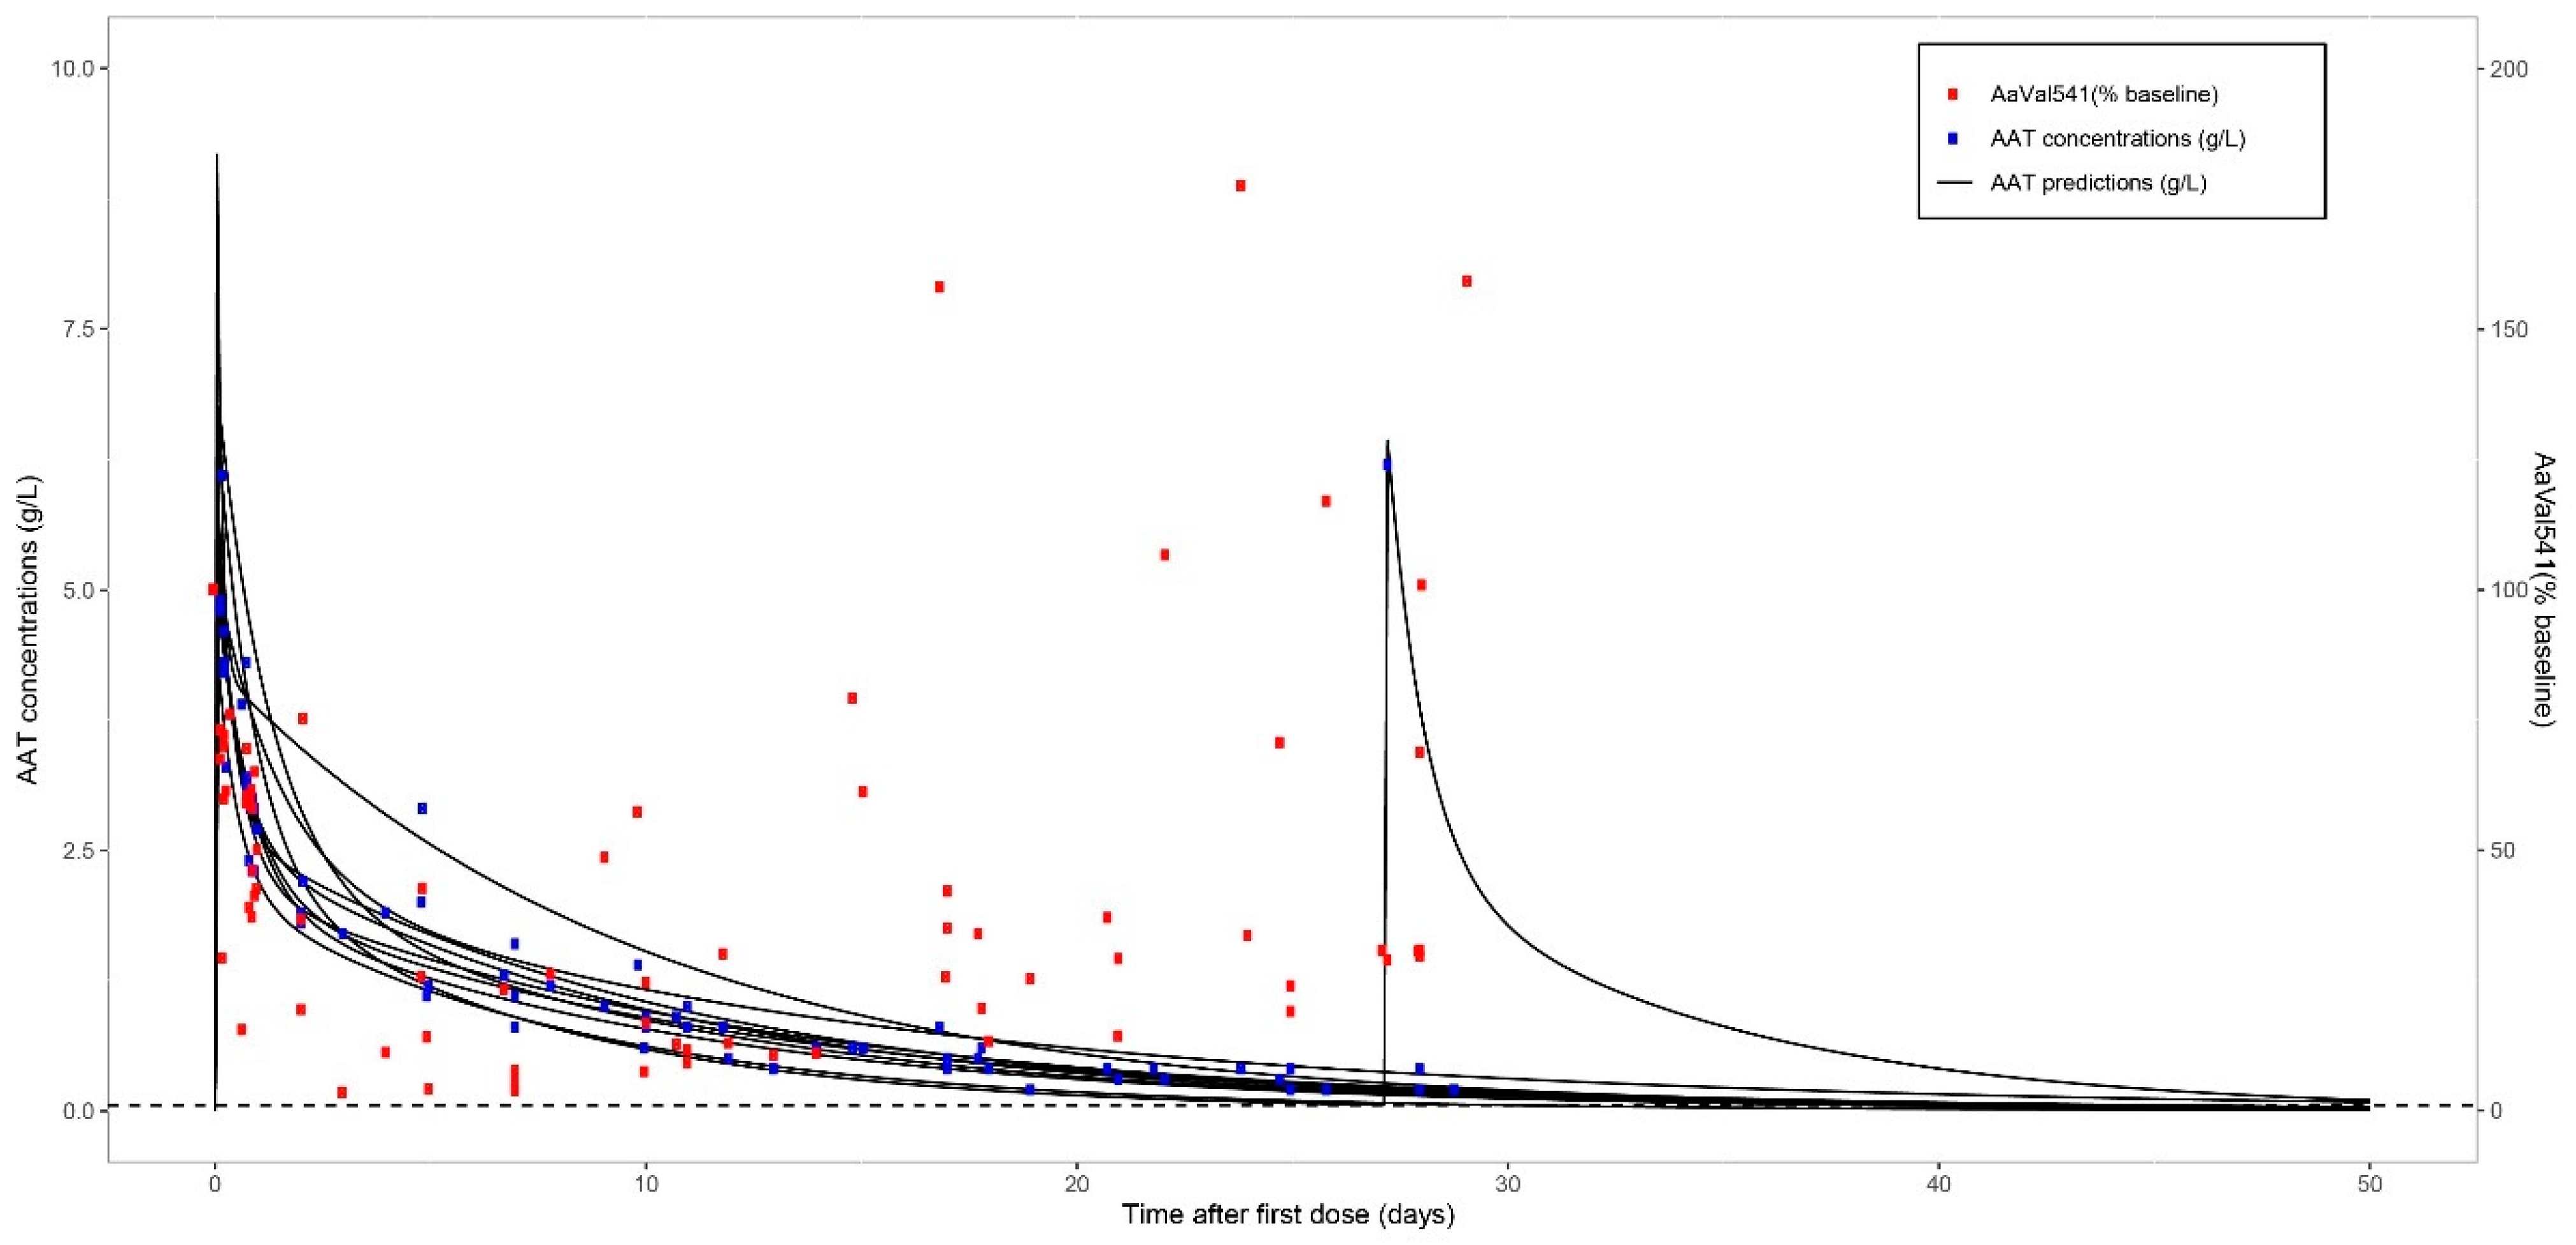
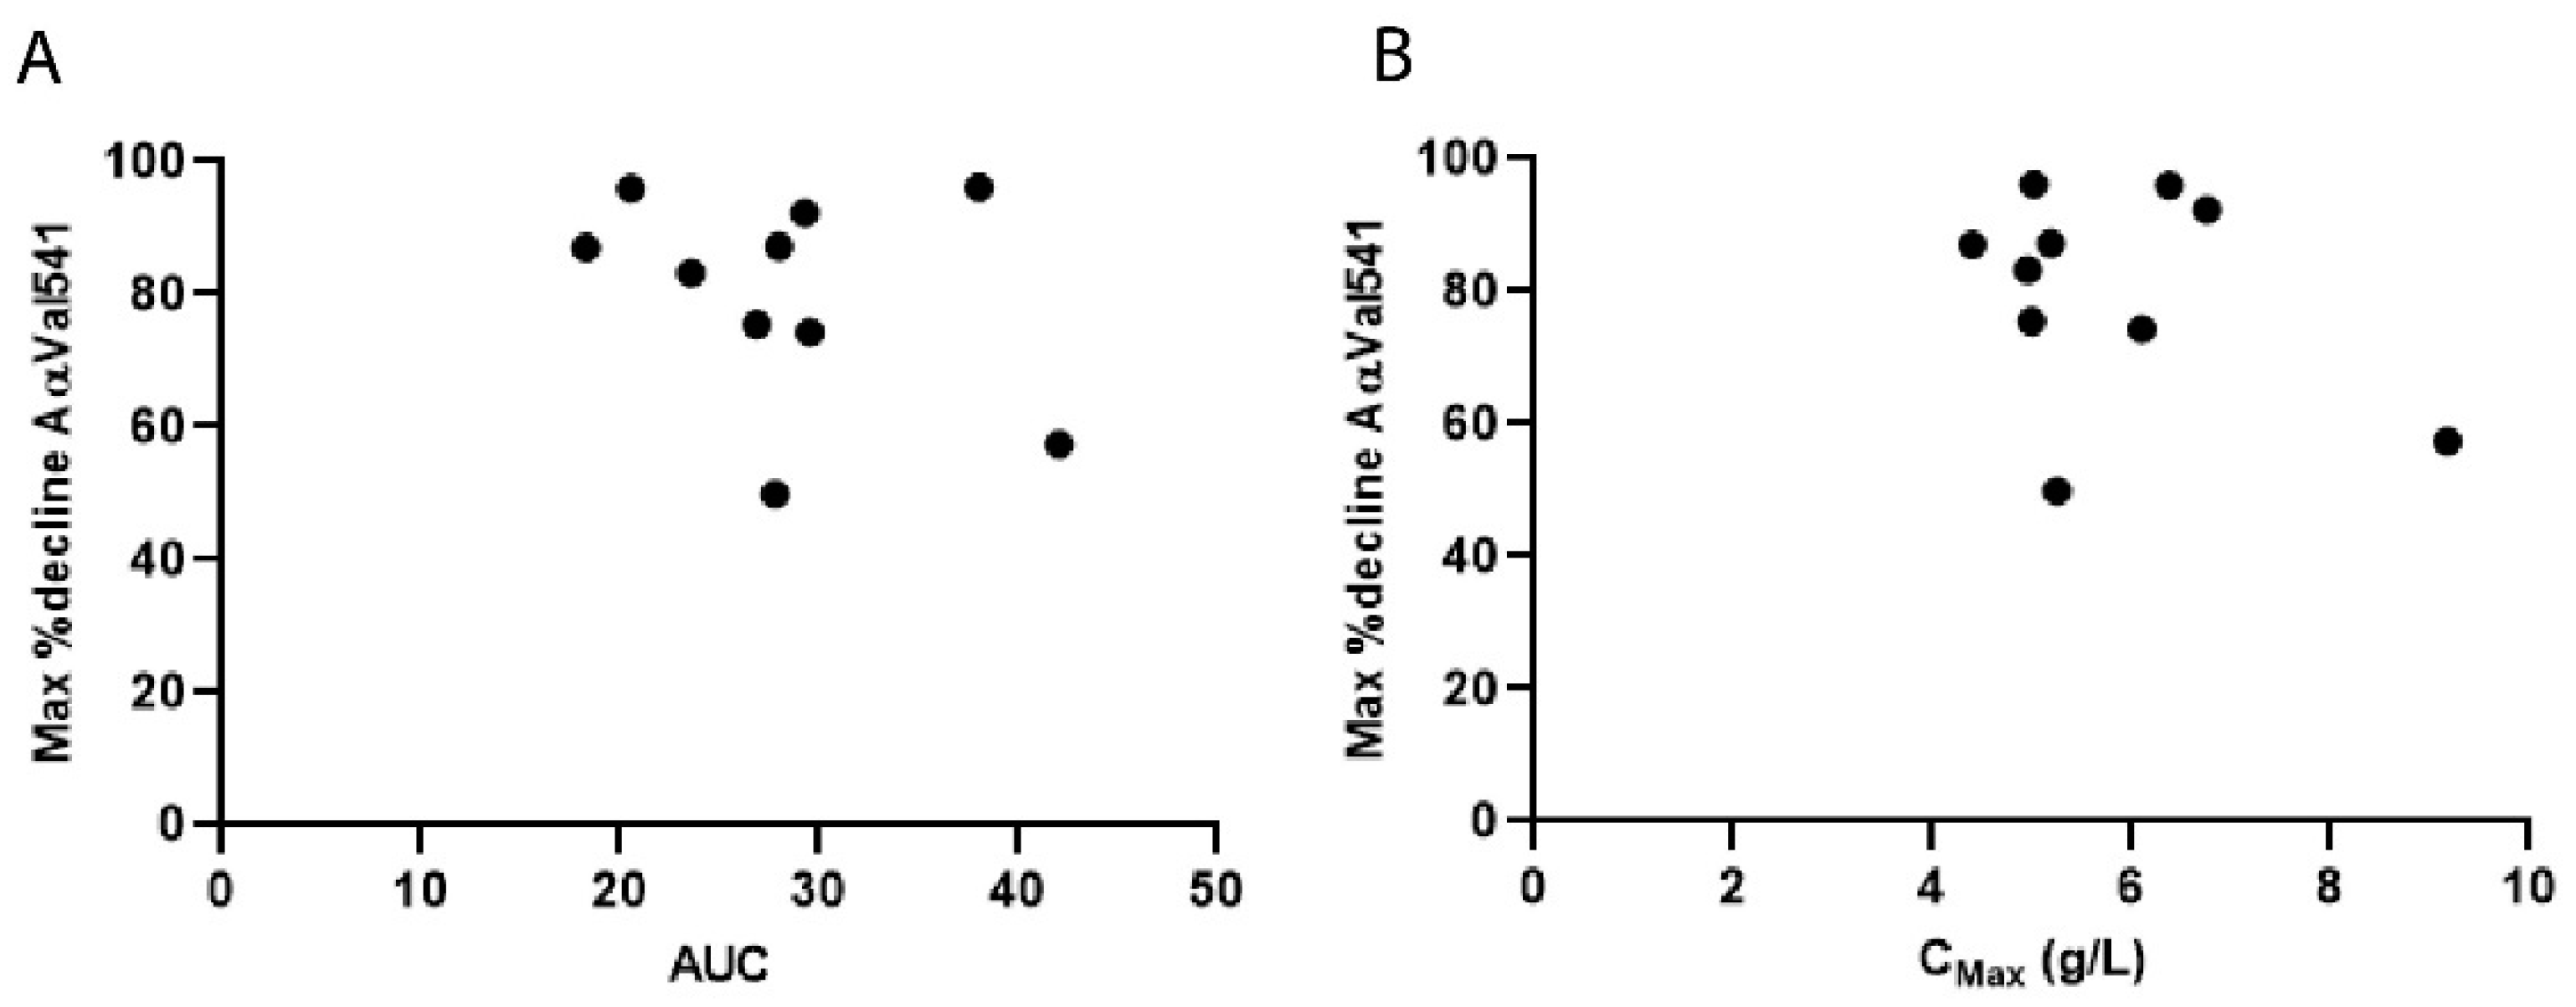
2.6. Pharmacokinetic Modelling of AAT and AαVal541 Levels
3. Discussion
4. Materials and Methods
4.1. Study Design and Subjects
4.2. Immunoassay AαVal541
4.3. Western Blot Method
4.4. AAT Levels
4.5. Pharmacokinetic Model Development and Model Validation
4.6. Statistical Analysis
5. Conclusions
Supplementary Materials
Author Contributions
Funding
Institutional Review Board Statement
Informed Consent Statement
Data Availability Statement
Acknowledgments
Conflicts of Interest
References
- American Thoracic Society/European Respiratory Society statement: Standards for the diagnosis and management of individuals with alpha-1 antitrypsin deficiency. Am. J. Respir. Crit. Care Med. 2003, 168, 818–900. [CrossRef]
- Takahashi, H.; Nukiwa, T.; Satoh, K.; Ogushi, F.; Brantly, M.; Fells, G.; Stier, L.; Courtney, M.; Crystal, R.G. Characterization of the gene and protein of the alpha 1-antitrypsin “deficiency” allele Mprocida. J. Biol. Chem. 1988, 263, 15528–15534. [Google Scholar] [CrossRef]
- Seixas, S.; Marques, P.I. Known Mutations at the Cause of Alpha-1 Antitrypsin Deficiency an Updated Overview of SERPINA1 Variation Spectrum. Appl. Clin. Genet. 2021, 14, 173–194. [Google Scholar] [CrossRef]
- Fregonese, L.; Stolk, J.; Frants, R.R.; Veldhuisen, B. Alpha-1 antitrypsin Null mutations and severity of emphysema. Respir. Med. 2008, 102, 876–884. [Google Scholar] [CrossRef] [Green Version]
- Gadek, J.E.; Fells, G.A.; Zimmerman, R.L.; Rennard, S.I.; Crystal, R.G. Antielastases of the human alveolar structures. Implications for the protease-antiprotease theory of emphysema. J. Clin. Investig. 1981, 68, 889–898. [Google Scholar] [CrossRef] [Green Version]
- Kao, R.C.; Wehner, N.G.; Skubitz, K.M.; Gray, B.H.; Hoidal, J.R. Proteinase 3. A distinct human polymorphonuclear leukocyte proteinase that produces emphysema in hamsters. J. Clin. Investig. 1988, 82, 1963–1973. [Google Scholar] [CrossRef] [PubMed]
- Sinden, N.J.; Stockley, R.A. Proteinase 3 activity in sputum from subjects with alpha-1-antitrypsin deficiency and COPD. Eur. Respir. J. 2013, 41, 1042–1050. [Google Scholar] [CrossRef] [Green Version]
- Gadek, J.E.; Klein, H.G.; Holland, P.V.; Crystal, R.G. Replacement therapy of alpha 1-antitrypsin deficiency. Reversal of protease-antiprotease imbalance within the alveolar structures of PiZ subjects. J. Clin. Investig. 1981, 68, 1158–1165. [Google Scholar] [CrossRef] [PubMed] [Green Version]
- Stockley, R.A.; Bayley, D.L.; Unsal, I.; Dowson, L.J. The effect of augmentation therapy on bronchial inflammation in alpha1-antitrypsin deficiency. Am. J. Respir. Crit. Care Med. 2002, 165, 1494–1498. [Google Scholar] [CrossRef] [PubMed]
- Campos, M.A.; Geraghty, P.; Holt, G.; Mendes, E.; Newby, P.R.; Ma, S.; Luna-Diaz, L.V.; Turino, G.M.; Stockley, R.A. The Biological Effects of Double-Dose Alpha-1 Antitrypsin Augmentation Therapy. A Pilot Clinical Trial. Am. J. Respir. Crit. Care Med. 2019, 200, 318–326. [Google Scholar] [CrossRef]
- Newby, P.R.; Crossley, D.; Crisford, H.; Stockley, J.A.; Mumford, R.A.; Carter, R.I.; Bolton, C.E.; Hopkinson, N.S.; Mahadeva, R.; Steiner, M.C.; et al. A specific proteinase 3 activity footprint in alpha1-antitrypsin deficiency. ERJ Open Res. 2019, 5. [Google Scholar] [CrossRef] [Green Version]
- Carter, R.I.; Mumford, R.A.; Treonze, K.M.; Finke, P.E.; Davies, P.; Si, Q.; Humes, J.L.; Dirksen, A.; Piitulainen, E.; Ahmad, A.; et al. The fibrinogen cleavage product Aalpha-Val360, a specific marker of neutrophil elastase activity in vivo. Thorax 2011, 66, 686–691. [Google Scholar] [CrossRef] [PubMed] [Green Version]
- Soy, D.; de la Roza, C.; Lara, B.; Esquinas, C.; Torres, A.; Miravitlles, M. Alpha-1-antitrypsin deficiency: Optimal therapeutic regimen based on population pharmacokinetics. Thorax 2006, 61, 1059–1064. [Google Scholar] [CrossRef] [Green Version]
- Tortorici, M.A.; Vit, O.; Bexon, M.; Sandhaus, R.; Burdon, J.; Piitulainen, E.; Seersholm, N.; Stocks, J.; McElvaney, N.G.; Chapman, K.R.; et al. Population pharmacokinetics of A1-PI in patients with Alpha-1 antitrypsin deficiency. Eur. Respir. J. 2015, 46, PA1486. [Google Scholar] [CrossRef]
- Campbell, E.J.; Campbell, M.A.; Boukedes, S.S.; Owen, C.A. Quantum proteolysis by neutrophils: Implications for pulmonary emphysema in alpha 1-antitrypsin deficiency. J. Clin. Investig. 1999, 104, 337–344. [Google Scholar] [CrossRef] [PubMed] [Green Version]
- Campbell, E.J.; Campbell, M.A.; Owen, C.A. Bioactive proteinase 3 on the cell surface of human neutrophils: Quantification, catalytic activity, and susceptibility to inhibition. J. Immunol. 2000, 165, 3366–3374. [Google Scholar] [CrossRef] [Green Version]
- Baslund, B.; Szpirt, W.; Eriksson, S.; Elzouki, A.N.; Wiik, A.; Wieslander, J.; Petersen, J. Complexes between proteinase 3, alpha 1-antitrypsin and proteinase 3 anti-neutrophil cytoplasm autoantibodies: A comparison between alpha 1-antitrypsin PiZ allele carriers and non-carriers with Wegener’s granulomatosis. Eur. J. Clin. Investig. 1996, 26, 786–792. [Google Scholar] [CrossRef]
- Chapman, K.R.; Stockley, R.A.; Dawkins, C.; Wilkes, M.M.; Navickis, R.J. Augmentation therapy for alpha1 antitrypsin deficiency: A meta-analysis. COPD J. Chronic Obstr. Pulm. Dis. 2009, 6, 177–184. [Google Scholar] [CrossRef]
- Chapman, K.R.; Burdon, J.G.; Piitulainen, E.; Sandhaus, R.A.; Seersholm, N.; Stocks, J.M.; Stoel, B.C.; Huang, L.; Yao, Z.; Edelman, J.M.; et al. Intravenous augmentation treatment and lung density in severe alpha1 antitrypsin deficiency (RAPID): A randomised, double-blind, placebo-controlled trial. Lancet 2015, 386, 360–368. [Google Scholar] [CrossRef]
- McElvaney, N.G.; Burdon, J.; Holmes, M.; Glanville, A.; Wark, P.A.; Thompson, P.J.; Hernandez, P.; Chlumsky, J.; Teschler, H.; Ficker, J.H.; et al. Long-term efficacy and safety of alpha1 proteinase inhibitor treatment for emphysema caused by severe alpha1 antitrypsin deficiency: An open-label extension trial (RAPID-OLE). Lancet Respir. Med. 2017, 5, 51–60. [Google Scholar] [CrossRef]
- Graham, B.L.; Steenbruggen, I.; Miller, M.R.; Barjaktarevic, I.Z.; Cooper, B.G.; Hall, G.L.; Hallstrand, T.S.; Kaminsky, D.A.; McCarthy, K.; McCormack, M.C.; et al. Standardization of Spirometry 2019 Update. An Official American Thoracic Society and European Respiratory Society Technical Statement. Am. J. Respir. Crit. Care Med. 2019, 200, e70–e88. [Google Scholar] [CrossRef]
- Graham, B.L.; Brusasco, V.; Burgos, F.; Cooper, B.G.; Jensen, R.; Kendrick, A.; MacIntyre, N.R.; Thompson, B.R.; Wanger, J. 2017 ERS/ATS standards for single-breath carbon monoxide uptake in the lung. Eur. Respir. J. 2017, 49, 1600016. [Google Scholar] [CrossRef] [Green Version]
- Holland, A.E.; Spruit, M.A.; Troosters, T.; Puhan, M.A.; Pepin, V.; Saey, D.; McCormack, M.C.; Carlin, B.W.; Sciurba, F.C.; Pitta, F.; et al. An official European Respiratory Society/American Thoracic Society technical standard: Field walking tests in chronic respiratory disease. Eur. Respir. J. 2014, 44, 1428–1446. [Google Scholar] [CrossRef] [PubMed]
- GraphPad Prism Version 8 for Windows; GraphPad Software: San Diego, CA, USA, 2012.
- Image Lab Software for Windows, Version 6.1; Bio-Rad: Hercules, CA, USA.
- Beal, S.; Sheiner, L.B.; Boeckmann, A. NONMEM user’s guides (1989–2006). Ellicott City ICON Dev. Solut. 2006. [Google Scholar]
- Jonsson, E.N.; Karlsson, M.O. Xpose—An S-PLUS based population pharmacokinetic/pharmacodynamic model building aid for NONMEM. Comput. Methods Programs Biomed. 1999, 58, 51–64. [Google Scholar] [CrossRef]
- Lindbom, L.; Pihlgren, P.; Jonsson, E.N. PsN-Toolkit—A collection of computer intensive statistical methods for non-linear mixed effect modeling using NONMEM. Comput. Methods Programs Biomed. 2005, 79, 241–257. [Google Scholar] [CrossRef] [PubMed]
- Keizer, R.J.; van Benten, M.; Beijnen, J.H.; Schellens, J.H.; Huitema, A.D. Piraña and PCluster: A modeling environment and cluster infrastructure for NONMEM. Comput. Methods Programs Biomed. 2011, 101, 72–79. [Google Scholar] [CrossRef] [PubMed]
- R Development Core Team. R: A Language and Environment for Statistical Computing; R Foundation for Statistical Computing: Vienna, Austria, 2013. [Google Scholar]
- IBM SPSS Statistics for Windows, Version 25.0; IBM Corp.: Armonk, NY, USA, 2020.

| AATD | Healthy Controls | |
|---|---|---|
| Subjects | 10 | 20 |
| Age (median, IQR) | 57.5 (52.5–63.3) | 54 (47–60.5) |
| Gender (%) | ||
| Female | 7 (70%) | 13 (65%) |
| Male | 3 (30%) | 7 (35%) |
| Ex-smokers (%) | 6 (60%) | Unknown |
| Current smokers (%) | 0 (0%) | 0 (0%) |
| Genotype (%) | ||
| Z/Q0Bellingham | 2 (20%) | |
| Z/Q0Amersfoort | 1 (10%) | |
| Z/MProcida | 2 (20%) | |
| Z/MHeerlen | 2 (20%) | |
| Q0Amersfoort/MHeerlen | 2 (20%) | |
| MHeerlen/MHeerlen | 1 (10%) | |
| Post bronchodilator FEV1 in L | 1.6 (1.2–2.4) | |
| Post bronchodilator FEV1 in %predicted | 54.5 (41.3–78.8) | |
| FEV1/FVC-ratio % | 49.8 (35.2–69.3) | |
| KCO %predicted | 66 (36.8–71.3) | |
| 6 min walking test in meters | 484 (392.3–525.5) |
| Parameter | Value |
|---|---|
| CL (L/day) | 0.605 |
| Vcentral (L) | 3.14 |
| Q (L/day) | 2.11 |
| Vperipheral (L) | 3.09 |
| Inter-individual variability CL (CV%) | 23.4 |
| Inter-individual variability Vcentral (CV%) | 42.4 |
| Inter-individual variability Q (CV%) | 118.4 |
| Patient | AUC0-inf | Cav (g/L) | Cmax (g/L) | Max Decrease AαVal541 (% of Baseline) | x-Time Infusion | Age (years) | Weight (kg) |
|---|---|---|---|---|---|---|---|
| 1 | 38.0 | 1.6 | 5.0 | 96.2 | 1st | 57 | 72.9 |
| 2 | 28.0 | 1.2 | 5.2 | 87.2 | 1st | 58 | 52.1 |
| 3 | 20.5 | 0.9 | 6.4 | 95.9 | 1st | 53 | 81.9 |
| 4 | 27.8 | 1.2 | 5.3 | 49.9 | 5th | 55 | 75.6 |
| 5 | 18.3 | 0.8 | 4.4 | 87.1 | 1st | 51 | 65.5 |
| 6 | 29.3 | 1.2 | 6.8 | 92.3 | 1st | 50 | 79.8 |
| 7 | 26.9 | 1.1 | 5.0 | 75.4 | 4th | 63 | 58.0 |
| 8 | 42.1 | 1.8 | 9.2 | 57.3 | 2nd | 65 | 92.0 |
| 9 | 29.6 | 1.2 | 6.1 | 74.3 | 4th | 64 | 69.2 |
| 10 | 23.6 | 1.0 | 5.0 | 83.2 | 4th | 59 | 59.0 |
Publisher’s Note: MDPI stays neutral with regard to jurisdictional claims in published maps and institutional affiliations. |
© 2021 by the authors. Licensee MDPI, Basel, Switzerland. This article is an open access article distributed under the terms and conditions of the Creative Commons Attribution (CC BY) license (https://creativecommons.org/licenses/by/4.0/).
Share and Cite
Schouten, I.G.M.; Mumford, R.A.; Moes, D.J.A.R.; Hiemstra, P.S.; Stolk, J. The Course of AαVal541 as a Proteinase 3 Specific Neo-Epitope after Alpha-1-Antitrypsin Augmentation in Severe Deficient Patients. Int. J. Mol. Sci. 2021, 22, 8031. https://doi.org/10.3390/ijms22158031
Schouten IGM, Mumford RA, Moes DJAR, Hiemstra PS, Stolk J. The Course of AαVal541 as a Proteinase 3 Specific Neo-Epitope after Alpha-1-Antitrypsin Augmentation in Severe Deficient Patients. International Journal of Molecular Sciences. 2021; 22(15):8031. https://doi.org/10.3390/ijms22158031
Chicago/Turabian StyleSchouten, Iris G. M., Richard A. Mumford, Dirk Jan A. R. Moes, Pieter S. Hiemstra, and Jan Stolk. 2021. "The Course of AαVal541 as a Proteinase 3 Specific Neo-Epitope after Alpha-1-Antitrypsin Augmentation in Severe Deficient Patients" International Journal of Molecular Sciences 22, no. 15: 8031. https://doi.org/10.3390/ijms22158031
APA StyleSchouten, I. G. M., Mumford, R. A., Moes, D. J. A. R., Hiemstra, P. S., & Stolk, J. (2021). The Course of AαVal541 as a Proteinase 3 Specific Neo-Epitope after Alpha-1-Antitrypsin Augmentation in Severe Deficient Patients. International Journal of Molecular Sciences, 22(15), 8031. https://doi.org/10.3390/ijms22158031