Article

Fibroblast Growth Factor 21 Response in a Preclinical Alcohol Model of Acute-on-Chronic Liver Injury

1
Department of Medicine II, Saarland University Medical Center, Saarland University, 66421 Homburg, Germany
2
Department of Medicine III, Saarland University Medical Center, Saarland University, 66421 Homburg, Germany
3
Department of Pharmacology and Toxicology, Saarland University Medical Center, Saarland University, 66421 Homburg, Germany
4
Institute of Clinical Chemistry and Clinical Pharmacology, University Hospital Bonn, 53127 Bonn, Germany
5
Hannover Health Sciences Campus, Hannover Medical School (MHH), 30625 Hannover, Germany
*
Author to whom correspondence should be addressed.
Authors contributed equally to this manuscript.
Int. J. Mol. Sci. 2021, 22(15), 7898; https://doi.org/10.3390/ijms22157898
Submission received: 14 May 2021 / Revised: 15 July 2021 / Accepted: 16 July 2021 / Published: 23 July 2021
(This article belongs to the Section Biochemistry)

Abstract

:
Background and Aims: Fibroblast growth factor (FGF) 21 has recently been shown to play a potential role in bile acid metabolism. We aimed to investigate the FGF21 response in an ethanol-induced acute-on-chronic liver injury (ACLI) model in Abcb4−/− mice with deficiency of the hepatobiliary phospholipid transporter. Methods: Total RNA was extracted from wild-type (WT, C57BL/6J) and Abcb4/ (KO) mice, which were either fed a control diet (WT-Cont and KO-Cont groups; n = 28/group) or ethanol diet, followed by an acute ethanol binge (WT-EtOH and KO-EtOH groups; n = 28/group). A total of 58 human subjects were recruited into the study, including patients with alcohol-associated liver disease (AALD; n = 31) and healthy controls (n = 27). The hepatic and ileal expressions of genes involved in bile acid metabolism, plasma FGF levels, and bile acid and its precursors 7α- and 27-hydroxycholesterol (7α- and 27-OHC) concentrations were determined. Primary mouse hepatocytes were isolated for cell culture experiments. Results: Alcohol feeding significantly induced plasma FGF21 and decreased hepatic Cyp7a1 levels. Hepatic expression levels of Fibroblast growth factor receptor 1 (Fgfr1), Fgfr4, Farnesoid X-activated receptor (Fxr), and Small heterodimer partner (Shp) and plasma FGF15/FGF19 levels did not differ with alcohol challenge. Exogenous FGF21 treatment suppressed Cyp7a1 in a dose-dependent manner in vitro. AALD patients showed markedly higher FGF21 and lower 7α-OHC plasma levels while FGF19 did not differ. Conclusions: The simultaneous upregulation of FGF21 and downregulation of Cyp7a1 expressions upon chronic plus binge alcohol feeding together with the invariant plasma FGF15 and hepatic Shp and Fxr levels suggest the presence of a direct regulatory mechanism of FGF21 on bile acid homeostasis through inhibition of CYP7A1 by an FGF15-independent pathway in this ACLI model. Lay Summary: Alcohol challenge results in the upregulation of FGF21 and repression of Cyp7a1 expressions while circulating FGF15 and hepatic Shp and Fxr levels remain constant both in healthy and pre-injured livers, suggesting the presence of an alternative FGF15-independent regulatory mechanism of FGF21 on bile acid homeostasis through the inhibition of Cyp7a1.

1. Introduction

Excessive alcohol consumption is associated with serious adverse effects in the liver, causing alcohol-associated liver disease (AALD) with a wide pathobiological and histopathological spectrum ranging from fat accumulation in hepatocytes to hepatocellular carcinoma (HCC) [1]. In the setting of such chronic liver diseases, an acute hepatic insult may have devastating effects on liver pathophysiology as in the case of acute-on-chronic liver injury (ACLI) [2] or acute-on-chronic liver failure (ACLF), which leads to multi-organ and -system failure, and high short-term mortality [3]. Various animal models have been established so far to mimic human AALD, among which murine models are the most preferred ones in experiments for a variety of reasons, including the ease of maintenance, cost effectiveness, as well as short reproductive cycle and lifespan [4,5]. Murine models fed ad libitum the Lieber-DeCarli (LDC) liquid diet [6], which is the most commonly used alcohol-containing liquid diet, presented with elevated serum aminotransferase activities and hepatic steatosis with mild inflammation but no fibrosis [7]. However, with the modification of the LDC diet model such as chronic-plus-binge alcohol feeding, i.e., the NIAAA model of the National Institute on Alcohol Abuse and Alcoholism (NIAAA) (Gao-binge model), higher aminotransferase levels, liver inflammation and steatosis, and even hepatic neutrophil infiltration mimicking the human condition could be established [8,9].
For better understanding of alcohol-induced acute inflammatory responses in chronically injured liver, we recently modeled alcohol-associated ACLI based on the chronic plus binge ethanol feeding model [8] in ATP binding cassette subfamily B member 4 knock out (Abcb4−/−) mice, which resulted in exacerbated hepatic steatosis, liver injury, and inflammation [2]. Abcb4 encodes the ATP-dependent phosphatidylcholine (PC) translocating protein (ABCB4) that flops PC from the inner to the outer leaflet of the hepatocanalicular membrane. ABCB4 deficiency induces chronic liver inflammation and progressive hepatic fibrosis in Abcb4/ mice [10,11]. In our novel preclinical ACLI mouse model that mimics ACLF, exacerbated hepatic steatosis, liver injury, and inflammation have been documented, which serves to dissect liver-specific pathomechanisms [2]. One of these mechanisms in liver includes the response of fibroblast growth factor 21 (FGF21), a member of the endocrine subfamily of FGFs with a pivotal role in the regulation of metabolism. FGF21 has previously been suggested as a predictor for diagnosis and prognosis of ACLF in critically ill patients [12].
Several studies have suggested FGF21 as an emerging regulator of the preference for alcohol in rodents and humans, which shows markedly increased expression levels following acute and chronic alcohol consumption [13,14,15,16,17]. This induction of FGF21 expression in the liver, where it is mainly expressed, was proposed to be hepatoprotective when liver homeostasis is challenged by various stimuli, as in the case of alcohol [15,18,19,20]. Recently, a previously unidentified additional role of FGF21 as a negative regulator of bile acid synthesis has been described [21,22].
Bile acids are essential to facilitate digestion and absorption of dietary fats, steroids, and lipid-soluble vitamins in the small intestine and act as signaling molecules for lipid and glucose metabolism in the liver [23,24,25]. Several studies have indicated altered hepatic bile acid synthesis and accumulation as a potential major pathophysiological trigger for the induction of the structural and functional hepatocellular changes in both alcohol-associated steatohepatitis and metabolic dysfunction-associated fatty liver disease [26,27,28]. Thus, the bile acid feedback loop, the molecular mechanisms of which have been studied for many years, plays an essential role in protecting against liver damage. Among several cytochrome P450 (CYP) hydroxylase enzymes involved in bile acid synthesis, cholesterol 7α-hydroxylase (CYP7A1), encoded by the cholesterol 7α-hydroxylase (CYP7A1) gene, is the critical rate-limiting enzyme in the classic bile acid synthesis pathway for the conversion of cholesterol into 7α-OHC [29]. Although controversial results have been shown for the effects of alcohol on Cyp7a1 gene expression levels [26,30], alcohol-induced inhibition of Cyp7a1 expression has been recently suggested to contribute to the protection against alcohol-associated steatohepatitis [31]. Despite the evidence of a hepatoprotective role of both FGF21 and CYP7A1 in alcohol-associated liver disease, the interacting mechanism of these two key regulators is a new area that remains to be clarified not only during alcohol consumption itself but also in the frame of different alcohol drinking patterns.
The primary mechanisms suggested for the inhibition of bile acid synthesis are the induction of intestine farnesoid X receptor/fibroblast growth factor 19 (FXR/FGF19) and the activation of the farnesoid X receptor/small heterodimer partner (FXR/SHP) axis in liver by elevated bile acid levels, which results in the inhibition of Cyp7a1 transcription [32,33]. This repression is due to elevated bile acid concentrations in the ileum activating FXR, which induces the secretion of the enterokine FGF19 (FGF19; FGF15 in mice) into the portal circulation and the consequential stimulation of fibroblast growth factor receptor 4 (FGFR4)/β-Klotho (KLB) complex in the hepatocyte membrane [32,34]. As though it was initially hypothesized that FGF21 antagonizes this action by inhibiting the FGF15/19-mediated suppression of Cyp7a1 expression [22], a recent study indicated that FGF21 has a novel role in bile acid metabolism, acting as a negative regulator of bile acid synthesis independent of the FXR/FGF15 pathway [21].
Therefore, in view of these initial data and accumulating evidence, we aimed to investigate the impact of chronic plus binge alcohol-induced FGF21 on bile acid metabolism in our recently established ACLI mouse model with pre-existing chronic cholestatic liver injury. For the clinical validation of our findings from animal studies, we also examined the effect of alcohol intake on FGF19, FGF21, and bile acid metabolism in patients with alcohol-associated liver cirrhosis and healthy subjects as a control group. To better understand the bile acid mechanism in our ACLI model, bile acid compositions were evaluated in both murine and human plasma samples. Bile acid compositions were determined in both murine and human plasma samples to better understand the bile acid metabolism in our ACLI model.

2. Results

2.1. ACLI Model

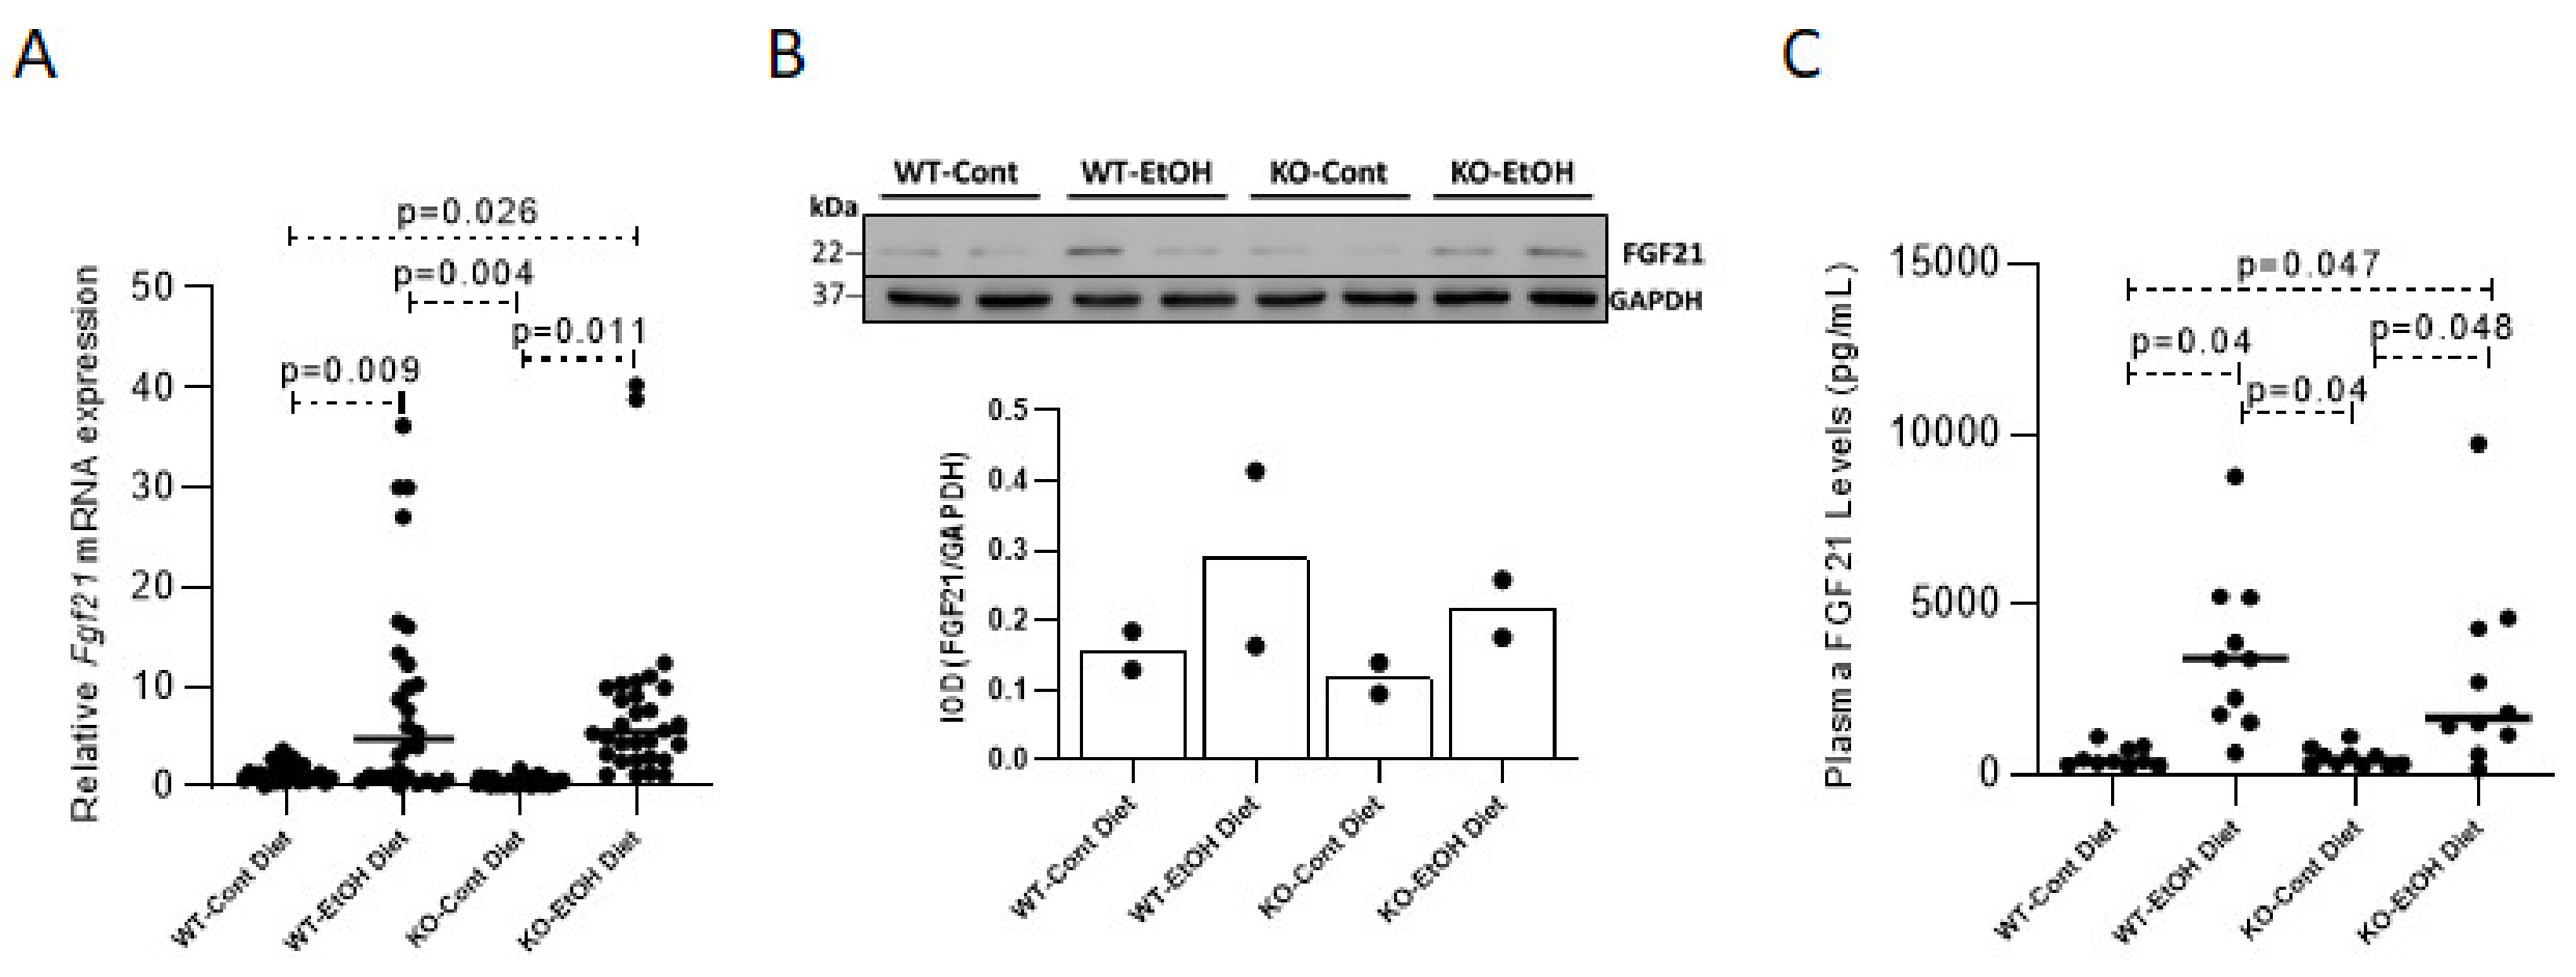
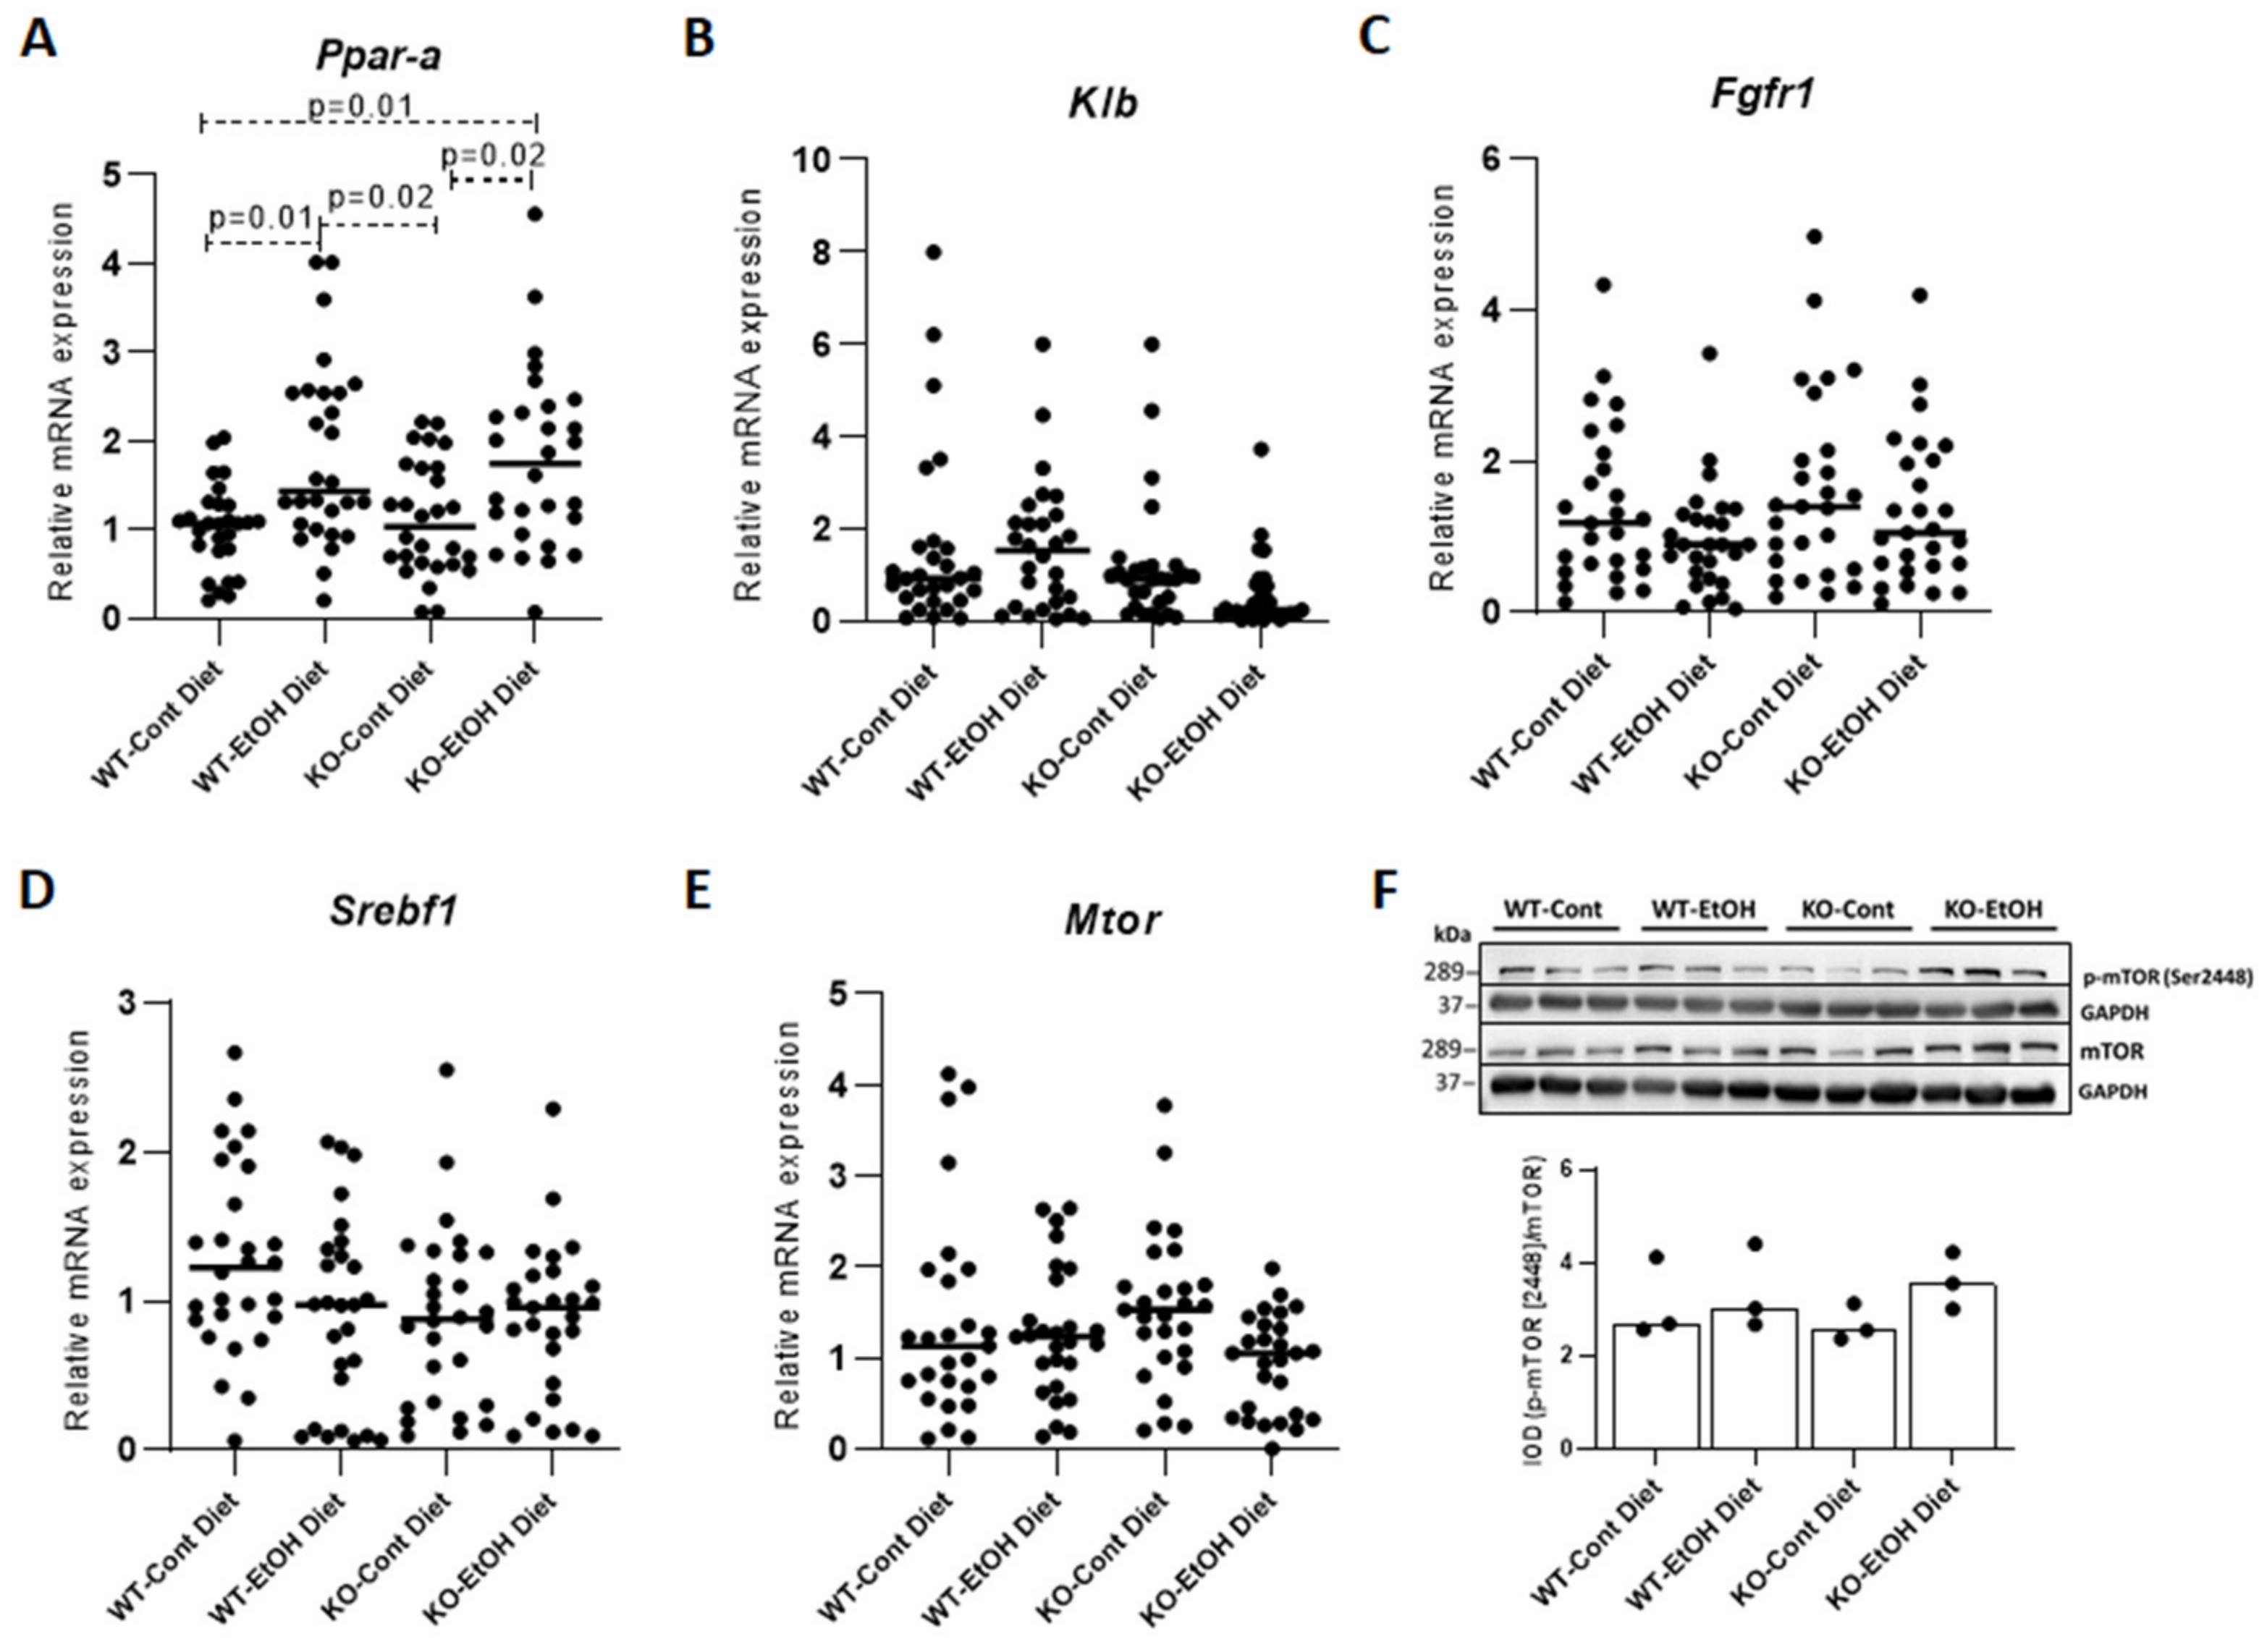
2.1.1. Effect of Ethanol Consumption on FGF21

Ethanol exposure significantly upregulated the hepatic Fgf21 gene expression in both WT and KO mice (p = 0.009 and 0.011, respectively), as compared to their normal diet-fed controls, showing no difference between the two genotypes (Figure 1A). Hepatic protein levels confirmed the upregulation of FGF21 in randomly chosen EtOH-challenged mice (Figure 1B). Consequently, a significant elevation of FGF21 concentrations in plasma samples of EtOH-challenged WT and KO mice (p = 0.040 and 0.048, respectively) was ascertained, consistent with the existing literature reporting that hepatic expression confers the major part of circulating FGF21 (Figure 1C) [35]. No difference in relative FGF21 expression in the WT-EtOH group was observed as compared to KO-EtOH mice (WT-EtOH/WT-Cont compared to KO-EtOH/KO-Cont).
To investigate the effect of alcohol on FGF21 signaling pathways, hepatic mRNA levels of the Ppar-a (FGF21 upstream mediator PPARα [36]), Mtor (downstream mediator mTOR [37]), and Srebf1/Srebp1c genes (transcription regulator SREBP1) were evaluated. Hepatic Ppar-a expression levels showed significant upregulation after the EtOH challenge in both WT and KO mice (p = 0.01 and 0.02, respectively), with no difference between genotypes (Figure 2A). No effects of alcohol challenge on hepatic mRNA levels of Fgfr1, which represents the preferred receptor of FGF21, were observed, while the down-regulation of its obligate co-receptor β-klotho (Klb) did not reach statistical significance (Figure 2B,C). In addition, no differences were observed for hepatic mRNA expression of Srebf1/Srebp1c and Mtor between groups (Figure 2D,E). Western blots to investigate mRNA/protein correlations and the activity of mTOR after post-translational modifications in mouse livers, further confirmed the relative hepatic mRNA quantification results (Figure 2F), with no statistically significant differences between groups in ratios of p-mTOR (Ser2448) to total mTOR. These results confirm the effect of alcohol on FGF21 upregulation and also suggest that PPARα, but not the transcription factor SREBP1, may have a direct impact on FGF21 upregulation. Moreover, our results indicate that the downstream signal transduction of FGF21 is possibly not mediated through the mTOR pathway, which was previously reported to play a potential role in the FGF21 signaling network [37].

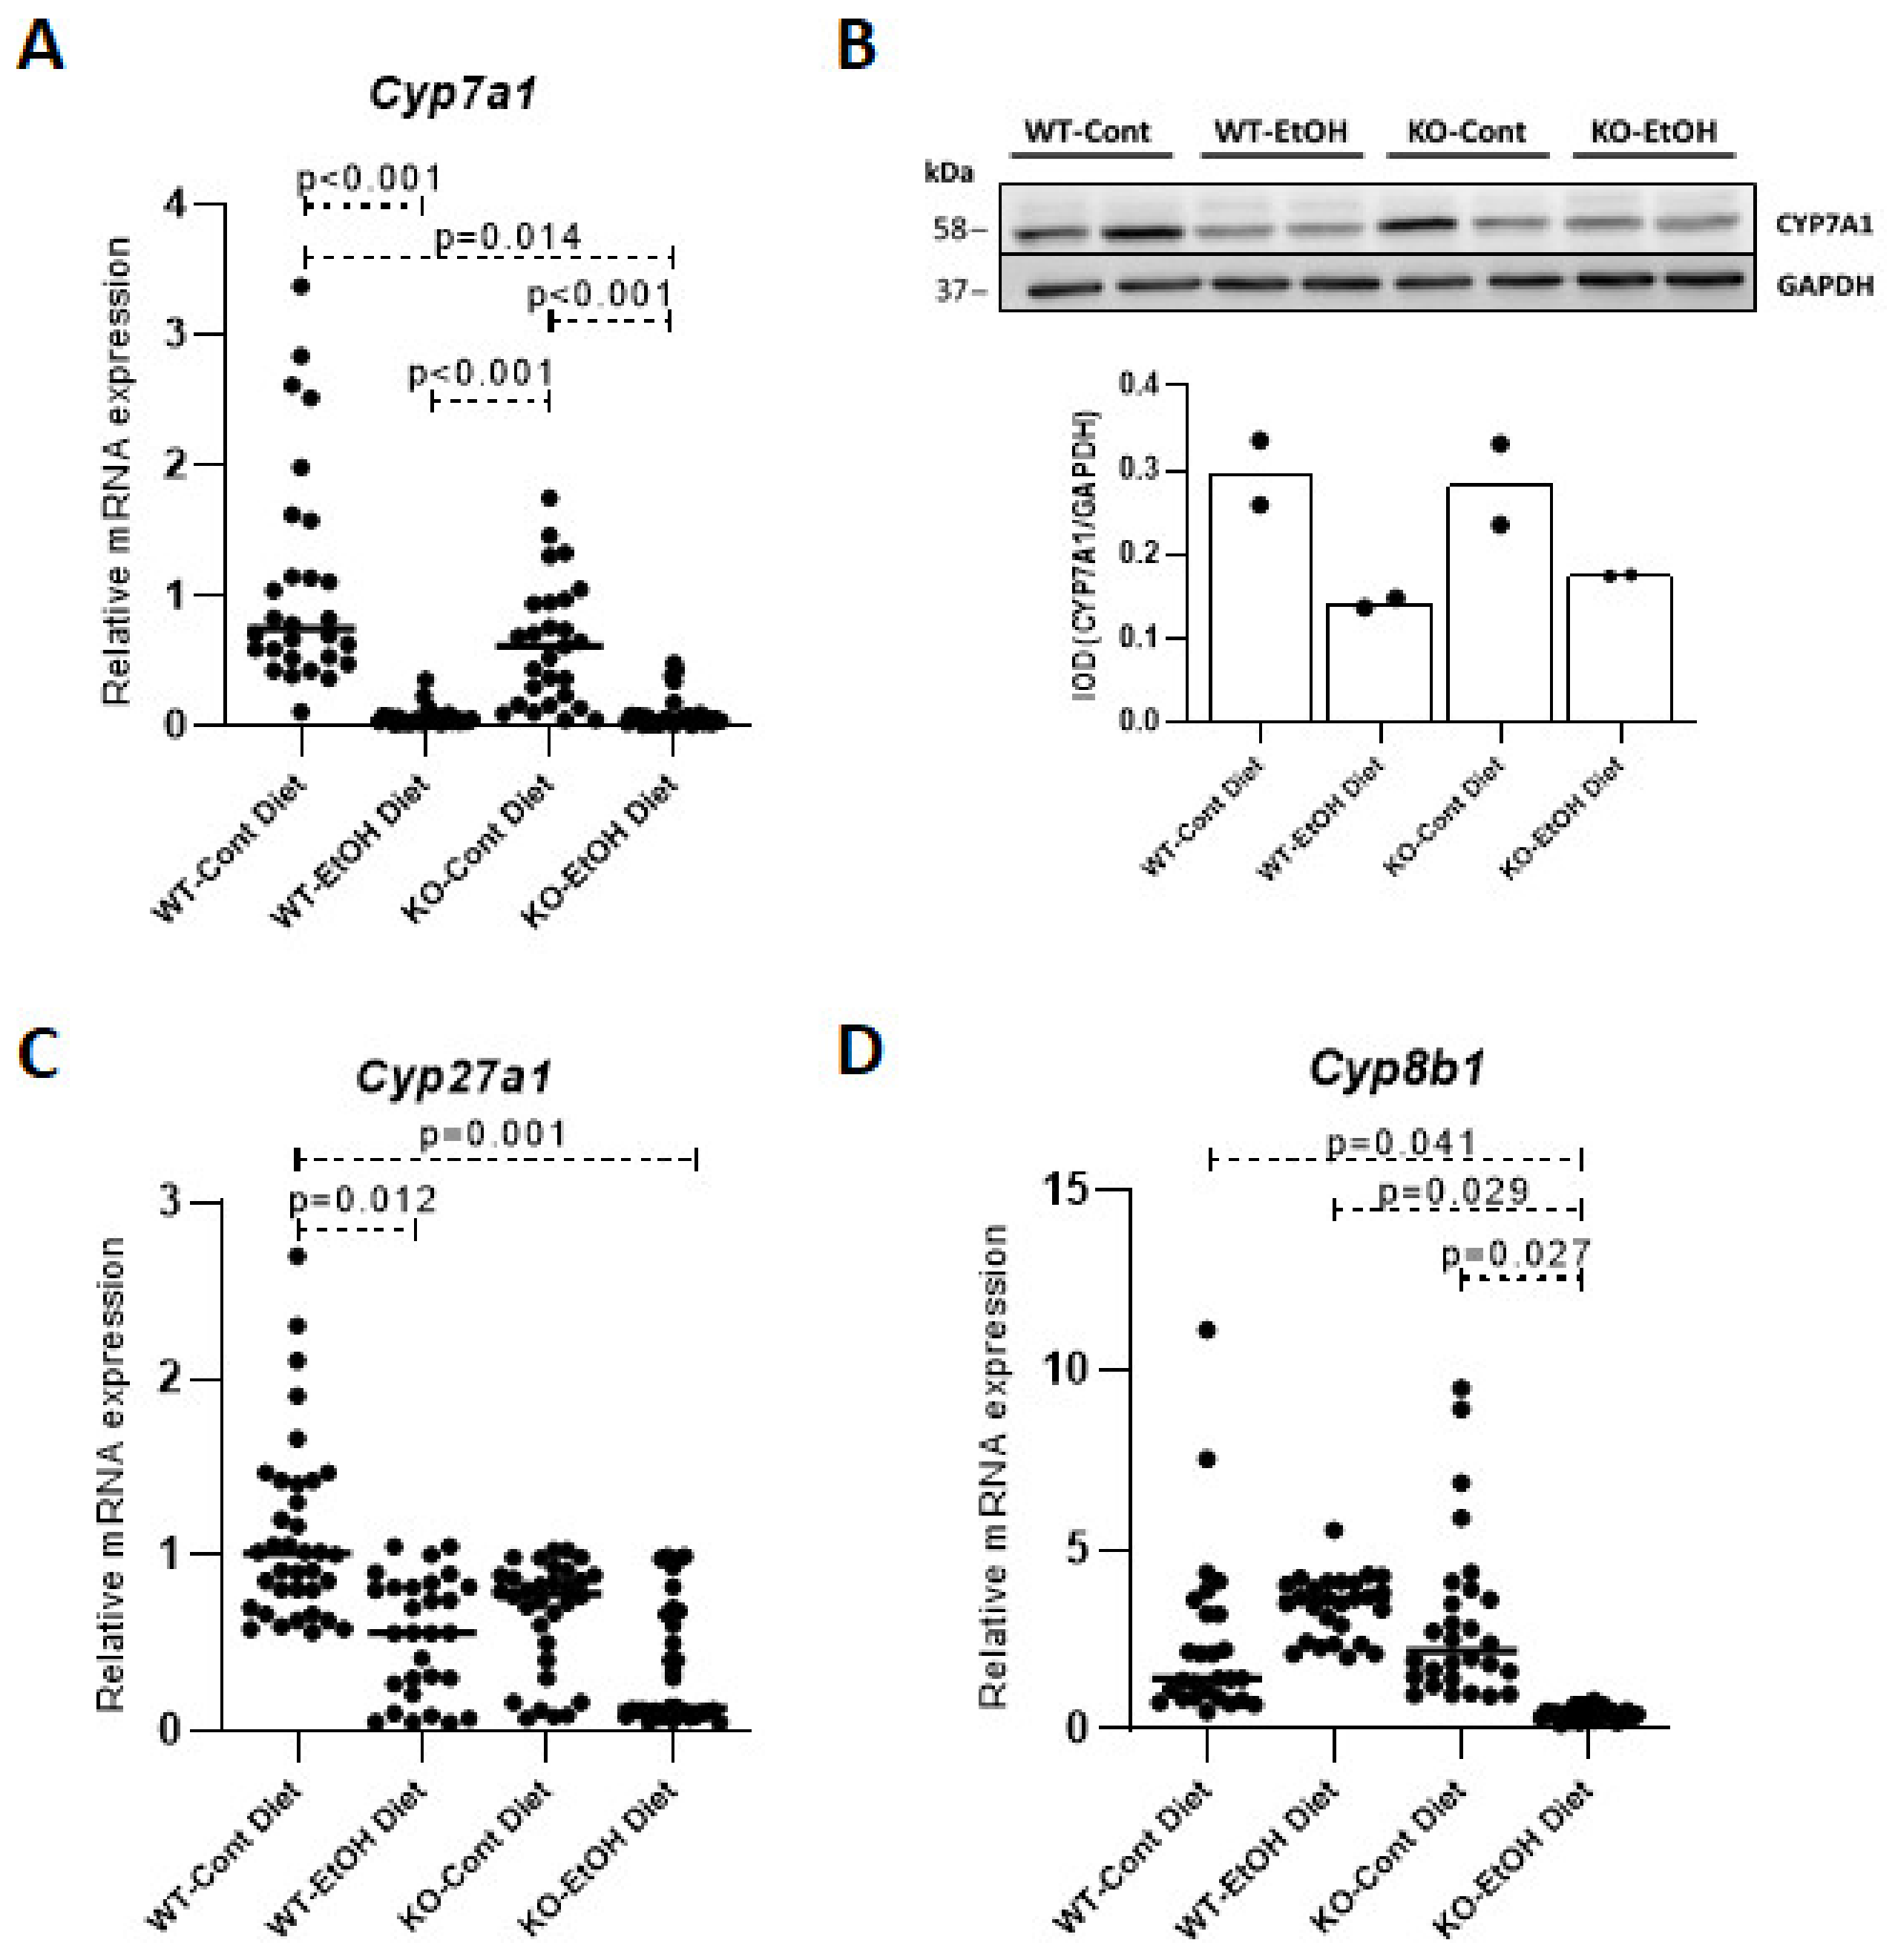
2.1.2. Relative Expression Levels of Bile Acid Synthesis Genes and Plasma and Gallbladder Total Bile Acid Levels

The hepatic expression of Cyp7a1 and Cyp27a1, which encodes sterol 27-hydroxylase (CYP27A1) in the alternative BA pathway, was significantly repressed in WT-EtOH (p < 0.001 and 0.012, respectively) and KO-EtOH mice (p = 0.014 and 0.001, respectively), as compared to WT-Cont mice (Figure 3A,C). Hepatic protein levels of CYP7A1 in randomly chosen mice confirmed the repression in EtOH-challenged mice (Figure 3B). Significant repression of the Cyp8b1 gene, encoding sterol 12α-hydroxylase (CYP8B1), which is required for synthesis of cholic acid, was observed in KO-EtOH mice only, when compared to the WT-Cont (p = 0.041), WT-EtOH (p = 0.029), and KO-Cont groups (p = 0.027) (Figure 3D).

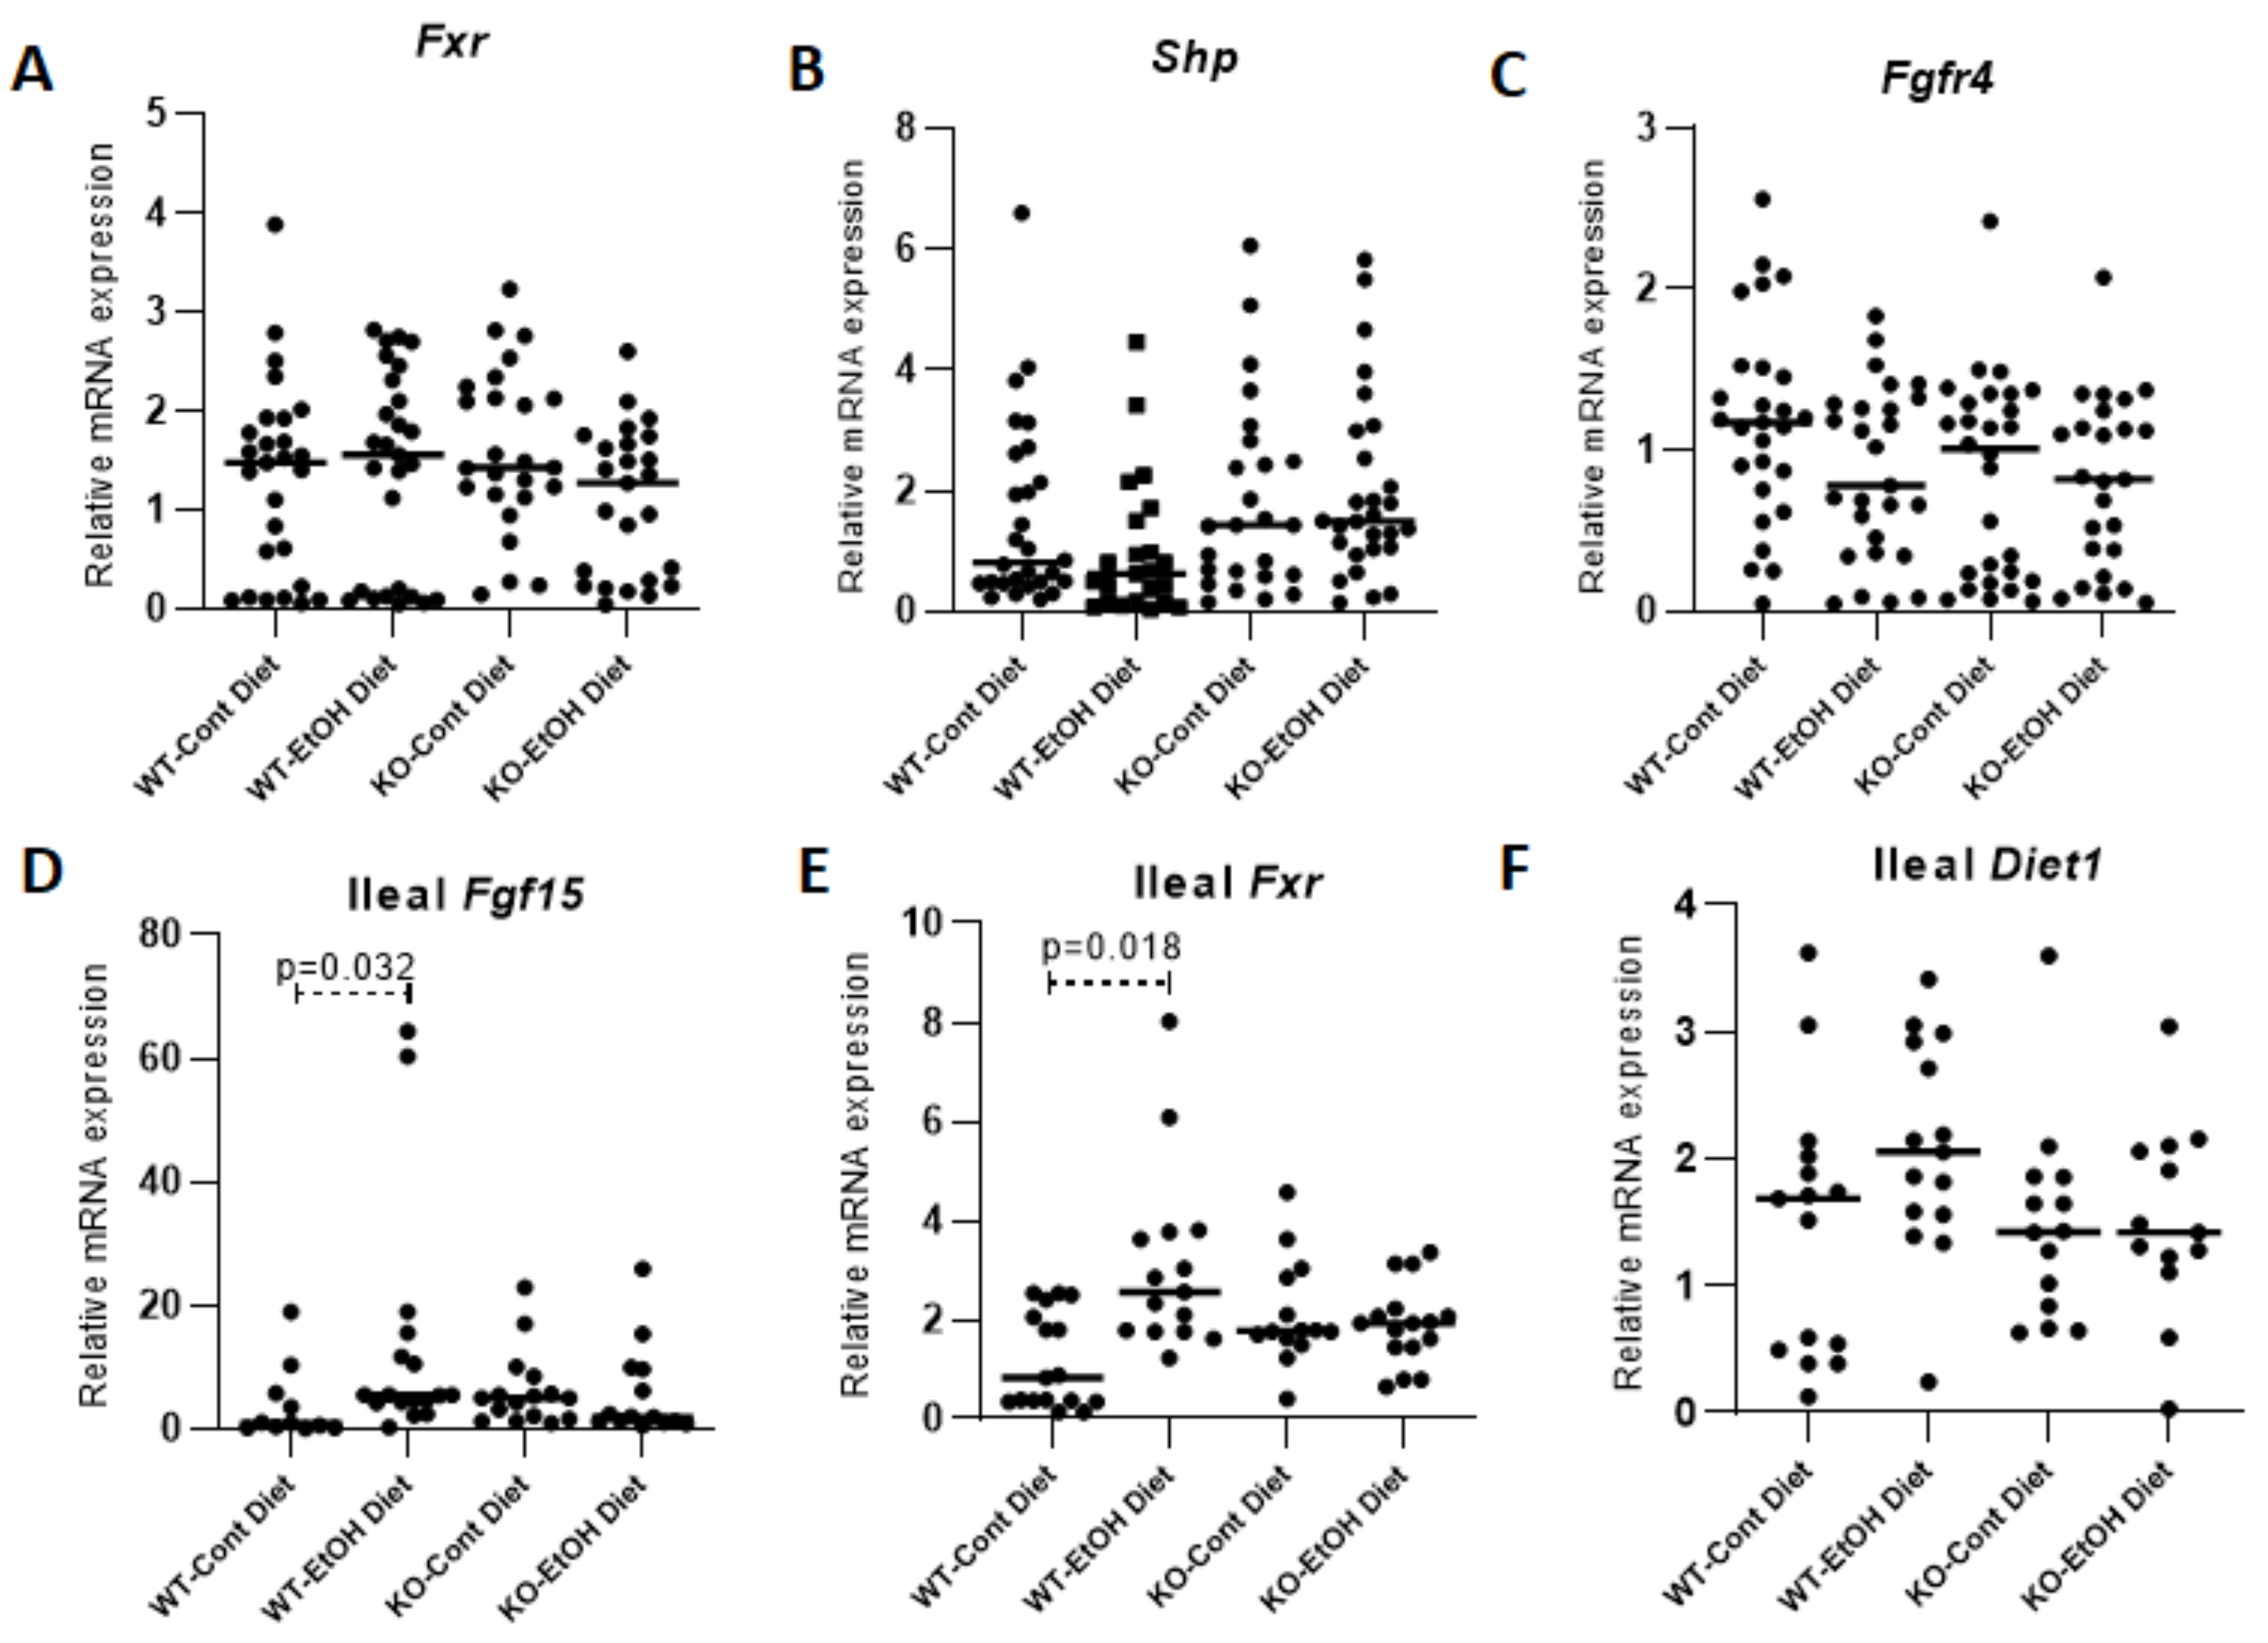
2.1.3. Hepatic FXR/SHP Pathway

To understand the molecular pathway of Cyp7a1 repression under EtOH challenge, the hepatic mRNA and protein expression levels of nuclear receptor FXR, which inhibits Cyp7a1 and Cyp8b1 gene transcriptions by inducing the nuclear receptor SHP, were analyzed [33,38]. However, no significant difference in expression levels of hepatic Fxr and Shp was observed between groups (Figure 4A,B, Supplementary Figure S1), suggesting that the repression of Cyp7a1 gene expression was independent of the FXR/SHP pathway in our ACLI model.

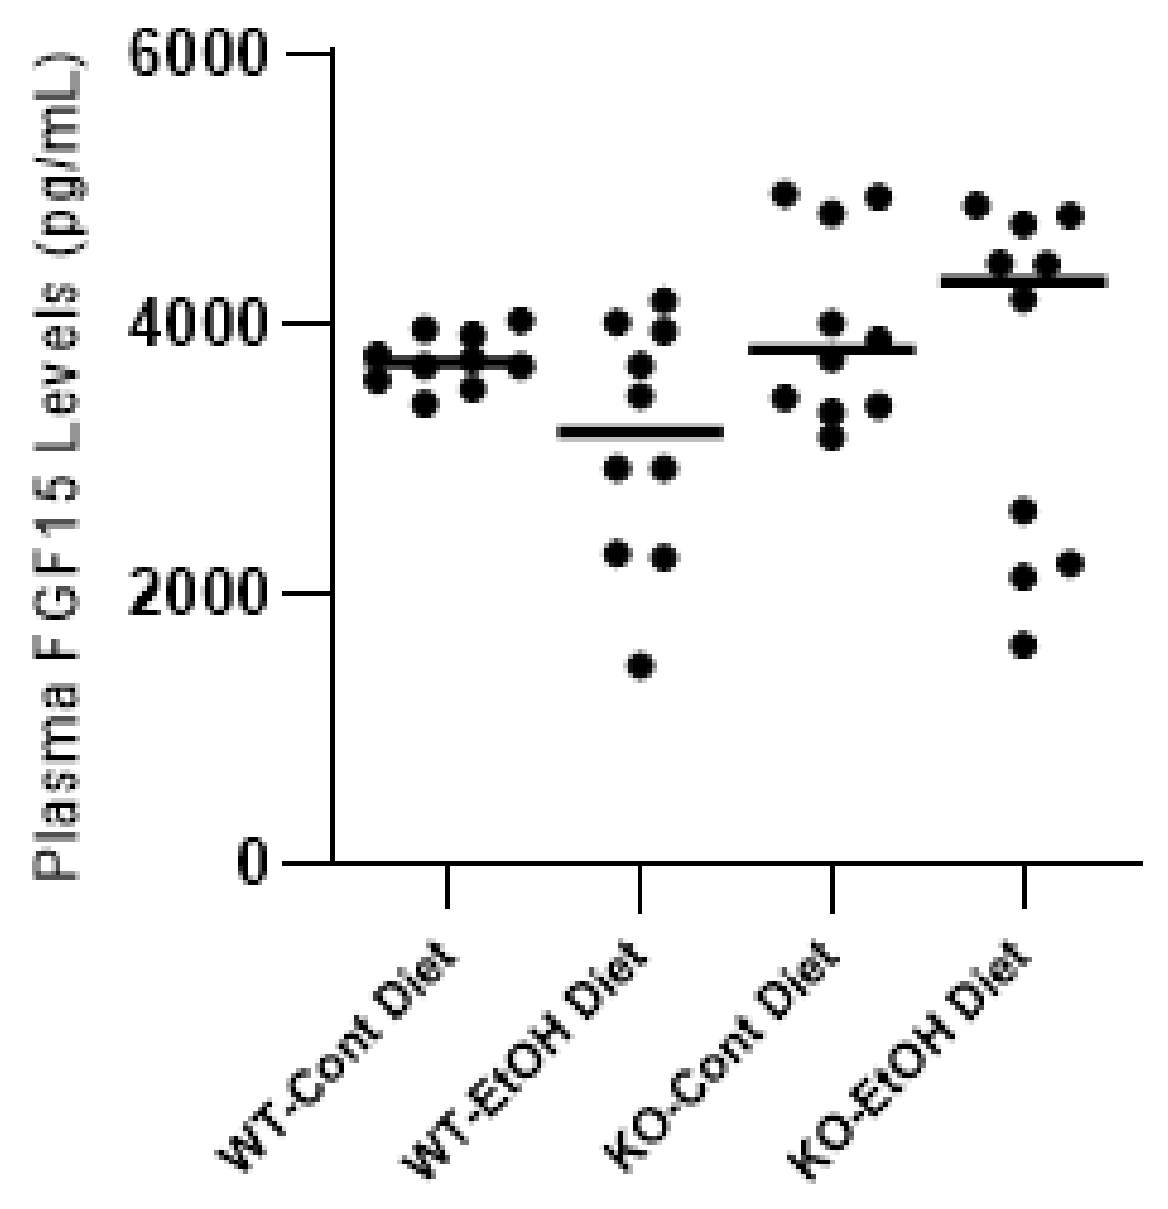
2.1.4. FXR/FGF15/FGFR4 Pathway

Another mechanism of Cyp7a1 repression is known to be based on the activation of FXR in the ileum, which induces the intestinal hormone FGF15 that activates hepatic FGFR4 signaling [34]. The significant upregulations of ileal Fgf15 (p = 0.032) and Fxr gene expressions (p = 0.018) in WT mice were observed upon EtOH uptake but not in the KO group (Figure 4D,E). Interestingly, the circulating total FGF15 plasma levels did not differ between groups (Figure 5). In mice, ileal FGF15 is secreted into the portal circulation and carried to the liver, where it binds to its cognate receptor FGFR4 and is then released into the systemic circulation. Therefore, higher levels of FGF15 might be expected in portal as compared to systemic blood. However, although one should be cautious about plasma FGF15 levels reflecting the portal concentrations, using targeted mass spectroscopy, Katafuchi et al. showed a strong correlation between ileal and plasma FGF15 levels [39], suggesting a correlation with portal FGF15 as well. To clarify this result, we also measured the ileal expression level of the Diet1/Malrd1 gene, which has been suggested to be related to the levels of FGF15 secretion into the portal circulation [40]. Although ileal Diet1 expression paralleled the expression pattern of Fgf15 and Fxr, with higher levels in WT mice challenged with EtOH, no differences between groups were observed for Diet1 (Figure 4F) and hepatic Fgfr4 (Figure 4C). Moreover, no statistical difference for the co-receptor Klb expression was observed between groups, albeit its expression was lower in the EtOH group (Figure 2B). The lack of significant changes in the ileal expression levels of Fxr and Fgf15, as well as plasma FGF15 levels in the KO-EtOH group, suggests that the alcohol-dependent upregulation of FGF21 may have a direct link to Cyp7a1 repression in the ACLI model.

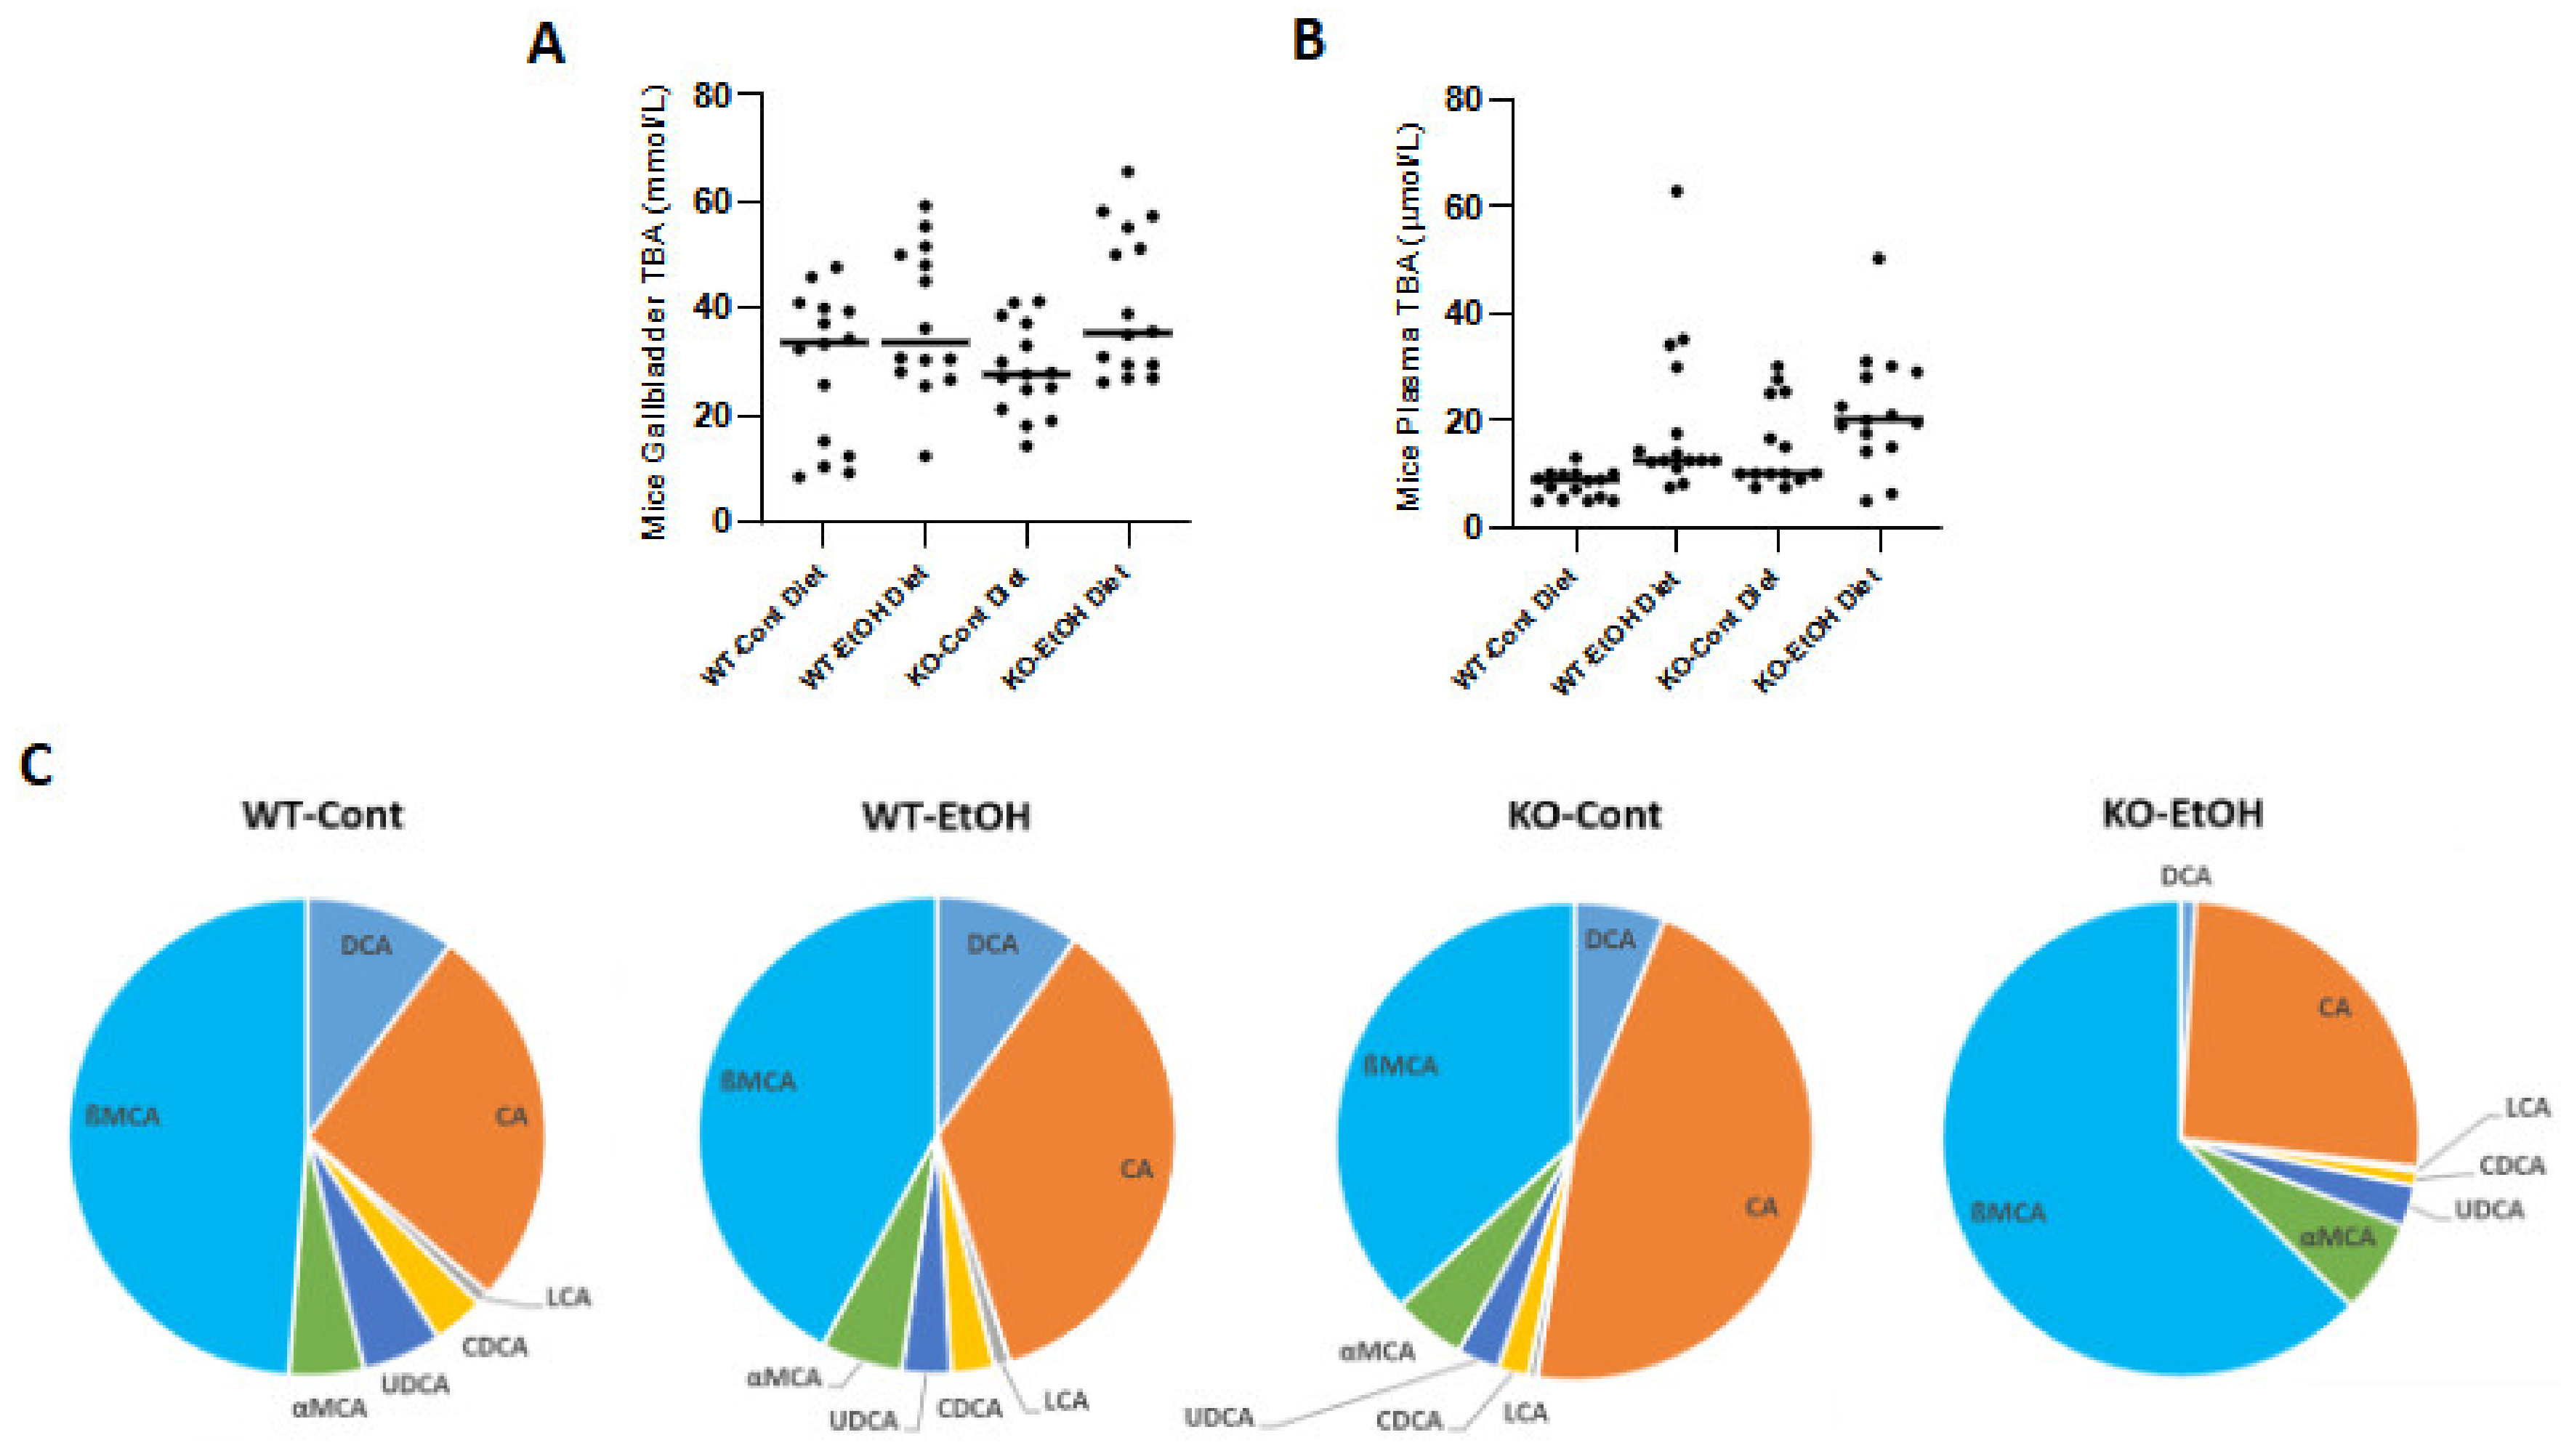
2.1.5. Total Bile Acid Concentrations and Composition in Mice

In order to evaluate the changes in bile acid metabolism among the experimental groups, TBA concentrations and composition were determined. Although statistically not significant, chronic plus binge ethanol feeding increased TBA concentrations both in the plasma and gallbladder bile of mice (Figure 6A,B), showing higher plasma TBA levels in KO-Cont mice as compared to the WT-Cont group. These findings indicate that although the expression of genes involved in the bile acid synthesis cascade was repressed (Figure 3), the bile acid pool size was increased in murine plasma and gallbladders after ethanol feeding. A lower percentage of secondary bile acids (DCA, LCA, and UDCA) was observed in KO-EtOH (4.1%), and the highest percentage was in WT controls (16.6%) (Figure 6C and Table 1). The most abundant bile acids in plasma were found to be CA and βMCA in all groups. In the WT-Cont group, the pool contained 26.3% CA and 49.1% βMCA (Figure 6C and Table 1). Compared to this group, WT-EtOH and KO-EtOH groups showed reduced βMCA (42.1% and 36.9%, respectively). The KO-Cont group presented higher CA (46.2% vs. 26.3%) and lower βMCA (36.9% vs. 48.5%) levels (Figure 6C and Table 1). High βMCA (62.7%) with low CA (25.9%) and CDCA (1.0%) levels suggest a shift to more hydrophilic BA with the repression of hepatic Cyp8b1 and Cyp7a1 in EtOH-treated KO mice.

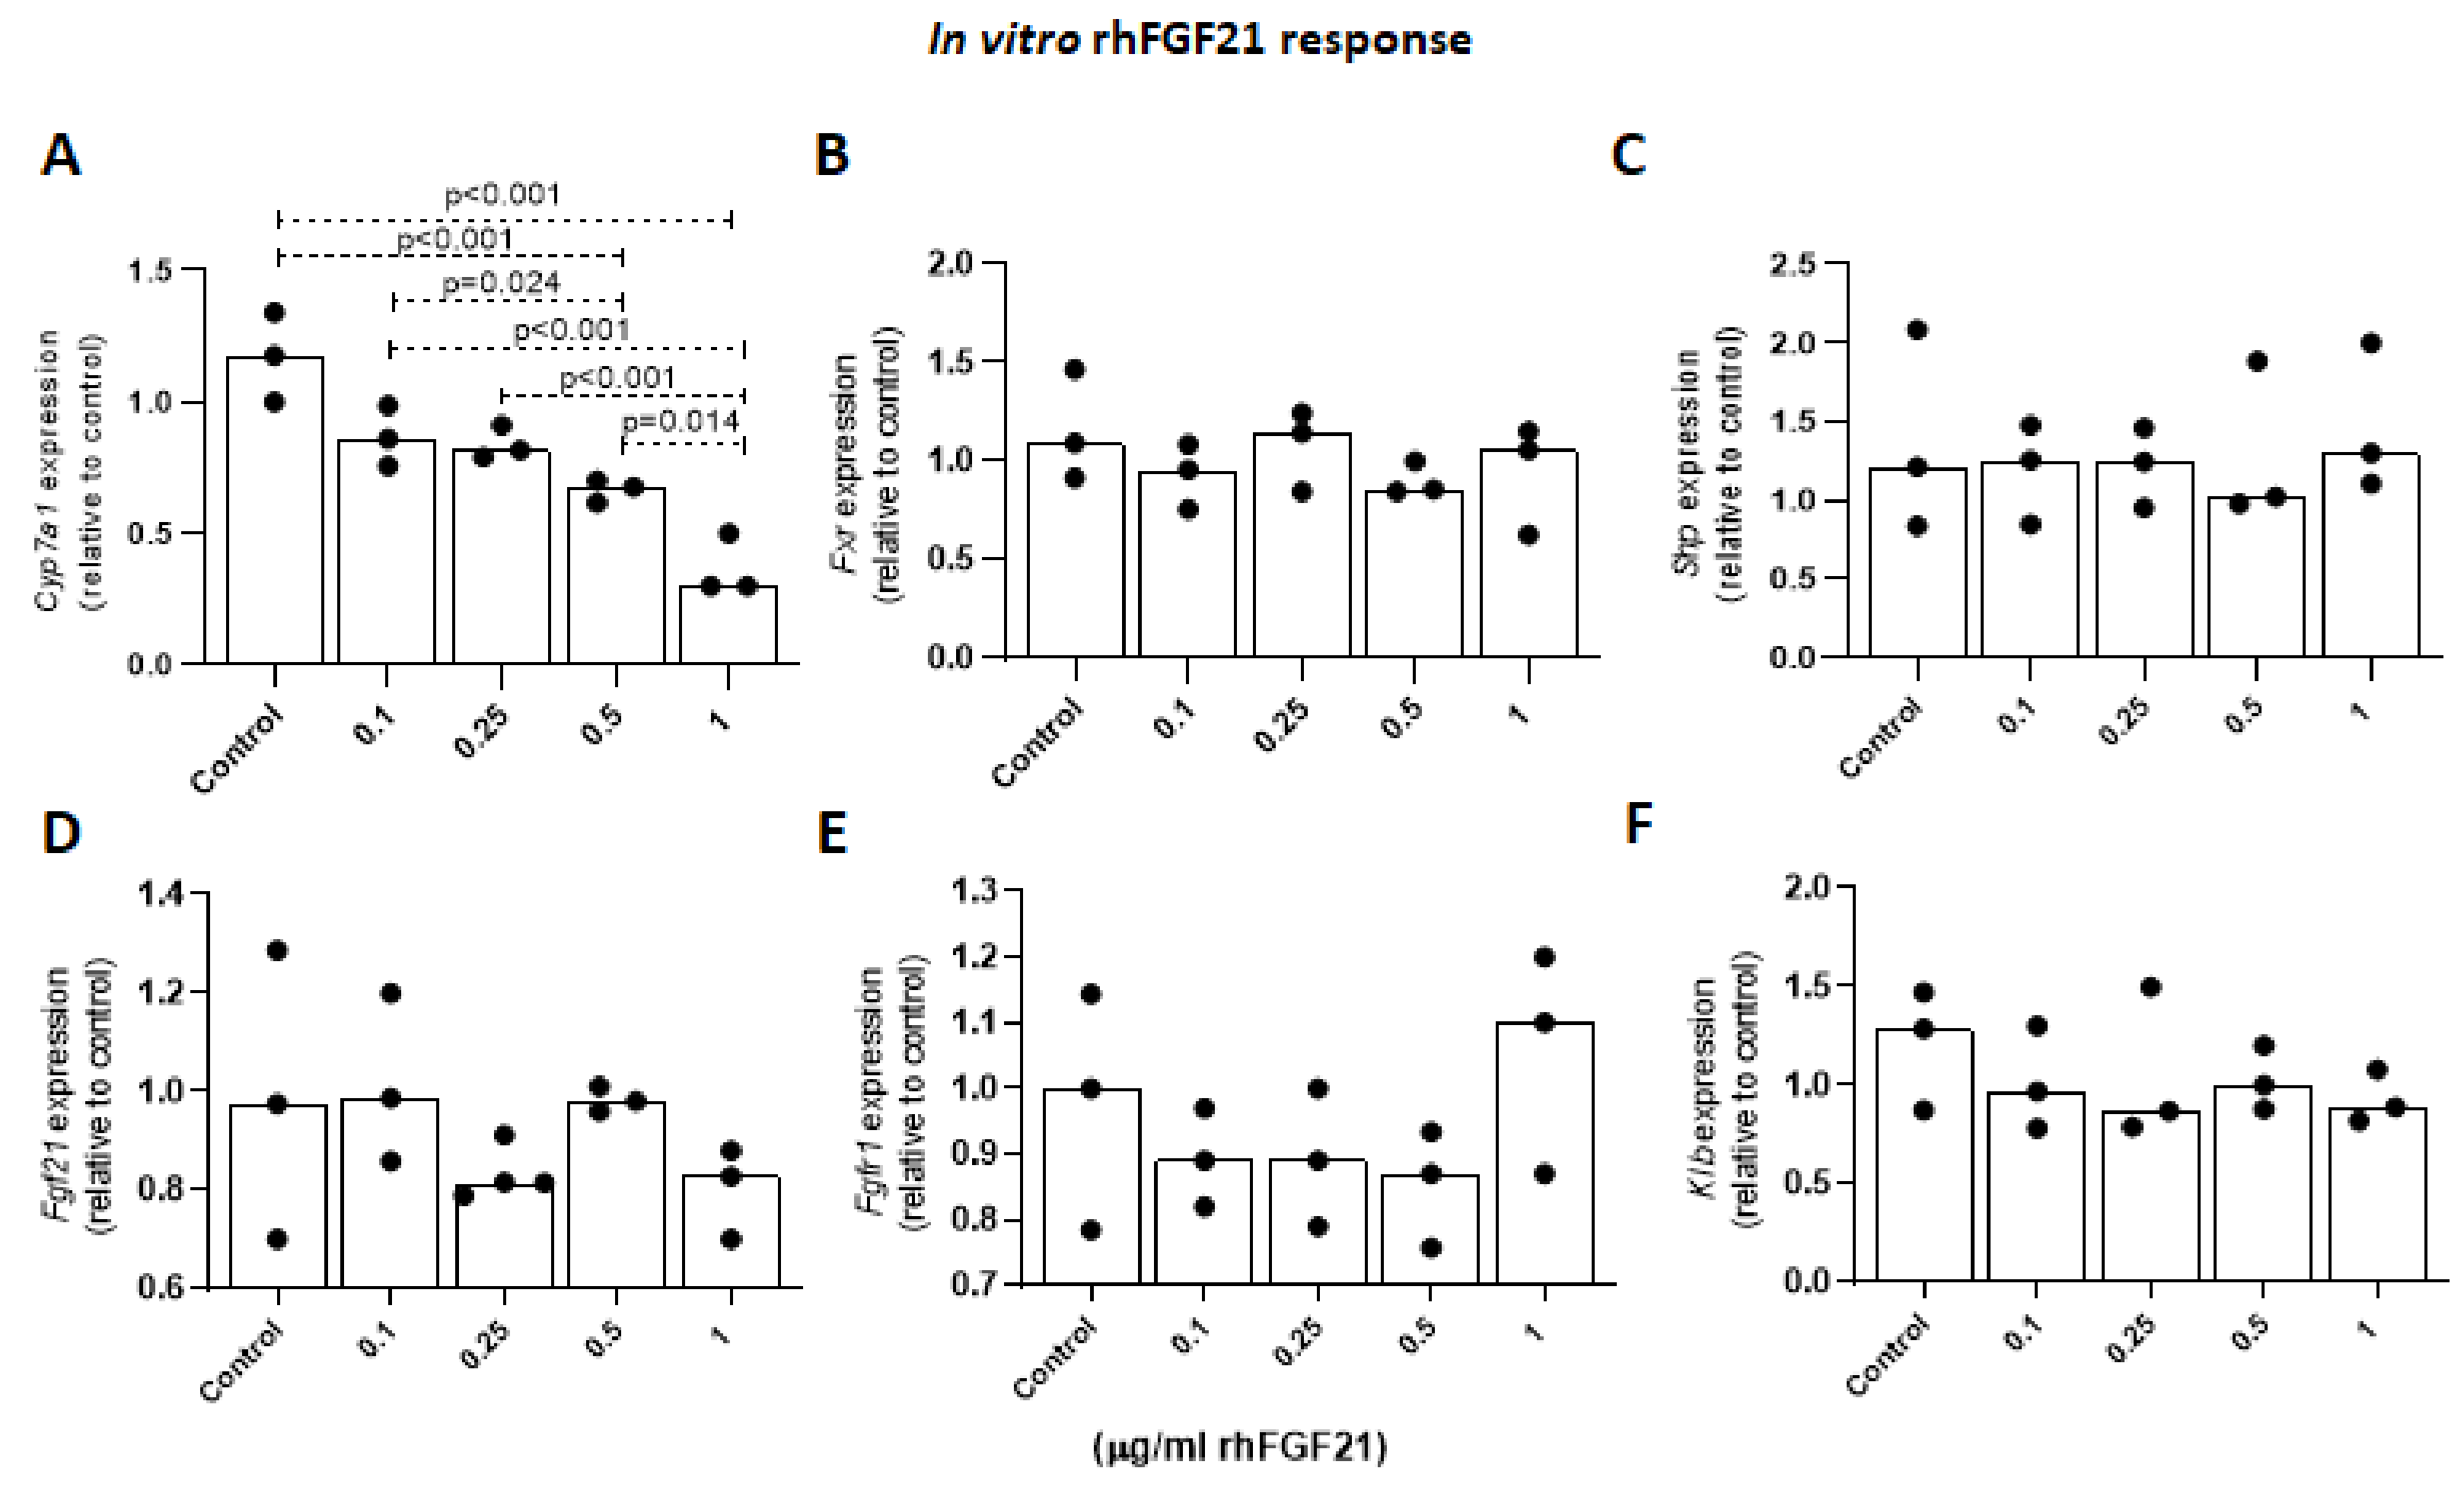
2.1.6. Effects of FGF21 on Cyp7a1 Expression Levels in Primary Mouse Hepatocytes

In mouse primary hepatocytes, rhFGF21 decreased Cyp7a1 expression levels in a dose-dependent manner. Although the expression level of Cyp7a1 was slightly decreased with lower FGF21 doses (0.1 and 0.25 µg/mL), significant suppression was observed at 0.5 and 1 µg/mL doses by 25% and 70% relative to the control, respectively (Figure 7A). In order to assess whether these changes were mediated by a direct or indirect action of FGF21, expression levels of Fxr and Shp were evaluated, and no difference was observed for either of the two genes (Figure 7B,C). Additionally, no changes in gene expression of hepatic Fgf21, Fgfr1, and Klb were observed after the administration of exogenous FGF21 (Figure 7D,F). In line with our in vivo findings, these results suggest a direct role of exogenously administered FGF21 on Cyp7a1 gene suppression, which is independent of the FXR/SHP pathway.

2.1.7. Plasma ALT, AST and Ethanol Levels in Mice

In order to validate the impact of chronic plus binge ethanol consumption on liver function, we compared serum aminotransferase (ALT and AST) activities, as well as EtOH levels, before and after the alcohol challenge in mouse groups. As expected, high levels of EtOH were detected in plasma samples of WT and KO mice challenged with EtOH (Supplementary Figure S2A). The serum aminotransferases were significantly elevated in both WT and KO mice as compared to their control diet-fed controls (p < 0.001 for ALT and p = 0.013 for AST in WT mice, p = 0.001 for ALT and p = 0.001 for AST in KO mice) (Supplementary Figure S2B,C), indicating aggravated liver injury.

2.1.8. Histological Assessment of Murine Liver Injury
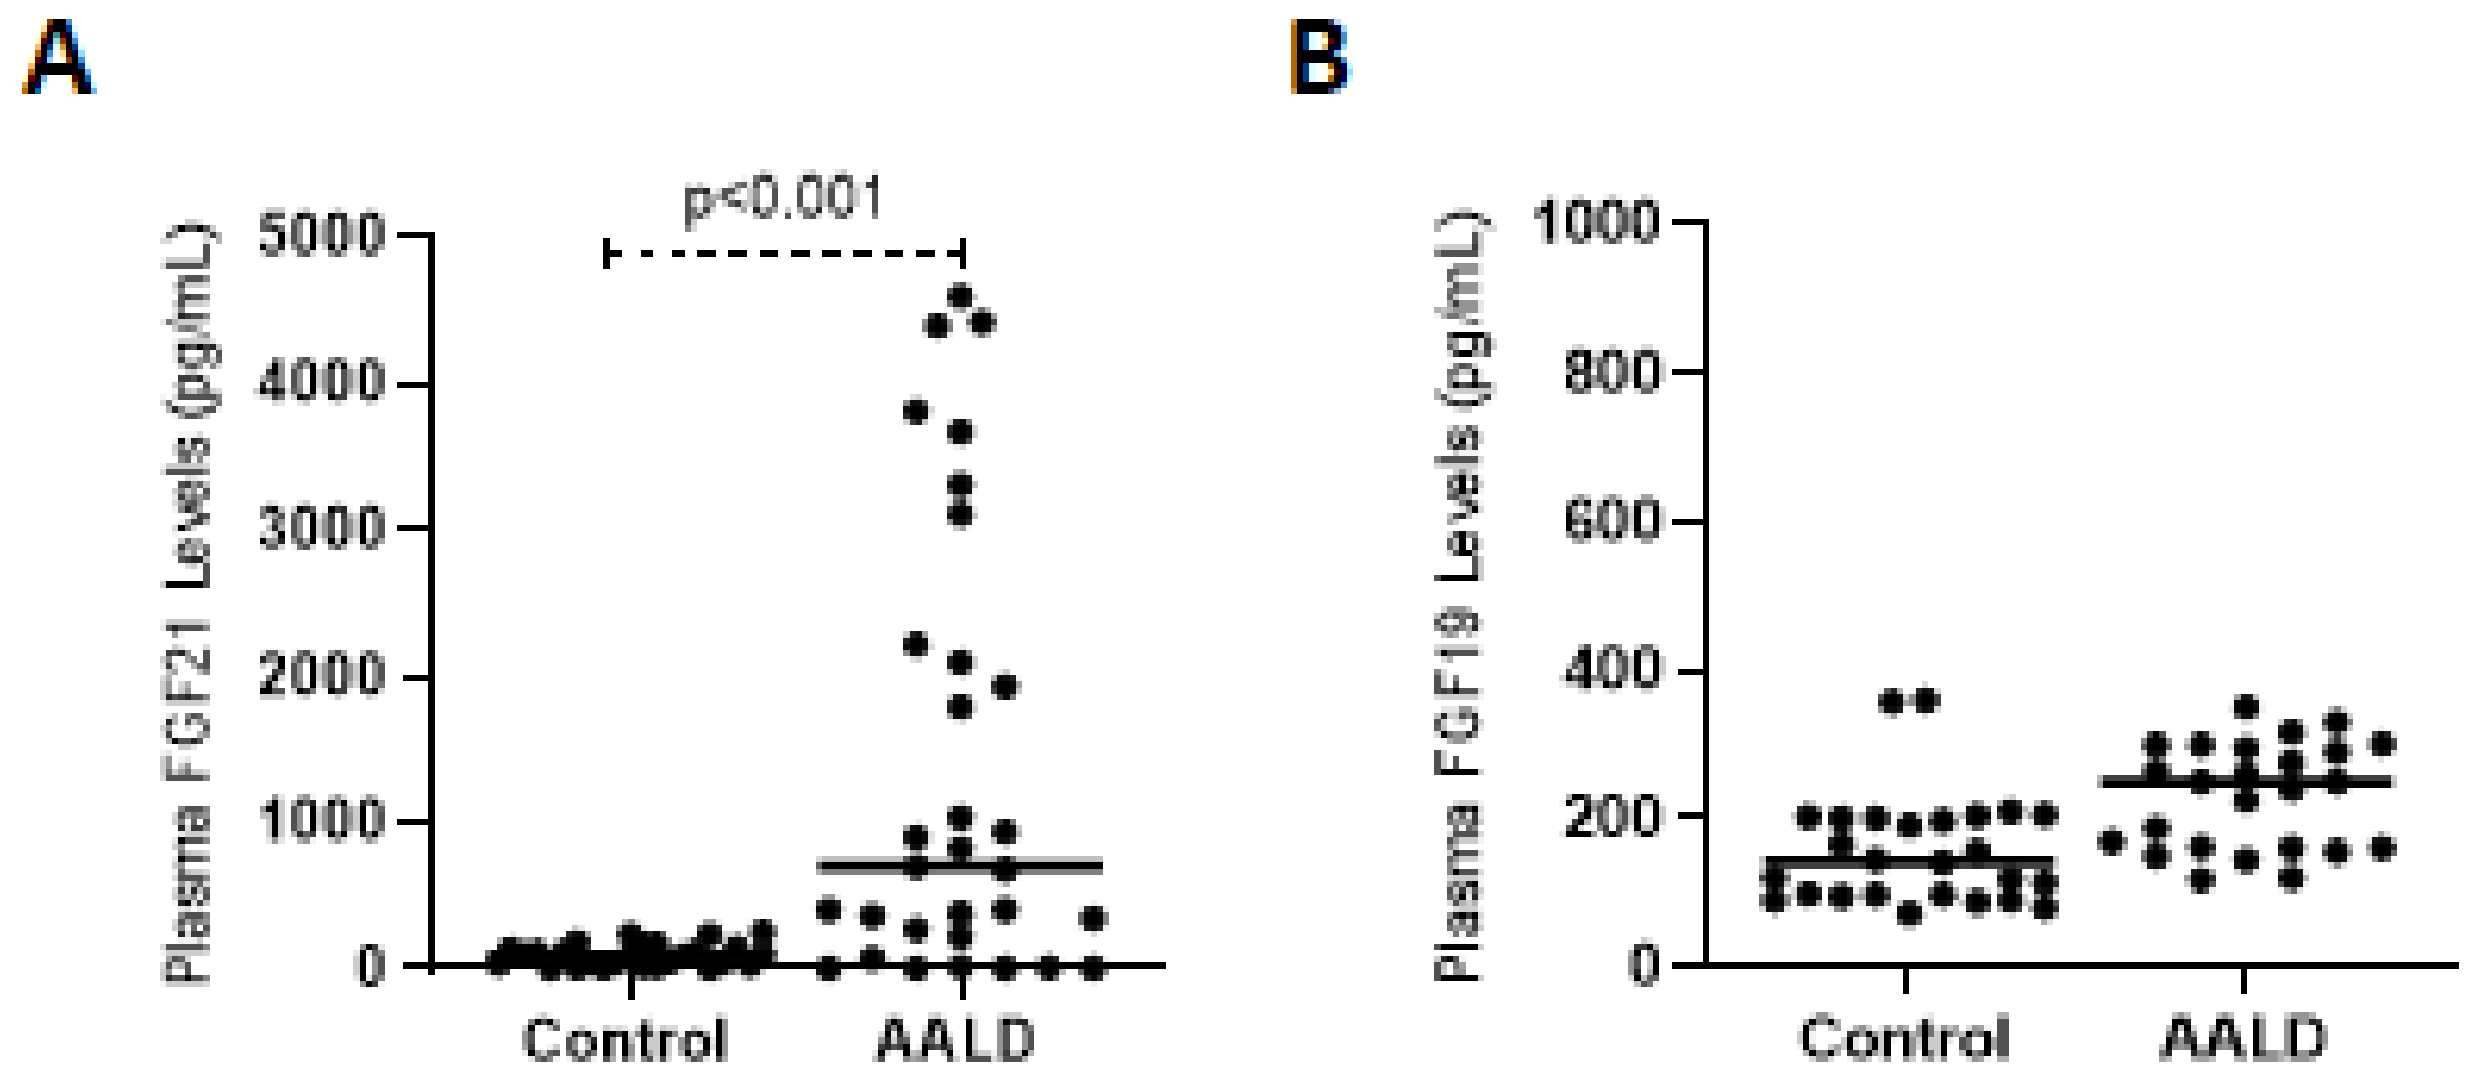
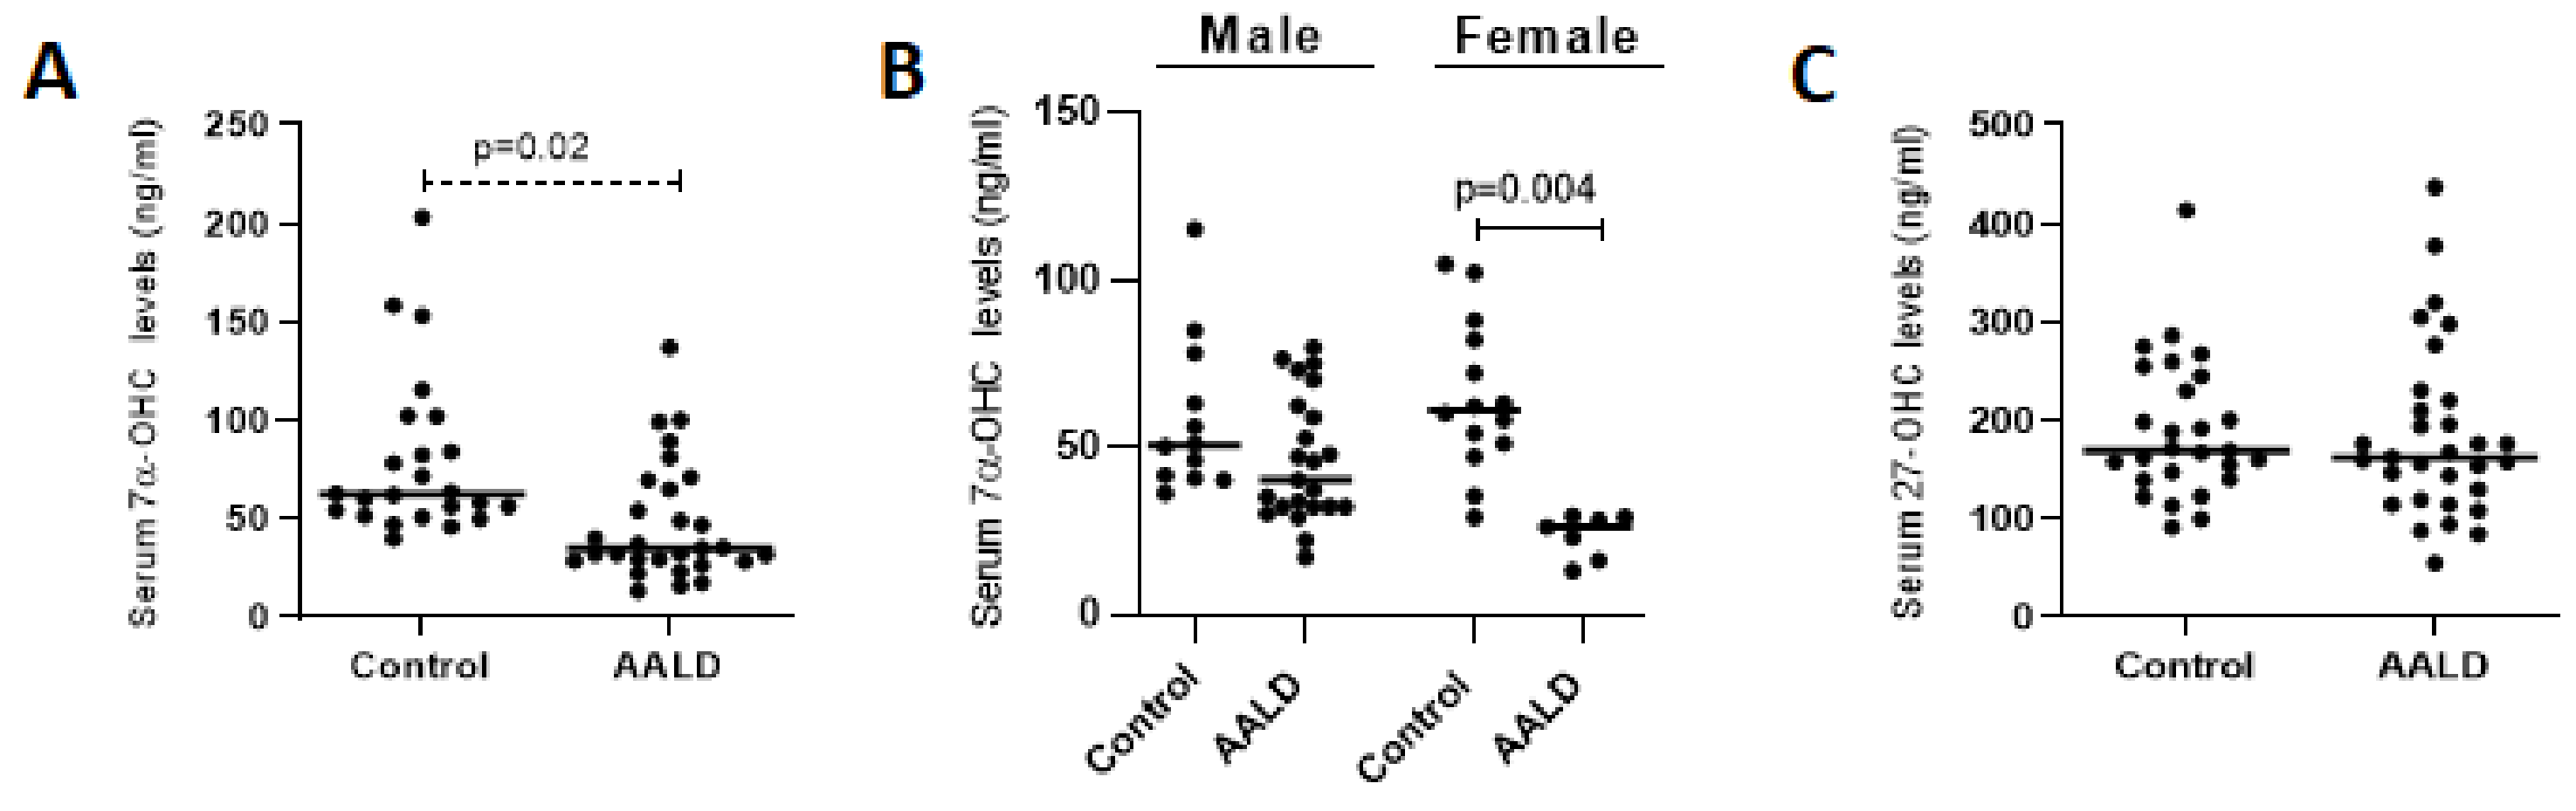
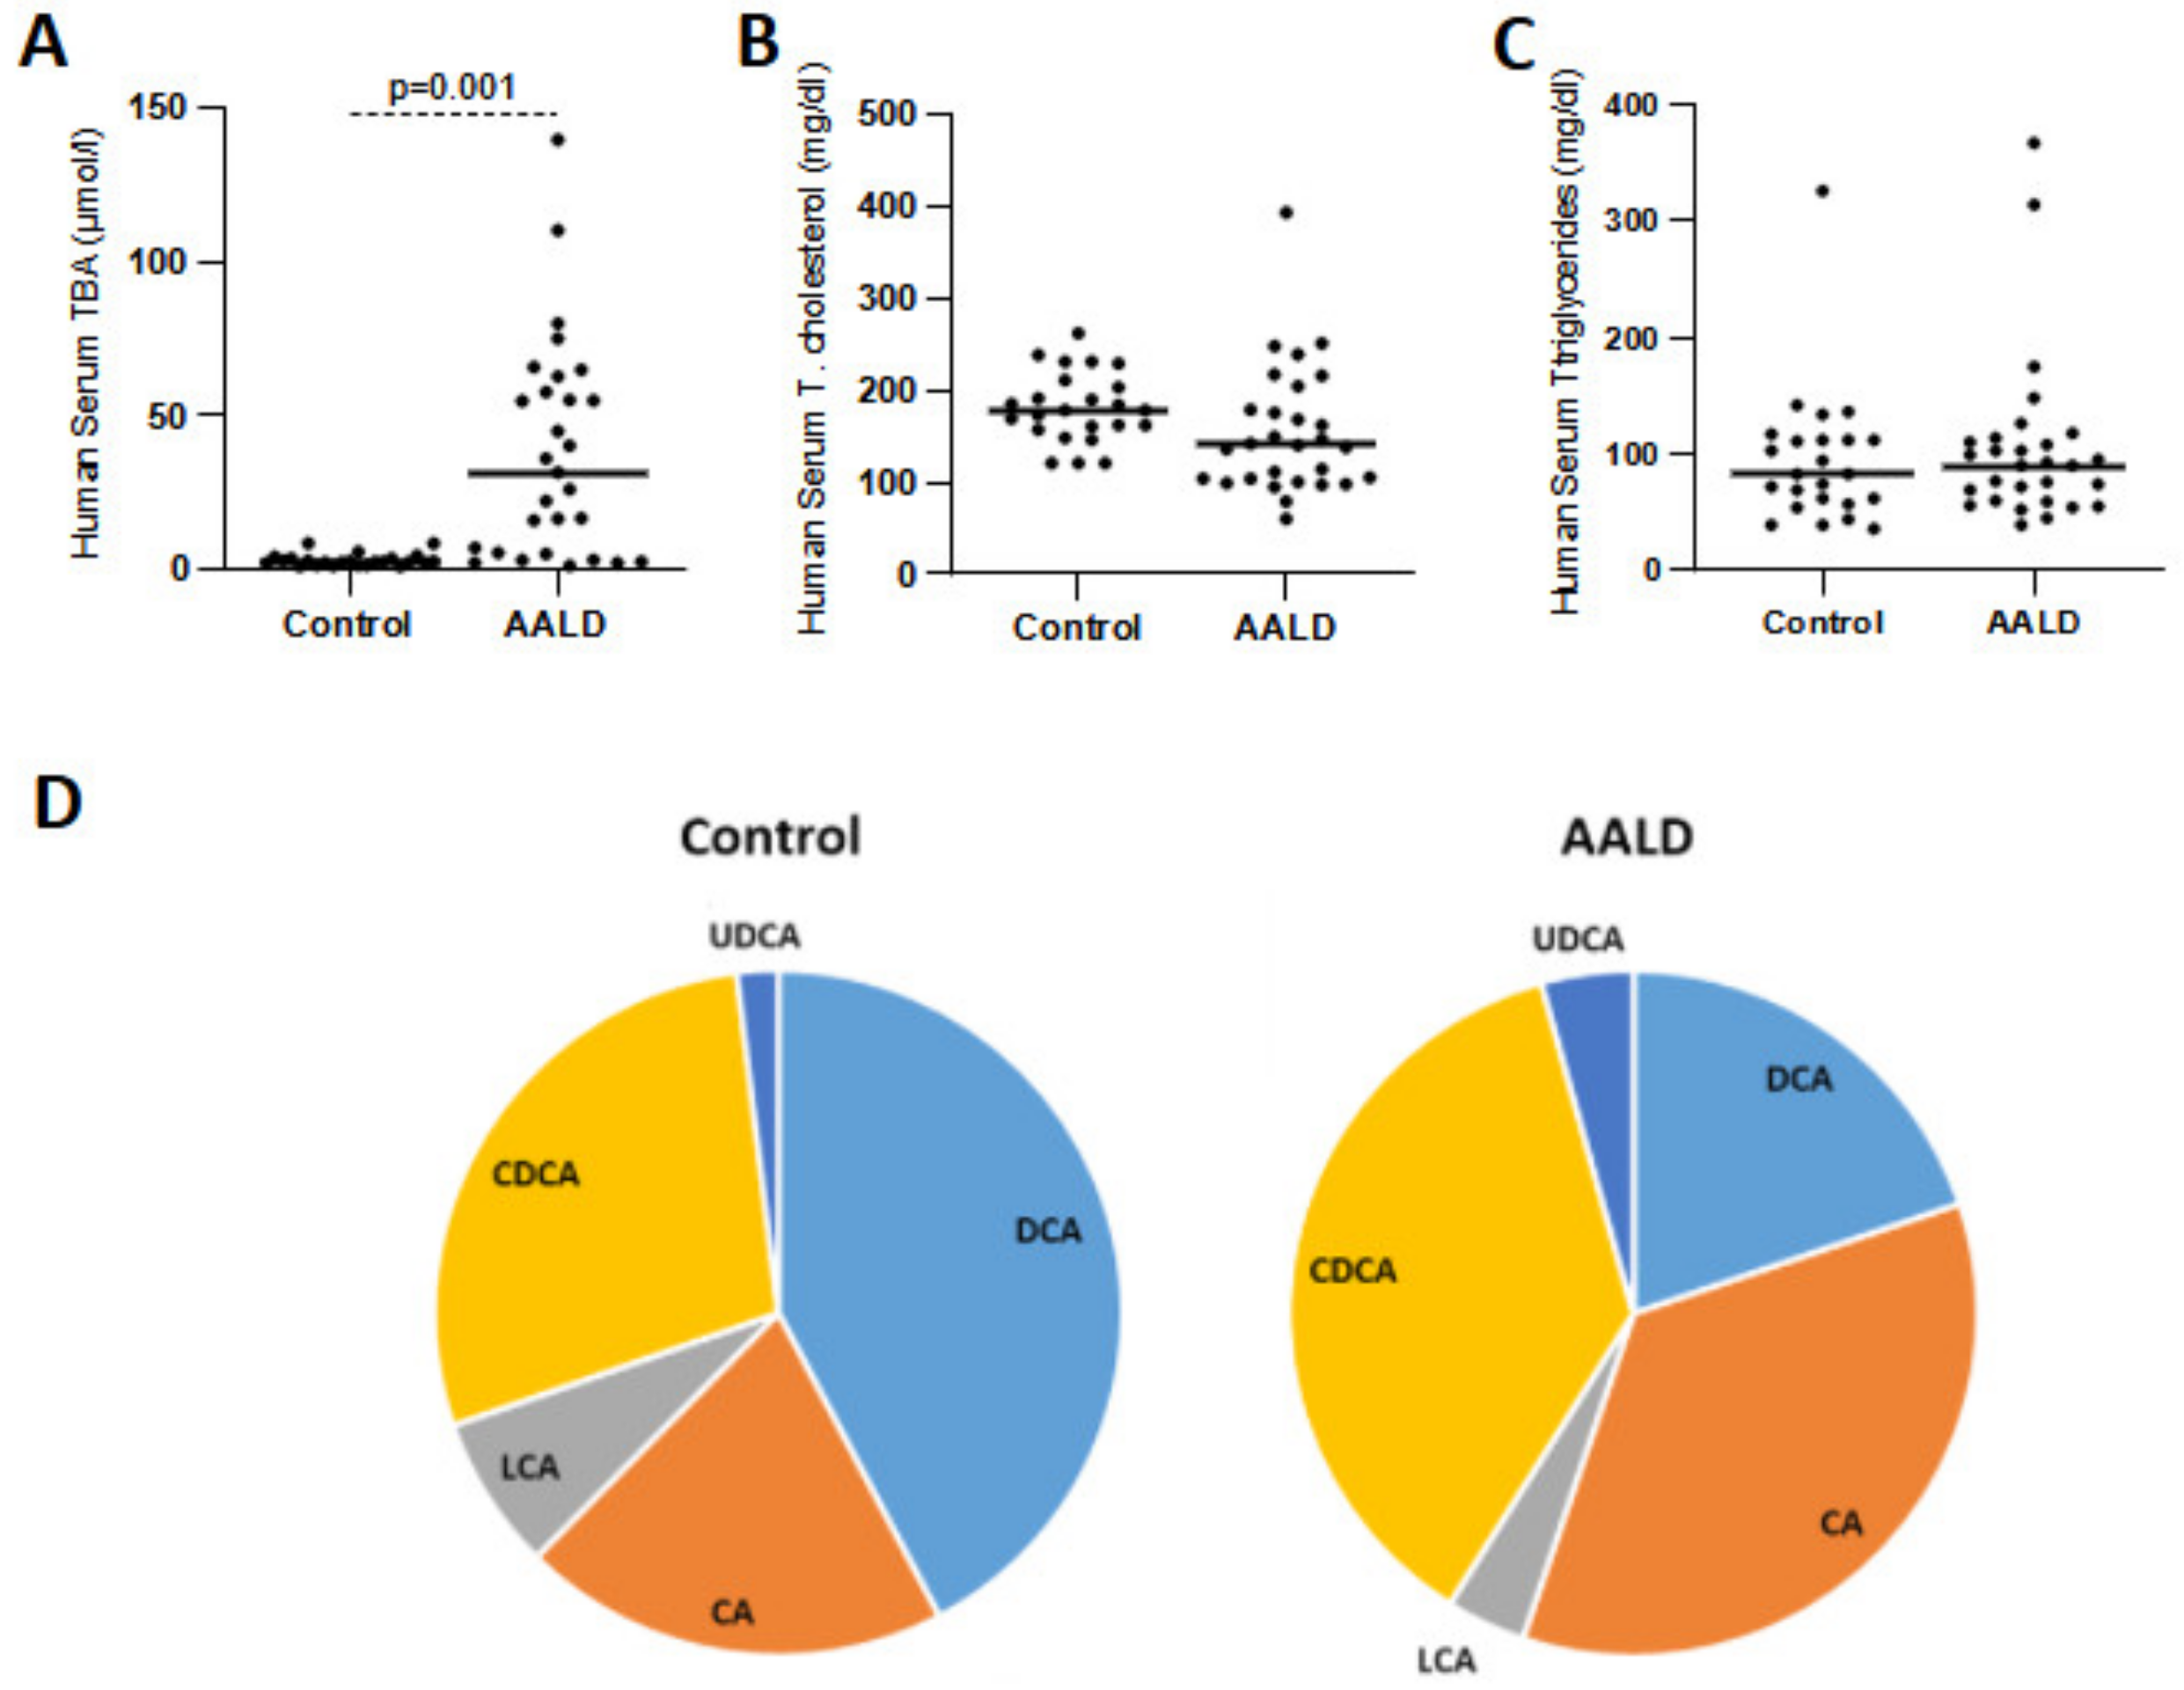
Increased numbers of infiltrating inflammatory cells shown by H&E staining indicated increased hepatic steatosis in mice challenged with EtOH regardless of genotype (Supplementary Figure S3A). Sirius red staining of liver sections showed that chronic plus binge ethanol feeding aggravated liver fibrosis in both WT and KO mice (Supplementary Figure S3B). In mice challenged with ethanol, Hyp contents and collagen area calculation indicated higher collagen levels; however, this increase was not significant when compared to the control diet-fed counterparts (Supplementary Figure S3C,D). The inflammatory cell infiltrates were composed of F4/80+ macrophages, CD45+ neutrophils, and CD11+ and CD4+ lymphocytes (Supplementary Figure S4).

2.2. Human Studies

In order to translate our findings to humans, we evaluated the effects of EtOH consumption on FGF21 and bile acid metabolism, by analyzing FGF21, FGF19 (the human orthologue of FGF15 in mice), 7α-hydroxycholesterol (7α-OHC), and oxysterol 27-hydroxycholesterol (27-OHC) levels. Healthy controls did not have any known medical history and presented with normal BMI (18–25 kg/m2). For the evaluation of alcohol intake and liver injury, biochemical parameters were measured in serum samples of both groups. As expected, CDT, ALT, and AST levels were significantly elevated in AALD patients with ongoing alcohol intake (p < 0.001, p = 0.004, and p < 0.001, respectively) (Supplementary Figure S5).
In parallel to the observed results in mice, a significant (p < 0.001) upregulation of FGF21 in the cohort with ongoing EtOH consumption was found, suggesting that the previously ascertained induction of FGF21 by EtOH consumption is preserved in AALD patients (Figure 8A). The circulating plasma FGF19 levels in humans, which has been reported to reflect portal concentrations in previous studies [41,42], remained unchanged between the groups, which is in line with the measurements of plasma FGF15 concentrations in mice (Figure 8B).
To evaluate the potential changes in CYP7A1 and CYP27A1 genes in humans, we evaluated the serum concentrations of the specific metabolite 7α-OHC, which has been proposed as an indicator of 7α-hydroxylase activity [43], and 27-OHC levels in human serum samples, respectively. Consistent with the findings in mice, a significant (p = 0.02) suppression of 7α-OHC was observed in AALD patients (Figure 9A), which appears to be mostly due to significant suppression in female AALD patients (Figure 9B). However, levels of 27-OHC did not differ between groups (Figure 9C).
In humans, serum TBA concentrations were found to be significantly (p = 0.01) elevated despite a nonsignificant reduction of total cholesterol levels in the AALD cohort as compared to controls (Figure 10A,B). Altogether, this data suggests a significant upregulation in TBA and FGF21 levels in the plasma of AALD patients in the absence of marked changes in FGF19 levels upon EtOH consumption. To evaluate the bile acid pool composition in healthy controls and AALD patients, serum bile acid profiles were determined by GC-MS. Overall, a greater percentage of the secondary bile acid DCA was observed in healthy controls (Figure 10D and Table 2) as compared to AALD patients. As expected, the total percentage of secondary bile acids was found to be markedly lower in patients with AALD (27.8%) than in healthy subjects (50.3%). Accordingly, increased levels of CDCA and CA were observed in patients with AALD as compared to healthy subjects.

3. Discussion

The FGF21 response and its relation to hepatic bile acid homeostasis are described for the first time in the present study in an alcohol-induced acute-on-chronic liver injury model, which has previously been described by our group [2]. The study identifies a significant induction of hepatic and serum FGF21 levels in both human AALD patients and rodents with pre-injured liver upon EtOH consumption, supporting that this reaction is preserved even in the context of pre-existing hepatic pathology [12,44]. Furthermore, in vivo studies have indicated a significant downregulation of hepatic Cyp7a1 expression after chronic plus binge ethanol feeding in mice, regardless of the presence of pre-existing liver injury. The results of our in vitro studies suggest a direct and dose-dependent effect of FGF21 on hepatic Cyp7a1 mRNA suppression. Moreover, due to the lack of any changes in expression of hepatic Fxr and Shp or plasma FGF15/19 levels after EtOH challenge, we propose that alcohol-induced FGF21 has a direct effect on Cyp7a1 regulation and thus on bile acid homeostasis, which is independent of the canonic FXR-SHP or FGF15/FGFR4 pathways (Figure 11). In accordance with the in vivo results, our translational human studies demonstrate significant FGF21 upregulation and reduction of serum 7αOHC levels in AALD patients upon ongoing EtOH consumption together with unchanged plasma FGF19 levels.
The direct role of FGF21 in the regulation of bile acid synthesis and its interaction with FGF15/19 is a controversial issue. In a recent study by Chen et al. [21], in which rhFGF21 and its long-acting analogs, as well as rhFGF19, were administered in different rodent models at pharmacologic doses, FGF21 has been proposed for the first time as a negative regulator of bile acid metabolism in a manner that is independent of the FGF15/19 pathway. In the experimental study, mice treated with rhFGF19 showed decreased gene expression in bile acid synthesis pathways. However, acute or long-term administration of FGF21 showed different results on Cyp7a1 gene expression. Although the acute administration of FGF21 dose-dependently inhibited the hepatic expression of Cyp7a1 in inbred mice and human primary hepatocytes, which is in line with the in vivo and in vitro findings of the present study, long-term administration resulted in the inhibition of Cyp7a1 expression only in mice treated with long-acting FGF21, but not in mice treated with rhFGF21. Moreover, despite the reduced hepatic Cyp7a1 expression at lower doses of rhFGF21 (0.3 mg/kg), mice treated with higher rhFGF21 doses (3 mg/kg) demonstrated elevated Cyp7a1 levels, suggesting a potential feedback mechanism between FGF21 and Cyp7a1 expression depending on dose and exposure [21]. In another recent study, in which a different mechanism of action for FGF21 on bile acid metabolism was suggested, Zhang et al. [22] proposed that the overexpression of FGF21 regulates bile acid homeostasis by antagonizing FGF15/19 function on the liver βKlotho/FGFR4 receptor complex, resulting in the inhibition of FGF15-mediated Cyp7a1 downregulation. The study showed the induction of Cyp7a1 and Cyp27a1 expression through FGF21 overexpression. Interestingly, in both studies, the upregulation of Cyp7a1 levels was observed with the long-term administration of high doses of FGF21. Indeed, the method of FGF21 overexpression that was used by Zhang et al. [22] was through delivery of the Fgf21 gene by a recombinant adeno-associated virus (AAV) approach that might result in higher doses of FGF21, as well as longer-acting effects, as compared to alcohol-induced FGF21 effects. Despite the induced expression of Cyp7a1 through chronic FGF21 treatment, the results of the acute administration showed a decrease in Cyp7a1 levels at 2 and 5 h post-injection, without any difference in Fgf15 expression [22], pointing to a potential feedback mechanism between FGF21 and Cyp7a1 to maintain bile acid homeostasis, which might depend on the level and duration of action of FGF21. FGF21 itself has been shown to be hepatoprotective previously [15,18,19,20]. This hepatoprotective role may be carried out by maintaining bile acid homeostasis through regulation of Cyp7a1 by FGF21, as CYP7A1 is the rate-limiting enzyme in the classical pathway of bile acid synthesis. In this regard, a study performed by Donepudi et al. [31] reported alcohol-induced downregulation of Cyp7a1 and a hepatoprotective role in Cyp7a1 transgenic mice. Similar to the current study, mice were challenged with the NIAAA chronic plus binge ethanol feeding method [8]. Although FGF21 was not evaluated, a marked suppression of hepatic Cyp7a1 levels in alcohol-challenged mice compared with their pair-fed controls were reported, together with aggravated liver injury and inflammation, as well as increased bile acid pool size. These results were in line with ours except for the gender-dependent finding that Cyp7a1 downregulation was observed in female mice only, whereas the expression was not altered in male mice. In our model, a marked downregulation of hepatic Cyp7a1 was observed after EtOH challenge in both female and male mice, but, interestingly, 7αOHC was significantly suppressed only in female AALD patients with ongoing EtOH abuse (Figure 9B). Taking the possible relevant and direct role of sex hormones on bile acid metabolism into account [45], these differences between genders might depend on the fluctuations of female sex hormone levels.
In addition to alcohol, the induction of FGF21 expression has also been reported in response to glucocorticoids [46]. Of note, instead of a distinct trigger, the study proposed an effector mechanism of FGF21, in which a counterbalanced mechanism, including Cyp7a1 repression through upregulated FGF21, occurs in a PPARα-dependent manner, irrespective of the FXR/FGF15 pathway. The study also reported that the in vitro downregulation of Cyp7a1 occurs by the inhibition of the transcriptional activity through an FGF21-mediated autocrine signal, which might explain the direct effect of FGF21 on the suppression of Cyp7a1 expression observed in our in vitro experiment. Besides, the suggested mechanism also involves the upregulation of PPARα and IL-6 in line with the findings in our model [2], pointing to a similar mechanism of action for FGF21 even with different acute stimuli such as steroids and alcohol. In order to investigate the effect of alcohol on FGF21 downstream factors, the mTORC1 pathway, which promotes hepatic lipogenesis by activating SREBP1 [47], was evaluated. However, no difference between the study groups was observed for expression levels of the Mtor and Srebf1/Srebp1c genes. Moreover, the ratio of phosphorylated to total mTOR protein, which points to the activity [48], did not differ between groups, indicating that this downstream pathway is not affected by alcohol-induced FGF21 signaling (Figure 2F).
Higher plasma and gallbladder bile acid levels were observed in mice with alcoholic liver disease as compared to their controls. Although this upregulation was neither significant in plasma nor in the gallbladder, an increased TBA concentration points to alcohol-induced intrahepatic cholestasis. Moreover, higher plasma TBA levels in KO-Cont mice in comparison to WT-Cont mice are consistent with the phenotypes of Abcb4/ mice, which develop cholestasis due to the deficiency of hepatobiliary phosphatidylcholine transport [11]. Increased bile acid levels are observed despite the repression of hepatic genes involved in bile acid synthesis. Similarly, Donepudi et al. [24] reported that chronic plus binge ethanol feeding in mice resulted in increased intestinal bile acid contents and total bile acid pooled together with suppressed bile acid synthesis genes. Although the underlying mechanisms are yet to be dissected, changes in the enterohepatic circulation of bile acids upon alcohol exposure might play a role, as alcohol represses bile acid uptake by sodium taurocholate cotransporting peptide (NTCP) while inducing bile acid efflux systems such as the bile salt export pump (ABCB11) [27,28,49]. Similarly, pre-established, EtOH-induced cholestatic liver injury with elevated serum TBA levels has been reported previously in patients with AALD and ongoing alcohol consumption as compared to healthy subjects [50,51]. Total cholesterol serum levels were slightly reduced, while a mild elevation of triglyceride levels was observed, which is an expected pattern considering the impact of EtOH on lipid metabolism [52].
Although the hepatic steady-state mRNA levels of the bile acids synthesis enzymes do not completely reflect their activities, we evaluated the hepatic expression of Cyp7a1, Cyp8b1, and Cyp27a1. Among these genes, the downregulation of Cyp7a1 and Cyp27a1 was found to be alcohol-dependent irrespective of the mouse genotype. However, a significant suppression of Cyp8b1 upon EtOH challenge was observed in Abcb4/ knock-out mice only, emphasizing the importance of established chronic liver injury in the presence of acute insult, as it is the case in our ACLI model. In a recent study, Wang et al. [53] reported seven genes that may serve as potential prognostic biomarkers for HCC, showing a significant downregulation as compared to normal human liver tissue. Among these genes, CYP8B1 was suggested to be involved in tumor initiation and development. Therefore, the downregulation of Cyp8b1 in the ACLI model might trigger harmful consequences during liver disease progression, further increasing the known risk of HCC in Abcb4/ mice [54]. Similar to Cyp8b1, the observed decrease in expression of hepatic Klb only in the KO-EtOH group, might suggest the modulating effect of pre-injured liver in ACLI. Despite the studies supporting its role in tumorigenesis [55,56], its exact role in ACLI needs further investigation.
Bile acid composition differs in various chronic liver diseases [57]. To better understand the mechanisms that regulate bile acid metabolism, we analyzed the bile acid composition in both human and mouse plasma samples. In the current preclinical ACLI mouse model, the bile acid pool showed higher MCA and lower CA and CDCA contents, consistent with a shift toward the alternative bile acid synthesis pathway. Indeed, in this model, a significant repression of hepatic Cyp8b1 and Cyp7a1 levels was observed, although the Cyp27a1 expression was also reduced, but this enzyme is expressed in various tissues and is not rate-limiting. Cyp8b1 is negatively regulated by bile acids [58], with CDCA inducing the negative nuclear receptor SHP [59,60] and MCA representing an antagonist of the central bile acid sensor FXR [61]. However, in our study, Shp and Fxr gene expression did not differ in the KO-EtOH group, and other feedback mechanisms have yet to be determined. Although there are several differences between humans and mice regarding BA metabolism [62], in the current study, AALD patients showed increased bile acid concentrations and decreased secondary bile acids levels, which is in line with the ACLI mouse model. The decreased levels of hydrophobic bile acids are consistent with recent findings by Sugita et al. [57] and may reflect the impairment of bile excretion.
In summary, the current study suggests that chronic plus binge alcohol-induced FGF21 suppresses the gene encoding the bile acid synthesis rate-limiting enzyme Cyp7a1, independent of the FXR-SHP or FGF15/FGFR4 pathways. Although the interaction between FGF21 and CYP7A1 in specific settings remain to be defined, the observed upregulation of FGF21 and suppression of Cyp7a1 were preserved in the context of pre-existing liver injury. The role of these differential expression levels will be the subject of future research.

4. Materials and Methods

4.1. Mouse Model

Fifteen-week-old C57BL/6J wild-type (WT, n = 56) and Abcb4 knock-out (KO) mice (Abcb4−/−, n = 56) housed in a temperature- and humidity-controlled facility with a 12 h light and 12 h dark cycle were included in the study. Mice were either fed a control diet (WT-Cont and KO-Cont groups; n = 28 per group) or ethanol diet (WT-EtOH and KO-EtOH groups; n = 28 per group), with equal numbers of female and male mice in each group. In our recently established ACLI model [2], the Abcb4−/− mouse model was combined with a standardized chronic plus binge ethanol feeding model (NIAAA model) by the National Institute on Alcohol Abuse and Alcoholism (NIAAA) [8]. In this model, mice were first fed with an ad libitum liquid diet (Rodent liquid diet, Lieber-DeCarli ‘82, Bio-Serv, Frenchtown, NJ) for five days. At the end of the 5th day, mice were either fed with a control liquid diet or ethanol diet (Rodent liquid diet, Lieber-DeCarli ‘82-Ethanol, 4% v/v, Bio-Serv) for a period of 10 days, followed by isocaloric maltose dextrin gavage (9 g/kg of body weight) or by an acute ethanol binge (4 g/kg of body weight), respectively. Mice were sacrificed 7–9 h after gavage, and plasma samples were prepared from whole blood collected from the inferior vena cava. Liver and intestine tissue samples were frozen in liquid nitrogen and stored at −80 °C. Bile collected from the gallbladder was stored at −20 °C. All experiments were performed in accordance with the relevant regulations and the Animal Care and Use Committee of Saarland University and were approved by Saarland University Animal Ethics Committee (TV 44/2015, date 22.09.2015 and TV 06/2019, date 04.02.2019).

4.2. Human Subjects

Blood samples were collected from volunteer patients with alcohol-associated liver disease (AALD) (n = 31, 24 men, 7 women) and healthy controls (n = 27, 14 men, 13 women) who provided their written informed consent. General clinical characteristics of the human study groups are given in Supplementary Table S1. The patients with alcoholic cirrhosis were recruited after hospital admission due to decompensation and admitted ongoing alcohol consumption (30–100 g EtOH daily) for at least one week prior to hospitalization. As the precise amount of EtOH intake could not be accurately defined, we measured carbohydrate-deficient transferrin (CDT) as a biochemical indicator for the relative amount of alcohol intake [34]. None of the healthy control volunteers had a history of acute or chronic liver disease. Healthy control subjects did not consume alcohol for at least three days before the day of blood collection. All healthy controls presented with normal body mass index (BMI) and glycated hemoglobin (HbA1c) levels (Supplementary Table S1). The study was approved by the Ethics Committee of Saarland Medical Board (approval number 271/11, date 16.10.2018).

4.3. Analysis of Plasma Biochemical Markers

Carbohydrate-deficient transferrin (CDT) was measured using the Siemens N Latex CDT kit (BNII; Siemens Healthcare Diagnostics, Erlangen, Germany). Alanine aminotransferase (ALT) and aspartate aminotransferase (AST) activities and ethanol (EtOH) levels were determined in plasma (Cobas 8000 c702 modular analyzer; Roche Diagnostics, Mannheim, Germany) in the Central Laboratory of Saarland University Medical Center.

4.4. Histology

Hepatic collagen accumulation was assessed by the collagen-specific amino acid hydroxyproline (Hyp) content and Sirius red histochemistry [63]. Inflammation in the liver was evaluated by hematoxylin-eosin (H&E) staining. For histopathological analysis, paraffin-embedded, 5 μm-thick formalin-fixed (4% v/v) liver sections were used [63]. Quantification of liver fibrosis and assessment of inflammation were performed using a histomorphometric semi-automatic system for image analysis (Leica microscope, equipped with Leica application suite software; Wetzlar, Germany) [2]. For each Sirius red-stained liver section, five randomly chosen microscopic areas were evaluated to calculate the percentage of collagenous areas. Photometric measurement of Hyp was performed by a protocol adapted from Jamall et al. [64].

Immunohistochemistry (IHC)

Paraffin-embedded liver tissue sections were stained for CD4 (Abcam; Cambridge, UK), CD11b (Abcam), CD45 (Biolegend; San Diego, CA, USA), and F4/80 (Abcam) to identify the inflammatory infiltrates. Deparaffinisation was performed in a descending alcohol series. Ten micromoles of citrate buffer (pH 6.0) in a microwave oven (600 W, 15 min) was used for antigen retrieval. Samples were then incubated for 20 min in 3% (v/v) H2O2 in PBS to block the endogenous peroxidase. After blocking with an avidin and biotin system (Dako; Glostrup, Denmark), sections were washed thrice with PBS, followed by overnight at 4 °C (for CD45 and CD4) and 1 h at 37 °C (for CD11b and F4/80) incubations with the primary antibody (1:100, 1:4000, 1:1000, and 1:400 dilutions in 2% (w/v) milk powder in PBS for CD45, CD4, CD11b, and F4/80, respectively). Afterward, sections were treated with secondary antibody (biotinylated-goat anti-rabbit, 1:100 diluted in 2% (w/v) milk powder in PBS) and ABC complex (Vectastain; Vector Laboratories, Burlingam, CA, USA). Nuclei staining was performed by counter-staining with Mayer’s hematoxylin as final step.

4.5. Determination of Plasma FGF15/FGF19 and FGF21 Levels

Plasma levels of FGF21 and FGF15 were measured in mice by the FGF-21 Quantikine ELISA kit (MF2100; R&D Systems, Minneapolis, MN, USA) and mouse FGF15 ELISA kit (RD-FGF15-Mu; Reddot Biotech, Kelowna, BC, Canada), respectively. For human plasma samples, the FGF-21 Quantikine ELISA kit (DF2100; R&D Systems) and FGF-19 Quantikine ELISA kit (DF1900; R&D Systems) were used. The experiments were carried out in duplicates, and average values were used for analysis.

4.6. RNA Isolation and Quantitative Real-Time PCR Analysis

Total RNA was isolated from frozen liver samples using the RNeasy Mini kit (Qiagen, Hilden, Germany). For ileum tissue and primary mouse hepatocyte cell culture experiments, peqGold Microspin Total RNA kit (VWR International, Erlangen, Germany) was used. Isolated total RNA was reverse-transcribed using the High-Capacity cDNA Reverse Transcription kit (Life Technologies, Carlsbad, CA, USA). The cDNA was amplified in 96-well plates using TaqMan® Fast Universal PCR Master Mix (2×) (Applied Biosystems/Thermo Scientific, Foster City, CA, USA) on a Taqman 7500 Fast Real-Time PCR System. Ready-to-use TaqMan gene expression assays (Applied Biosystems/Thermo Scientific) were used for the evaluation of hepatic steady-state mRNA levels of Sterol regulatory element binding transcription factor 1 (Srebf1/Srebp1c, Mm00550338_m1), Fibroblast growth factor receptor 4 (Fgfr4, Mm01341852_m1), Fibroblast growth factor receptor 1 (Fgfr1, Mm00438930_m1), Cytochrome P450 family 7 subfamily A member 1 (Cyp7a1, Mm00484150_m1), Fibroblast growth factor 21 (Fgf21, Mm00840165_m1), Farnesoid X-activated receptor (Fxr/Nr1h4, Mm00436425_m1), β-Klotho (Klb, Mm00473122_m1), Mechanistic target of rapamycin (Mtor, Mm00444968_m1), Peroxisome proliferator activated receptor-α (Ppar-a, Mm00440939_m1), Small heterodimer partner (Shp/Nr0b2, Mm00442278_m1), Cytochrome P450 family 27 subfamily A member 1 (Cyp27a1, Mm00470430_m1), and Cytochrome P450 family 8 subfamily B member 1 (Cyp8b1, Mm00501637_s1) genes, as well as ileal mRNA levels of Fxr, MAM, and LDL receptor class A domain containing 1-Diet1 (Malrd1/Diet1, Cg04494263_m1), and Fibroblast growth factor 15 (Fgf15, Mm00433278_m1) genes. Relative changes in the expression of genes were evaluated using the ΔΔCt algorithm, with Glyceraldehyde-3-phosphate dehydrogenase (Gapdh, Mm99999915_g1) as an internal control.

4.7. Western Blot Analysis

Mouse liver tissues (two randomly selected mice per group) were homogenized in lysis buffer (Tris-HCl 100 mmol/L, sodium dodecyl sulfate (SDS) 4%, glycine 20%) that contains complete protease inhibitors (cOmplete; Roche, Mannheim, Germany) and 1 mM of phenylmethylsulfonyl fluoride, and centrifuged at 16,000× g for 10 min. Isolated protein was quantified based on the method of Bradford [65], and 50 µg of protein was loaded in each well. Proteins were separated by 10% SDS-PAGE and transblotted onto nitrocellulose membranes (0.2 µm pore size, Schleicher and Schuell, Dassel, Germany). Blots were blocked in Tris-buffered saline containing 5% non-fat dry milk for 2 h at room temperature and incubated overnight at 4 °C with the following primary antibodies: anti-glyceraldehyde-3-phosphate dehydrogenase (GAPDH; MAB374, Millipore; Burlington, MA, USA), anti-CYP7A1 (ab65596, Abcam), anti-FGF21 (ab171941, Abcam), anti-FXR (#PA5-40755, Invitrogen), anti-mTOR (#2972, Cell Signaling Technology), and anti-phospho-mTOR–Ser2448 (#2971, Cell Signaling Technology). Blots were then incubated with respective secondary antibodies (anti-mouse #A5278 or anti-rabbit #A6154, Sigma, St. Louis, MO, USA) for 1 h at room temperature and were visualized by enhanced chemiluminescence (ECL, Amersham Biosciences; Buckinghamshire, UK). Quantification was performed using the Fusion SL gel documentation system (PEQLAB, Erlangen, Germany). All data are presented as intensity optical density (IOD).

4.8. Total Bile Acid Measurements in Mouse Plasma and Bile

Gallbladder bile was collected from a total of 37 mice (11 WT-Cont, 11 WT-EtOH, 9 KO-Cont, and 6 KO-EtOH). Total bile acid (TBA) concentrations were determined by an enzymatic colorimetric kit (BI 3863; Randox Laboratories, Wülfrath, Germany). The taurocholic acid standard was prepared from powdered taurocholic acid in methanol and stored at −20 °C. Bile acid standard solution was used in different dilution series for gallbladder (range 5–160 µM) and plasma samples (range 0.5–60 µM). Each sample was studied in duplicates, and average values were used for analysis. Two absorption measurements were carried out in a microplate reader at 405 nm at times t0 and t1 (i.e., two minutes later than t0). The difference in absorbance E(t1)-E(t0) is considered to be proportional to the bile acid concentration. The proportionality factor corresponded to the slope of the standard dilution curve.

4.9. Bile Acid Profiling in Human and Murine Plasma Samples

Bile acid profiling was performed using plasma samples of male mice and humans (randomly selected 3 samples/groups). An aliquot of human or murine plasma was incubated for one hour at 90 °C or for 2 h, respectively, using a strong alkaline hydrolysis in order to deconjugate the individual bile acids. After separation from the neutral sterols such as cholesterol and noncholesterol sterols by cyclohexane, the free bile acids were extracted after neutralization of the hydrophilic layer by diethyl ether. After evaporation of the solvents, the free bile acids were conjugated into methyl esters and trimethylsilyl ethers together with the internal standard, hyodeoxycholic acid. The plasma concentrations were quantified using gas chromatography–mass spectrometry–selected ion monitoring (GC-MS-SIM), as described previously [66]. In comparison to the bile acid analysis of human plasma samples (primary bile acids: cholic acid [CA] and chenodeoxycholic acid [CDCA], secondary bile acids: deoxycholic acid [DCA], lithocholic acid [LCA], and ursodeoxycholic acid [UDCA]) in murine plasma samples, we additionally determined α- and β-muricholic acid.

4.10. Enzymatic Tests for the Analysis of Serum Total Bile Acid and Cholesterol Levels in Humans

Serum total bile acid (TBA) concentrations were measured using the LT-SYS® Gallensäuren test (LT-SYS Diagnostics; Berlin, Germany) with a Randox-Calibrator Cal 2351 and total cholesterol concentrations were measured by an enzymatic colorimetric determination assay using the Cholesterol Gen.2 (Cobas; Roche Diagnostics). Experiments were performed in the Central Laboratory of Saarland University Medical Center.

4.11. Quantification of Human and Murine Serum Concentrations of Total Cholesterol and Oxysterols Using Gas-Chromatography Analyses

Neutral sterols (cholesterol and noncholesterol sterols) and the oxysterols 7α- and 27-hydroxycholesterol (7α-OHC and 27-OHC, respectively) were extracted by cyclohexane in its free form after deconjugation of the fatty acid esterified sterols/oxysterols by alkaline hydrolysis. After conjugation into the corresponding trimethylsilyl ethers, serum total cholesterol was quantified by gas chromatography–flame ionization detection (GC-FID) using 5α-cholestane as an internal standard [67,68]. Serum concentrations of 7α-OHC and 27-OHC were quantified by the isotope dilution GC–mass spectrometry–selected ion monitoring (MS-SIM) methodology, using the corresponding deuterium-labeled oxysterols as internal standards [68].

4.12. Primary Mouse Hepatocyte Isolation, Culture, and Treatment

Primary mouse hepatocytes (HC) were isolated from C57BL/6J mice (8–15 week old) by the collagenase perfusion method [69]. Cell viability was assessed by trypan blue exclusion. Isolated primary HC were then seeded in 6-well collagen-I-coated (collagen from rat tail; Sigma-Aldrich, St. Louis, MO, USA) cell culture plates at a density of 3 × 10⁵ viable cells per well and incubated in 5% CO2 at 37 °C for four hours. After attachment of the cells by incubation with medium 1 (Williams’ medium E supplemented with 10% fetal bovine serum (FBS), 2 mM of L-glutamine, 1% penicillin/streptomycin, and 100 nM of dexamethasone), medium 1 was changed to medium 2 (medium 1 without FBS) for serum starvation and cell cycle synchronization. After 20 h, cells were treated with or without graded concentrations of recombinant human FGF21 (rhFGF21) (0.1, 0.25, 0.5, and 1 µg/mL; R&D Systems) in medium 3 (Williams’ medium E supplemented with 2 mM of L-glutamine and 1% penicillin/streptomycin) for 24 h. The cells were then harvested for RNA extraction and gene expression analysis. PBS was included as a control. Experiments were performed in triplicates, and each experiment was repeated three times.

4.13. Statistical Analysis

Statistical analysis was performed using SPSS v27.0 (IBM; Armonk, NY, USA) and GraphPad Prism 8 (GraphPad; San Diego, CA, USA). The normal distribution was first checked via the Kolmogorov–Smirnov test. The one-way ANOVA test was used for the normally distributed variables, and the Kruskal–Wallis test was used with data showing nonparametric distribution. A post hoc test with Bonferroni correction was performed when there were significant differences between the groups. A Student’s t-test was conducted for the two normally distributed variables as indicated. All results are shown in median, +max/−min. A p-value of <0.05 was considered statistically significant.

Supplementary Materials

Supplementary material are available online at https://www.mdpi.com/article/10.3390/ijms22157898/s1.

Author Contributions

Conceptualization, G.C., E.K. and S.C.K.; methodology, G.C., E.K., S.N.W., S.Q. and M.H.; validation, S.C.K., E.K., D.L., U.B. and F.L.; formal analysis, S.C.K., E.K. and S.Q.; investigation, G.C., E.K., R.A.H., S.N.W.; resources, M.C.R. and F.L.; data curation, S.C.K., E.K.; writing—original draft preparation, G.C., E.K. and S.C.K.; writing—review and editing, M.C.R., S.C.K., D.L., U.B. and F.L.; visualization, G.C. and S.C.K.; supervision, F.L. and S.C.K.; project administration, S.C.K.; funding acquisition, S.C.K. and F.L. All authors have read and agreed to the published version of the manuscript.

Funding

This study was supported by the German Federal Ministry of Education and Research (BMBF) grant Liver Systems Medicine (LiSyM 031L0051).

Institutional Review Board Statement

The study was conducted according to the guidelines of the Declaration of Helsinki, and approved by the Animal Ethics Committee of Saarland University (TV 44/2015, date 22.09.2015 and TV 06/2019, date 04.02.2019) and the Ethics Committee of Saarland Medical Board (approval number 271/11, date 16.10.2018).

Informed Consent Statement

Informed consent was obtained from all subjects involved in the study.

Acknowledgments

The authors gratefully acknowledge the participants in this study; Christina Meng at the Central Laboratory, Saarland University Medical Center, for analyzing biochemical parameters and ethanol concentrations in plasma; Ute Kemnade and Birgit Scheidweiler, the study nurses at the Department of Medicine II, Saarland University Medical Center, for taking blood samples from human volunteers; Irina Nowak for the technical assistance, Anja Kerksiek and Silvia Friedrichs for GC-FID and GC-MS analytics of sterol, oxysterols, and bile acids; and Roja Barikbin and Daniel Goldenberg, who kindly provided the Abcb4-deficient mice on the C57BL/6J background.

Conflicts of Interest

The authors have declared that no conflict of interest exist.

References

  1. Miller, A.M.; Horiguchi, N.; Jeong, W.I.; Radaeva, S.; Gao, B. Molecular mechanisms of alcoholic liver disease: Innate immunity and cytokines. Alcohol. Clin. Exp. Res. 2011, 35, 787–793. [Google Scholar] [CrossRef]
  2. Karatayli, E.; Hall, R.A.; Weber, S.N.; Dooley, S.; Lammert, F. Effect of alcohol on the interleukin 6-mediated inflammatory response in a new mouse model of acute-on-chronic liver injury. Biochim. Biophys. Acta. Mol. Basis Dis. 2019, 1865, 298–307. [Google Scholar] [CrossRef]
  3. Moreau, R.; Jalan, R.; Gines, P.; Pavesi, M.; Angeli, P.; Cordoba, J.; Durand, F.; Gustot, T.; Saliba, F.; Domenicali, M.; et al. Acute-on-chronic liver failure is a distinct syndrome that develops in patients with acute decompensation of cirrhosis. Gastroenterology 2013, 144, 1426–1437.e9. [Google Scholar] [CrossRef]
  4. Arteel, G.E. Animal models of alcoholic liver disease. Dig. Dis. 2010, 28, 729–736. [Google Scholar] [CrossRef] [PubMed]
  5. Hyun, J.; Han, J.; Lee, C.; Yoon, M.; Jung, Y. Pathophysiological Aspects of Alcohol Metabolism in the Liver. Int. J. Mol. Sci. 2021, 22, 5717. [Google Scholar] [CrossRef] [PubMed]
  6. Lieber, C.S.; DeCarli, L.M. The feeding of ethanol in liquid diets. Alcohol. Clin. Exp. Res. 1986, 10, 550–553. [Google Scholar] [CrossRef]
  7. Wilkin, R.J.; Lalor, P.F.; Parker, R.; Newsome, P.N. Murine Models of Acute Alcoholic Hepatitis and Their Relevance to Human Disease. Am. J. Pathol. 2016, 186, 748–760. [Google Scholar] [CrossRef] [Green Version]
  8. Bertola, A.; Mathews, S.; Ki, S.H.; Wang, H.; Gao, B. Mouse model of chronic and binge ethanol feeding (the NIAAA model). Nat. Protoc. 2013, 8, 627–637. [Google Scholar] [CrossRef] [Green Version]
  9. Bertola, A.; Park, O.; Gao, B. Chronic plus binge ethanol feeding synergistically induces neutrophil infiltration and liver injury in mice: A critical role for E-selectin. Hepatology 2013, 58, 1814–1823. [Google Scholar] [CrossRef] [Green Version]
  10. Fickert, P.; Fuchsbichler, A.; Wagner, M.; Zollner, G.; Kaser, A.; Tilg, H.; Krause, R.; Lammert, F.; Langner, C.; Zatloukal, K.; et al. Regurgitation of bile acids from leaky bile ducts causes sclerosing cholangitis in Mdr2 (Abcb4) knockout mice. Gastroenterology 2004, 127, 261–274. [Google Scholar] [CrossRef]
  11. Smit, J.J.; Schinkel, A.H.; Oude Elferink, R.P.; Groen, A.K.; Wagenaar, E.; van Deemter, L.; Mol, C.A.; Ottenhoff, R.; van der Lugt, N.M.; van Roon, M.A.; et al. Homozygous disruption of the murine mdr2 P-glycoprotein gene leads to a complete absence of phospholipid from bile and to liver disease. Cell 1993, 75, 451–462. [Google Scholar] [CrossRef]
  12. Ruiz-Margáin, A.; Pohlmann, A.; Ryan, P.; Schierwagen, R.; Chi-Cervera, L.A.; Jansen, C.; Mendez-Guerrero, O.; Flores-García, N.C.; Lehmann, J.; Torre, A.; et al. Fibroblast growth factor 21 is an early predictor of acute-on-chronic liver failure in critically ill patients with cirrhosis. Liver Transplant. 2018, 24, 595–605. [Google Scholar] [CrossRef] [PubMed] [Green Version]
  13. Schumann, G.; Liu, C.; O’Reilly, P.; Gao, H.; Song, P.; Xu, B.; Ruggeri, B.; Amin, N.; Jia, T.; Preis, S.; et al. KLB is associated with alcohol drinking, and its gene product β-Klotho is necessary for FGF21 regulation of alcohol preference. Proc. Natl. Acad. Sci. USA 2016, 113, 14372–14377. [Google Scholar] [CrossRef] [Green Version]
  14. Søberg, S.; Andersen, E.S.; Dalsgaard, N.B.; Jarlhelt, I.; Hansen, N.L.; Hoffmann, N.; Vilsbøll, T.; Chenchar, A.; Jensen, M.; Grevengoed, T.J.; et al. FGF21, a liver hormone that inhibits alcohol intake in mice, increases in human circulation after acute alcohol ingestion and sustained binge drinking at Oktoberfest. Mol. Metab. 2018, 11, 96–103. [Google Scholar] [CrossRef]
  15. Talukdar, S.; Owen, B.M.; Song, P.; Hernandez, G.; Zhang, Y.; Zhou, Y.; Scott, W.T.; Paratala, B.; Turner, T.; Smith, A.; et al. FGF21 Regulates Sweet and Alcohol Preference. Cell Metab. 2016, 23, 344–349. [Google Scholar] [CrossRef] [PubMed] [Green Version]
  16. Von Holstein-Rathlou, S.; Gillum, M.P. Fibroblast growth factor 21: An endocrine inhibitor of sugar and alcohol appetite. J. Physiol. 2019, 597, 3539–3548. [Google Scholar] [CrossRef] [Green Version]
  17. Song, P.; Zechner, C.; Hernandez, G.; Cánovas, J.; Xie, Y.; Sondhi, V.; Wagner, M.; Stadlbauer, V.; Horvath, A.; Leber, B.; et al. The Hormone FGF21 Stimulates Water Drinking in Response to Ketogenic Diet and Alcohol. Cell Metab. 2018, 27, 1338–1347.e4. [Google Scholar] [CrossRef] [Green Version]
  18. Fisher, F.M.; Chui, P.C.; Nasser, I.A.; Popov, Y.; Cunniff, J.C.; Lundasen, T.; Kharitonenkov, A.; Schuppan, D.; Flier, J.S.; Maratos-Flier, E. Fibroblast growth factor 21 limits lipotoxicity by promoting hepatic fatty acid activation in mice on methionine and choline-deficient diets. Gastroenterology 2014, 147, 1073–1083.e6. [Google Scholar] [CrossRef] [Green Version]
  19. Desai, B.N.; Singhal, G.; Watanabe, M.; Stevanovic, D.; Lundasen, T.; Fisher, F.M.; Mather, M.L.; Vardeh, H.G.; Douris, N.; Adams, A.C.; et al. Fibroblast growth factor 21 (FGF21) is robustly induced by ethanol and has a protective role in ethanol associated liver injury. Mol. Metab. 2017, 6, 1395–1406. [Google Scholar] [CrossRef]
  20. Ye, D.; Wang, Y.; Li, H.; Jia, W.; Man, K.; Lo, C.M.; Wang, Y.; Lam, K.S.; Xu, A. Fibroblast growth factor 21 protects against acetaminophen-induced hepatotoxicity by potentiating peroxisome proliferator-activated receptor coactivator protein-1α-mediated antioxidant capacity in mice. Hepatology 2014, 60, 977–989. [Google Scholar] [CrossRef]
  21. Chen, M.M.; Hale, C.; Stanislaus, S.; Xu, J.; Véniant, M.M. FGF21 acts as a negative regulator of bile acid synthesis. J. Endocrinol. 2018, 237, 139–152. [Google Scholar] [CrossRef]
  22. Zhang, J.; Gupte, J.; Gong, Y.; Weiszmann, J.; Zhang, Y.; Lee, K.J.; Richards, W.G.; Li, Y. Chronic Over-expression of Fibroblast Growth Factor 21 Increases Bile Acid Biosynthesis by Opposing FGF15/19 Action. EBioMedicine 2017, 15, 173–183. [Google Scholar] [CrossRef] [Green Version]
  23. Chiang, J.Y. Bile acids: Regulation of synthesis. J. Lipid Res. 2009, 50, 1955–1966. [Google Scholar] [CrossRef] [Green Version]
  24. Chiang, J.Y. Bile acid metabolism and signaling. Compr. Physiol. 2013, 3, 1191–1212. [Google Scholar] [CrossRef] [Green Version]
  25. Russell, D.W. Fifty years of advances in bile acid synthesis and metabolism. J. Lipid Res. 2009, 50, S120–S125. [Google Scholar] [CrossRef] [PubMed] [Green Version]
  26. Chanda, D.; Kim, Y.H.; Li, T.; Misra, J.; Kim, D.K.; Kim, J.R.; Kwon, J.; Jeong, W.I.; Ahn, S.H.; Park, T.S.; et al. Hepatic cannabinoid receptor type 1 mediates alcohol-induced regulation of bile acid enzyme genes expression via CREBH. PLoS ONE 2013, 8, e68845. [Google Scholar] [CrossRef] [PubMed] [Green Version]
  27. Wu, W.; Zhu, B.; Peng, X.; Zhou, M.; Jia, D.; Gu, J. Activation of farnesoid X receptor attenuates hepatic injury in a murine model of alcoholic liver disease. Biochem. Biophys. Res. Commun. 2014, 443, 68–73. [Google Scholar] [CrossRef] [PubMed]
  28. Xie, G.; Zhong, W.; Li, H.; Li, Q.; Qiu, Y.; Zheng, X.; Chen, H.; Zhao, X.; Zhang, S.; Zhou, Z.; et al. Alteration of bile acid metabolism in the rat induced by chronic ethanol consumption. FASEB J. 2013, 27, 3583–3593. [Google Scholar] [CrossRef] [PubMed] [Green Version]
  29. Massimi, M.; Lear, S.R.; Huling, S.L.; Jones, A.L.; Erickson, S.K. Cholesterol 7alpha-hydroxylase (CYP7A): Patterns of messenger RNA expression during rat liver development. Hepatology 1998, 28, 1064–1072. [Google Scholar] [CrossRef]
  30. Liang, H.; Huang, H.; Tan, P.Z.; Liu, Y.; Nie, J.H.; Zhang, Y.T.; Zhang, K.L.; Diao, Y.; He, Q.; Hou, B.Y.; et al. Effect of iron on cholesterol 7α-hydroxylase expression in alcohol-induced hepatic steatosis in mice. J. Lipid Res. 2017, 58, 1548–1560. [Google Scholar] [CrossRef] [Green Version]
  31. Donepudi, A.C.; Ferrell, J.M.; Boehme, S.; Choi, H.S.; Chiang, J.Y.L. Deficiency of cholesterol 7α-hydroxylase in bile acid synthesis exacerbates alcohol-induced liver injury in mice. Hepatol. Commun. 2018, 2, 99–112. [Google Scholar] [CrossRef]
  32. Inagaki, T.; Choi, M.; Moschetta, A.; Peng, L.; Cummins, C.L.; McDonald, J.G.; Luo, G.; Jones, S.A.; Goodwin, B.; Richardson, J.A.; et al. Fibroblast growth factor 15 functions as an enterohepatic signal to regulate bile acid homeostasis. Cell Metab. 2005, 2, 217–225. [Google Scholar] [CrossRef] [Green Version]
  33. Lu, T.T.; Makishima, M.; Repa, J.J.; Schoonjans, K.; Kerr, T.A.; Auwerx, J.; Mangelsdorf, D.J. Molecular basis for feedback regulation of bile acid synthesis by nuclear receptors. Mol. Cell 2000, 6, 507–515. [Google Scholar] [CrossRef]
  34. Holt, J.A.; Luo, G.; Billin, A.N.; Bisi, J.; McNeill, Y.Y.; Kozarsky, K.F.; Donahee, M.; Wang, D.Y.; Mansfield, T.A.; Kliewer, S.A.; et al. Definition of a novel growth factor-dependent signal cascade for the suppression of bile acid biosynthesis. Genes Dev. 2003, 17, 1581–1591. [Google Scholar] [CrossRef] [Green Version]
  35. Hochrath, K.; Ehnert, S.; Ackert-Bicknell, C.L.; Lau, Y.; Schmid, A.; Krawczyk, M.; Hengstler, J.G.; Dunn, J.; Hiththetiya, K.; Rathkolb, B.; et al. Modeling hepatic osteodystrophy in Abcb4 deficient mice. Bone 2013, 55, 501–511. [Google Scholar] [CrossRef] [PubMed] [Green Version]
  36. Jamall, I.S.; Finelli, V.N.; Que Hee, S.S. A simple method to determine nanogram levels of 4-hydroxyproline in biological tissues. Anal. Biochem. 1981, 112, 70–75. [Google Scholar] [CrossRef]
  37. Bradford, M.M. A rapid and sensitive method for the quantitation of microgram quantities of protein utilizing the principle of protein-dye binding. Anal. Biochem. 1976, 72, 248–254. [Google Scholar] [CrossRef]
  38. Lütjohann, D.; Hahn, C.; Prange, W.; Sudhop, T.; Axelson, M.; Sauerbruch, T.; von Bergmann, K.; Reichel, C. Influence of rifampin on serum markers of cholesterol and bile acid synthesis in men. Int. J. Clin. Pharmacol. Ther. 2004, 42, 307–313. [Google Scholar] [CrossRef]
  39. Mackay, D.S.; Jones, P.J.; Myrie, S.B.; Plat, J.; Lütjohann, D. Methodological considerations for the harmonization of non-cholesterol sterol bio-analysis. J. Chromatogr. B 2014, 957, 116–122. [Google Scholar] [CrossRef] [PubMed]
  40. Šošić-Jurjević, B.; Lütjohann, D.; Renko, K.; Filipović, B.; Radulović, N.; Ajdžanović, V.; Trifunović, S.; Nestorović, N.; Živanović, J.; Manojlović Stojanoski, M.; et al. The isoflavones genistein and daidzein increase hepatic concentration of thyroid hormones and affect cholesterol metabolism in middle-aged male rats. J. Steroid Biochem. Mol. Biol. 2019, 190, 1–10. [Google Scholar] [CrossRef] [PubMed] [Green Version]
  41. Klingmüller, U.; Bauer, A.; Bohl, S.; Nickel, P.J.; Breitkopf, K.; Dooley, S.; Zellmer, S.; Kern, C.; Merfort, I.; Sparna, T.; et al. Primary mouse hepatocytes for systems biology approaches: A standardized in vitro system for modelling of signal transduction pathways. Syst. Biol. 2006, 153, 433–447. [Google Scholar] [CrossRef] [Green Version]
  42. Markan, K.R.; Naber, M.C.; Ameka, M.K.; Anderegg, M.D.; Mangelsdorf, D.J.; Kliewer, S.A.; Mohammadi, M.; Potthoff, M.J. Circulating FGF21 is liver derived and enhances glucose uptake during refeeding and overfeeding. Diabetes 2014, 63, 4057–4063. [Google Scholar] [CrossRef] [PubMed] [Green Version]
  43. Inagaki, T.; Dutchak, P.; Zhao, G.; Ding, X.; Gautron, L.; Parameswara, V.; Li, Y.; Goetz, R.; Mohammadi, M.; Esser, V.; et al. Endocrine regulation of the fasting response by PPARalpha-mediated induction of fibroblast growth factor 21. Cell Metab. 2007, 5, 415–425. [Google Scholar] [CrossRef] [Green Version]
  44. Minard, A.Y.; Tan, S.X.; Yang, P.; Fazakerley, D.J.; Domanova, W.; Parker, B.L.; Humphrey, S.J.; Jothi, R.; Stöckli, J.; James, D.E. mTORC1 Is a Major Regulatory Node in the FGF21 Signaling Network in Adipocytes. Cell Rep. 2016, 17, 29–36. [Google Scholar] [CrossRef] [PubMed] [Green Version]
  45. Goodwin, B.; Jones, S.A.; Price, R.R.; Watson, M.A.; McKee, D.D.; Moore, L.B.; Galardi, C.; Wilson, J.G.; Lewis, M.C.; Roth, M.E.; et al. A regulatory cascade of the nuclear receptors FXR, SHP-1, and LRH-1 represses bile acid biosynthesis. Mol. Cell 2000, 6, 517–526. [Google Scholar] [CrossRef]
  46. Katafuchi, T.; Esterházy, D.; Lemoff, A.; Ding, X.; Sondhi, V.; Kliewer, S.A.; Mirzaei, H.; Mangelsdorf, D.J. Detection of FGF15 in plasma by stable isotope standards and capture by anti-peptide antibodies and targeted mass spectrometry. Cell Metab. 2015, 21, 898–904. [Google Scholar] [CrossRef] [PubMed] [Green Version]
  47. Lee, J.M.; Ong, J.R.; Vergnes, L.; de Aguiar Vallim, T.Q.; Nolan, J.; Cantor, R.M.; Walters, J.R.F.; Reue, K. Diet1, bile acid diarrhea, and FGF15/19: Mouse model and human genetic variants. J. Lipid Res. 2018, 59, 429–438. [Google Scholar] [CrossRef] [Green Version]
  48. Johansson, H.; Mörk, L.M.; Li, M.; Sandblom, A.L.; Björkhem, I.; Höijer, J.; Ericzon, B.G.; Jorns, C.; Gilg, S.; Sparrelid, E.; et al. Circulating Fibroblast Growth Factor 19 in Portal and Systemic Blood. J. Clin. Exp. Hepatol. 2018, 8, 162–168. [Google Scholar] [CrossRef]
  49. Lundåsen, T.; Gälman, C.; Angelin, B.; Rudling, M. Circulating intestinal fibroblast growth factor 19 has a pronounced diurnal variation and modulates hepatic bile acid synthesis in man. J. Intern. Med. 2006, 260, 530–536. [Google Scholar] [CrossRef]
  50. Hahn, C.; Reichel, C.; von Bergmann, K. Serum concentration of 7 alpha-hydroxycholesterol as an indicator of bile acid synthesis in humans. J. Lipid Res. 1995, 36, 2059–2066. [Google Scholar] [CrossRef]
  51. Wu, L.; Pan, Q.; Wu, G.; Qian, L.; Zhang, J.; Zhang, L.; Fang, Q.; Zang, G.; Wang, Y.; Lau, G.; et al. Diverse Changes of Circulating Fibroblast Growth Factor 21 Levels in Hepatitis B Virus-Related Diseases. Sci. Rep. 2017, 7, 16482. [Google Scholar] [CrossRef] [PubMed] [Green Version]
  52. Phelps, T.; Snyder, E.; Rodriguez, E.; Child, H.; Harvey, P. The influence of biological sex and sex hormones on bile acid synthesis and cholesterol homeostasis. Biol. Sex Differ. 2019, 10, 52. [Google Scholar] [CrossRef] [PubMed]
  53. Al-Aqil, F.A.; Monte, M.J.; Peleteiro-Vigil, A.; Briz, O.; Rosales, R.; González, R.; Aranda, C.J.; Ocón, B.; Uriarte, I.; de Medina, F.S.; et al. Interaction of glucocorticoids with FXR/FGF19/FGF21-mediated ileum-liver crosstalk. Biochim. Biophys. Acta. Mol. Basis Dis. 2018, 1864, 2927–2937. [Google Scholar] [CrossRef]
  54. Laplante, M.; Sabatini, D.M. mTORC1 activates SREBP-1c and uncouples lipogenesis from gluconeogenesis. Proc. Natl. Acad. Sci. USA 2010, 107, 3281–3282. [Google Scholar] [CrossRef] [Green Version]
  55. Bortolami, M.; Comparato, A.; Benna, C.; Errico, A.; Maretto, I.; Pucciarelli, S.; Cillo, U.; Farinati, F. Gene and protein expression of mTOR and LC3 in hepatocellular carcinoma, colorectal liver metastasis and "normal" liver tissues. PLoS ONE 2020, 15, e0244356. [Google Scholar] [CrossRef] [PubMed]
  56. Manley, S.; Ding, W. Role of farnesoid X receptor and bile acids in alcoholic liver disease. Acta Pharm. Sin. B 2015, 5, 158–167. [Google Scholar] [CrossRef] [Green Version]
  57. Trinchet, J.C.; Gerhardt, M.F.; Balkau, B.; Munz, C.; Poupon, R.E. Serum bile acids and cholestasis in alcoholic hepatitis. Relationship with usual liver tests and histological features. J. Hepatol. 1994, 21, 235–240. [Google Scholar] [CrossRef]
  58. Horvatits, T.; Drolz, A.; Roedl, K.; Rutter, K.; Ferlitsch, A.; Fauler, G.; Trauner, M.; Fuhrmann, V. Serum bile acids as marker for acute decompensation and acute-on-chronic liver failure in patients with non-cholestatic cirrhosis. Liver Transplant. 2017, 37, 224–231. [Google Scholar] [CrossRef]
  59. You, M.; Arteel, G.E. Effect of ethanol on lipid metabolism. J. Hepatol. 2019, 70, 237–248. [Google Scholar] [CrossRef] [Green Version]
  60. Wang, X.; Liao, X.; Yang, C.; Huang, K.; Yu, T.; Yu, L.; Han, C.; Zhu, G.; Zeng, X.; Liu, Z.; et al. Identification of prognostic biomarkers for patients with hepatocellular carcinoma after hepatectomy. Oncol. Rep. 2019, 41, 1586–1602. [Google Scholar] [CrossRef]
  61. Pikarsky, E.; Porat, R.M.; Stein, I.; Abramovitch, R.; Amit, S.; Kasem, S.; Gutkovich-Pyest, E.; Urieli-Shoval, S.; Galun, E.; Ben-Neriah, Y. NF-kappaB functions as a tumour promoter in inflammation-associated cancer. Nature 2004, 431, 461–466. [Google Scholar] [CrossRef]
  62. Poh, W.; Wong, W.; Ong, H.; Aung, M.O.; Lim, S.G.; Chua, B.T.; Ho, H.K. Klotho-beta overexpression as a novel target for suppressing proliferation and fibroblast growth factor receptor-4 signaling in hepatocellular carcinoma. Mol. Cancer 2012, 11, 14. [Google Scholar] [CrossRef] [PubMed] [Green Version]
  63. Ye, X.; Guo, Y.; Zhang, Q.; Chen, W.; Hua, X.; Liu, W.; Yang, Y.; Chen, G. βKlotho suppresses tumor growth in hepatocellular carcinoma by regulating Akt/GSK-3β/cyclin D1 signaling pathway. PLoS ONE 2013, 8, e55615. [Google Scholar] [CrossRef] [Green Version]
  64. Sugita, T.; Amano, K.; Nakano, M.; Masubuchi, N.; Sugihara, M.; Matsuura, T. Analysis of the serum bile Acid composition for differential diagnosis in patients with liver disease. Gastroenterol. Res. Pract. 2015, 2015, 717431. [Google Scholar] [CrossRef] [PubMed] [Green Version]
  65. Zhang, M.; Chiang, J.Y. Transcriptional regulation of the human sterol 12alpha-hydroxylase gene (CYP8B1): Roles of heaptocyte nuclear factor 4alpha in mediating bile acid repression. J. Biol. Chem. 2001, 276, 41690–41699. [Google Scholar] [CrossRef] [Green Version]
  66. Fujino, T.; Une, M.; Imanaka, T.; Inoue, K.; Nishimaki-Mogami, T. Structure-activity relationship of bile acids and bile acid analogs in regard to FXR activation. J. Lipid Res. 2004, 45, 132–138. [Google Scholar] [CrossRef] [PubMed] [Green Version]
  67. Chiang, J.Y. Recent advances in understanding bile acid homeostasis. F1000Research 2017, 6, 2029. [Google Scholar] [CrossRef]
  68. Sayin, S.I.; Wahlström, A.; Felin, J.; Jäntti, S.; Marschall, H.U.; Bamberg, K.; Angelin, B.; Hyötyläinen, T.; Orešič, M.; Bäckhed, F. Gut microbiota regulates bile acid metabolism by reducing the levels of tauro-beta-muricholic acid, a naturally occurring FXR antagonist. Cell Metab. 2013, 17, 225–235. [Google Scholar] [CrossRef] [PubMed] [Green Version]
  69. Li, J.; Dawson, P.A. Animal models to study bile acid metabolism. Biochim. Biophys. Acta. Mol. Basis Dis. 2019, 1865, 895–911. [Google Scholar] [CrossRef]
Figure 1. The effect of ethanol on FGF21 levels in liver and plasma. Relative quantification of Fgf21 mRNA levels in liver (n = 28 per group) (A). Western blot quantification of FGF21 protein in mouse liver by integrated optical density (IOD) that was normalized to GAPDH as a control (B) (n = 2 per group, each lane represents one mouse) and plasma FGF21 levels quantified by ELISA (C) (n = 10 per group). p < 0.05 was considered significant. Cont, control diet; EtOH, ethanol diet; KO, Abcb4 knockout mice; WT, C57BL/6J wild-type mice.
Ijms 22 07898 g001
Figure 2. Relative quantification of hepatic mRNA levels. Transcriptional levels of Ppar-a (A), Klb (B), Fgfr1 (C), Srebf1 (D), and Mtor (E) were determined by qPCR in the liver (n = 28 per group). Western blot analysis of hepatic p-mTOR (Ser2448) and total mTOR protein expressions (n = 3 per group, each lane represents one mouse) and quantitative analysis of p-mTOR/mTOR by IOD normalized to GAPDH as a control (F). Cont, control diet; EtOH, ethanol diet; IOD, integrated optical density; KO, Abcb4 knockout mice; p, phospho; WT, C57BL/6J wild-type mice. p < 0.05 was considered significant.
Ijms 22 07898 g002
Figure 3. Relative quantification of gene expression using qPCR in liver. Hepatic mRNA levels of Cyp7a1 gene (A), Western blot analysis of CYP7A1 protein in mouse liver by IOD that was normalized to GAPDH as a control (n = 2, each lane represents one mouse) (B) and hepatic mRNA levels of bile acid synthesis genes Cyp27a1 (C) and Cyp8b1 (D) (n = 28 per group). Cont, control diet; EtOH, ethanol diet; IOD, integrated optical density; KO, Abcb4 knockout mice; WT, C57BL/6J wild-type mice. p < 0.05 was considered significant.
Ijms 22 07898 g003
Figure 4. Relative quantification of mRNA levels of hepatic and ileal genes that play a role in transcriptional regulation of Cyp7a1. Transcriptional levels of Fxr (A), Shp (B), and Fgfr4 (C) in the liver (n = 28 per group), and Fgf15 (D), Fxr (E), and Diet1 (F) in the ileum were determined (n = 15 per group). Cont, control diet; EtOH, ethanol diet; KO, Abcb4 knockout mice; WT, C57BL/6J wild-type mice. p < 0.05 was considered significant.
Ijms 22 07898 g004
Figure 5. Plasma FGF15 levels in mice quantified by ELISA (n = 10 per group). p < 0.05 was considered significant. Cont, control diet; EtOH, ethanol diet; KO, Abcb4 knockout mice; WT, C57BL/6J wild-type mice.
Ijms 22 07898 g005
Figure 6. Total bile acid levels in male mouse gallbladder bile (A) and plasma (B) (n = 14 per group). Plasma individual bile acids were identified by GC-MS-SIM (n = 3 per group) and are shown as the percentage of total bile acid pool (C). Secondary bile acids comprise DCA, LCA, and UDCA. CA, cholic acid; CDCA, chenodeoxycholic acid; Cont, control diet; DCA, deoxycholic acid; EtOH, ethanol diet; KO, Abcb4 knockout mice; LCA, lithocholic acid; UDCA, ursodeoxycholic acid; WT, C57BL/6J wild-type mice; βMCA, β-muricholic acid; αMCA, α-muricholic acid.
Ijms 22 07898 g006
Figure 7. The effects of rhFGF21 (µg/mL) on primary mouse hepatocytes. Transcriptional levels of Cyp7a1 (A), Fxr (B), Shp (C), Fgf21 (D), Fgfr1 (E), and Klb (F) genes in primary mouse hepatocytes not treated with rhFGF21 (control) or cells treated with rhFG21 at different doses (0.1–1 µg/mL) for 24 h. All data represent x-fold change as compared to control hepatocytes (n = 3 independent primary mouse hepatocyte cultures). p < 0.05 was considered significant.
Ijms 22 07898 g007
Figure 8. Box-and-whisker plots showing plasma FGF21 (A) and FGF19 (B) levels in human plasma samples quantified by ELISA (AALD, n = 31, controls, n = 27). AALD, alcohol-associated liver disease. p < 0.05 was considered significant.
Ijms 22 07898 g008
Figure 9. Serum concentrations of 7α-OHC (A), 7α-OHC stratified for sex (B), and 27-OHC (C), as measured by GC-MS-SIM. (AALD, n = 31, 24 men, 7 women, and controls, n = 27, 14 men, 13 women). AALD, alcohol-associated liver disease. p < 0.05 was considered significant.
Ijms 22 07898 g009
Figure 10. Serum total bile acid (A), cholesterol (B), and triglyceride (C) concentrations in humans. Individual bile acids were identified by GC-MS-SIM (men, n = 3 per groups) and are shown as the percentage of total bile acid pool (D). AALD, alcohol-associated liver disease, CA, cholic acid; CDCA, chenodeoxycholic acid; Cont, control diet; DCA, deoxycholic acid; LCA, lithocholic acid; UDCA, ursodeoxycholic acid.
Ijms 22 07898 g010
Figure 11. Suggested alternative pathway for bile acid synthesis regulation upon ethanol challenge. Dashed lines for induction and repression represent literature knowledge (Pathways A and B), and straight lines indicate the results of the current study.
Ijms 22 07898 g011
Table 1. Percentage of total bile acid pool in mice gallbladder.
% (mean ± SD)CACDCADCALCAUDCAßMCAαMCAPrimary BASecondary BA
Wt-Cont26.3 ± 2.13.5 ± 1.710.3 ± 3.30.9 ± 0.15.4 ± 1.848.5 ± 8.75.1 ± 1.283.4%16.6%
Wt-EtOH35.3 ± 2.32.9 ± 0.69.8 ± 3.11.1 ± 0.23.3 ± 0.942.1 ± 0.75.5 ± 1.585.8%14.2%
KO-Cont46.2 ± 4.72.1 ± 1.26.5 ± 1.60.6 ± 0.22.8 ± 1.036.9 ± 3.14.9 ± 1.090.1%9.9%
KO-EtOH25.9 ± 1.31.0 ± 0.21.0 ± 0.20.3 ± 0.12.8 ± 0.262.7 ± 2.26.3 ± 1.195.9%4.1%
Percentages are shown as % mean ± SD. Secondary bile acids comprise DCA, LCA, and UDCA. CA, cholic acid; CDCA, chenodeoxycholic acid; Cont, control diet; DCA, deoxycholic acid; EtOH, ethanol diet; KO, Abcb4 knockout mice; LCA, lithocholic acid; UDCA, ursodeoxycholic acid; WT, C57BL/6J wild-type mice; βMCA, β-muricholic acid; αMCA, α-muricholic acid.
Table 2. Percentage of total bile acid pool in human serum.
% (mean ± SD)CACDCADCALCAUDCAPrimary BASecondary BA
Control20.6 ± 5.329.1 ± 2.140.8 ± 5.87.5 ± 1.82.0 ± 0.449.7%50.3%
AALD35.5 ± 7.636.7 ± 3.619.8 ± 4.33.7 ± 1.34.3 ± 1.372.2%27.8%
Percentages are shown as % mean ± SD. AALD, alcohol-associated liver disease, CA, cholic acid; CDCA, chenodeoxycholic acid; Cont, control diet; DCA, deoxycholic acid; LCA, lithocholic acid; UDCA, ursodeoxycholic acid.
Publisher’s Note: MDPI stays neutral with regard to jurisdictional claims in published maps and institutional affiliations.

