Article

Physiological and Biochemical Response to Fusarium culmorum Infection in Three Durum Wheat Genotypes at Seedling and Full Anthesis Stage

1
Department of Plant Breeding, Physiology and Seed Science, University of Agriculture, Podłużna 3, 30-239 Kraków, Poland
2
Franciszek Górski Institute of Plant Physiology, Polish Academy of Sciences, Niezapominajek 21, 30-239 Kraków, Poland
3
Polish Academy of Sciences, W. Szafer Institute of Botany, Lubicz 46, 31-512 Kraków, Poland
4
Faculty of Biotechnology and Horticulture, University of Agriculture, 29 Listopada 54, 31-425 Kraków, Poland
*
Author to whom correspondence should be addressed.
Int. J. Mol. Sci. 2021, 22(14), 7433; https://doi.org/10.3390/ijms22147433
Submission received: 18 June 2021 / Revised: 5 July 2021 / Accepted: 8 July 2021 / Published: 11 July 2021
(This article belongs to the Special Issue Mycotoxigenic Fungi and Their Interactions with Plants 2.0)

Abstract

:
Fusarium culmorum is a worldwide, soil-borne plant pathogen. It causes diseases of cereals, reduces their yield, and fills the grain with toxins. The main direction of modern breeding is to select wheat genotypes the most resistant to Fusarium diseases. This study uses seedlings and plants at the anthesis stage to analyze total soluble carbohydrates, total and cell-wall bound phenolics, chlorophyll content, antioxidant activity, hydrogen peroxide content, mycotoxin accumulation, visual symptoms of the disease, and Fusarium head blight index (FHBi). These results determine the resistance of three durum wheat accessions. We identify physiological or biochemical markers of durum wheat resistance to F. culmorum. Our results confirm correlations between FHBi and mycotoxin accumulation in the grain, which results in grain yield decrease. The degree of spike infection (FHBi) may indicate accumulation mainly of deoxynivalenol and nivalenol in the grain. High catalase activity in the infected leaves could be considered a biochemical marker of durum sensitivity to this fungus. These findings allowed us to formulate a strategy for rapid evaluation of the disease severity and the selection of plants with higher level, or resistance to F. culmorum infection.

1. Introduction

Fungi of Fusarium species are responsible for numerous diseases in wheat and other small grain cereals cultivated worldwide. Fusarium culmorum (Wm.G. Sm.) Sacc. is a threat to plants at every stage of their development. The infection evoked by this pathogen is a serious problem in cereal agriculture. The most common symptoms of Fusarium wilt in wheat include Fusarium seedling blight (FSB), root rot, and Fusarium head blight (FHB). These symptoms have especially disadvantageous effects on plant growth, development, grain yield, and its quality [1,2,3]. The yield reduction is an outcome of damaged kernels which appear discolored and shriveled. Fusarium culmorum belongs to the fungi producing numerous dangerous toxins, such as deoxynivalenol (DON) (Figure 1A), nivalenol (NIV) (Figure 1B), T-2 toxin (Figure 1C), and zearalenone (ZEN) (Figure 1D). These mycotoxins represent the trichothecenes family, i.e., epoxy-sesquiterpenoid metabolites responsible for pathogenic virulence and protein synthesis [4,5]. Food products and fodder contaminated with secondary metabolites of F. culmorum may evoke severe and chronic harm to human and domestic animal health [6,7,8]. In the food industry, grain infected with Fusarium, in which the level of mycotoxins exceeds the permissible EU standards, must be discarded. The maximum limit of toxins are: 750 µg·kg−1 DON and 75 µg·kg−1 ZEN in flour, and 500 µg·kg−1 DON and 50 µg·kg−1 ZEN in bread. The toxin levels are also established for feed production at 900 µg·kg−1 DON for pigs and 100 µg·kg−1 ZEN for piglets [9,10].
Resistance to Fusarium head blight is a complex, quantitative trait. Several types (mechanisms) of resistance were identified, and they were described as: Type I—resistance to an initial infection; type II—resistance to the pathogen spread within the host; type III—kernel damage; type IV—tolerance to trichothecene toxins; type V—resistance to toxin accumulation [11,12]. In response to the presence of the pathogen, the host plant activates defense processes, e.g., alters the production of some biochemical components, such as soluble sugars, phenolic compounds, hormones, or reactive oxygen species (ROS) [13]. Sugars play a pivotal role in the immune processes, especially in pathogen attacks, by initiating a signal transduction pathway and regulating the osmotic potential [14,15,16]. Increased concentration of phenolic compounds is toxic to pathogens and prevents further infection. Phenolics are involved in the lignification of the cell wall, which increases the structural barrier that hinders the spread of the pathogen within the host plant tissue. The lignification may reduce the transfer of nutrients from the host plant cell to the pathogen [17]. Due to their toxic nature, phenolic compounds, such as phytoalexins, are considered activators of pathogen resistance genes and modulators of pathogen toxicity [18]. Another way to prevent pathogen infection is a mechanism that involves the production of enzymatic and non-enzymatic antioxidants, and scavenging of reactive oxygen species (ROS) [19]. The ROS includes non-radical molecules, such as hydrogen peroxide (H2O2) and singlet oxygen (1O2), as well as free radicals, such as superoxide anion (O2• −) and hydroxyl radical (OH) [20]. Reactive oxygen species can perform three functions: They can act as cell-damaging agents, signal transduction molecules, and can provide protection against pathogenic microbes [21]. Excessive production of ROS is often called an oxidative burst. Overproduction of ROS can lead to protein and chlorophyll oxidation, damage to nucleic acids, lipid peroxidation, or initiation of programmed cell death [22,23]. Reactive oxygen species accumulation is counteracted by the activation of enzymatic antioxidants, such as catalase (CAT), peroxidase (POX), superoxide dismutase (SOD), and non-enzymatic antioxidants, such as low molecular weight (LMW) phenolics and carotenoids [21,24,25]. Catalase is responsible for the decomposition of H2O2 into H2O and O2, as well as for the regulation of H2O2 concentration in plant tissues. This enzyme is involved in plant development, but also plays an important role in plant resistance to pathogens and aging processes [26]. Peroxidases have a similar function to CAT, as they are involved in scavenging ROS in response to pathogen-plant interactions. In addition, POXs are responsible for the oxidation of phenolics, making them more toxic towards pathogens, lignin biosynthesis, suberization, and growth of the plant cell walls [27]. Superoxide dismutase plays an equally pivotal role in maintaining redox balance and defense response in plants exposed to stress. Its task is to catalyze the dismutation of O2•− and HO2 (hydroperoxide radical) to H2O2 and H2O. Superoxide dismutase is the first line of defense against a pathogen attack and protects plants from oxidative stress [28]. Hydrogen peroxide also plays a significant role in pathogen defense. Thanks to its antimicrobial properties, it can induce local and systemic resistance to pathogen infection in plants [29].
Pathogen presence can also affect the level of chlorophyll pigments and their activity, resulting in altered efficiency of photosystem II (PS II) [30]. Similar observations were reported by other authors examining the photosynthetic pigment content after F. culmorum infection in tomato [31] and barley [32]. The investigated pathogen predominates in cooler areas of northern, central, and western Europe, and it infects wheat, barley, and oats [33]. Grain of durum wheat (Triticum turgidum L. subsp. durum (Desf.) Husn.) is used primarily in the production of pasta and to a lesser extent in the production of bread and groats. Although, durum wheat originates from the Mediterranean region and the countries of the Middle East is also very sensitive to F. culmorum [34]. Recent years have brought increased interest in durum wheat cultivation in Poland. Major problems with this crop include its high sensitivity to drought, soil salinity, cadmium accumulation, and Fusarium infections [34,35,36,37]. Durum wheat, as compared with common wheat (T. aestivum), is characterized by higher sensitivity to Fusarium infection. This is attributed to its morphological traits, such as early flowering, longer awn, another retention inside the floret, spike compactness, and genetic differences, such as the presence of type I rather than type II resistance genes [38,39].
In the presented study, three durum wheat accessions were assessed in terms of resistance to Fusarium diseases at two stages of their ontogenesis: Two-week-old seedlings and full anthesis stage—65 BBCH scale [40]. The defense response of the studied durum genotypes included evaluation of the resistance degree in the seedlings by means of visual inspection of the leaves and roots, and fresh weight measurements. We also determined the content of total soluble carbohydrates, total soluble phenolics and cell wall-bound phenolics, chlorophyll pigments, hydrogen peroxide, and antioxidant enzymes activity. At the full anthesis stage, we visually evaluated the resistance to Fusarium head blight, and measured the content of mycotoxins (deoxynivalenol, nivalenol, T–2 toxin, and zearalenone), and yield parameters. The main objective of the study was to identify physiological or biochemical markers of resistance to F. culmorum at both developmental stages in three durum wheat accessions. The investigation was carried out on Polish line SMH87 and two Australian accessions: cv. ‘Tamaroi’ and BC5Nax2 line. The selected genotypes differed in the degree of resistance to salinity and were the subject of our earlier studies on cadmium accumulation in the grain of durum wheat [36,37].

2. Results

2.1. Experiment I

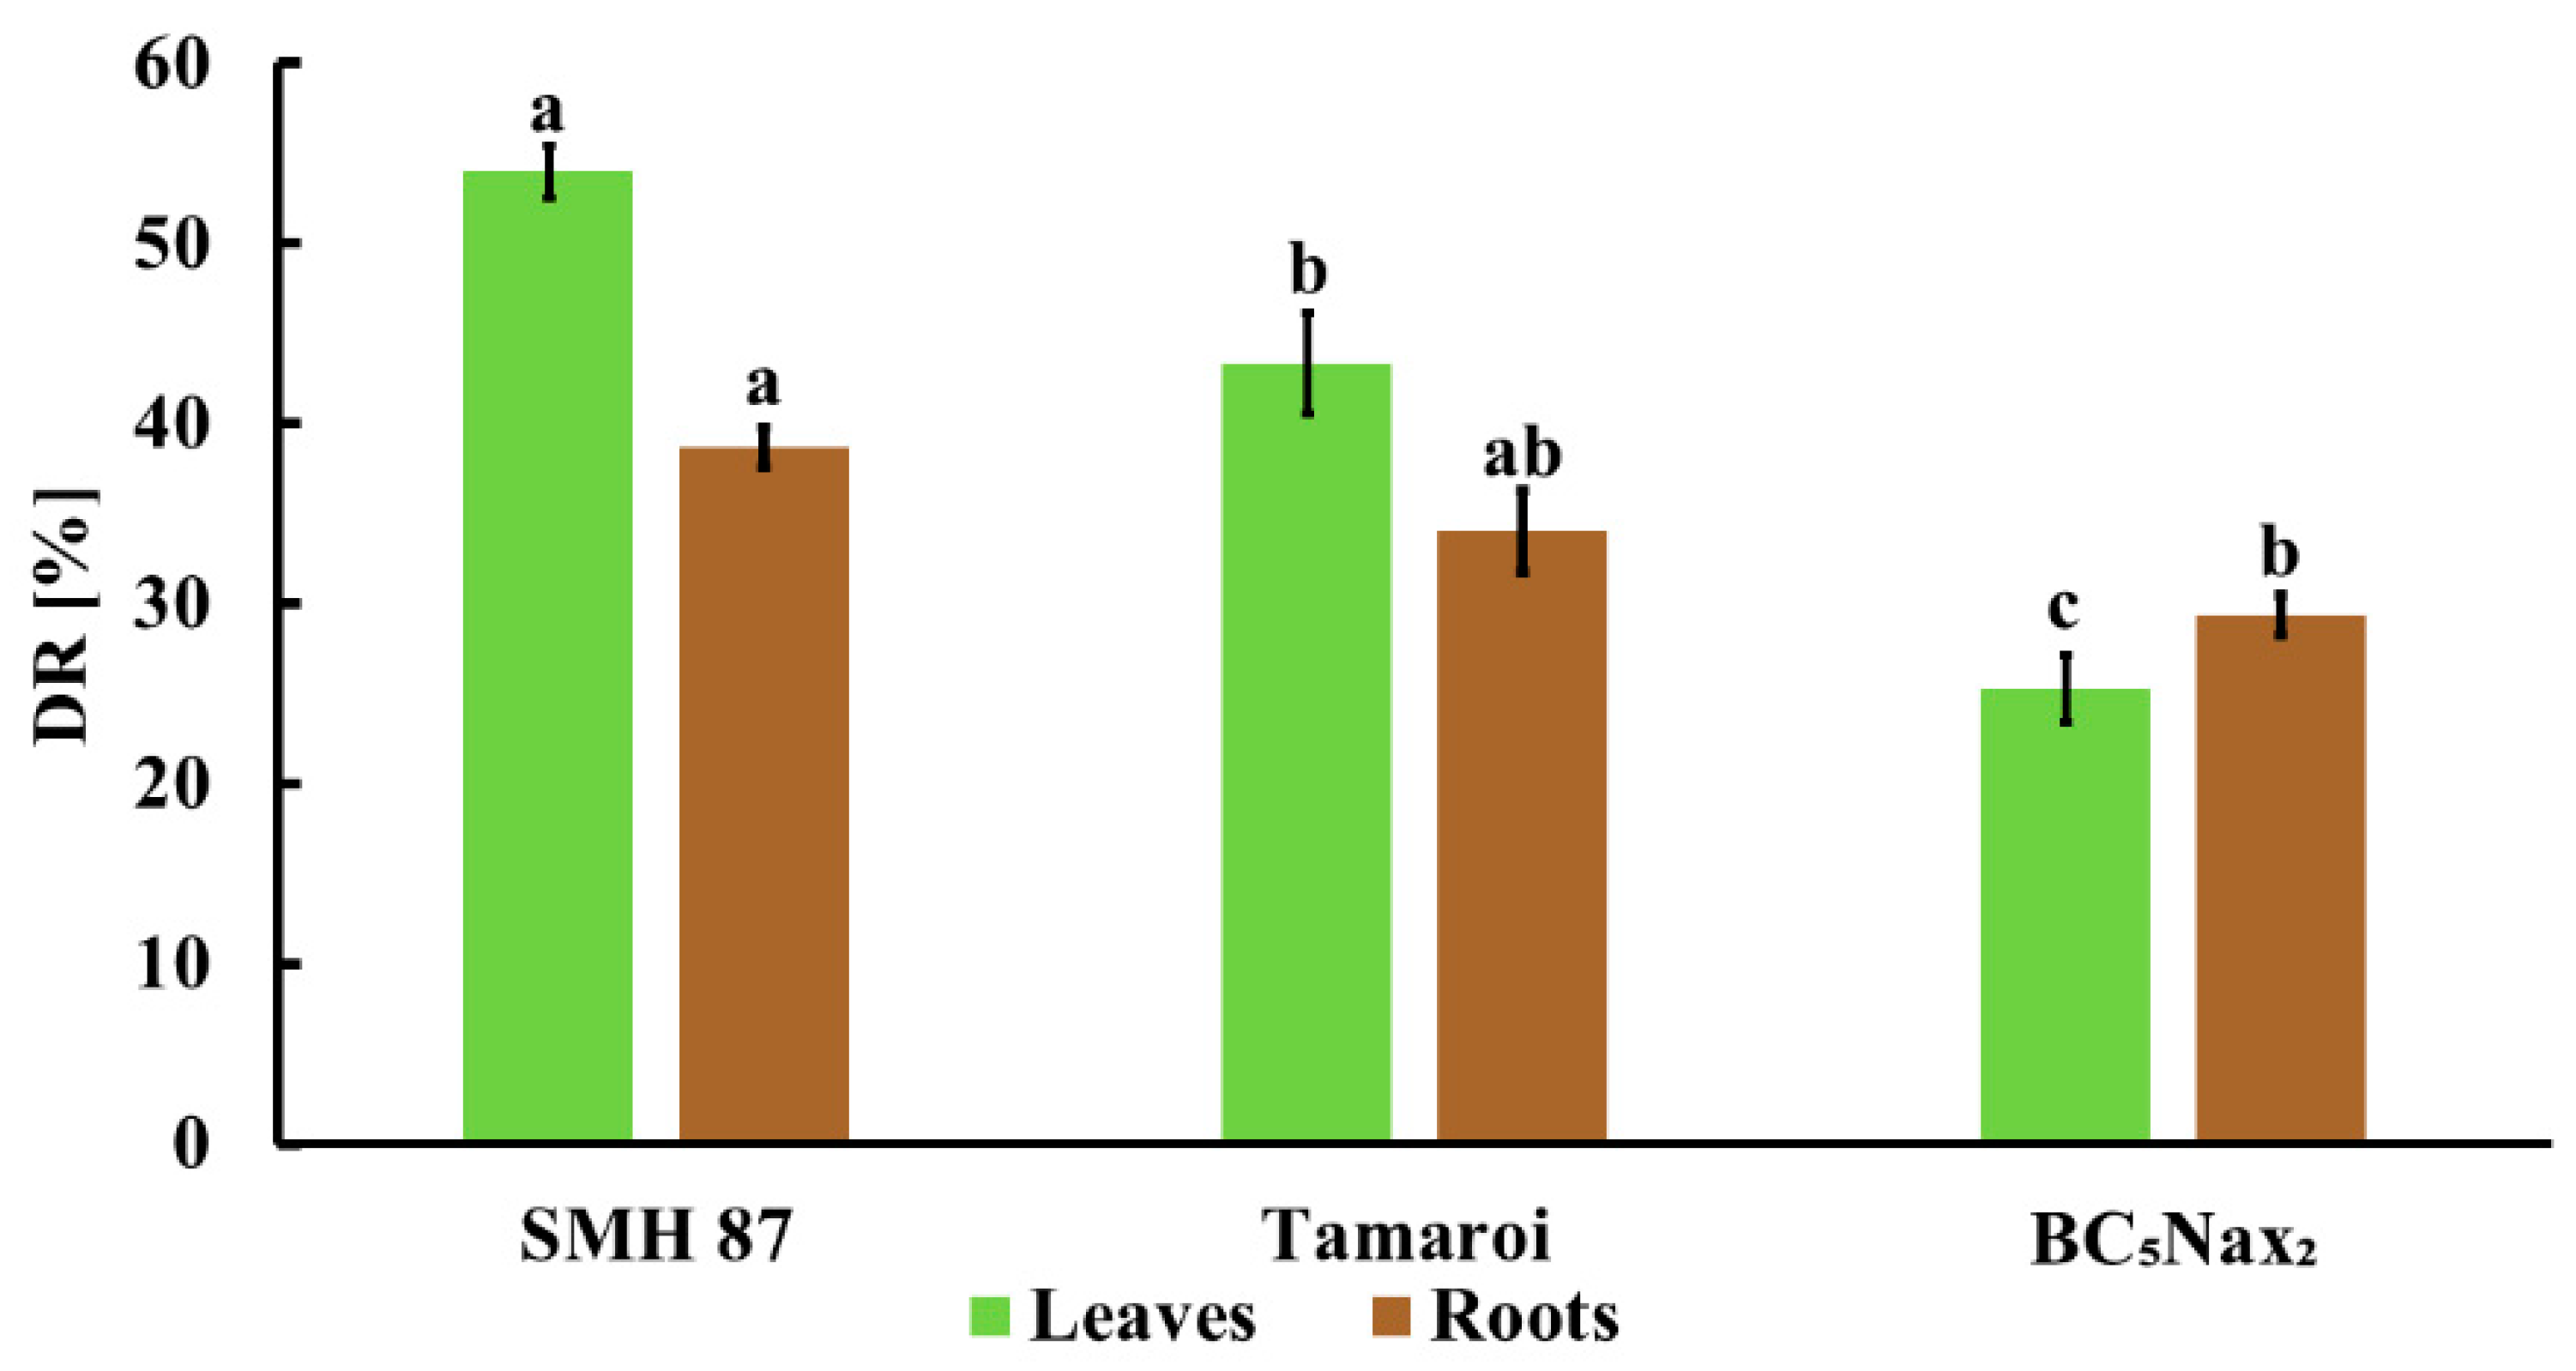
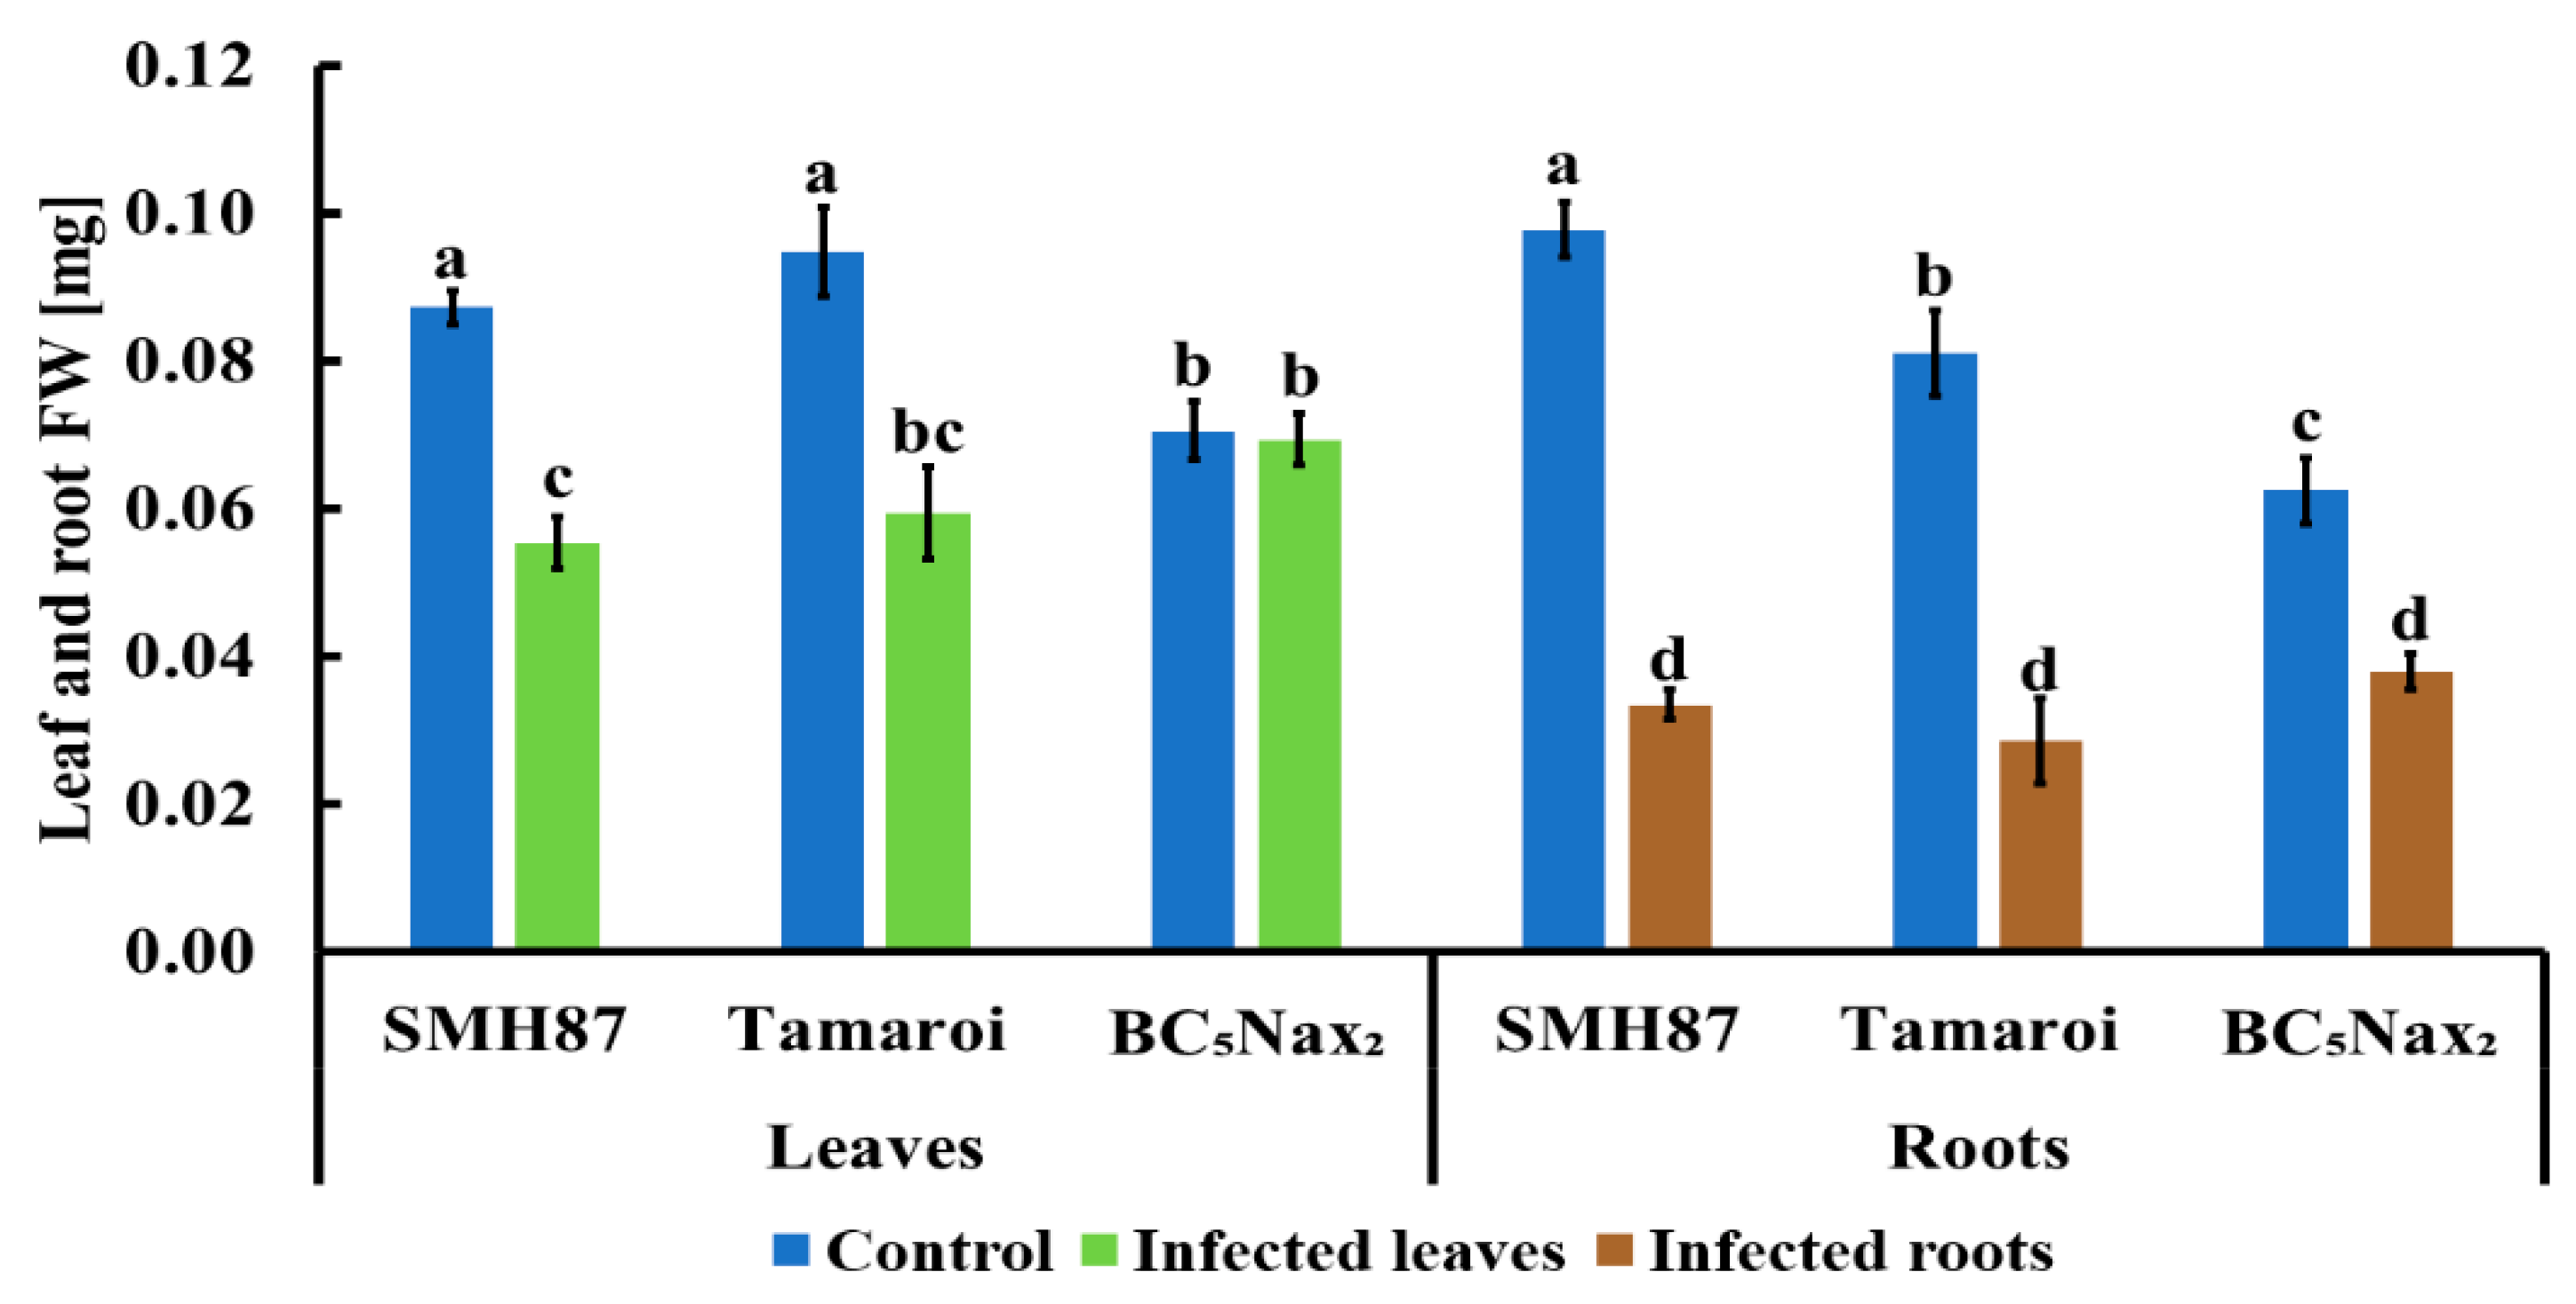
2.1.1. Disease Rating (DR) and Fresh Weight (FW) Loss

The visual disease rating (DR) included only the seedlings infected with F. culmorum, so control seedlings were not evaluated. In this experiment, the vigor of plant seedlings at the three-leaf stage was assessed. All analyses, described in Section 2.1., were done on material collected in this developmental stage. The leaves and roots of SMH87 line and cv. ‘Tamaroi’ showed higher sensitivity to the pathogen infection than those of the BC5Nax2 line (Figure 2). The highest percentage of leaf DR was observed in SMH87 plants, while the lowest in the BC5Nax2 line. Root infection results were similar in SMH87 and cv. ‘Tamaroi’. Roots of BC5Nax2 were infected to the same degree as in cv. ‘Tamaroi’, but lower than in SMH87.
Fusarium culmorum infection negatively affected leaf and root FW in all studied accessions (Figure 3). The effects were more pronounced in the roots than in the leaves. In SMH87 and cv. ‘Tamaroi’ FW reduction of the infected leaves was greater than in BC5Nax2. Fusarium infection caused a 37% decrease in leaf FW in both SMH87 and cv. ‘Tamaroi’ as compared with control. The infected roots of SMH87 and cv. ‘Tamaroi’ demonstrated a 66% decrease in FW in comparison with control. BC5Nax2 line did not show FW reduction in the infected leaves, but in the infected roots, FW loss amounted to 39% versus that of control.

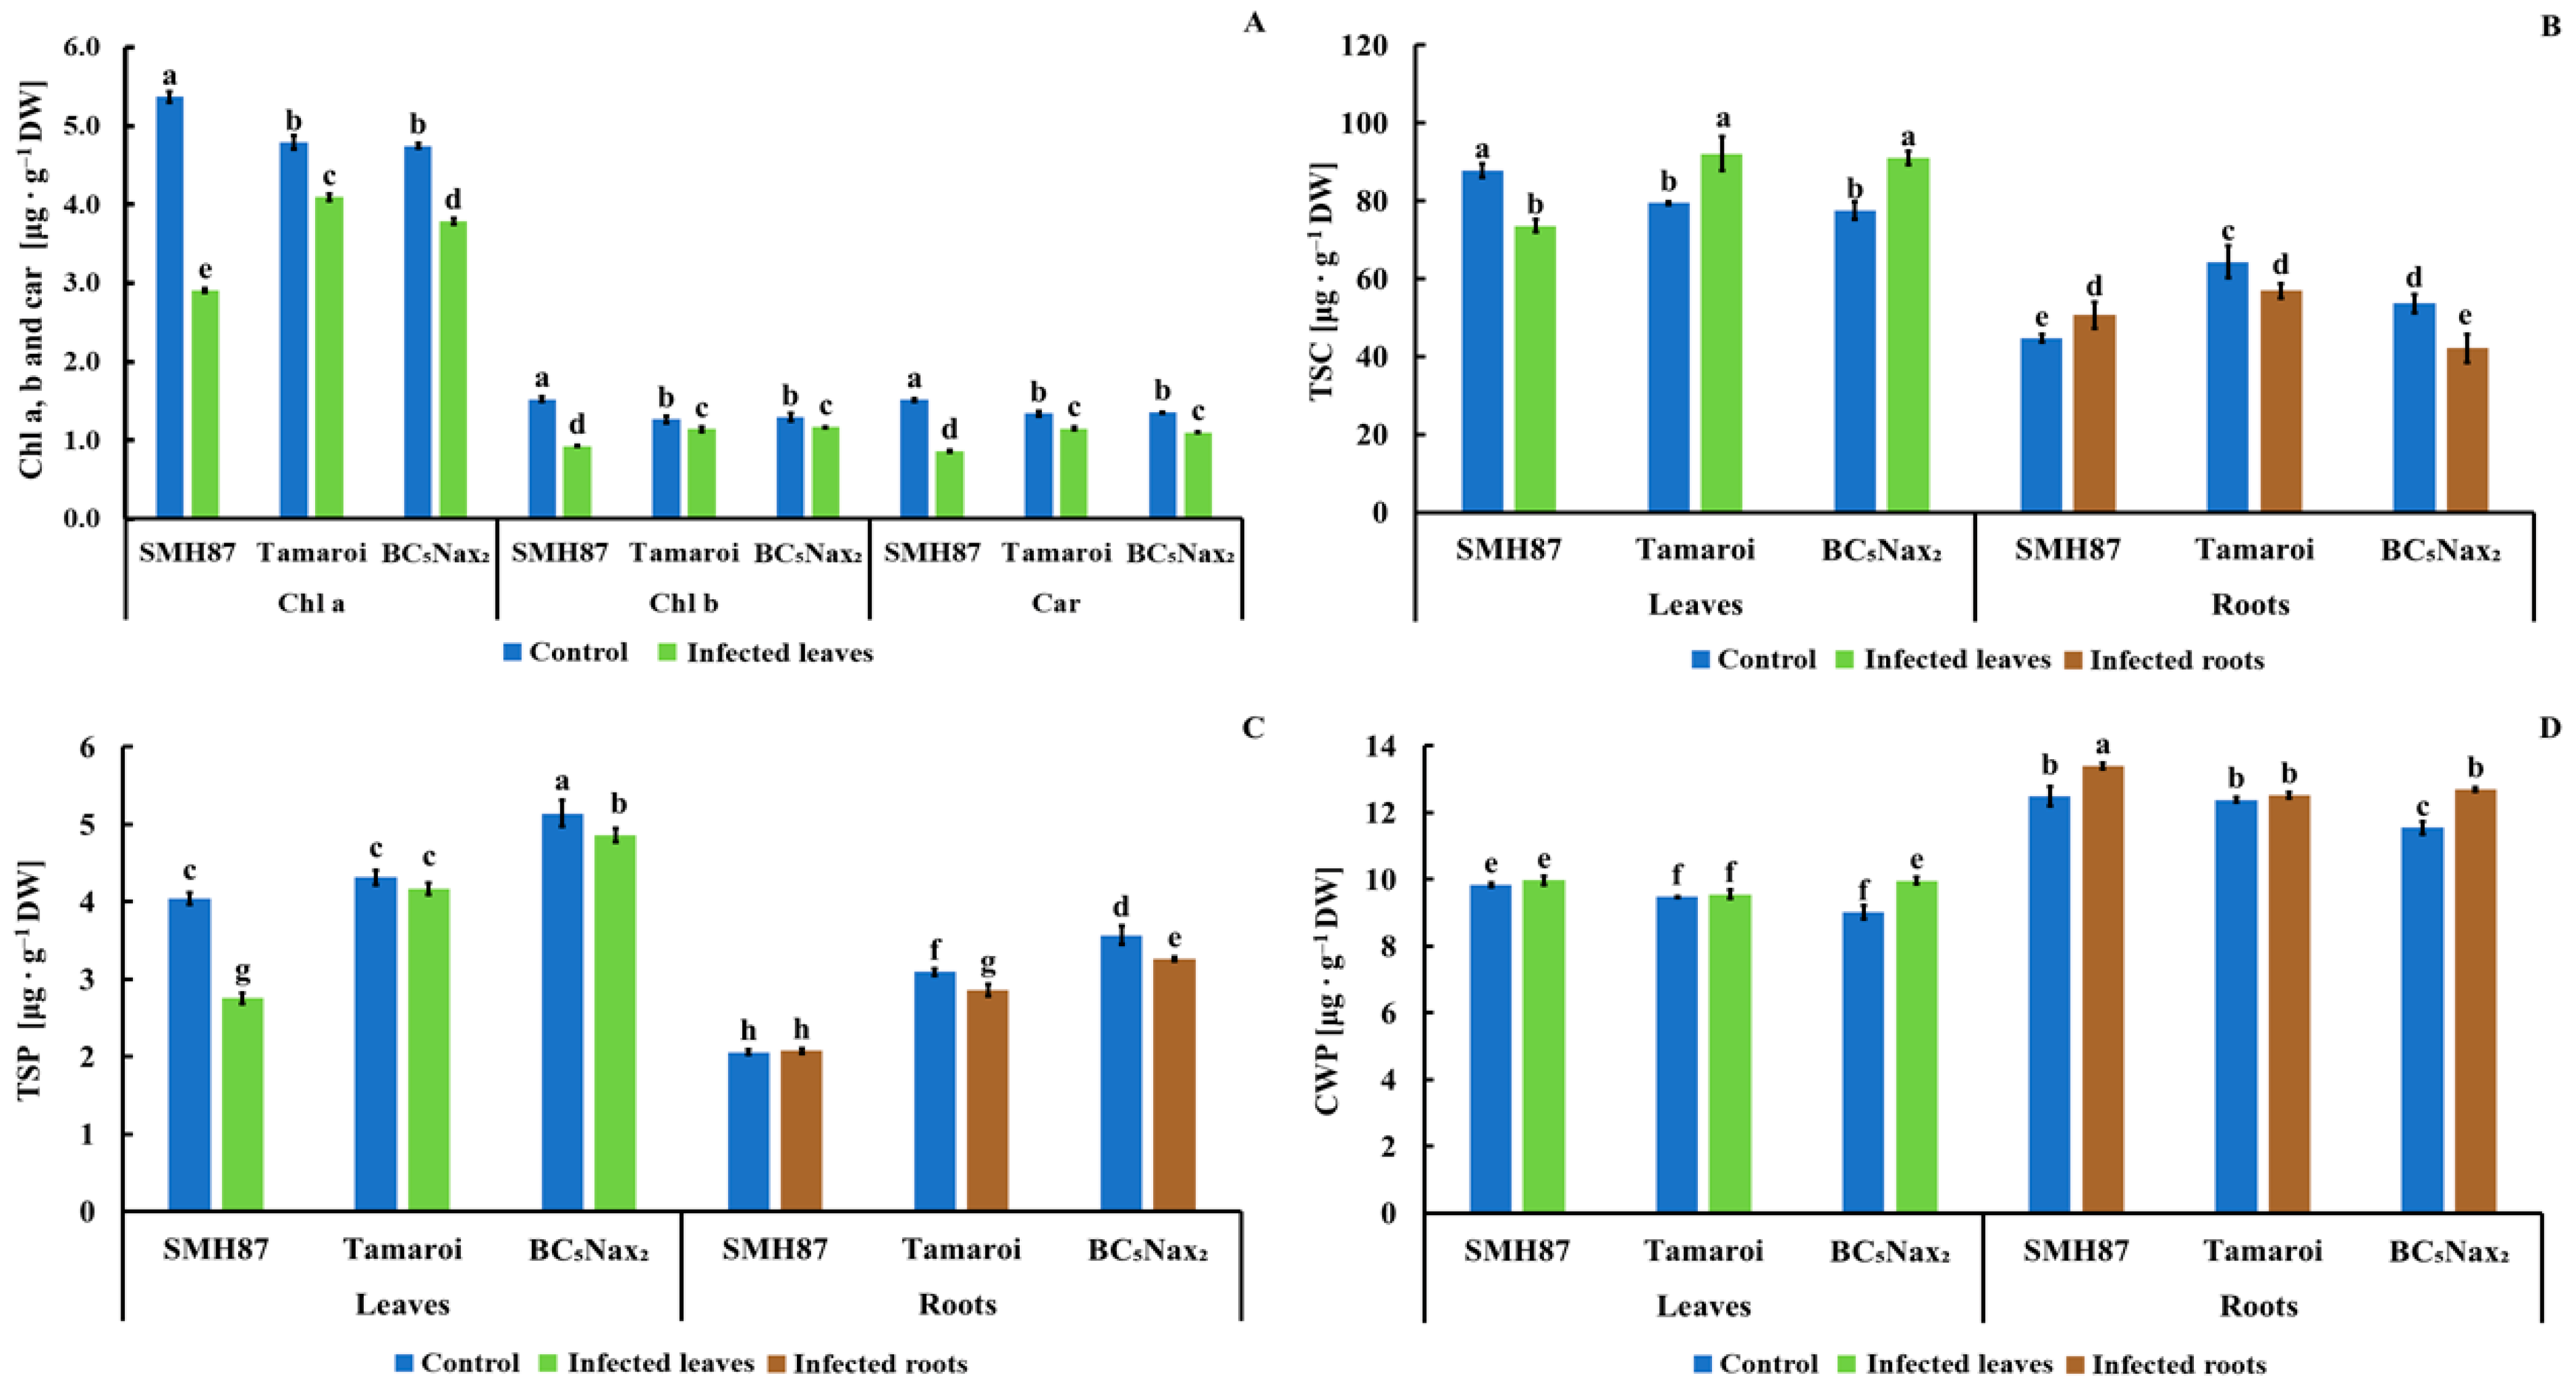
2.1.2. Chlorophyll a, b, and Carotenoid (Chla, b, and car) Content

The infection reduced the contents of chlorophyll a, b, and carotenoids (Chla, b, and car) in all studied durum wheat accessions (Figure 4A). The greatest decrease in all pigments was observed in SMH87 leaves. Chlorophyll a content dropped by 48%, Chlb by 40%, and carotenoids by 44% as compared with control plants. The other studied accessions also showed pigment content reduction in the infected plants; however, these differences, although significant, were not as drastic as in the SMH87 line.

2.1.3. Total Soluble Carbohydrates (TSC)

As a result of the infection, TSC content in SMH87 plants (Figure 4B) decreased in the leaves and increased in the roots, as compared with control. An opposite trend was observed in cv. ‘Tamaroi’ and BC5Nax2, where the infection triggered an increase in TSC in the leaves and a drop in the roots as compared with control.

2.1.4. Total Soluble Phenolics (TSP)

The studied genotypes differed in the content of total soluble phenolics (TSP) in the control and infected leaves and roots (Figure 4C). Line SMH87 showed a significant, almost 32% decrease of TSP content in the infected leaves, but no changes in the roots. In the infected leaves and roots of BC5Nax2 a reduction in TSP was observed, while in cv. ‘Tamaroi’ the infection decreased phenolic content in the roots. Total soluble phenolics levels in the leaves of this cultivar were unaffected by the infection.

2.1.5. Cell Wall-Bound Phenolics (CWP)

Fusarium infection boosted CWP only in the leaves of BC5Nax2 (Figure 4D). In the roots of SMH87 and BC5Nax2, an increase in CWP was observed upon inoculation. In other cases, the infection did not cause significant changes in the content of these compounds.

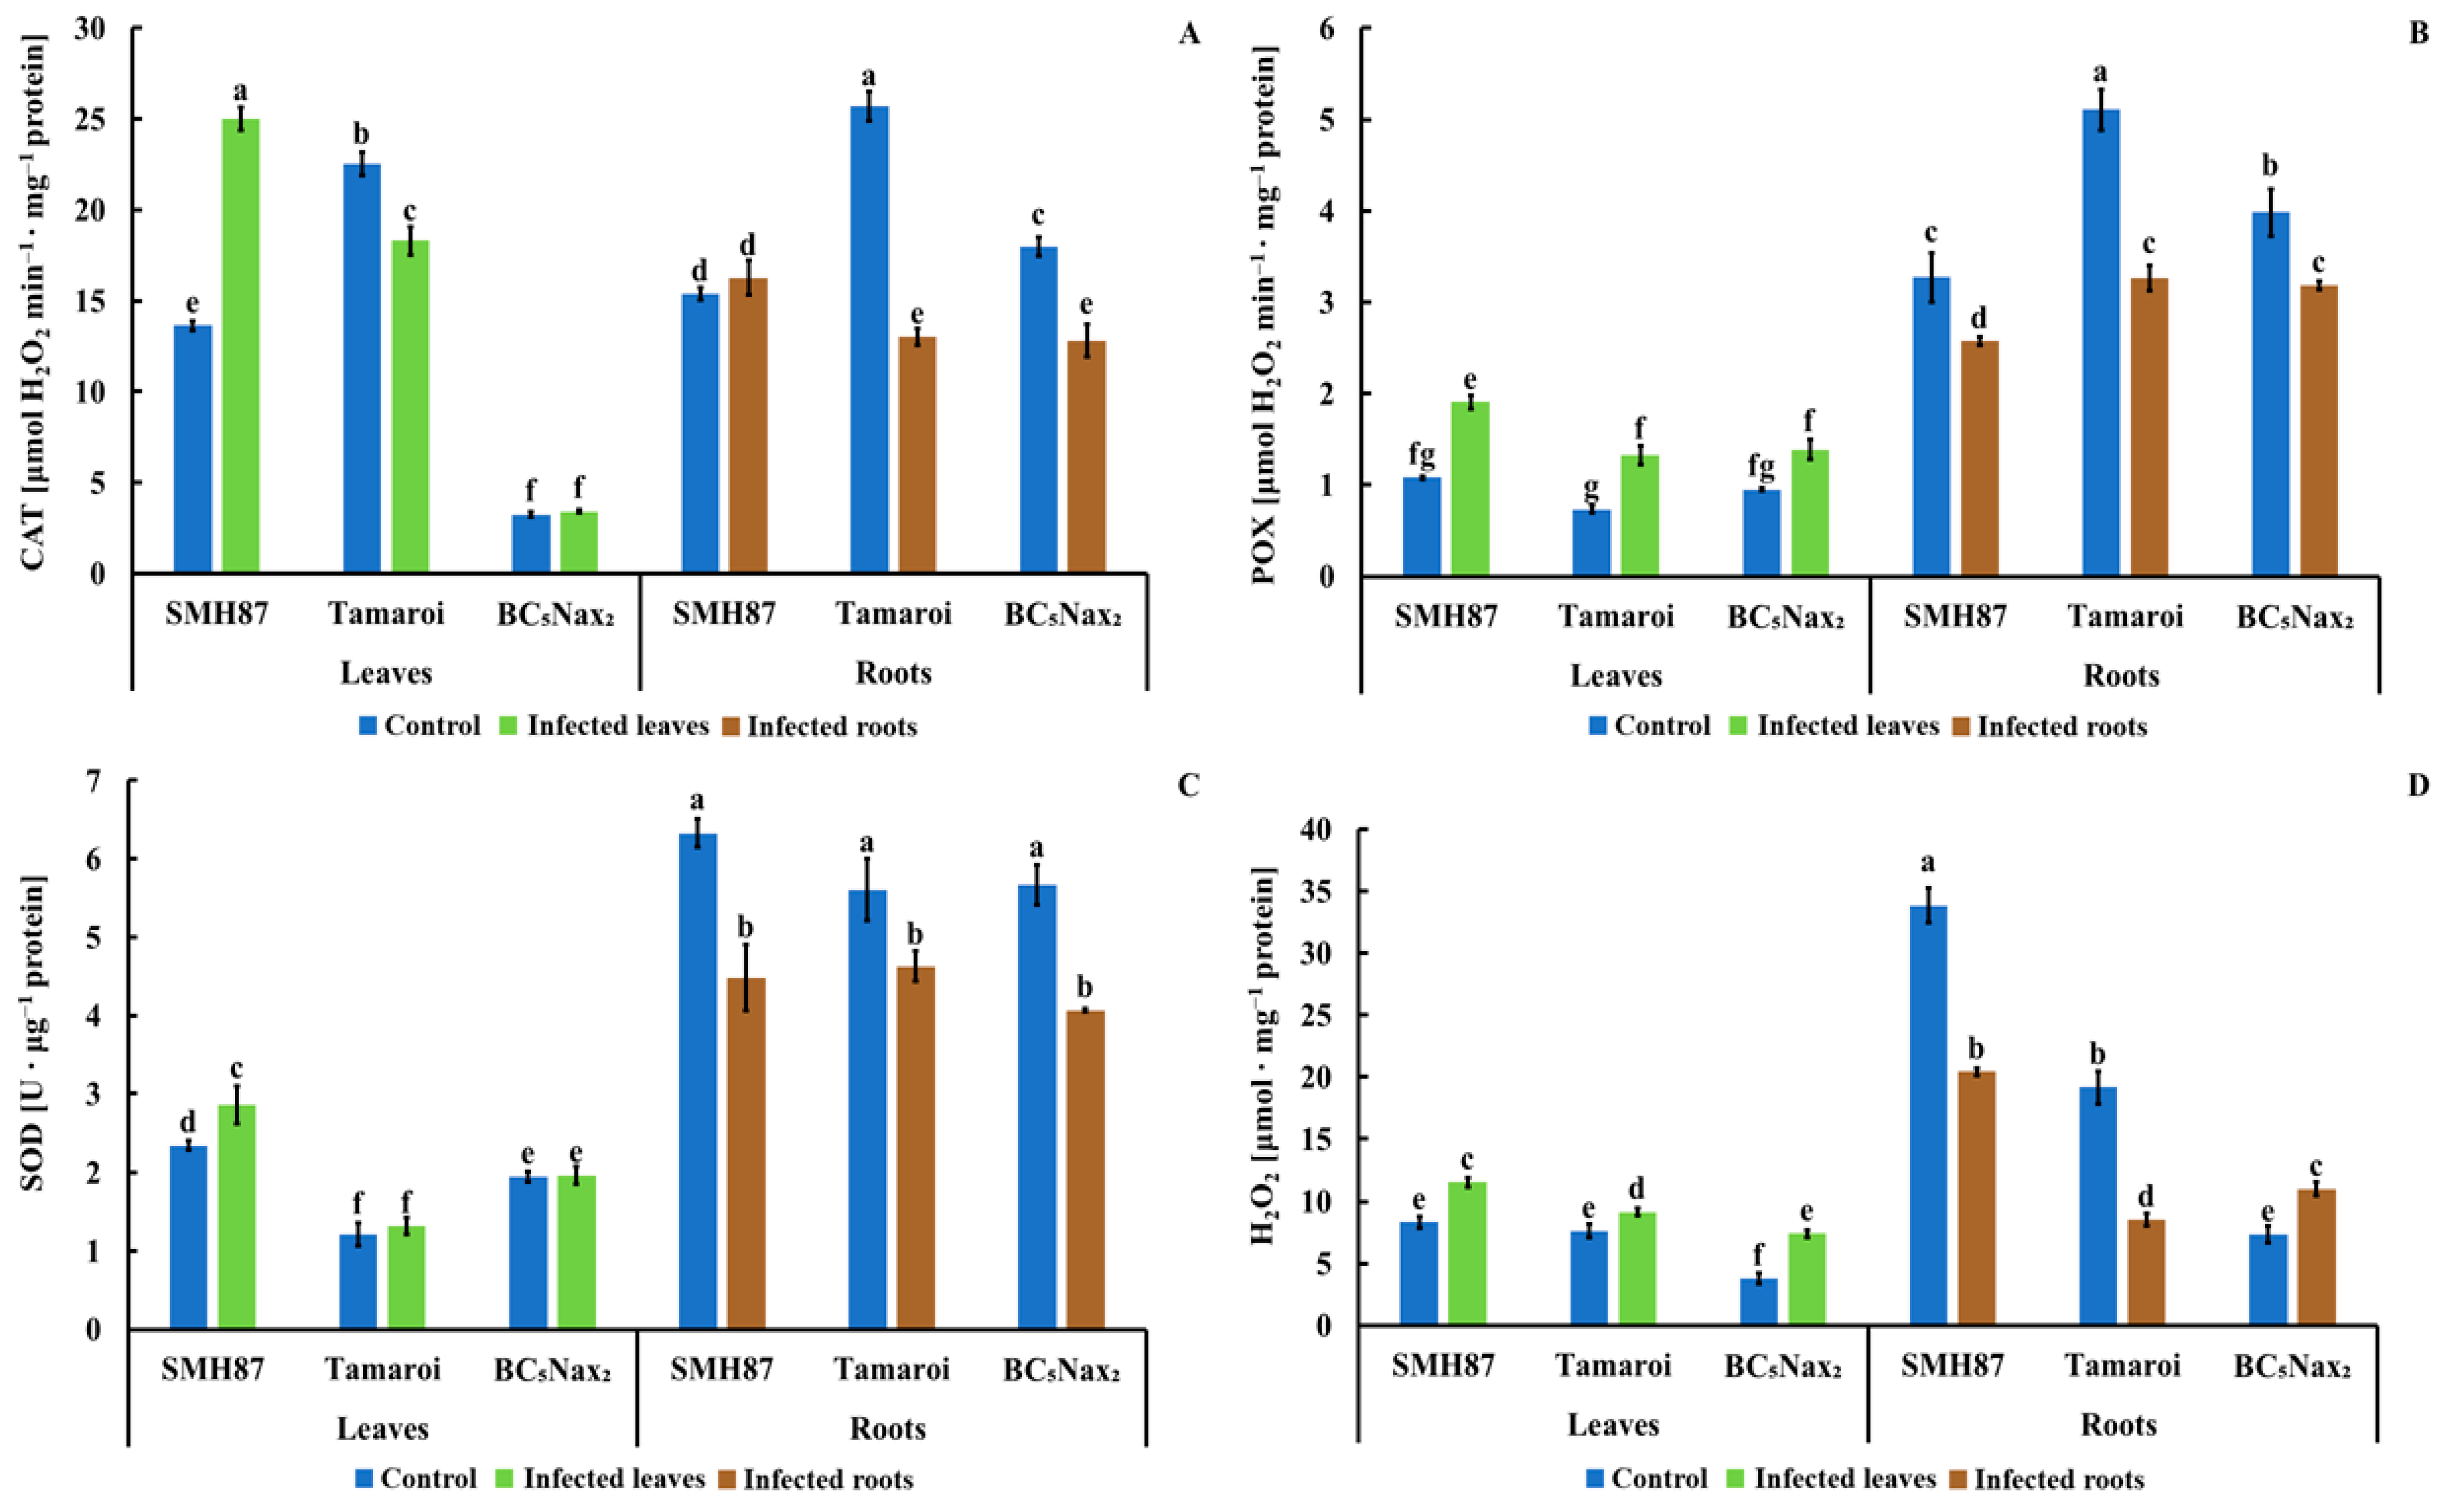
2.1.6. Catalase (CAT) Activity

The greatest increase in CAT activity is due to the infection was observed in SMH87 leaves. In cv. ‘Tamaroi’, it was diminished, and in the BC5Nax2 line, it was unaffected by the infection (Figure 5A). Catalase activity was considerably higher in control roots of cv. ‘Tamaroi’ and BC5Nax2 than in the infected ones. There was no difference in CAT activity in the infected and control SMH87 roots.

2.1.7. Peroxidases (POXs) Activity

An increase in POXs activity was observed in the leaves of all infected genotypes (Figure 5B). The leaves of SMH87 and cv. ‘Tamaroi’ showed a 44% increase in POXs activity as compared with control, while in BC5Nax2 leaves, this increase amounted to 31%. In the roots ofSMH87, ‘Tamaroi’, and BC5Nax2, the infection brought about a significant decrease in POXs activity by 23, 35, and 19%, respectively.

2.1.8. Superoxide Dismutase (SOD) Activity

Superoxide dismutase activity was significantly higher only in the infected leaves of the SMH87 line as an effect of Fusarium infection (Figure 5C). In the case of other accessions, the infection did not change SOD activity. In the infected roots of SMH87, cv. ‘Tamaroi’, and BC5Nax2 the infection decreased activity of this enzyme by 30%, 18%, 28%, respectively.

2.1.9. Hydrogen Peroxide (H2O2) Content

Hydrogen peroxide content increased in the leaves of all studied accessions as an effect of infection (Figure 5D). The highest increase in H2O2 level was noted in the infected leaves of BC5Nax2 plants. A rapid decrease in H2O2 content was noted in the infected roots of SMH87 (39%) and cv. ‘Tamaroi’ (55%), while in BC5Nax2 plants, the infection enhanced H2O2 level in the roots by 33% vs. control.

2.2. Correlation Analysis

The disease symptoms assessed with the visual disease rating (DR) negatively correlated with Chla, b, and Car content, and with FW of the leaves and roots (Table 1).
Significant correlations between H2O2 content and the investigated enzymes were found (Table 2).
In the leaves, CAT and POX positively correlated with H2O2 content. This relationship was not observed in the roots. Superoxide dismutase activity correlated positively with H2O2 only in the roots (r = 0.613, p < 0.05), proving that the higher SOD activity, the more H2O2 was produced. In the leaves, TPC content negatively correlated with H2O2 levels, while TPC content in the roots negatively correlated with H2O2 concentration in both studied organs (Table 2.). Significant correlation between TSP and TSC (r = 0.63118, p < 0.05) was found.

2.3. Experiment II

2.3.1. Fusarium Head Blight Index (FHBi) and Yield Parameters

Index FHBi showed a significant difference between the studied genotypes regarding F. culmorum resistance (Table 3). The time after infection on the spikes significantly impacted the disease development. The research revealed the fastest and the strongest spike infection (10%) in the SMH87 line seven days after the first inoculation. After 14 days, a 71% increase in FHBi of SMH87 spikes vs. the first evaluation was observed. The spike inoculation with Fusarium spores significantly reduced the amount of grain per spike in all studied genotypes (Table 3). A significantly higher grain reduction occurred in SMH87, where it was 83% greater than in control. A strong reduction in grain number (64%) was also observed in cv. ‘Tamaroi’.
BC5Nax2 line showed the lowest reduction of grain yield per spike in the inoculated plants. The analysis of yield parameters showed significant differences in grain mass per spike and in the mass of one piece of grain, as well as MTS of the control and inoculated plants (Table 3). A significantly higher (83%) reduction of grain mass per spike was observed in SMH87 plants. BC5Nax2 plants showed a significantly lower (by 40%) reduction in grain mass per spike as compared with the other studied accessions. Analyses of the mass of one piece of grain and of one thousand grains revealed significant differences between the studied accessions (Table 3). A significant loss of a single grain mass was observed in the SMH87 line, dropping by 75% vs. control plants. A 45% reduction in MTS was observed in BC5Nax2 plants. This genotype showed the lowest MTS reduction, while the highest MTS reduction was seen in SMH87.

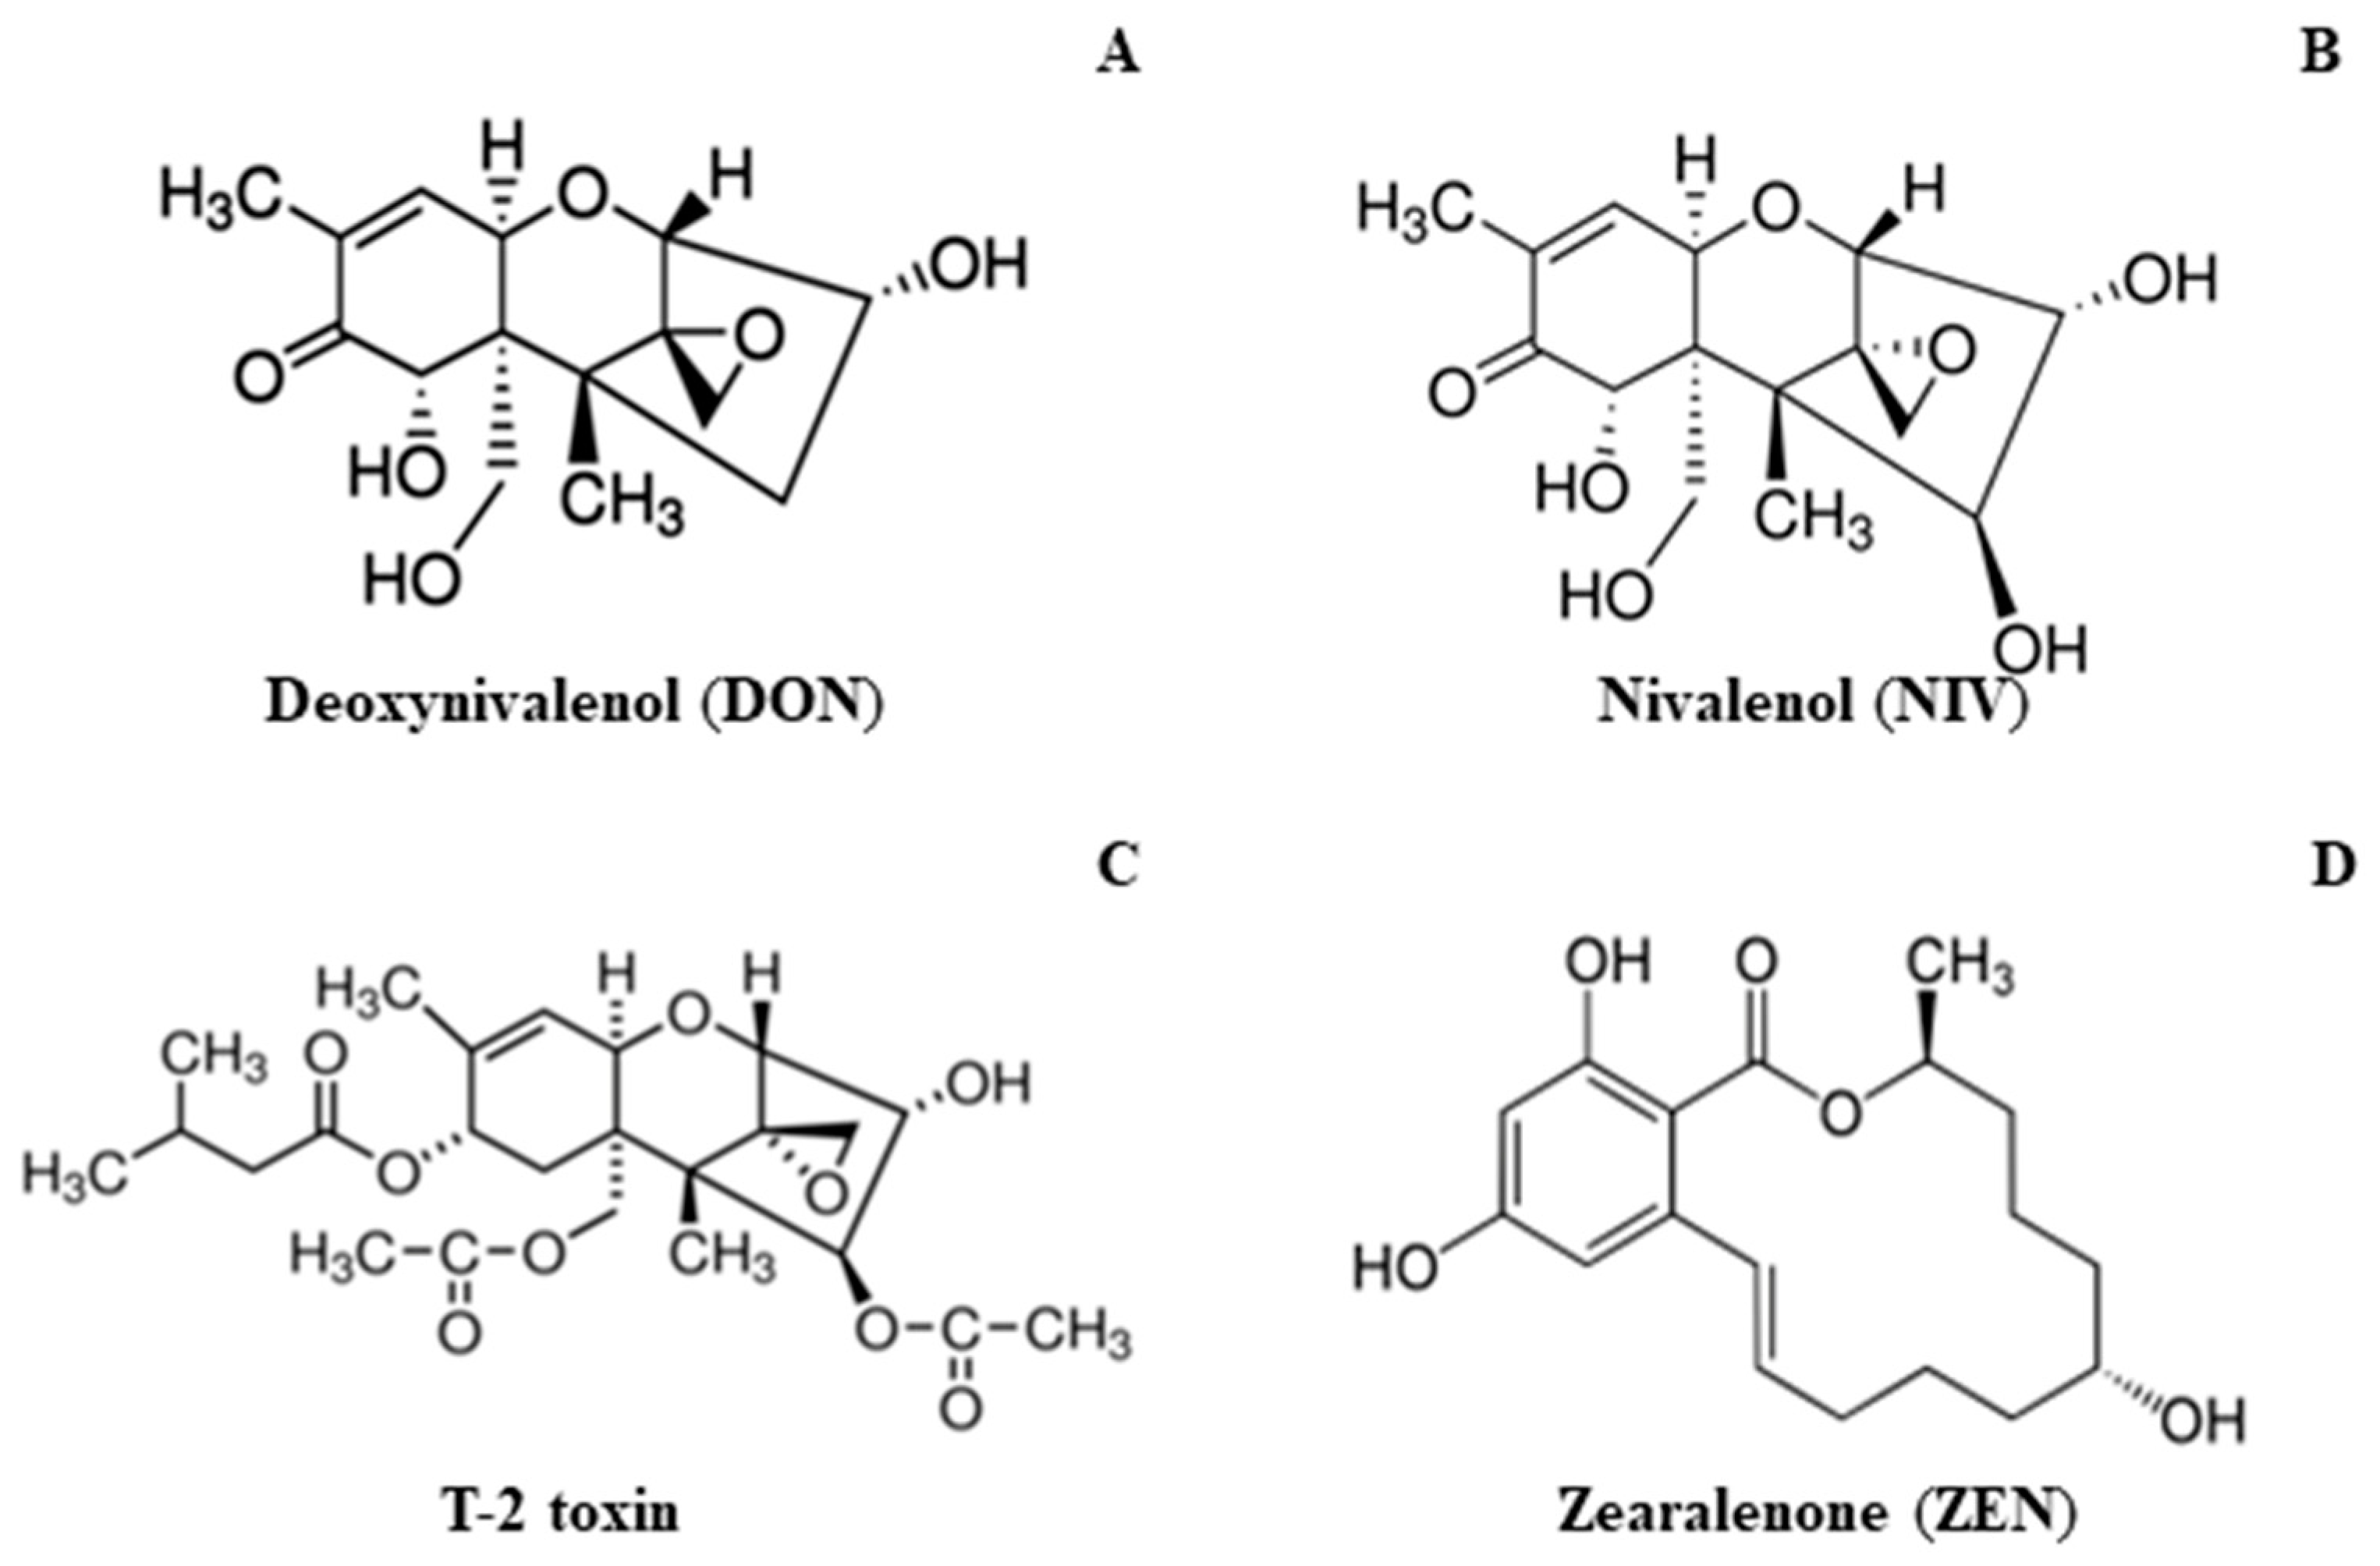
2.3.2. Mycotoxin Content

Trace amounts of DON and ZEN were found in the grain of all control plants, while the concentration of T–2 was ten times higher (Table 4). The amount of NIV in control plants of ‘Tamaroi’ and BC5Nax2 was four times higher than that in SMH87. The infection considerably increased the levels of NIV, DON, and T–2 toxins. The highest amount of NIV was recorded in cv. ‘Tamaroi’ grain after inoculation and it was six times higher than that of the control. In the grain of the infected SMH87, the level of this toxin was 18 times higher than in control, while in the infected BC5Nax2 plants—four times higher. In BC5Nax2 grain, NIV level after inoculation increased four times as compared with control. As in the case of NIV, cv. ‘Tamaroi’ grain contained the highest level of DON. The grain content of ZEN was the lowest among the other studied toxins. Inoculation did not increase ZEN content in SMH87 seeds, while in cv. ‘Tamaroi’ and BC5Nax2, the level of this toxin was more than six times higher than in the control. In all cases, inoculation slightly increased the content of T–2 in the seeds as compared with that of the control. The highest increase in T–2 was found in cv. ‘Tamaroi’ (2.3×), while in SMH87 and BC5Nax2, the increase was 1.64 and 1.75×, respectively. To summarize, cv. ‘Tamaroi’ showed the highest toxin accumulation in grain.

2.3.3. Correlation Analysis

Fusarium head blight index (FHBi) evaluated 7 and 14 days after inoculation negatively correlated with the number of seeds and their mass (Table 5). The content of NIV and DON significantly decreased all studied yield parameters, while ZEN reduced only the mass of a single grain. No correlation between the content of T–2 and the evaluated yield parameters was found. The latter two results can be explained by low content of both toxins.
Strong correlation was detected between the visual assessment of Fusarium head blight index (FHBi) evaluated in both terms (7 and 14 days after infection) and the grain content of all investigated mycotoxins, except for T–2 (Table 6). Index FHBi positively correlated with the content of DON and NIV, while in the case of ZEN, a significant correlation was found only seven days after the infection.

3. Discussion

Fusarium culmorum attacks plants at various developmental stages. The pathogenesis is responsible for the formation of seedling blight and root rot, which limit seedling emergence and plant development [32]. In our experiment, the infection caused a darkening of the roots and slower leaf growth. The studied genotypes differed more in the degree of leaf than root infestation. SMH87 line was the most, and BC5Nax2the least heavily infested. Medium infestation degree was observed in cv. ‘Tamaroi’. This result was surprising, since the genotypes originating from a much warmer and drier climate were less severely infected than the original genotype from Poland. The infection degree was visible in leaf FW loss: BC5Nax2 genotype did not show changes in fresh leaf weight, while the decrease in root weight, although significant, was the smallest among the studied genotypes. Similar results were obtained by Grey and Mathre [41] in barley, by Wojciechowski et al. [42] in winter wheat, and by Warzecha et al. [43] in oats. These authors suggest that the most severe damage caused by Fusarium seedling blight appeared in the roots. It indicates that visual evaluation of root infestation may be more useful than leaf assessment. According to Malalaseker et al. [44] and Knudsen et al. [45], root rot may also develop, due to a prior infestation of hypocotyls and shoots. Root infection negatively affects proper plant development and disturbs basic physiological processes, such as distribution of assimilates, water uptake and transport, and soil mineral absorption. These disturbances result in reduced seedling vigor and interrupted growth which negatively affects grain quality and yield.
Fungal mycelium penetrates the host-plant cells and limits access to nutrients and water. Released toxins disrupt metabolic and physiological processes. This leads to the reduction of photosynthetic pigment content and disturbances of photosynthesis [44]. Our study demonstrated that F. culmorum infection significantly decreased the content of chlorophyll a, b, and carotenoids in the leaves. Similar observations were published by other researchers examining the content of photosynthetic pigments after F. culmorum infection in tomato [31] or barley [32]. In our study, the results of visual assessment of DR in the leaves and roots negatively correlated with the content of Chla, b, and Car.
Soluble sugars play an important role in plant development and metabolism, and therefore, their content fluctuates during plant infection. Soluble sugars in the host-plant cells are a source of carbon for the pathogen [46,47,48]. Sucrose was shown to induce defense mechanisms in the infected cells. The hexose, through signal transduction by hexokinase, increases the production of peroxidases and proteins directly related to pathogenesis [14,16]. Soluble sugars, as compounds with higher osmotic potential, limit the spread of the infection. Moreover, they isolate healthy cells from the infected ones and protect them against water loss [49]. Our analyzes of TSC showed that infection significantly increased TSC content in cv. ‘Tamaroi’ and BC5Nax2 leaves and decreased TSC levels in the roots. A contrary trend was observed in the leaves and roots of SMH87 line. Warzecha et al. [32] noted an increased sugar content in the leaves and their decrease in the roots of barley infected by F. culmorum. Morkunas et al. [16] reported that increased content of soluble sugars supported the resistance of Lupinus luteus L. to F. oxysporum infection, while Gaudet et al. [15] observed a similar correlation in wheat infested by snow mold fungi. Bani et al. [50] suggested that Fusarium species infection during seed germination disrupted sugar distribution between cotyledons and the tissues of embryo axis in the germinating seeds. Formela-Luboińska et al. [51] reported that soluble carbohydrates reduced sporulation of F. oxysporum f. sp. lupini and limited the production of moniliformin toxin synthesized by this Fusarium species. In our study, the more resistant Australian accessions (cv. ‘Tamaroi’, BC5Nax2) showed higher sugar content in the leaves of infected seedlings than Polish SMH87. Our research demonstrated that sugar content in the leaves was a stronger indicator of F. culmorum resistance than that in the roots.
Synthesis of phenolic compounds is a well-known defense response to pathogen attack. Their biosynthesis occurs both before and after the infection [52]. The defensive role of phenolics in fungal infections in plants was confirmed in our previous studies [53,54,55]. The phenolic compounds involved in the immune response to pathogen attack include salicylic and chlorogenic acids. Salicylic acid controls the content of the signal molecule hydrogen peroxide (H2O2) responsible for plant resistance to environmental stresses. Salicylic acid activates superoxide dismutase (SOD), which boosts H2O2 production and stimulates the synthesis of pathogenesis related proteins (PR)—chitinases and glucanases that decompose the cell wall of the fungal hyphae [56,57]. Salicylic acid participates in systemic acquired resistance (SAR). This reaction is triggered in the case of biotrophic fungi infection. The fungi from Fusarium species are classified as hemibiotrophic ones, which means that the pathogens initially behave like biotrophic fungi and then switch on to the optional parasitization mode [52]. Another group of compounds participating in the immune response to pathogens is phytoalexins, i.e., low molecular weight phenolics. They are derivatives of benzoic acid, stilbene, coumarin or quercetin [58,59]. The synthesis of phenolic compounds requires a large energy input, and therefore, it depends on the accumulation of the number of soluble sugars in the cells. We confirmed this correlation in our experiments. High correlation (r = 0.631; p < 0.05) between TSC and TPC may indicate the plant defense response to the infection consisting in the increase of TSC consumption for ATP synthesis and further use of this energy in the synthesis of phenolics. SMH87 plants, more sensitive to F. culmorum, showed a significant decrease in the phenolic content in the leaves as compared with the other accessions. Contrary to that, the most resistant BC5Nax2line was characterized by the highest content of phenolics in the leaves and roots of the control and infected seedlings. Hakulinen et al. [60] suggested that the lowered content of phenolics may be caused by the synthesis of lignin that is a polymer of oxidized phenolic alcohols. Lignin fortifies cell walls making them difficult for fungal hyphae to colonizing the host plant [61,62]. Datta and Lal [63] and Noman et al. [64] reported this phenomenon as a hypersensitivity reaction initiated as a plant defense mechanism to developing an infection. In our experiment, a decrease in leaf TPC was associated with higher content of cell-wall-bound phenolic compounds (CWP) only in BC5Nax2. The same line revealed a relationship between decreased root TPC and increased accumulation of CWP. The leaf CWP content positively correlated with the content of H2O2 (r = 0.679; p < 0.05). In the leaves, TPC content negatively correlated with H2O2 levels, while TPC content in the roots negatively correlated with H2O2 concentration in both studied organs. These negative correlations may suggest that during Fusarium infection, TPC acted as antioxidants and possibly reduced H2O2 amount.
Antioxidant enzymes, such as CAT, POXs, and SOD, form the first line of defense against ROS during the entire pathogenesis [65,66,67]. Superoxide dismutase (SOD) is responsible for the dismutation of the superoxide radicals to molecular oxygen and hydrogen peroxide. CAT and POX decompose H2O2. Some studies reported that Fusarium infections boosted the activity of the antioxidant enzymes [68,69,70]. In the investigated wheat seedlings, we detected greater POX and SOD activity in the roots than in the leaves. It can be explained by the fact that the in vitro infection started in the roots growing in the infected medium. In the roots we observed a correlation between SOD activity and H2O2 accumulation (r = 0.613; p < 0.05), while in the leaves there was a correlation between CAT and POX activity and H2O2 (r = 0.710 and r = 0.688; p < 0.05, respectively). We recorded high negative correlation between TPC content and CAT and POX activity in the leaves (r = −0.788 and r = −0.515; p < 0.05, respectively). These results may suggest a competition between antioxidant enzymes and phenolic compounds for H2O2, which can indicate the antioxidant properties of phenolics. We reported higher activity of the antioxidant enzymes and higher levels of H2O2 in the control leaves than in the control roots. The infection decreased the activity of the antioxidant system in the roots, but not in the leaves. The enzyme activity poorly differentiated the studied accessions regarding their resistance to F. culmorum. Only CAT activity was twofold higher in the infected SMH87 leaves, considered by us to be more sensitive to Fusarium, while in cv. ‘Tamaroi’ and BC5Nax2 line this activity was lower or remained unchanged. Płażek and Żur [71] indicated that low activity of CAT could be a marker of a plant resistance to a fungal infection, as CAT decomposes H2O2 that is necessary for the defense as a signal molecule.
Fusarium head blight causes huge yield losses in cereals, reaching over 40%. The disease reduces grain yield, its mass, nutritional value and leads to grain contamination with mycotoxins [6]. Our research confirmed that spike infection not only reduces the grain mass, but also lowers the final yield. The reduction of yield parameters is also associated with high concentrations of mycotoxins in the grain. Negative correlation between the examined yield parameters (amount of grain per spike, mass of grain per spike, mass of a single grain, and mass of thousand seeds) and the content of NIV and DON suggest the reduction of the yield is mainly, due to accumulated toxins. ZEN content only affected the mass of a single grain, and we found no relationships between T–2 toxin and the yield. The visual assessment of spike infestation degree (FHBi) was performed at two terms: Seven and fourteen days after infection. In both terms, FHBi highly negatively correlated with the yield parameters. It could be stated that FHBi, especially 7 days after the infection, is a reliable method to determine cereal resistance to the infection, as confirmed by other studies [72,73].The statistical analysis showed a strong correlation between FHBi 7 and 14 days after the infection, and DON accumulation in the grain (r = 0.733, r = 0.632, p < 0.05, respectively), and NIV content (r = 0.731, r = 0.630, p < 0.05, respectively). A similar relationship between FHBi and DON accumulation was observed by Haidukowski et al. [74] in common wheat. Nowicki et al. [75] and Pascale et al. [76] claimed that FHBi can be used to predict the grain contamination degree with mycotoxins before performing detailed analyses. In our research, we used NIV-chemotype isolate of F. culmorum, which is considered a milder Fusarium chemotype than DON-chemotype or acetyl derivatives (3AcDON, 15AcDON) [77,78]. Desjardin and Plattner [79] reported that F. culmorum NIV-chemotypes can produce DON, but in amounts <1% of NIV, while DON-chemotypes are not capable of producing NIV [80]. In our experiments, we observed increased level of DON in relation to NIV, which contradicted the hypothesis presented by Dejsrdin and Plattner [79].

4. Materials and Methods

4.1. Plant Material and Experimental Design

Two experiments were performed in 2020. The first was an in vitro assay testing the plant resistance to Fusarium, and the other involved plants at the anthesis stage grown in an open foil tunnel. Three durum wheat accessions differing in salt–stress tolerance were used: Polish moderately sensitive SMH87 line (courtesy of Dr. Jarosław Bojarczuk, Plant Breeding Centre in Smolice, IHAR Group, Poland), sensitive Australian cultivar ‘Tamaroi’, and resistant BC5Nax2 line (courtesy of Dr. Richard A. James, CSIRO Plant Industry, Acton, Australia). These accessions were investigated in previous studies on durum wheat tolerance to salinity and cadmium.

4.1.1. Preparation of Fusarium culmorum Isolate

In both experiments, the plants or seeds were infected with IPO348–01 nivalenol chemotype mycelium of F. culmorum from the Plant Breeding Institute, Wageningen (Netherland). Mycelium box test was performed in in vitro conditions on seedlings grown on inoculated Potato Dextrose Agar (PDA) medium (Sigma–Aldrich, Poznań, Poland). The mycelium was grown in a microbiological thermostatic chamber (ST 5 Smart, Pol–Aura Aparatura, Wodzisław Śląski, Poland) at 21 °C, in darkness for seven days [32]. The mycelium production for the open tunnel experiment followed the method described by Wiśniewska et al. [81]. An Erlenmeyer glass flask (250 cm3) was filled with 50 g of spring wheat seeds, and 15 cm3 of water w added to obtain 40% humidity. After 24 h, the seeds were autoclaved at 101 325 Pa, at 121 °C for 30 min and then cooled. The infection was initiated by transferring three 1.5 cm discs of PDA medium. The glass flasks were placed in the microbiological thermostatic chamber (ST 5 Smart, Pol–Aura Aparatura, Wodzisław Śląski, Poland), and the mycelium was growing at 20 ± 1 °C for five to six weeks in darkness. The flasks were shaken thoroughly every day to prevent sticking the grain to the glass, and to also provide uniform inoculation of the grain.

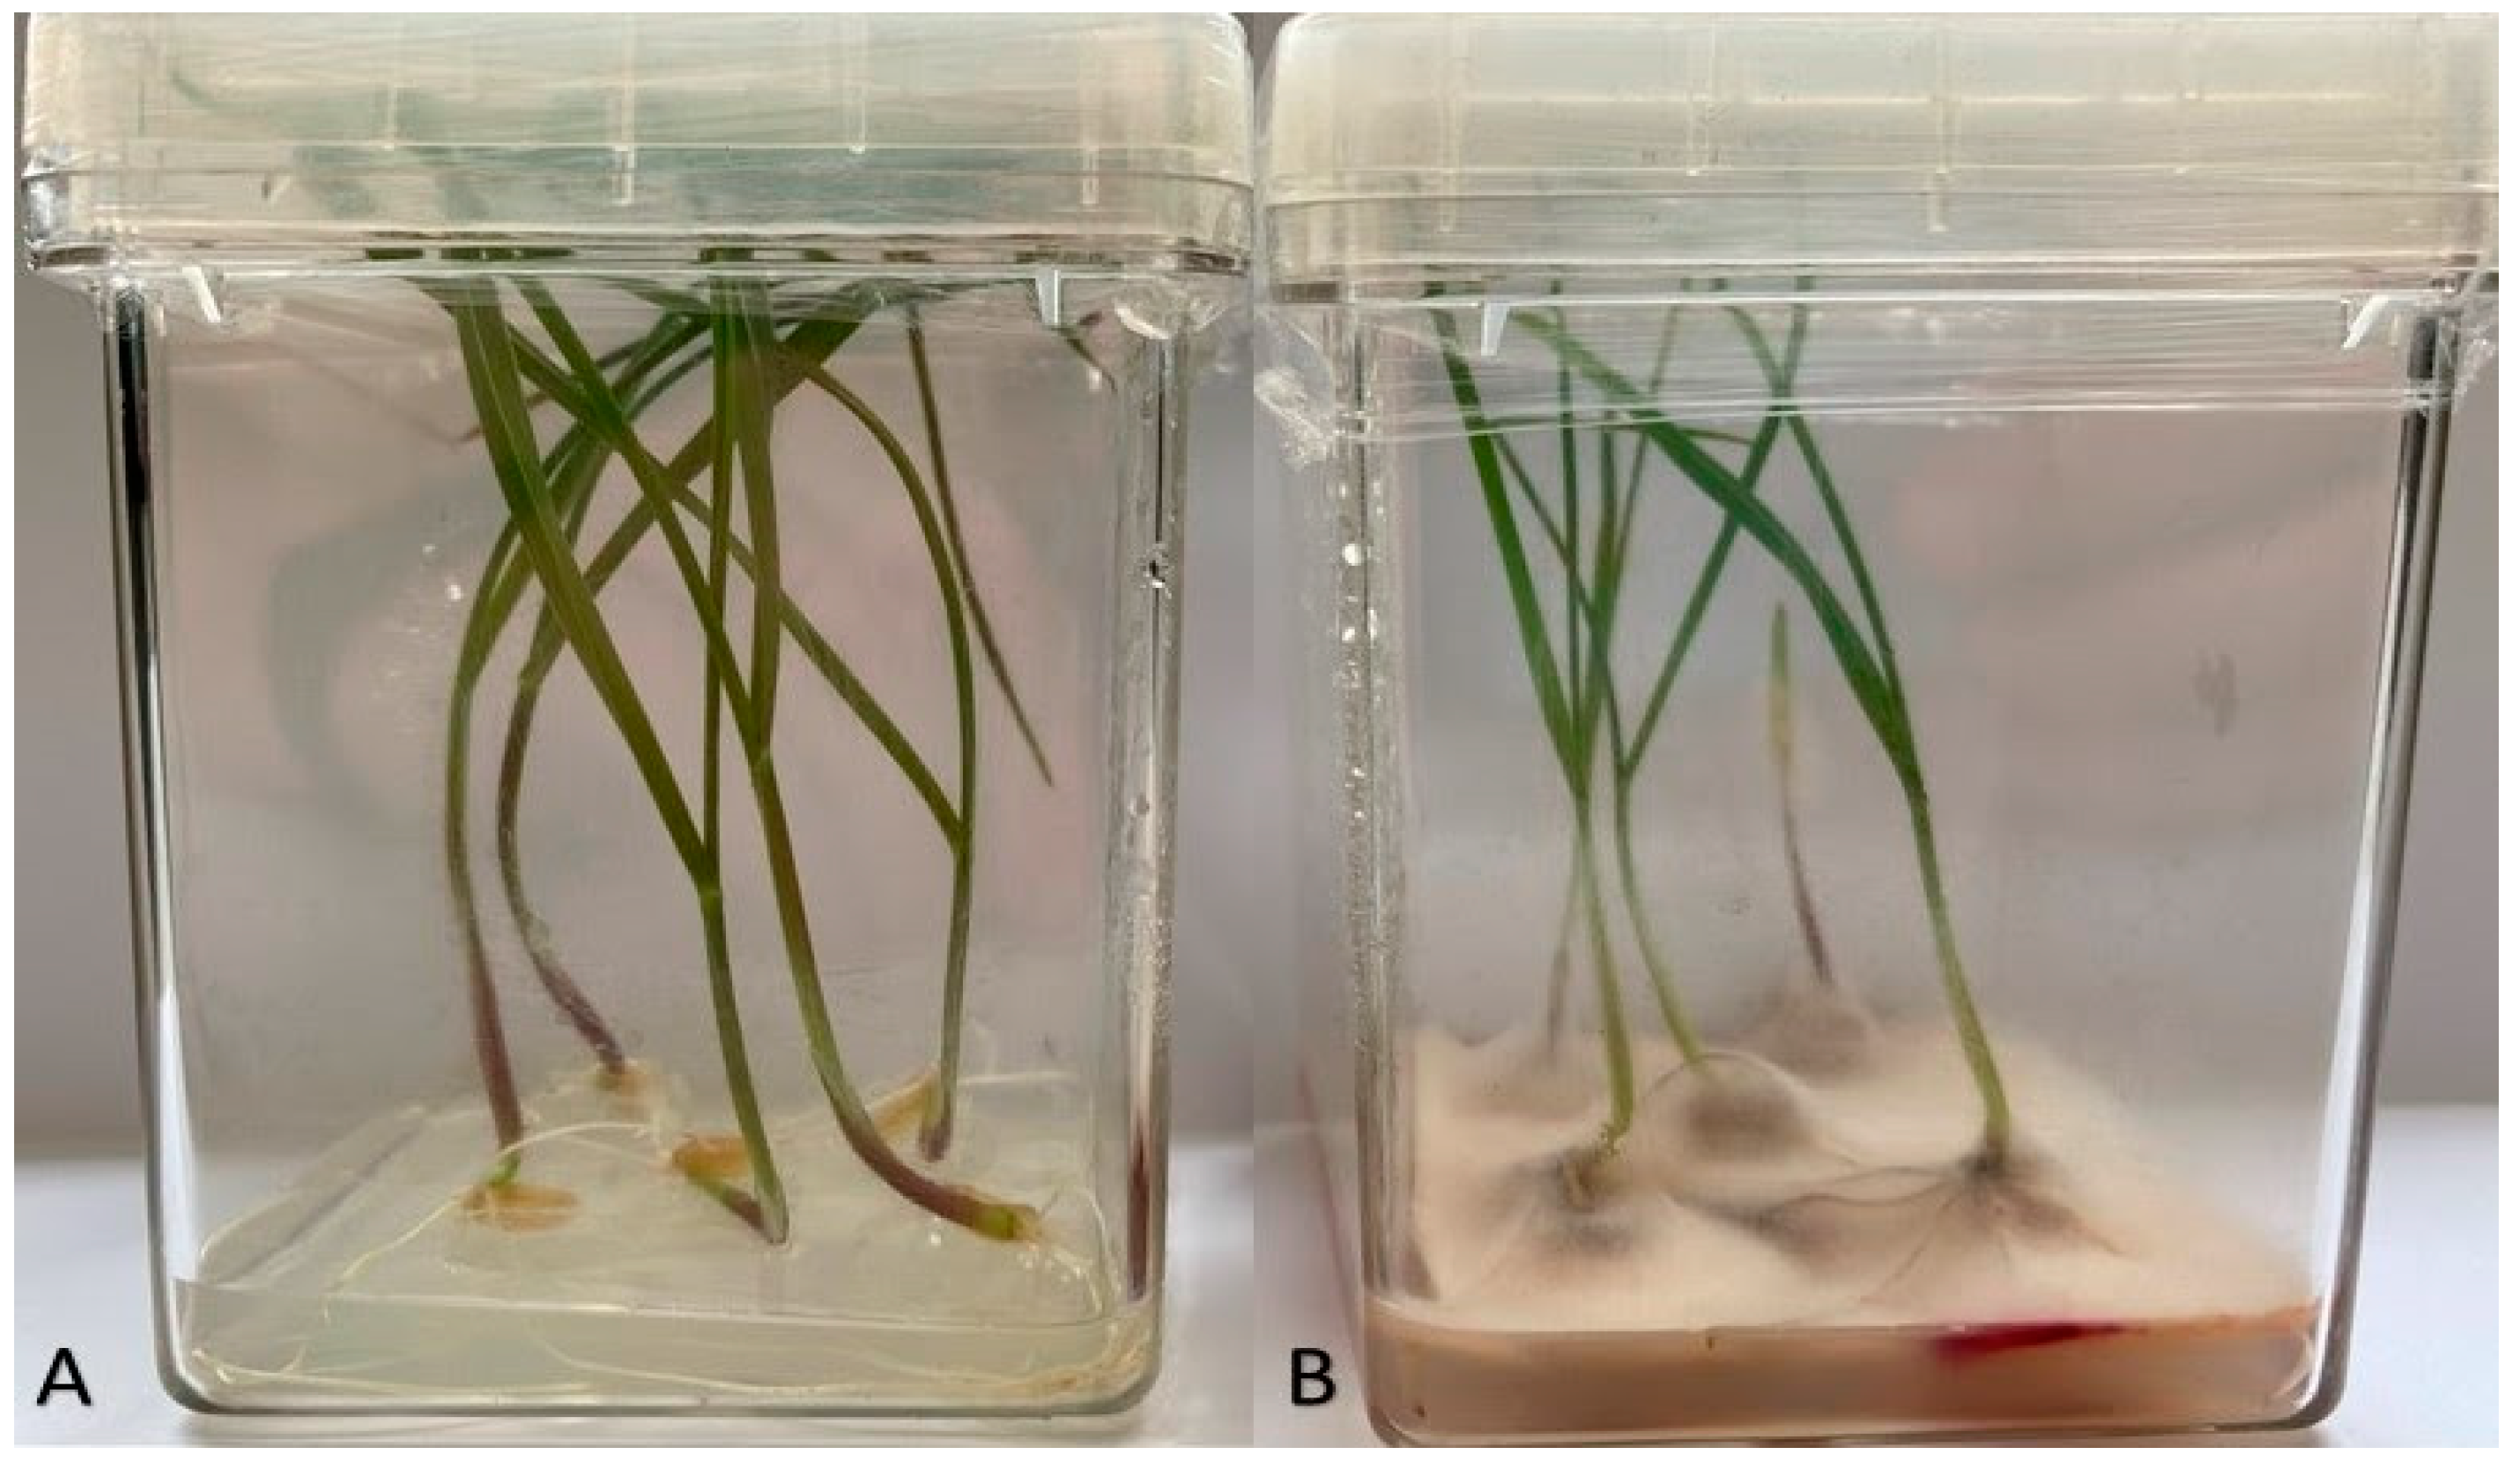
4.1.2. Experiment I—Box Test Assay

This experiment was performed on the seedlings grown in Magenta GA–7 Boxes (Sigma–Aldrich, Poznań, Poland) under sterile conditions. The boxes were filled with 20 cm3 of MS medium [82]. Discs (5 mm) of PDA medium overgrown with Fusarium mycelium were cut and transferred into magenta boxes on MS medium (five discs per box). The seeds were surface disinfected in 20% commercial bleach (active ingredient sodium hypochlorite) for 20 min, rinsed three times for 2 min with sterile water, and transferred into Petri dishes lined with wetted sterile filter paper for 24 h germination. The germinating seeds (five seeds per Magenta-Box) were placed on mycelium discs. The control seeds were placed on PDA medium discs free of the pathogen (Figure 6). The experiment was performed in six replicates for each accession/treatment (magenta with control and inoculated seeds) combination. Vegetation in both treatments was conducted on MS medium. Vegetation conditions were maintained for 14 days in a growth chamber at 22/20 °C (day/night), the light intensity of 150 μmol m−2·s−1 PPFD (Photosynthetic Photon Flux Density) and 12 h/12 h (day/night) photoperiod with 100% air humidity.
Two weeks after inoculation, the leaves and roots were collected separately, weighed, and frozen in liquid nitrogen. The subsequent analyses involved: Visual disease rating (DR), chlorophyll a, b, and carotenoid content (Chla, b, and car), total soluble carbohydrate content (TSC), the content of total phenolic compounds (TPC), and cell wall-bound phenolics (CWP), antioxidant enzyme activities, hydrogen peroxide content (H2O2), and fresh weight (FW) of leaves and roots.

4.1.3. Experiment II—Open Foil Tunnel

The experiment was carried out in semi-controlled conditions in an open foil tunnel. The seeds were sown into plastic pots (20 × 20 × 25 cm; nine seeds per pot), in six replicates (six pots) for each accession/treatment (control and inoculated plants) combination. The plants were cultivated in universal garden soil substrate pH = 5.8 (Ekoziem, Jurkow, Poland) mixed with sand (1:1, v/v). Before sowing, the seeds were sterilized in 70% ethanol for one minute and rinsed with sterile water three times for two minutes. Once a week, the plants were fertilized with Hoagland medium [83]. The plants were cultivated until the full anthesis stage—65 BBCH scale [40]. Their spikes were sprayed with the inoculum containing F. culmorum spores, while control spikes were sprayed with distilled water. Disease symptoms were evaluated seven and fourteen days after inoculation (DAI 7 and DAI 14). Ripe seeds were collected, and the following yield parameters were evaluated: Number and weight of seeds per spike, the weight of a single seed, and weight of one thousand seeds. Moreover, the content of the following mycotoxins was determined: deoxynivalenol (DON) and its derivatives 3–acetyldeoxynivalenol (3AcDON), 15–acetyldeoxynivalenol (15AcDON), nivalenol (NIV), zearalenone (ZEN) and its derivatives alpha–Zearalanol (α–ZAL), beta–Zearalanol (β–ZAL), alpha–Zearalanol (α–ZEL), beta–Zearalenol (β–ZEL), and T–2 toxin.

4.2. Analyses

4.2.1. Disease Rating (DR) and Loss of Fresh Weight (FW)

Direct assessment based on disease rating (DR) was calculated with the formula described by Warzecha et al. [84] to determine the effect of infection on seedling and root development.
DR% = 100 × (ni × Di)/NDmax
where: ni—number of plants of ith category, Di—numerical value of ith category, N—total number of plants in the sample, and Dmax—maximum scale value (0–5) [42].
To assess the impact of the infection, we also determined the fresh weight (FW) of leaves and roots. All measurements were done in thirty replicates for each cultivar/line.

4.2.2. Chlorophyll (a, b) and Carotenoid (Car) Content

Chlorophylls and carotenoids were estimated spectrophotometrically, according to Czyczyło-Mysza et al. [85]. Plant Leaves samples were dried at 65 °C for 48 h, weighed, and then extracted in 96% ethanol (5 mg/1.5 cm3), and centrifuged (21,000× g, 5 min at 15 °C). The extract was transferred to 96 well plate, and the absorbance was read at 470, 648, and 664 nm (Synergy II, Biotek, Winooski, VT, USA). The concentrations of Chla, Chlb, and total carotenoids (car) were calculated using Lichtenthaler and Buschman [86] equations:
Chla (μg/cm3) = 13.36 A664 − 5.19 A648
Chlb (μg/cm3) = 27.43 A648 − 8.12 A664
Car (μg/cm3) = (1000 A470−2.13 Chla − 97.64 Chlb)/209
where: Chla = chlorophyll a, Chlb = chlorophyll b, A470 = absorbance at 470 nm, A664 = absorbance at 664 nm, A648 = absorbance at 648 nm.

4.2.3. Determination of Total Water-Soluble Carbohydrates (TSC)

Sugars were analyzed by the phenol-sulfuric method of Dubois et al. [87], with modifications reported by Bach et al. [88]. The samples extracted, as for pigment estimation (10 µL) were diluted to 200 μL with water, and 200 μL of 5% phenol (w/w) solution was added. Then, 1 cm3 of concentrated sulfuric acid was dispensed, the samples were mixed, and after 20 min incubation at ambient temperature and transferred to 96-well plates and absorbance was read at 490 nm (Synergy II, Biotek, Winooski, VT, USA). Sugar content was expressed as glucose equivalents—using the calibration curve obtained with a standard solution of glucose.

4.2.4. Determination of Total Phenolic Compounds (TPC)

Estimation of total phenolic content was done according to the Singleton method with modifications [88]. The extracts (prepared as described for pigments) were mixed with water diluted Folin–Ciocalteu phenol reagent (5:2, v/v) and after 10 min saturated Na2CO3 (c.a. 25% w/w) was added (100/400/400 µL). The samples were then incubated for 2 h in darkness, at room temperature. After centrifugation (21,000× g, for 15 min at 15 °C), they were transferred to 96-well plates. Their absorbance was recorded at 760 nm (Synergy II, Biotek, Winooski, VT, USA). The pool of phenolic compounds was expressed as mg of gallic acid—using the calibration curve obtained with a standard solution of gallic acid.

4.2.5. Determination of Cell Wall-Bound Phenolics (CWP)

The pellets remaining after extraction of pigments were rinsed with ethanol and hydrolyzed with 3 M NaOH [89] overnight, at room temperature. Then the samples were neutralized with concentrated HCl, then ethanol was added (1 cm3 per sample), and the resulting solution was analyzed for released phenolics as for soluble forms described in Section 4.2.4.

4.2.6. Activity of Enzymatic Antioxidants

Plant material was homogenized at 4 °C in 50 mM (pH 7) phosphate-potassium buffer containing 0.1 mM EDTA (100 mg of FW plant material per 1 cm3 of buffer). The activity of superoxide dismutase (SOD, EC 1.15.1.1), catalase (CAT, E.C. 1.11.1.6), and peroxidase (POX, EC 1.11.1.7) were determined. After centrifugation (10,000× g, 15 min at 4 °C, 32R, Hettich, Germany), clear supernatant was sub-sampled and assayed for SOD, CAT, and POX activity in 96-well plate format (Synergy II, Biotek, Winooski, VT). SOD activity was determined by the cytochrome reduction method of McCord and Fridovic [90]. CAT activity was measured at 240 nm according to Aebi [91], with H2O2 as a substrate. The activity of POX was assessed using the Lück [92] method with p–phenylenediamine as substrate, the absorbance was monitored at 485 nm. The analyses were conducted as described by Gudys et al. and references are cited therein [93,94,95]. Enzyme activities were presented on a protein basis. Protein content was assayed with the standard Bradford method [96].

4.2.7. Hydrogen Peroxide Content

Plant material was homogenized at 4 °C in 50 mM (pH 7) phosphate-potassium buffer containing 0.1 mM EDTA, as described for enzyme activity analyses. Hydrogen peroxide content was estimated with a commercial Amplex Red (10–acetyl–3,7–dihydroxyphenoxazine) [97] reagent kit (Invitrogen, Waltham, MA, USA), according to the manufacturer’s manual [98]. Briefly, the plant sample was diluted with the reaction buffer, and the working solution containing fluorescence probe precursor (Amplex Red), and 0.2 U·cm−3 horseradish peroxidase was added. After 30 min incubation, fluorescence was read at Ex/Em 530/590 nm in 96-well plate format (Synergy II, Biotek, Winooski, VT, USA). The results were quantitated based on a calibration curve made for H2O2.

4.2.8. Spore Suspension Preparation and Spike Inoculation Procedure

The spikes were inoculated with the spore suspension of F. culmorum prepared as described by Góral et al. [12]. The grain inoculated with F. culmorum mycelium and conidia were soaked in distilled water for 1 h and then filtered over two layers of sterile cheesecloth. The spore concentration of the suspension was adjusted to 5 × 10⁵ spores · cm−3 using Thoma’s chamber. The inoculation was performed according to the methodology described by Warzecha et al. [99], with slight modifications. The spikes from each line were sprayed separately with a hand sprayer, using 2 cm3 of the conidia suspension per spike, and covered for 48 h with plastic bags. Control plants were sprayed with distilled water, and covered with plastics bags to provide the same experimental conditions. Inoculation was done early in the morning, when the air humidity was relatively high (70–80 %) and the temperature was low (10–14 °C).
The spike inoculation procedure was performed twice. The first inoculation was done three days before the full anthesis stage and repeated seven days later. Seven days after each inoculation, Fusarium head blight index (FHBi) was visually evaluated for each accession and calculated using the formula described by Góral et al. [12]:
FHBi = % of head infection × % of head infection per accession/100
Forty-five spikes from each accession at the full ripening stage were harvested, evaluated for yield reduction after Fusarium inoculation, and compared with non-inoculated plants. The following yield parameters were calculated: Amount of grain per spike, grain mass per spike, mass of a single grain, and mass of one thousand grains (MTS). After the evaluation of the yield parameters, seed material was collected and stored at −20 °C until mycotoxin analyzes.

4.2.9. UHPLC-MS/MS Estimation of Mycotoxin Accumulation

The samples were analyzed for the content of 10 different mycotoxins by using UHPLC–MS/MS (ultrahigh-performance liquid chromatography coupled with tandem mass spectrometer) as reported by Dziurka et al. [100], with modifications. Plant materials were extracted according to the procedure described by Klötzel and Lauber [101]. The ground samples (0.1 g) were extracted three times in 1 cm3 of acetonitrile and water (80:20, v/v) solution (5 min, 30 Hz, 400 MM, Retch, Haan, Germany). Fifty nanograms of heavy-labeled internal standard ([13C18]–ZEN, and [13C15]–DON) were added to each sample. After centrifugation, the samples were cleaned up on Bond Elut Mycotoxin cartridges (3 cm3 500 mg, Agilent Technologies, Germany). The column eluate was evaporated under N2, and the residue was resuspended in 100 μL of acetonitrile/water (50:50, v/v), and analyzed. The mycotoxins (DON, NIV, sum of 3–acetyl–DON and 15–acetyl–DON, T–2, sum of zearalenone and its derivatives: a–, b–ZEL, a–, b–ZAN and ZEN, and OTA) were determined using the UHPLC system (Infinity 1260, Agilent Technologies, Germany) with a tandem quadrupole mass spectrometer (QQQ 6410, Agilent Technologies, USA). The samples were separated on a Poroshell 120 Phenyl–Hexyl 2.1 × 5 mm, 2.7 μM column with a gradient of water (A) and methanol (B) both with 0.1% formic acid, from 5% to 75% methanol in 7.5 min, at a flow rate of 0.5 cm3 min−1. Multiple reaction monitoring (MRM) transitions after positive ESI ionization were used for identification and quantification (details are given in Table S1). Quantitation was based on calibration curves obtained with authentic standards taking account of the recovery rates of the internal standard used. The standards were supplied by Romer (Tulin, Austria), except for zearalenone and its derivatives which were supplied by Sigma-Aldrich (Poznań, Poland)

4.2.10. Yield Components

Ripe seeds were collected, and the yield parameters were evaluated. Number and weight of seeds per spike were calculated in 45 replicates, the weight of a single seed was measured in 45 replicates, while the mass of one thousand seeds (MTS) was measured in three replicates, for each accession/treatment combination.

4.3. Statistical Analyses

The experiments were arranged and performed with the application of a completely randomized design. The normal distribution of data was analyzed using Shapiro–Wilk test. Two-way analysis of variance (ANOVA) and Duncan’s multiple range test (at p < 0.05) were performed using the statistical package Statistica 13.3 (Stat–Soft, Inc., Tulsa, OK, USA). The data were presented as means ± SE (standard error). Pearson’s correlation coefficients were assumed as statistically significant at p < 0.05.

5. Conclusions

  • Fusarium culmorum infection significantly reduces the content of active photosynthetic pigments and the weight of leaves and roots.
  • The infected cv. ‘Tamaroi’ and BC5Nax2 plants recognized as more resistant to F. culmorum than SMH87, accumulated increased amounts of sugar in the leaves, which correlated with an increased number of phenolic compounds.
  • Phenolic compounds participate in H2O2 decomposition in durum wheat plants infected by F. culmorum.
  • The study confirmed the important role of H2O2 in increasing the content of phenolic compounds that are then incorporated into cell walls of plants infected with F. culmorum.
  • Nivalenol and deoxynivalenol secreted by F. cumlorum significantly reduce the yield of durum wheat.
  • Early evaluation of durum wheat spikes infection done seven days after inoculation with F. culmorum spores may help predict the potential degree of DON and NIV accumulation in the grain.

Supplementary Materials

The following are available online at https://www.mdpi.com/article/10.3390/ijms22147433/s1, Table S1: Multiple reactions monitoring (MRM) transitions for the analyzed mycotoxins at positive ion mode (+ESI), capillary voltage 4 kV, gas temperature 300 °C, gas flow 12 L/min and nebulizer pressure 35 psi. MassHunter software was used to control the UHPLC–MS/MS system and in data analysis. For MRM parameters optimization MassHunter Optimizer was used.

Author Contributions

The experiments were conceived and designed by J.P. and A.P.; the experiments were performed by J.P.; biochemical analyses were performed by J.P., A.S., M.D., M.H., P.K. and M.S.; UHPLC-MS/MS analyses was performed by M.D.; the data were statistically analyzed by J.P., A.P.; the original draft paper was written by J.P.; the review and editing were done by J.P. and A.P. All authors have read and agreed to the published version of the manuscript.

Funding

This research was supported by the Polish Ministry of Education and Science (scientific subsidy for the University of Agriculture in Kraków).

Institutional Review Board Statement

Not applicable.

Informed Consent Statement

Not applicable.

Data Availability Statement

All data relevant to the main findings of this study are included within the article and supplementary material.

Conflicts of Interest

The authors declare no conflict of interest.

References

  1. Xu, X.; Nicholson, P. Community Ecology of Fungal Pathogens Causing Wheat Head Blight. Annu. Rev. Phytopathol. 2009, 47, 83–103. [Google Scholar] [CrossRef]
  2. Salgado, J.D.; Madden, L.; Paul, P.A. Efficacy and Economics of Integrating In-Field and Harvesting Strategies to Manage Fusarium Head Blight of Wheat. Plant Dis. 2014, 98, 1407–1421. [Google Scholar] [CrossRef] [PubMed] [Green Version]
  3. Wang, H.; Sun, S.; Ge, W.; Zhao, L.; Hou, B.; Wang, K.; Lyu, Z.; Chen, L.; Xu, S.; Guo, J.; et al. Horizontal gene transfer of Fhb7 from fungus underlies Fusarium head blight resistance in wheat. Science 2020, 368, eaba5435. [Google Scholar] [CrossRef] [PubMed]
  4. Bennett, J.W.; Klich, M. Mycotoxins. Clin. Microbiol. Rev. 2003, 16, 497–516. [Google Scholar] [CrossRef] [Green Version]
  5. Trail, F. For Blighted Waves of Grain: Fusarium graminearum in the Postgenomics Era. Plant Physiol. 2009, 149, 103–110. [Google Scholar] [CrossRef] [PubMed] [Green Version]
  6. Bottalico, A.; Perrone, G. Toxigenic Fusarium species and mycotoxins associated with head blight in small-grain cereals in Europe. Mycotoxins Plant Dis. 2002, 108, 611–624. [Google Scholar] [CrossRef]
  7. Foroud, N.A.; Eudes, F. Trichothecenes in Cereal Grains. Int. J. Mol. Sci. 2009, 10, 147–173. [Google Scholar] [CrossRef] [Green Version]
  8. Marín, S.; Ramos, A.J.; Cano-Sancho, G.; Sanchis, V. Mycotoxins: Occurrence, toxicology, and exposure assessment. Food Chem. Toxicol. 2013, 60, 218–237. [Google Scholar] [CrossRef]
  9. Commission Regulation (EC) No 1126/2007 of 28 September 2007 Amending Regulation (EC) No 1881/2006 Setting Maxi-mum Levels for Certain Contaminants in Foodstuffs as Regards Fusarium Toxins in Maize and Maize Products (Text with EEA Relevance). Available online: https://eur-lex.europa.eu/legal-content/EN/ALL/?uri=CELEX:32007R1126 (accessed on 2 February 2021).
  10. Commission Recommendation of 17 August 2006 on the Presence of Deoxynivalenol, Zearalenone, Ochratoxin A, T-2 and HT-2 and Fumonisins in Products Intended for Animal Feeding (Text with EEA Relevance). Available online: https://eur-lex.europa.eu/legal-content/EN/TXT/?uri=CELEX:32006H0576 (accessed on 2 February 2021).
  11. Boutigny, A.-L.; Richard-Forget, F.; Barreau, C. Natural mechanisms for cereal resistance to the accumulation of Fusarium trichothecenes. Eur. J. Plant Pathol. 2008, 121, 411–423. [Google Scholar] [CrossRef]
  12. Góral, T.; Wiśniewska, H.; Ochodzki, P.; Nielsen, L.K.; Walentyn-Góral, D.; Stępień, Ł. Relationship between Fusarium Head Blight, Kernel Damage, Concentration of Fusarium Biomass, and Fusarium Toxins in Grain of Winter Wheat Inoculated with Fusarium culmorum. Toxins 2018, 11, 2. [Google Scholar] [CrossRef] [Green Version]
  13. Tarkowski, Ł.P.; Van De Poel, B.; Höfte, M.; Ende, W.V.D. Sweet Immunity: Inulin Boosts Resistance of Lettuce (Lactuca sativa) against Grey Mold (Botrytis cinerea) in an Ethylene-Dependent Manner. Int. J. Mol. Sci. 2019, 20, 1052. [Google Scholar] [CrossRef] [Green Version]
  14. Streuter, N.; Moerschbacher, B.; Fischer, Y.; Noll, U.; Reisener, H. Fructose-2,6-Bisphosphate in Wheat Leaves Infected with Stem Rust. J. Plant Physiol. 1989, 134, 254–257. [Google Scholar] [CrossRef]
  15. Gaudet, D.A.; Laroche, A.; Yoshida, M. Low temperature-wheat-fungal interactions: A carbohydrate connection. Physiol. Plant. 1999, 106, 437–444. [Google Scholar] [CrossRef]
  16. Morkunas, I.; Marczak, Ł.; Stachowiak, J.; Stobiecki, M. Sucrose-induced lupine defense against Fusarium oxysporum: Sucrose-stimulated accumulation of isoflavonoids as a defense response of lupine to Fusarium oxysporum. Plant Physiol. Biochem. 2005, 43, 363–373. [Google Scholar] [CrossRef]
  17. Nicholson, R.L.; Hammerschmidt, R. Phenolic Compounds and Their Role in Disease Resistance. Annu. Rev. Phytopathol. 1992, 30, 369–389. [Google Scholar] [CrossRef]
  18. Zaynab, M.; Fatima, M.; Abbas, S.; Sharif, Y.; Umair, M.; Zafar, M.H.; Bahadar, K. Role of secondary metabolites in plant defense against pathogens. Microb. Pathog. 2018, 124, 198–202. [Google Scholar] [CrossRef] [PubMed]
  19. Walter, S.; Nicholson, P.; Doohan, F. Action and reaction of host and pathogen during Fusarium head blight disease. New Phytol. 2009, 185, 54–66. [Google Scholar] [CrossRef] [PubMed]
  20. Das, K.; Roychoudhury, A. Reactive oxygen species (ROS) and response of antioxidants as ROS-scavengers during environmental stress in plants. Front. Environ. Sci. 2014, 2, 53. [Google Scholar] [CrossRef] [Green Version]
  21. De Gara, L.; Locato, V.; Dipierro, S.; de Pinto, M.C. Redox homeostasis in plants. The challenge of living with endogenous oxygen production. Respir. Physiol. Neurobiol. 2010, 173, S13–S19. [Google Scholar] [CrossRef]
  22. Foyer, C.H.; Noctor, G. Redox homeostasis and antioxidant signaling: A metabolic interface between stress perception and physiological responses. Plant Cell 2005, 17, 1866–1875. [Google Scholar] [CrossRef] [Green Version]
  23. Zurbriggen, M.D.; Carrillo, N.; Tognetti, V.B.; Melzer, M.; Peisker, M.; Hause, B.; Hajirezaei, M.-R. Chloroplast-generated reactive oxygen species play a major role in localized cell death during the non-host interaction between tobacco and Xanthomonas campestris pv. vesicatoria. Plant J. 2009, 60, 962–973. [Google Scholar] [CrossRef] [PubMed]
  24. Barna, B.; Fodor, J.; Harrach, B.; Pogany, M.; Király, Z. The Janus face of reactive oxygen species in resistance and susceptibility of plants to necrotrophic and biotrophic pathogens. Plant Physiol. Biochem. 2012, 59, 37–43. [Google Scholar] [CrossRef]
  25. Waśkiewicz, A.; Beszterda, M.; Goliński, P. Nonenzymatic Antioxidants in Plants. In Oxidative Damage to Plants; Elsevier: Amsterdam, The Netherlands, 2014; pp. 201–234. [Google Scholar]
  26. Yang, T.; Poovaiah, B.W. Hydrogen peroxide homeostasis: Activation of plant catalase by calcium/calmodulin. Proc. Natl. Acad. Sci. USA 2002, 99, 4097–4102. [Google Scholar] [CrossRef] [PubMed] [Green Version]
  27. Madadkhah, E.; Lotfi, M.; Nabipour, A.; Rahmanpour, S.; Banihashemi, Z.; Shoorooei, M. Enzymatic activities in roots of melon genotypes infected with Fusarium oxysporum f. sp. melonis race 1. Sci. Hortic. 2012, 135, 171–176. [Google Scholar] [CrossRef]
  28. Wang, W.; Xia, M.X.; Chen, J.; Yuan, R.; Deng, F.N.; Shen, F. Gene expression characteristics and regulation mechanisms of superoxide dismutase and its physiological roles in plants under stress. Biochemistry 2016, 81, 465–480. [Google Scholar] [CrossRef]
  29. Gechev, T.S.; Hille, J. Hydrogen peroxide as a signal controlling plant programmed cell death. J. Cell Biol. 2005, 168, 17–20. [Google Scholar] [CrossRef] [PubMed] [Green Version]
  30. Hao, S.; Liu, S.; Zhang, Z.; Gui, H.; Duan, J.; Chen, Q. Characteristics of chlorophyll metabolism and chlorophyll fluorescence in the silvered leaf of summer squash. Acta Hortic. Sinica. 2009, 36, 879–884. [Google Scholar]
  31. Alwathnani, H.A. Biological control of fusarium wilt of tomato by antagonist fungi and cyanobacteria. Afr. J. Biotechnol. 2012, 11, 1100–1105. [Google Scholar] [CrossRef]
  32. Warzecha, T.; Skrzypek, E.; Sutkowska, A. Effect of Fusarium culmorum infection on selected physiological and biochemical parameters of barley (Hordeum vulgare L.) DH lines. Physiol. Mol. Plant Pathol. 2015, 89, 62–69. [Google Scholar] [CrossRef]
  33. Wagacha, J.; Muthomi, J. Fusarium culmorum: Infection process, mechanisms of mycotoxin production and their role in pathogenesis in wheat. Crop. Prot. 2007, 26, 877–885. [Google Scholar] [CrossRef]
  34. Chekali, S.; Gargouri, S.; Paulitz, T.; Nicol, J.M.; Rezgui, M.; Nasraoui, B. Effects of Fusarium culmorum and water stress on durum wheat in Tunisia. Crop. Prot. 2011, 30, 718–725. [Google Scholar] [CrossRef]
  35. James, R.A.; Blake, C.; Zwart, A.B.; Hare, R.A.; Rathjen, A.J.; Munns, R. Impact of ancestral wheat sodium exclusion genes Nax1 and Nax2 on grain yield of durum wheat on saline soils. Funct. Plant Biol. 2012, 39, 609–618. [Google Scholar] [CrossRef] [PubMed]
  36. Pastuszak, J.; Kopeć, P.; Płażek, A.; Gondek, K.; Szczerba, A.; Hornyák, M.; Dubert, F. Cadmium accumulation in the grain of durum wheat is associated with salinity resistance degree. Plant Soil Environ. 2020, 66, 257–263. [Google Scholar] [CrossRef]
  37. Pastuszak, J.; Kopeć, P.; Płażek, A.; Gondek, K.; Szczerba, A.; Hornyák, M.; Dubert, F. Antioxidant activity as a response to cadmium pollution in three durum wheat genotypes differing in salt-tolerance. Open Chem. 2020, 18, 1230–1241. [Google Scholar] [CrossRef]
  38. Lops, R.; Pascale, M.; Pancaldi, D.; Visconti, A. Infezionifungine e presenza di deossinivalenolo in cariossidi di frumento-prodotte in diverse regioniitaliane. Inf. Fitopatol. 1998, 48, 60–66. [Google Scholar]
  39. Miedaner, T.; Longin, C.F.H. Genetic variation for resistance to Fusarium head blight in winter durum material. Crop. Pasture Sci. 2014, 65, 46–51. [Google Scholar] [CrossRef]
  40. Lancashire, P.D.; Bleiholder, H.; Van Den Boom, T.; Langelüddeke, P.; Stauss, R.; Weber, E.; Witzenberger, A. A uniform decimal code for growth stages of crops and weeds. Ann. Appl. Biol. 1991, 119, 561–601. [Google Scholar] [CrossRef]
  41. Grey, W.E.; Mathre, D.E. Evaluation of spring barleys for reaction to Fusarium culmorum seedling blight and root rot. Can. J. Plant Sci. 1988, 68, 23–30. [Google Scholar] [CrossRef]
  42. Wojciechowski, S.; Chelkowski, J.; Ponitka, A.; Ślusarkiewicz-Jarzina, A. Evaluation of Spring and Winter Wheat Reaction to Fusarium culmorum and Fusarium avenaceum. J. Phytopathol. 1997, 145, 99–103. [Google Scholar] [CrossRef]
  43. Warzecha, T.; Zieliński, A.; Skrzypek, E.; Wójtowicz, T.; Moś, M. Effect of mechanical damage on vigor, physiological parameters, and susceptibility of oat (Avena sativa) to Fusarium culmorum infection. Phytoparasitica 2012, 40, 29–36. [Google Scholar] [CrossRef] [Green Version]
  44. Malalasekera, R.; Sanderson, F.; Colhoun, J. Fusarium diseases of cereals: IX. Penetration and invasion of wheat seedlings by Fusarium culmorum and F. nivale. Trans. Br. Mycol. Soc. 1973, 60, 453–462.IN7. [Google Scholar] [CrossRef]
  45. Knudsen, I.M.B.; Hockenhull, J.; Jensen, D. Biocontrol of seedling diseases of barley and wheat caused by Fusarium culmorum and Bipolaris sorokiniana: effects of selected fungal antagonists on growth and yield components. Plant Pathol. 1995, 44, 467–477. [Google Scholar] [CrossRef]
  46. Płażek, A. Relationship between soluble carbohydrate level and tolerance of meadow fescue callus to Bipolaris sorokiniana (Sacc.) Shoem. and Drechslera dictyoides (Drechsl.) Shoem. metabolites. Acta Physiol. Plant. 1998, 20, 347–351. [Google Scholar] [CrossRef]
  47. Herbers, K.; Takahata, Y.; Melzer, M.; Mock, H.-P.; Hajirezaei, M.; Sonnewald, U. Regulation of carbohydrate partitioning during the interaction of potato virus Y with tobacco. Mol. Plant Pathol. 2000, 1, 51–59. [Google Scholar] [CrossRef] [PubMed]
  48. Pociecha, E.; Płażek, A.; Janowiak, F.; Dubert, F.; Kolasińska, I.; Irla, M. Factors contributing to enhanced pink snow mould resistance of winter rye (Secale cereale L.)–Pivotal role of crowns. Physiol. Mol. Plant Pathol. 2013, 81, 54–63. [Google Scholar] [CrossRef]
  49. Eveland, A.; Jackson, D.P. Sugars, signalling, and plant development. J. Exp. Bot. 2012, 63, 3367–3377. [Google Scholar] [CrossRef] [PubMed] [Green Version]
  50. Bani, M.; Pérez-De-Luque, A.; Rubiales, D.; Rispail, N. Physical and Chemical Barriers in Root Tissues Contribute to Quantitative Resistance to Fusarium oxysporum f. sp. pisi in Pea. Front. Plant Sci. 2018, 9, 199. [Google Scholar] [CrossRef] [PubMed]
  51. Formela-Luboińska, M.; Remlein-Starosta, D.; Waśkiewicz, A.; Karolewski, Z.; Bocianowski, J.; Stępień, Ł.; Labudda, M.; Jeandet, P.; Morkunas, I. The Role of Saccharides in the Mechanisms of Pathogenicity of Fusarium oxysporum f. sp. lupini in Yellow Lupine (Lupinus luteus L.). Int. J. Mol. Sci. 2020, 21, 7258. [Google Scholar] [CrossRef]
  52. Goodman, R.N.; Király, Z.; Wood, K.R. The Biochemistry and Physiology of Plant Disease; University of Missouri Press: Columbia, MO, USA, 1986. [Google Scholar]
  53. Płażek, A.; Hura, K.; Żur, I. Reaction of winter oilseed rape callus to different concentrations of elicitors: Pectinase or chitosan. Acta Physiol. Plant. 2003, 25, 83–89. [Google Scholar] [CrossRef]
  54. Płażek, A.; Hura, K.; Żur, I. Influence of chitosan, pectinase and fungal metabolites on activation of phenylopropanoid pathway and antioxidant activity in oilseed rape callus. Acta Physiol. Plant. 2005, 27, 95–102. [Google Scholar]
  55. Hura, K.; Hura, T.; Dziurka, K.; Dziurka, M. Biochemical defense mechanisms induced in winter oilseed rape seedlings with different susceptibility to infection with Leptosphaeria maculans. Physiol. Mol. Plant Pathol. 2014, 87, 42–50. [Google Scholar] [CrossRef]
  56. Derckel, J.-P.; Audran, J.-C.; Haye, B.; Lambert, B.; Legendre, L. Characterization, induction by wounding and salicylic acid, and activity against Botrytis cinerea of chitinases and β-1,3-glucanases of ripening grape berries. Physiol. Plant. 1998, 104, 56–64. [Google Scholar] [CrossRef]
  57. Arora, N.K.; Kim, M.J.; Kang, S.C.; Maheshwari, D.K. Role of chitinase and β-1,3-glucanase activities produced by a fluorescent pseudomonad and in vitro inhibition of Phytophthora capsici and Rhizoctonia solani. Can. J. Microbiol. 2007, 53, 207–212. [Google Scholar] [CrossRef] [PubMed]
  58. Smith, C. Tansley Review No. 86 Accumulation of phytoalexins: Defence mechanism and stimulus response system. New Phytol. 1996, 132, 1–45. [Google Scholar] [CrossRef]
  59. Bizuneh, G.K. The chemical diversity and biological activities of phytoalexins. Adv. Tradit. Med. 2021, 21, 31–43. [Google Scholar] [CrossRef]
  60. Hakulinen, J.; Sorjonen, S.; Julkunen-Tiitto, R. Leaf phenolics of three willow clones differing in resistance to Melampsora rust infection. Physiol. Plant. 1999, 105, 662–669. [Google Scholar] [CrossRef]
  61. Dixon, R.A.; Paiva, N.L. Stress-Induced Phenylpropanoid Metabolism. Plant Cell 1995, 7, 1085–1097. [Google Scholar] [CrossRef] [PubMed]
  62. Jackson, A.O.; Taylor, C.B. Plant-Microbe Interactions: Life and Death at the Interface. Plant Cell 1996, 8, 1651–1668. [Google Scholar] [CrossRef]
  63. Datta, J.; Lal, N. Temporal and spatial changes in phenolic compounds in response to Fusarium wilt in chickpea and pigeon pea. Cell. Mol. Boil. 2012, 58, 96–102. [Google Scholar]
  64. Noman, A.; Aqeel, M.; Qari, S.H.; Al Surhanee, A.A.; Yasin, G.; Alamri, S.; Hashem, M.; Al-Saadi, A.M. Plant hypersensitive response vs pathogen ingression: Death of few gives life to others. Microb. Pathog. 2020, 145, 104224. [Google Scholar] [CrossRef]
  65. Badawi, G.H.; Yamauchi, Y.; Shimada, E.; Sasaki, R.; Kawano, N.; Tanaka, K.; Tanaka, K. Enhanced tolerance to salt stress and water deficit by overexpressing superoxide dismutase in tobacco (Nicotiana tabacum) chloroplasts. Plant Sci. 2004, 166, 919–928. [Google Scholar] [CrossRef]
  66. Xu, J.; Duan, X.; Yang, J.; Beeching, J.R.; Zhang, P. Enhanced Reactive Oxygen Species Scavenging by Overproduction of Superoxide Dismutase and Catalase Delays Postharvest Physiological Deterioration of Cassava Storage Roots. Plant Physiol. 2013, 161, 1517–1528. [Google Scholar] [CrossRef] [Green Version]
  67. Helepciuc, F.E.; Mitoi, M.E.; Manole-Paunescu, A.; Aldea, F.; Brezeanu, A.; Cornea, C.P. Induction of plant antioxidant system by interaction with beneficial and/or pathogenic microorganisms. Rom. Biotech. Lett. 2014, 19, 9366–9375. [Google Scholar]
  68. Torres, M.A.; Jones, J.; Dangl, J.L. Reactive Oxygen Species Signaling in Response to Pathogens. Plant Physiol. 2006, 141, 373–378. [Google Scholar] [CrossRef] [Green Version]
  69. Morkunas, I.; Gmerek, J. The possible involvement of peroxidase in defense of yellow lupine embryo axes against Fusarium oxysporum. J. Plant Physiol. 2007, 164, 185–194. [Google Scholar] [CrossRef]
  70. Mandal, S.; Mitra, A.; Mallick, N. Biochemical characterization of oxidative burst during interaction between Solanum lycopersicum and Fusarium oxysporum f. sp. lycopersici. Physiol. Mol. Plant Pathol. 2008, 72, 56–61. [Google Scholar] [CrossRef]
  71. Plazek, A.; Zur, I. Cold-induced plant resistance to necrotrophic pathogens and antioxidant enzyme activities and cell membrane permeability. Plant Sci. 2003, 164, 1019–1028. [Google Scholar] [CrossRef]
  72. Bushnell, W.R.; Hazen, E.; Pritsch, C. Histology and physiology of Fusarium head blight. In Fusarium Head Blight of Wheat and Barley; Leonard, K.J., Bushnell, W.R., Eds.; American Phytopathological Society: St. Paul, MN, USA, 2003; pp. 44–83. [Google Scholar]
  73. Gale, L.R.; Harrison, S.A.; Ward, T.J.; O’Donnell, K.; Milus, E.A.; Gale, S.W.; Kistler, H. Nivalenol-Type Populations of Fusarium graminearum and F. asiaticum Are Prevalent on Wheat in Southern Louisiana. Phytopatholigy 2011, 101, 124–134. [Google Scholar] [CrossRef] [PubMed] [Green Version]
  74. Haidukowski, M.; Pascale, M.; Perrone, G.; Pancaldi, D.; Campagna, C.; Visconti, A. Effect of fungicides on the development of Fusarium head blight, yield and deoxynivalenol accumulation in wheat inoculated under field conditions with Fusarium graminearum and Fusarium culmorum. J. Sci. Food Agric. 2004, 85, 191–198. [Google Scholar] [CrossRef]
  75. Nowicki, T. Vomitoxin And Fusarium Damaged Kernels–Is There A Relationship in Canadian Wheat? In Proceedings of the 2nd Canadian Workshop on Fusarium Head Blight, Ottawa, ON, Canada, 3–5 November 2001. [Google Scholar]
  76. Pascale, M.; Visconti, A.; Chelkowski, J. Ear Rot Susceptibility and Mycotoxin Contamination of Maize Hybrids Inoculated with Fusarium Species Under Field Conditions. Eur. J. Plant Pathol. 2002, 108, 645–651. [Google Scholar] [CrossRef]
  77. Goswami, R.S.; Kistler, H. Pathogenicity and In Planta Mycotoxin Accumulation Among Members of the Fusarium graminearum Species Complex on Wheat and Rice. Phytopathology 2005, 95, 1397–1404. [Google Scholar] [CrossRef] [Green Version]
  78. Liu, Y.-Y.; Sun, H.-Y.; Li, W.; Xia, Y.-L.; Deng, Y.-Y.; Zhang, A.-X.; Chen, H.-G. Fitness of three chemotypes of Fusarium graminearum species complex in major winter wheat-producing areas of China. PLoS ONE 2017, 12, e0174040. [Google Scholar] [CrossRef] [Green Version]
  79. Desjardins, A.E.; Plattner, R.D. Diverse traits for pathogen fitness inGibberella zeae. Can. J. Plant Pathol. 2003, 25, 21–27. [Google Scholar] [CrossRef]
  80. Llorens, A.; Mateo, R.; Hinojo, M.; Valle-Algarra, F.; Jiménez, M. Influence of environmental factors on the biosynthesis of type B trichothecenes by isolates of Fusarium spp. from Spanish crops. Int. J. Food Microbiol. 2004, 94, 43–54. [Google Scholar] [CrossRef]
  81. Wiśniewska, H.; Góral, T.; Ochodzki, P.; Walentyn-Góral, D.; Kwiatek, M.; Majka, M.; Kurleto, D. Resistance of winter triticale breeding lines to Fusarium head blight. Bull. Plant Breed. Acclim. Inst. 2014, 271, 29–43. [Google Scholar]
  82. Murashige, T.; Skoog, F. A Revised Medium for Rapid Growth and Bio Assays with Tobacco Tissue Cultures. Physiol. Plant. 1962, 15, 473–497. [Google Scholar] [CrossRef]
  83. Hoagland, D.R.; Arnon, D.I. The water-culture method for growing plants without soil. Univ. Calif. Agric. Exp. Stn. Circ. 1938, 347, 29–32. [Google Scholar]
  84. Warzecha, T.; Skrzypek, E.; Adamski, T.; Surma, M.; Kaczmarek, Z.; Sutkowska, A. Chlorophyll a Fluorescence Parameters of Hulled and Hull-less Barley (Hordeum vulgare L.) DH Lines Inoculated with Fusarium culmorum. Plant Pathol. J. 2019, 35, 112–124. [Google Scholar] [CrossRef] [PubMed]
  85. Czyczyło-Mysza, I.; Tyrka, M.; Marcińska, I.; Skrzypek, E.; Karbarz, M.; Dziurka, M.; Hura, T.; Quarrie, S. Quantitative trait loci for leaf chlorophyll fluorescence parameters, chlorophyll and carotenoid contents in relation to biomass and yield in bread wheat and their chromosome deletion bin assignments. Mol. Breed. 2013, 32, 189–210. [Google Scholar] [CrossRef] [Green Version]
  86. Lichtenthaler, H.K.; Buschmann, C. Chlorophylls and Carotenoids: Measurement and Characterization by UV-VIS Spectroscopy. Curr. Protoc. Food Anal. Chem. 2001, 1, F4-3. [Google Scholar] [CrossRef]
  87. Dubois, M.Y.; A Gilles, K.; Hamilton, J.K.; Rebers, P.A.; Smith, F.G. A Colorimetric Method for the Determination of Sugars. Nat. Cell Biol. 1951, 168, 167. [Google Scholar] [CrossRef]
  88. Bach, A.; Kapczyńska, A.; Dziurka, M. Phenolic compounds and carbohydrates in relation to bulb formation in Lachenalia ‘Ronina’ and ‘Rupert’ in vitro cultures under different lighting environments. Sci. Hortic. 2015, 188, 23–29. [Google Scholar] [CrossRef]
  89. Hura, T.; Dziurka, M.; Hura, K.; Ostrowska, A.; Dziurka, K. Different allocation of carbohydrates and phenolics in dehydrated leaves of triticale. J. Plant Physiol. 2016, 202, 1–9. [Google Scholar] [CrossRef]
  90. Mccord, J.M.; Fridovich, I. Superoxide dismutase. An enzymic function for erythrocuprein (hemocuprein). J. Biol. Chem. 1969, 244, 6049–6055. [Google Scholar] [CrossRef]
  91. Aebi, H. Catalase in vitro. Methods Enzymol. 1984, 105, 121–126. [Google Scholar] [CrossRef] [PubMed]
  92. Luck, H. Methoden der enzymatischenanalyse. In Verlag Chemie, 1st ed.; Bergmeyer, H.U.: Weinheim, Germany, 1962. [Google Scholar]
  93. Gudyś, K.; Guzy-Wrobelska, J.; Janiak, A.; Dziurka, M.A.; Ostrowska, A.; Hura, K.; Jurczyk, B.; Żmuda, K.; Grzybkowska, D.; Śróbka, J.; et al. Prioritization of Candidate Genes in QTL Regions for Physiological and Biochemical Traits Underlying Drought Response in Barley (Hordeum vulgare L.). Front. Plant Sci. 2018, 9, 1–26. [Google Scholar] [CrossRef] [Green Version]
  94. Szechynska-Hebda, M.; Skrzypek, E.; Dąbrowska, G.; Wędzony, M.; Van Lammeren, A. The effect of endogenous hydrogen peroxide induced by cold treatment in the improvement of tissue regeneration efficiency. Acta Physiol. Plant. 2011, 34, 547–560. [Google Scholar] [CrossRef]
  95. Wojtania, A.; Skrzypek, E.; Gabryszewska, E. Morphological and Biochemical Responses to Gibberellic Acid in Magnolia × ‘Spectrum’ in Vitro. Acta Biol. Cracoviensias. Bot. 2016, 58, 103–111. [Google Scholar] [CrossRef]
  96. Bradford, M.M. A rapid and sensitive method for the quantitation of microgram quantities of protein utilizing the principle of protein-dye binding. Anal. Biochem. 1976, 72, 248–254. [Google Scholar] [CrossRef]
  97. Mohanty, J.; Jaffe, J.S.; Schulman, E.S.; Raible, D.G. A highly sensitive fluorescent micro-assay of H2O2 release from activated human leukocytes using a dihydroxyphenoxazine derivative. J. Immunol. Methods 1997, 202, 133–141. [Google Scholar] [CrossRef]
  98. ThermoFisher Protocol of Amplex® Red Hydrogen Peroxide/Peroxidase Assay Kit. Available online: https://www.thermofisher.com/document-connect/document-connect.html?url=https://assets.thermofisher.com/TFS-Assets/LSG/manuals/mp22188.pdf (accessed on 30 June 2021).
  99. Warzecha, T.; Adamski, T.; Kaczmarek, Z.; Surma, M.; Goliński, P.; Perkowski, J.; Chełkowski, J.; Wiśniewska, H.; Krystkowiak, K.; Kuczynska, A. Susceptibility of hulled and hulless barley doubled haploids to Fusarium culmorum head blight. Cereal Res. Commun. 2010, 38, 220–232. [Google Scholar] [CrossRef]
  100. Dziurka, M.; Maksymowicz, A.; Ostrowska, A.; Biesaga-Kościelniak, J. The Interaction Effect of Drought and Exogenous Application of Zearalenone on the Physiological, Biochemical Parameters and Yield of Legumes. J. Plant Growth Regul. 2020, 2020, 1–12. [Google Scholar] [CrossRef]
  101. Klötzel, M.; Lauber, U.; Humpf, H.-U. A new solid phase extraction clean-up method for the determination of 12 type A and B trichothecenes in cereals and cereal-based food by LC-MS/MS. Mol. Nutr. Food Res. 2006, 50, 261–269. [Google Scholar] [CrossRef] [PubMed]
Figure 1. Secondary metabolites (mycotoxins) produced by Fusarium culmorum: (A) deoxynivalenol (DON), (B) nivalenol (NIV), (C) T-2 toxin, (D) zearalenone (ZEN).Source: Sigma-Aldrich.
Ijms 22 07433 g001
Figure 2. Disease rating (DR) in the leaves and roots of three durum wheat genotypes infected with F. culmorum. The values represent means (n = 30) ± SE (standard error). Different superscript letters (a–c) for each organ indicate significant differences between means (Duncan’s multiple range test; p < 0.05).
Ijms 22 07433 g002
Figure 3. Effects of F. culmorum infection on fresh weight (FW) of the leaves and roots of three durum wheat accessions. The values represent means (n = 30) ± SE. Different superscript letters (a–d) for each organ indicate significant differences between means (Duncan’s multiple range test; p < 0.05).
Ijms 22 07433 g003
Figure 4. Effect of F. culmorum infection on the content of (A) chlorophyll a, b (Chla, b) and carotenoids (Car), (B) total water-soluble carbohydrates (TSC), (C) total soluble phenolics (TSP), (D) cell wall-bound phenolics (CWP) in the leaves and roots of three durum wheat accessions. The values represent means (n = 30) ± SE. Different superscript letters (a–h) for each organ indicate significant differences between means (Duncan’s multiple range test; p < 0.05).
Ijms 22 07433 g004
Figure 5. Effects of F. culmorum infection on catalase (A), peroxidases (B), and superoxide dismutase (C) activity, and H2O2 (D) content in the leaves and roots of three durum wheat accessions. The values represent means (n = 3) ± SE. Different superscript letters (a–g) for each organ indicate significant differences between means (Duncan’s multiple range test; p < 0.05).
Ijms 22 07433 g005
Figure 6. Two-week old durum wheat seedlings growing in pathogen-free medium (A) and the medium infected with F. culmorum medium (B).
Ijms 22 07433 g006
Table 1. Pearson coefficients of linear correlation (p < 0.05) between the disease rating (DR) and chlorophyll a, b (Chla, b), and carotenoid (Car) content and fresh weight (FW) of the leaves and roots.
VariableChl aChl bCarFW of LeavesFW of Roots
DR in leaves−0.859−0.804−0.870−0.715−0.755
DR in roots−0.891−0.811−0.898−0.672−0.821
Table 2. Pearson coefficients of linear correlation (p < 0.05) between H2O2 content in the leaves and roots and the activity of catalase (CAT), peroxidases (POX), superoxide dismutase (SOD), as well as total soluble phenolic (TSP) and cell wall-bound phenolic (CWP) content in the leaves and roots of three accessions of durum wheat.
VariableH2O2 Content
LeavesRoots
CAT in leaves0.710ns
CAT in rootsnsns
POX in leaves0.688ns
POX in rootsnsns
SOD in leavesnsns
SOD in rootsns0.613
TPC in leaves−0.863ns
TPC in roots−0.763−0.658
CWP in leaves0.679ns
CWP in roots0.861ns
ns—values not significant.
Table 3. Fusarium head blight index (FHBi) evaluated 7 and 14 days (DAI 7 and DAI 14) after spike inoculation with F. culmorum and yield components of three durum wheat genotypes.
AccessionTreatmentFHBi [%]Amount of Grain Per SpikeGrain Mass Per Spike (g)Mass of One piece of Grain (g)MTS (g)
DAI 7DAI 14
SMH87Control--12.3 ± 1.4 b0.328 ± 0.048 b0.050 ± 0.003 b36.437 ± 0.319 b
Inoculum10.1 ± 1.8 a34.7 ± 4.1 a2.0 ± 0.4 d0.055 ± 0.016 d0.012 ± 0.003 d15.603 ± 0.348 d
TamaroiControl--16.8 ± 1.2 a0.459 ± 0.047 a0.049 ± 0.005 b37.674 ± 1.077 b
Inoculum4.8 ± 0.9 b8.3 ± 1.1 b5.9 ± 1.0 d0.099 ± 0.019 d0.016 ± 0.004 d16.200 ± 1.853 d
BC5Nax2Control--13.6 ± 1.2 b0.355 ± 0.042 b0.061 ± 0.004 a51.763 ± 0.602 a
Inoculum3.0 ± 0.7 b10.7 ± 1.9 b10.9 ± 1.1 c0.209 ± 0.023 c0.028 ± 0.004 c28.209 ± 1.905 c
Values represent means ± SE. Fusarium head blight index (FHBi), amount of grain, grain mass per spike, and mass of one piece of grain were calculated in 45 replicates, while mass of one thousand seeds (MTS) were calculated in 3 replicates. Different superscript letters (a–d) FHBi and yield parameters indicate significant differences between means within columns (Duncan’s multiple range test; p < 0.05).
Table 4. Content [µg kg−1] of nivalenol (NIV), deoxynivalenol (DON1), T-2 toxin (T–2), and zearalenone (ZEN2) in the grain after F. culmorum spike inoculation.
AccessionTreatment NIVDON 1ZEN 2T-2
SMH87Control0.098 ± 0.008 d0.093 ± 0.002 c0.008 ± 0.001 e0.101 ± 0.003 e
Inoculum1.785 ± 0.073 b5.763 ± 0.137 b0.002 ± 0.001 e0.166 ± 0.013 c
TamaroiControl0.414 ± 0.021 c0.037 ± 0.003 c0.004 ± 0.001 d0.136 ± 0.006 d
Inoculum2.474 ± 0.109 a8.052 ± 0.373 a0.031 ± 0.001 b0.317 ± 0.010 a
BC₅Nax₂Control0.406 ± 0.026 c0.047 ± 0.002 c0.022 ± 0.002 c0.126 ± 0.004 d
Inoculum1.765 ± 0.018 b6.208 ± 0.318 b0.138 ± 0.002 a0.221 ± 0.005 b
Values represent means (n = 3) ± SE. Different superscript letters (a–e) within columns indicate significant differences between means (Duncan’s multiple range test; p < 0.05). DON 1 total amount of deoxynivalenol (DON), and 3–acetyldeoxynivalenol (3AcDON) and 15–acetyldeoxynivalenol (15AcDON); ZEN 2 total amount of zearalenone (ZEN); alpha–Zearalanol (α–ZAL), beta–Zearalanol (β–ZAL); alpha–Zearalanol (α–ZEL) and beta–Zearalenol (β–ZEL).
Table 5. Pearson’s coefficients of linear correlation (p < 0.05) between Fusarium head blight index (FHBi) evaluated 7 and 14 days after inoculation (DAI 7 and DAI 14), mycotoxin content in grain and yield parameters.
VariableFHBi DAI 7FHBi DAI 14NIVDON 1ZEN 2T–2
Number of grain per spike−0.591−0.575−0.503−0.549nsns
Mass of grain per spike [g]−0.589−0.576−0.566−0.612nsns
Mass of a single grain [g]−0.754−0.743−0.863−0.864−0.714ns
MTS [g]−0.741−0.848−0.551−0.589nsns
DON 1 total amount of deoxynivalenol (DON), 3–acetyldeoxynivalenol (3AcDON) and 15–acetyldeoxynivalenol (15AcDON); ZEN 2 total amount of zearalenone (ZEN); alpha–Zearalanol (α–ZAL), beta–Zearalanol (β–ZAL); alpha–Zearalanol (α–ZEL) and beta–Zearalenol (β–ZEL); MTS-mass of thousand seeds; ns—values not significant.
Table 6. Pearson’s coefficients of linear correlation (p < 0.05) between Fusarium head blight index (FHBi) evaluated 7 and 14 days after the inoculation (DAI 7 and DAI 14) and mycotoxin content in the grain.
VariableNIV DON 1ZEN 2T-2 Toxin
FHBi DAI 70.7310.7330.484ns
FHBi DAI 140.6300.632nsns
DON 1 total amount of deoxynivalenol (DON), 3–acetyldeoxynivalenol (3AcDON) and 15–acetyldeoxynivalenol (15AcDON); ZEN 2 total amount of zearalenone (ZEN); alpha–Zearalanol (α–ZAL), beta–Zearalanol (β–ZAL); alpha–Zearalanol (α–ZEL) and beta–Zearalenol (β–ZEL); MTS-mass of thousand seeds; ns—values not significant.
Publisher’s Note: MDPI stays neutral with regard to jurisdictional claims in published maps and institutional affiliations.

