
Influence of Small Quantities of Water on the Physical Properties of Alkylammonium Nitrate Ionic Liquids

 , , and
Abstract
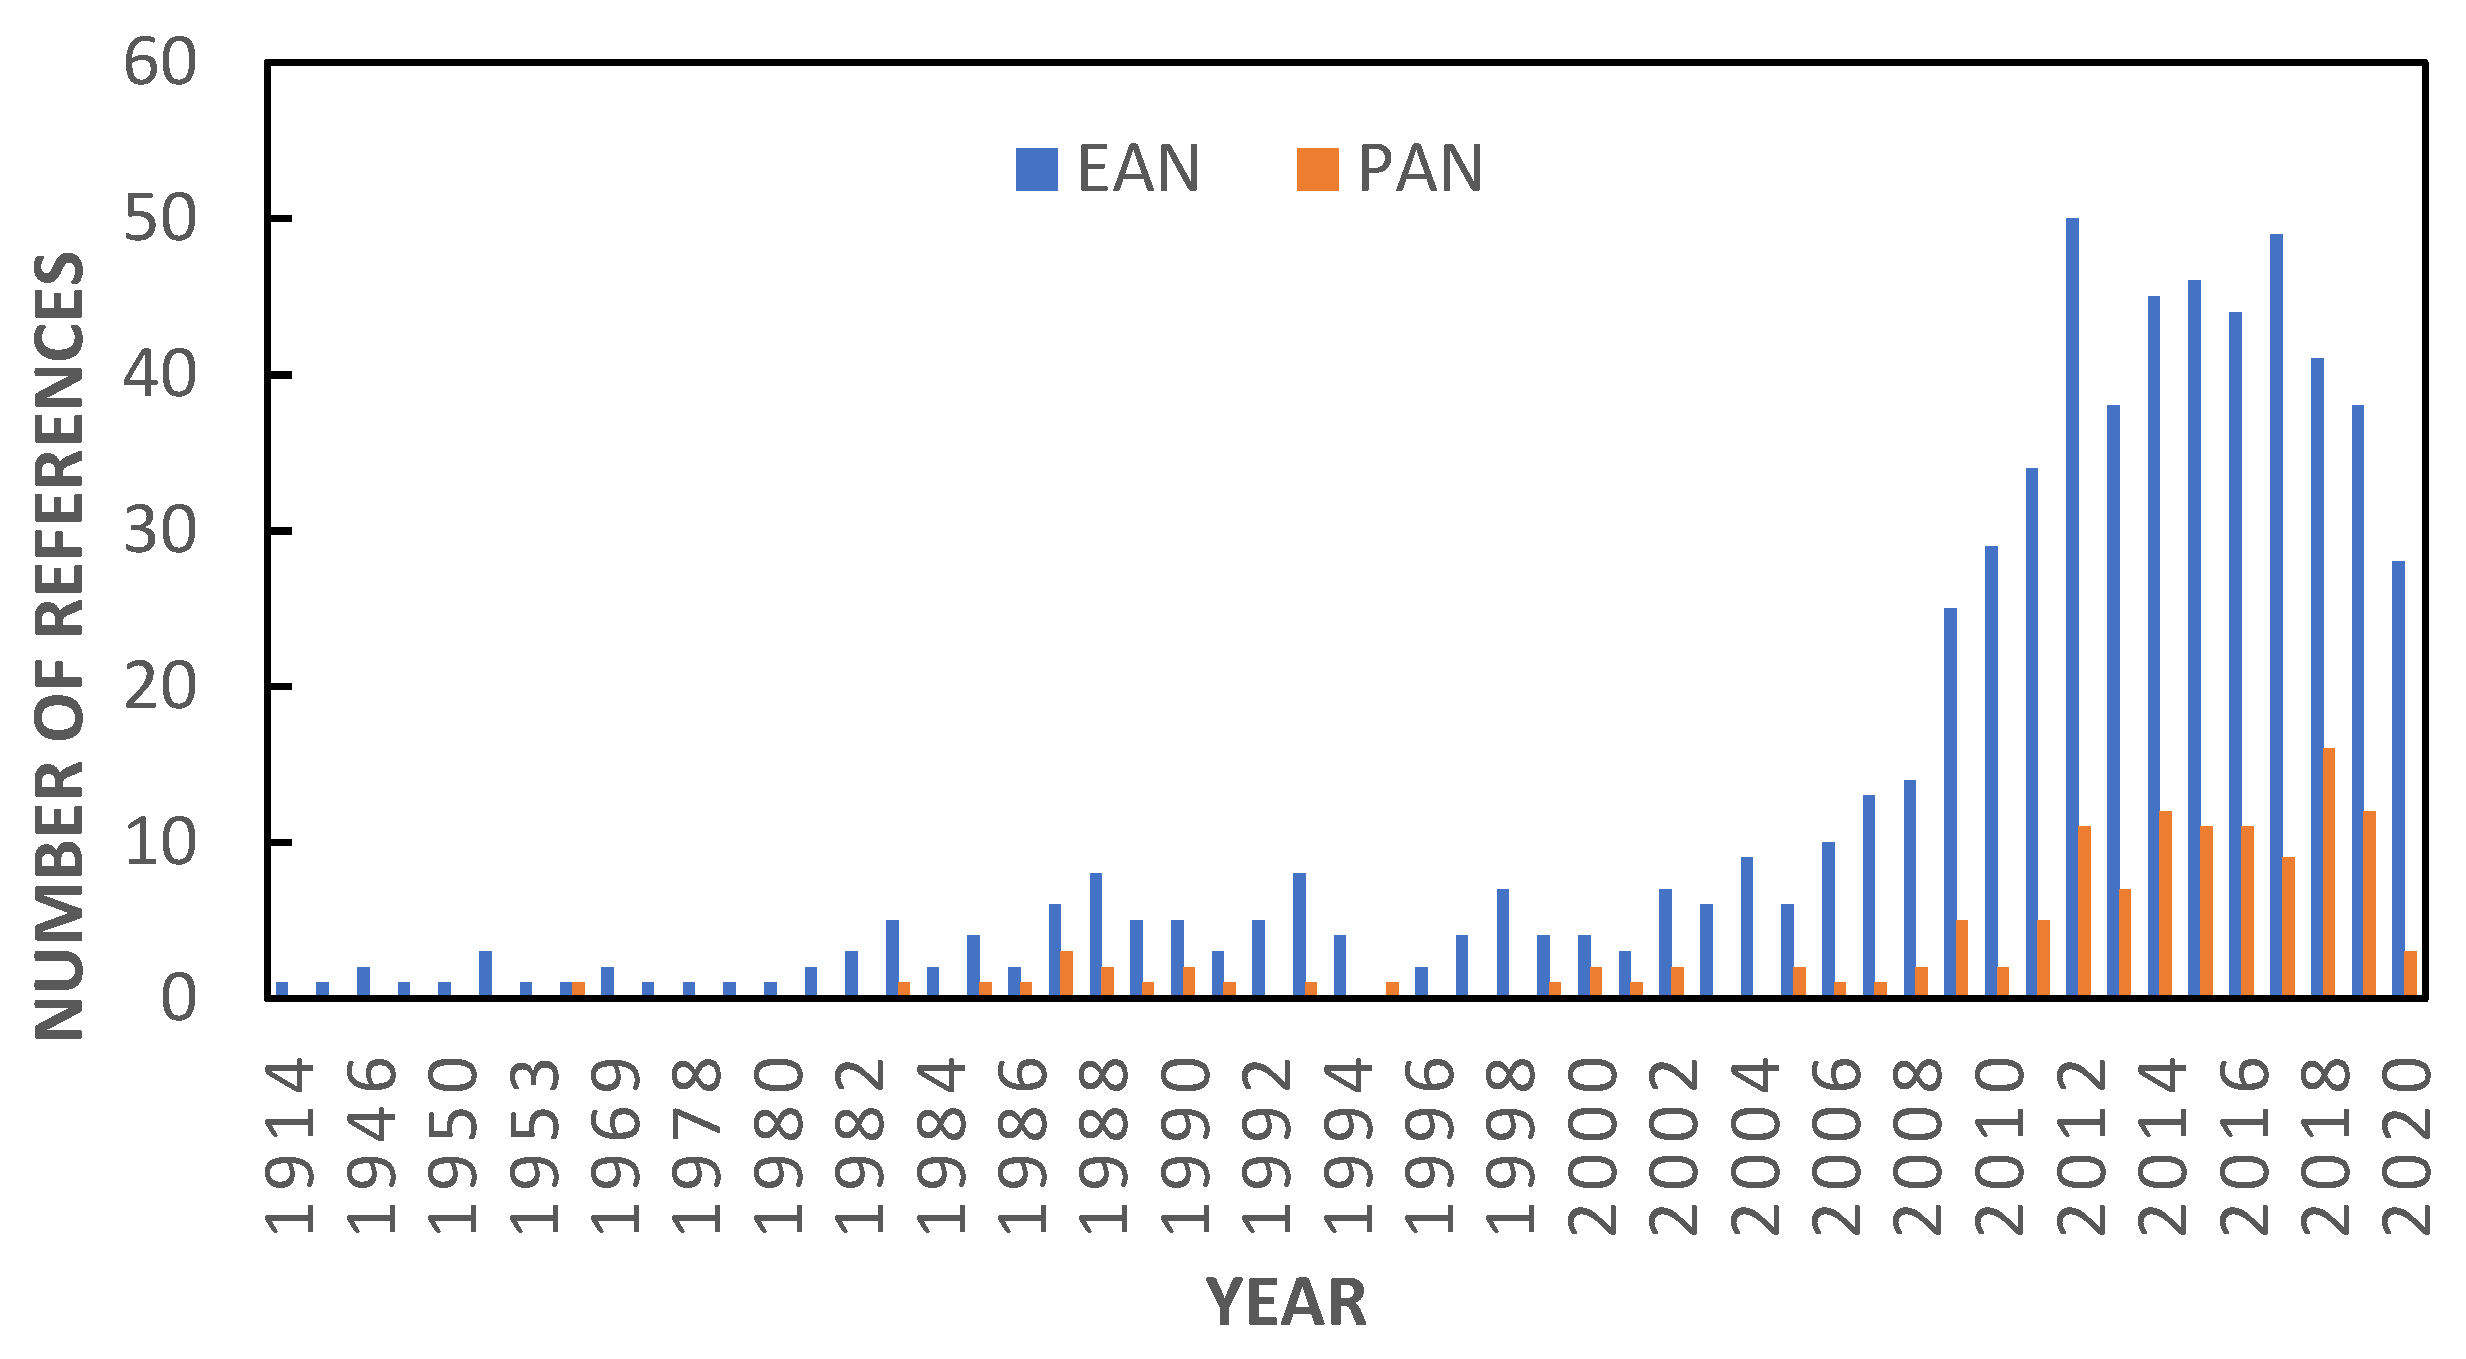
1. Introduction
2. Results
3. Discussion
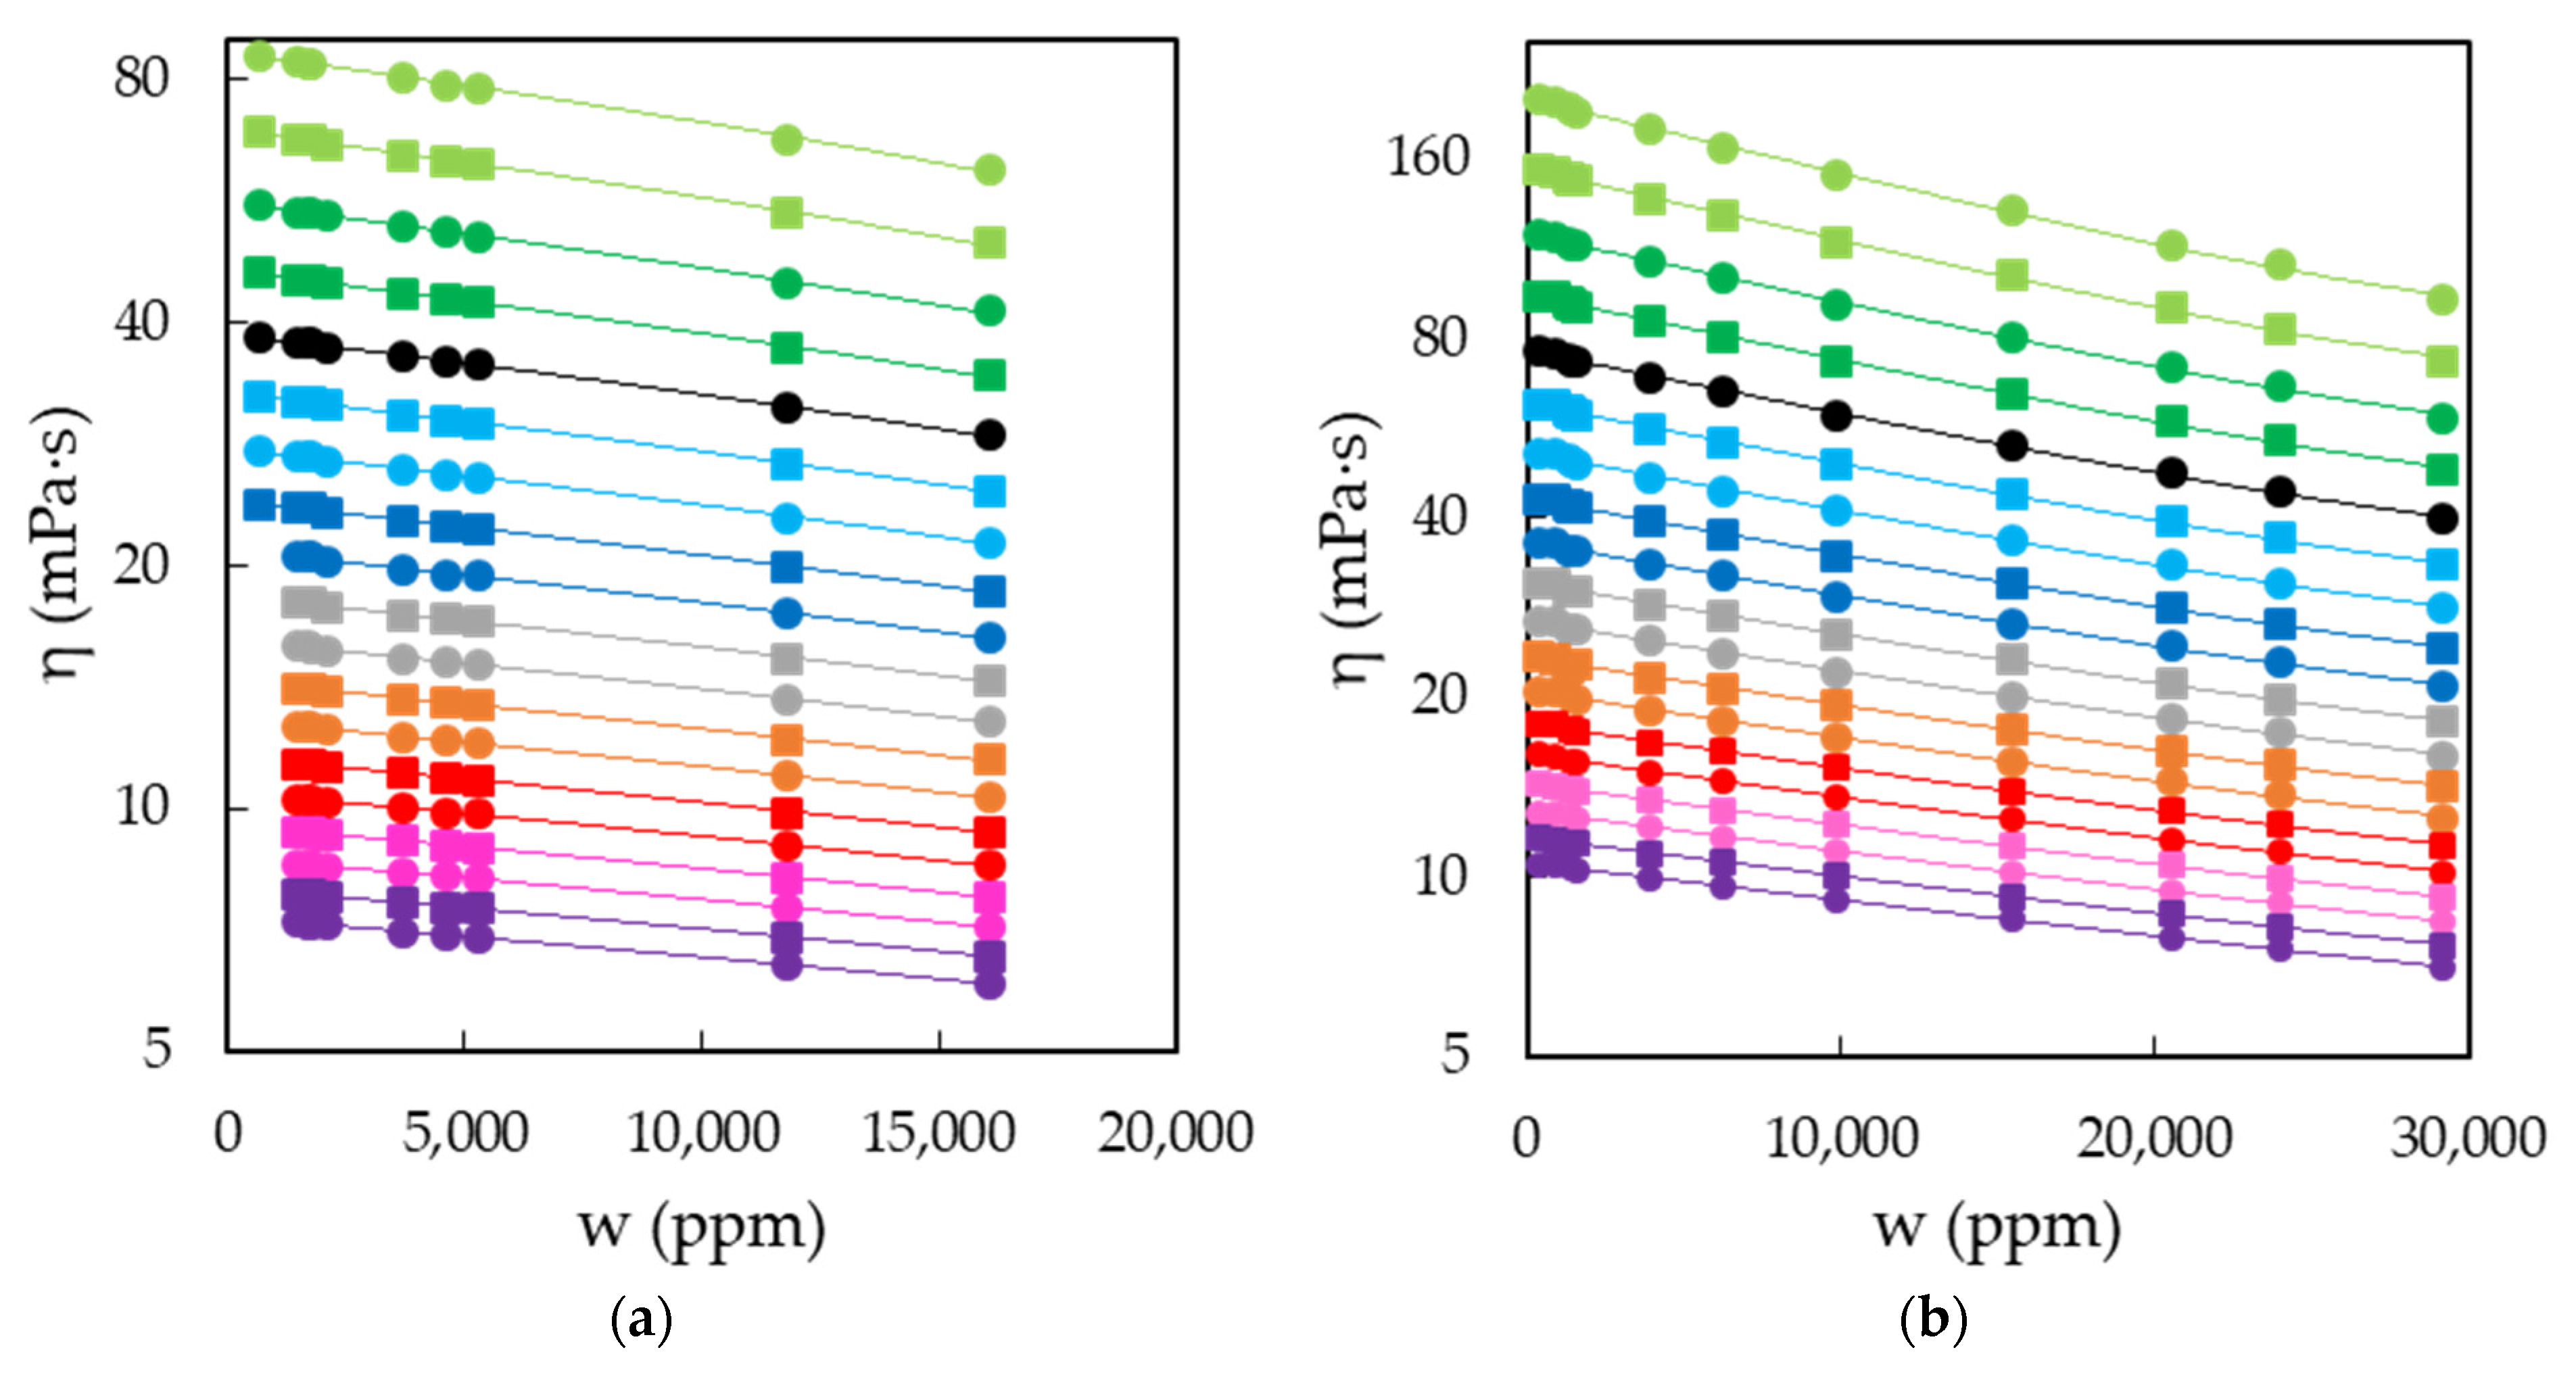
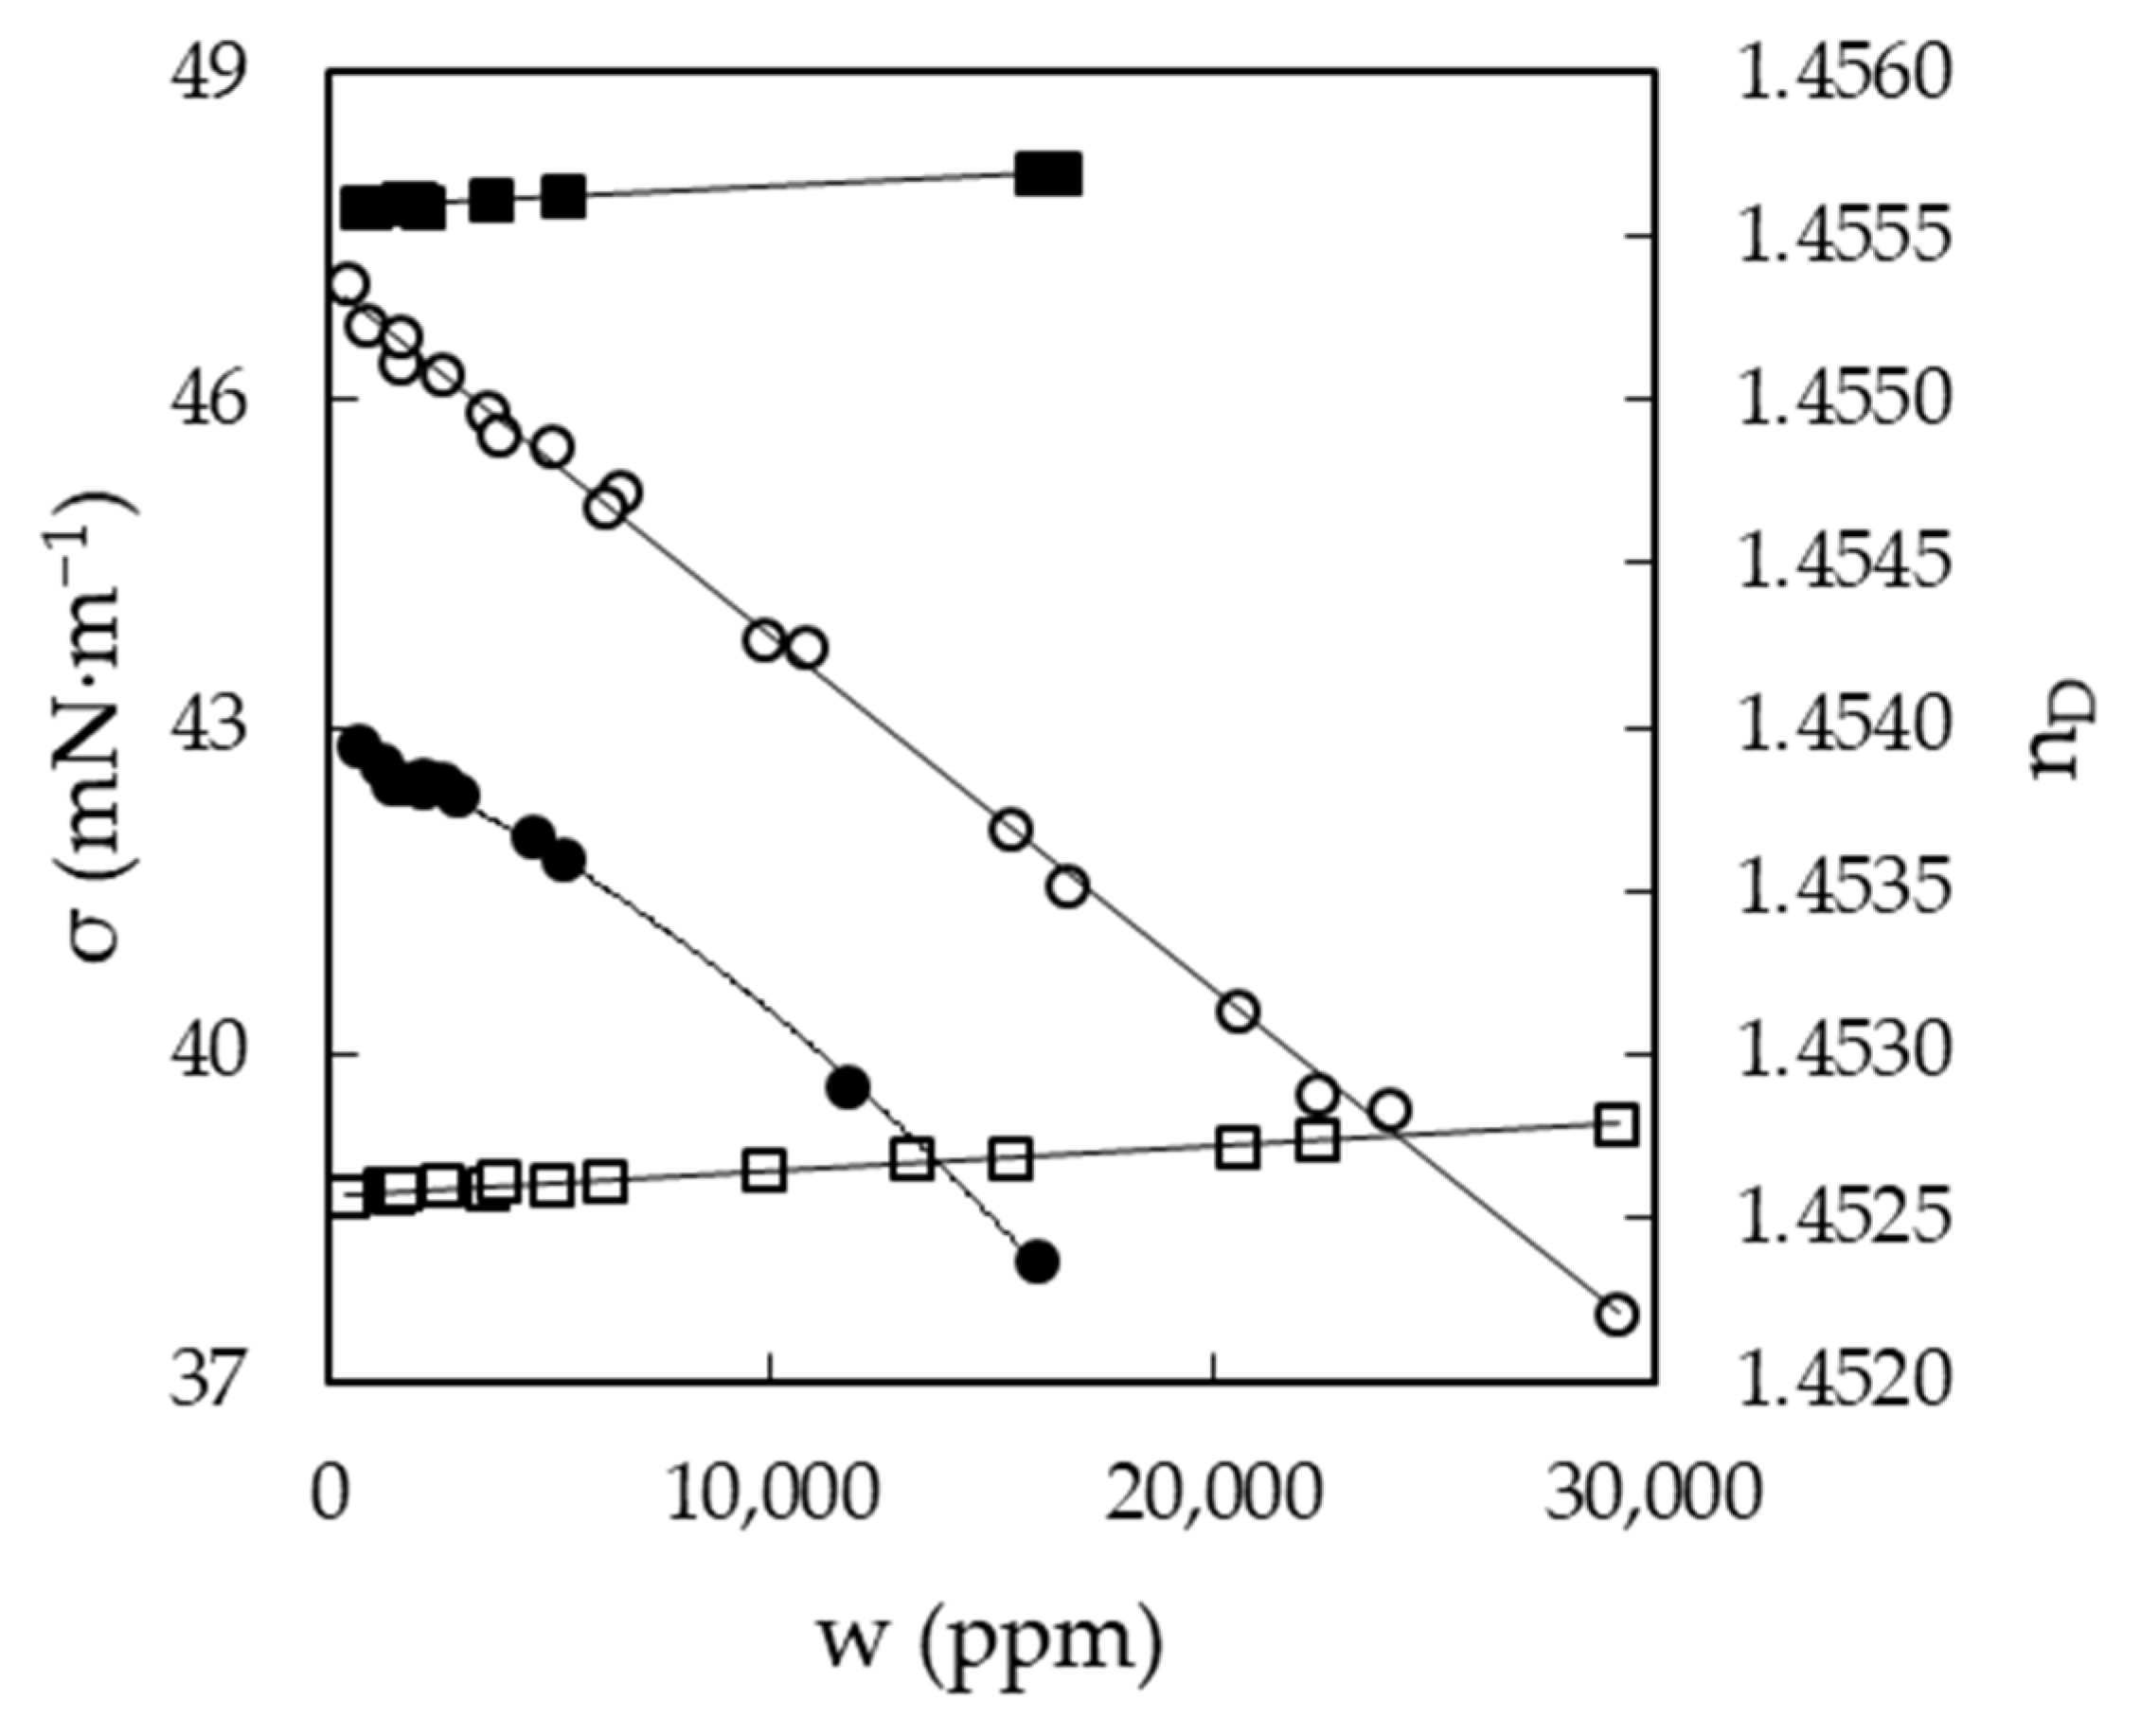
3.1. Experimental Measurements as a Function of Water Content
3.2. Experimental Measurements as a Function of Temperature
3.3. Experimental Measurements as a Function of Water Content and Temperature
3.4. Comparison with Published Data
- Previously published data show a wide dispersion in all the properties studied;
- A significant number of papers do not present accurate information on the water content of pure ILs. In general, these data are the ones that differ the most from those presented here (open symbols in Figures S1–S10);
- Overall, those papers that do report on water content are in good agreement with those presented here;
- The data presented here provide systematic measurements and homogeneity, as well as covering previously unpublished temperature or water content ranges.
4. Materials and Methods
4.1. Materials
4.2. Preparation of Materials
4.3. Density and Viscosity
4.4. Refractive Index
4.5. Surface Tension
4.6. Electrical Conductivity
5. Conclusions
Supplementary Materials
Author Contributions
Funding
Institutional Review Board Statement
Informed Consent Statement
Data Availability Statement
Acknowledgments
Conflicts of Interest
References
- Welton, T. Ionic liquids: A brief history. Biophys. Rev. 2018, 10, 691–706. [Google Scholar] [CrossRef] [PubMed]
- Trujillo–Rodríguez, M.J.; Nan, H.; Varona, M.; Emaus, M.N.; Souza, I.D.; Anderson, J.L. Advances of Ionic Liquids in Analytical Chemistry. Anal. Chem. 2019, 91, 505–531. [Google Scholar] [CrossRef] [PubMed]
- Keaveney, S.T.; Haines, R.S.; Harper, J.B. Ionic liquid solvents: The importance of microscopic interactions in predicting organic reaction outcomes. Pure Appl. Chem. 2017, 89, 745–757. [Google Scholar] [CrossRef][Green Version]
- Xia, S.-M.; Chen, K.-H.; Fu, H.-C.; He, L.-N. Ionic liquids catalysis for carbon dioxide conversion with nucleophiles. Front. Chem. 2018, 6, 462. [Google Scholar] [CrossRef] [PubMed]
- Martins, V.L.; Torresi, R.M. Ionic liquids in electrochemical energy storage. Curr. Opin. Electrochem. 2018, 9, 26–32. [Google Scholar] [CrossRef]
- Upasham, S.; Banga, I.K.; Jagannath, B.; Paul, A.; Lin, K.-C.; Muthukumar, S.; Prasad, S. Electrochemical impedimetric biosensors, featuring the use of Room Temperature Ionic Liquids (RTILs): Special focus on non-faradaic sensing. Biosens. Bioelectron. 2021, 177, 112940. [Google Scholar] [CrossRef] [PubMed]
- Florio, W.; Becherini, S.; D’Andrea, F.; Lupetti, A.; Chiappe, C.; Guazzelli, L. Comparative evaluation of antimicrobial activity of different types of ionic liquids. Mater. Sci. Eng. C 2019, 104, 109907. [Google Scholar] [CrossRef]
- Tampucci, S.; Guazzelli, L.; Burgalassi, S.; Carpi, S.; Chetoni, P.; Mezzetta, A.; Nieri, P.; Polini, B.; Pomelli, C.S.; Terreni, E.; et al. pH–responsive nanostructures based on surface active fatty acid–protic ionic liquids for imiquimod delivery in skin cancer topical therapy. Pharmaceutics 2020, 12, 1078. [Google Scholar] [CrossRef]
- Moodley, K.; Mabaso, M.; Bahadur, I.; Redhi, G.G. Industrial application of ionic liquids for the recoveries of spent paint solvent. J. Mol. Liq. 2016, 219, 206–210. [Google Scholar] [CrossRef]
- Khan, A.S.; Ibrahim, T.H.; Jabbar, N.A.; Khamis, M.I.; Nancarrow, P.; Mjalli, F.S. Ionic liquids and deep eutectic solvents for the recovery of phenolic compounds: Effect of ionic liquids structure and process parameters. RSC Adv. 2021, 11, 12398. [Google Scholar] [CrossRef]
- Lei, Z.; Chen, B.; Koo, Y.-M.; MacFarlane, D.R. Introduction: Ionic Liquids. Chem. Rev. 2017, 117, 6633–6635. [Google Scholar] [CrossRef]
- Vila, J.; Gines, P.; Pico, J.M.; Franjo, C.; Jimenez, E.; Varela, L.M.; Cabeza, O. Temperature dependence of the electrical conductivity in EMIM—Based ionic liquids: Evidence of Vogel–Tamman–Fulcher behaviour. Fluid Phase Equilib. 2006, 242, 141–146. [Google Scholar] [CrossRef]
- Rilo, E.; Dominguez-Perez, M.; Vila, J.; Segade, L.; Garcia, M.; Varela, L.M.; Cabeza, O. Easy prediction of the refractive index for binary mixtures of ionic liquids with water or ethanol. J. Chem. Thermodyn. 2012, 47, 219–222. [Google Scholar] [CrossRef]
- Cabeza, O.; Varela, L.M.; Rilo, E.; Segade, L.; Dominguez-Perez, M.; Ausin, D.; de Pedro, I.; Rodriguez Fernandez, J.; Gonzalez, J.; Vazquez-Tato, M.P.; et al. Synthesis, microstructure and volumetry of novel metal thiocyanate ionic liquids with [BMIM] cation. J. Mol. Liq. 2019, 283, 638–651. [Google Scholar] [CrossRef]
- Segade, L.; Cabanas, M.; Domínguez-Pérez, M.; Rilo, E.; García-Garabal, S.; Turmine, M.; Varela, L.M.; Gómez-González, V.; Docampo-Álvarez, B.; Cabeza, O. Surface and bulk characterisation of mixtures containing alkylammonium nitrates and water or ethanol: Experimental and simulated properties at 298.15 K. J. Mol. Liq. 2016, 222, 663–670. [Google Scholar] [CrossRef]
- Salgado, J.; Parajó, J.J.; Villanueva, M.; Rodríguez, J.R.; Cabeza, O.; Varela, L.M. Liquid range of ionic liquid—Metal salt mixtures for electrochemical applications. J. Chem. Thermodyn. 2019, 134, 164–174. [Google Scholar] [CrossRef]
- Greaves, T.L.; Drummond, C.J. Protic Ionic Liquids: Properties and Applications. Chem. Rev. 2008, 108, 206–237. [Google Scholar] [CrossRef]
- Greaves, T.L.; Drummond, C.J. Protic Ionic Liquids: Evolving Structure-Property Relationships and Expanding Applications. Chem. Rev. 2015, 115, 11379–11448. [Google Scholar] [CrossRef]
- Bhattacharya, K.; Sarkar, M.; Salez, T.J.; Nakamae, S.; Demouchy, G.; Cousin, F.; Dubois, E.; Michot, L.; Perzynski, R.; Peyre, V. Structural, Thermodiffusive and Thermoelectric Properties of Maghemite Nanoparticles Dispersed in Ethylammonium Nitrate. Chem. Eng. 2020, 4, 5. [Google Scholar] [CrossRef]
- Pajak, M.; Hubkowska, K.; Czerwinski, A. Nitrate protic ionic liquids as electrolytes: Towards hydrogen sorption in Pd. Electrochim. Acta 2019, 324, 134851. [Google Scholar] [CrossRef]
- Laux, E.; Jeandupeux, L.; Uhl, S.; Keppner, H.; Perez Lopez, P.; Sanglard, P.; Vanoli, E.; Marti, R. Novel Ionic Liquids for Thermoelectric Generator Devices. Mater. Today Proc. 2019, 8, 672–679. [Google Scholar] [CrossRef]
- Yoshida, K.; Zenin, T.; Fujiyoshi, A.; Sanada, Y.; Yamaguchi, T.; Murata, K.; Takata, S.-I.; Hiroi, K.; Takekiyo, T.; Yoshimura, Y. The effect of alkyl ammonium ionic liquids on thermal denaturation aggregation of β-lactoglobulin. J. Mol. Liq. 2019, 293, 111477. [Google Scholar] [CrossRef]
- Allen, M.; Evans, D.F.; Lumry, R. Thermodynamic properties of the ethylammonium nitrate + water system: Partial molar volumes, heat capacities, and expansivities. J. Sol. Chem. 1985, 14, 549–560. [Google Scholar] [CrossRef]
- Anaredy, R.S.; Lucio, A.J.; Shaw, S.K. Adventitious Water Sorption in a Hydrophilic and a Hydrophobic Ionic Liquid: Analysis and Implications. ACS Omega 2016, 1, 407–416. [Google Scholar] [CrossRef]
- Angell, C.A.; Xu, W.; Belieres, J.; Yoshizawa, M. Ionic Liquids and Ionic Liquid Acids with High Temperature Stability for Fuel Cell and Other High Temperature Applications, Method of Making and Cell Employing Same. US Patent US 7,867,658 B2; filed 3 May 2004 and issued 11 January 2011,
- Anouti, M.; Caillon-Caravanier, M.; Dridi, Y.; Galiano, H.; Lemordant, D. Synthesis and Characterization of New Pyrrolidinium Based Protic Ionic Liquids. Good and Superionic Liquids. J. Phys. Chem. B 2008, 112, 13335–13343. [Google Scholar] [CrossRef]
- Atkin, R.; Warr, G.G. Structure in Confined Room-Temperature Ionic Liquids. J. Phys. Chem. C 2007, 111, 5162–5168. [Google Scholar] [CrossRef]
- Atkin, R.; Warr, G.G. The Smallest Amphiphiles: Nanostructure in Protic Room-Temperature Ionic Liquids with Short Alkyl Groups. J. Phys. Chem. B 2008, 112, 4164–4166. [Google Scholar] [CrossRef]
- Atkin, R.; Warr, G.G. Bulk and Interfacial Nanostructure in Protic Room Temperature Ionic Liquids. In Ionic Liquids: From Knowledge to Application; ACS Symposium, Series; Plechkova, N.V., Rogers, R.D., Seddon, K.R., Eds.; American Chemical Society: Washington, DC, USA, 2009; Volume 1030, pp. 317–333. [Google Scholar]
- Barycki, M.; Sosnowska, A.; Gajewicz, A.; Bobrowski, M.; Wileńska, D.; Skurski, P.; Gieldoń, A.; Czaplewski, C.; Uhl, S.; Laux, E.; et al. Temperature-dependent structure-property modeling of viscosity for ionic liquids. Fluid Phase Equilib. 2016, 427, 9–17. [Google Scholar] [CrossRef]
- Belieres, J.; Gervasio, D.; Angell, A. Binary inorganic salt mixtures as high conductivity liquid electrolytes for >100 °C fuel cells. Chem. Commun. 2006, 14, 4799–4801. [Google Scholar] [CrossRef]
- Benhlima, N.; Turmine, M.; Letellier, P.; Naejus, R.; Lemordant, D. Étude électrochimique du nitrate d’éthylammonium fondu à 298 K: Établissement d’une echelle de potentiel redox. J. Chim. Phys. 1998, 95, 25–44. [Google Scholar] [CrossRef]
- Berthod, A.; Ruiz-Ángel, M.J.; Carda-Broch, S. lonic liquids in separation techniques. J. Chromatogr. A 2008, 1184, 6–18. [Google Scholar] [CrossRef]
- Bonetti, M.; Oleinikova, A.; Bervillier, C. Coexistence Curve of the Ionic Binary Mixture Ethylammonium Nitrate-n-Octanol: Critical Properties. J. Phys. Chem. B 1997, 101, 2164–2173. [Google Scholar] [CrossRef]
- Campetella, M.; Mariani, A.; Sadun, C.; Wu, E.; Castner, E.W.; Gontrani, L. Structure and dynamics of propylammonium nitrate-acetonitrile mixtures: An intricate multi-scale system probed with experimental and theoretical techniques. J. Chem. Phys. 2018, 148, 134507. [Google Scholar] [CrossRef]
- Canongia Lopes, J.N.; Esperança, J.M.S.S.; Mão de Ferro, A.; Pereiro, A.B.; Plechkova, N.V.; Rebelo, L.P.N.; Seddon, K.R.; Vázquez-Fernández, I. Protonic Ammonium Nitrate Ionic Liquids and Their Mixtures: Insights into Their Thermophysical Behavior. J. Phys. Chem. B 2016, 120, 2397–2406. [Google Scholar] [CrossRef]
- Capelo, S.B.; Méndez-Morales, T.; Carrete, J.; López Lago, E.; Vila, J.; Cabeza, O.; Rodríguez, J.R.; Turmine, M.; Varela, L.M. Effect of Temperature and Cationic Chain Length on the Physical Properties of Ammonium Nitrate-Based Protic Ionic Liquids. J. Phys. Chem. B 2012, 116, 11302–11312. [Google Scholar] [CrossRef]
- Chagnes, A.; Tougui, A.; Carré, B.; Ranganathan, N.; Lemordant, D. Abnormal Temperature Dependence of the Viscosity of Ethylammonium Nitrate–Methanol Ionic Mixtures. J. Solut. Chem. 2004, 33, 247–255. [Google Scholar] [CrossRef]
- Evans, D.F.; Yamauchi, A.; Roman, R.; Casassa, E.Z. Micelle Formation in Ethylammonium Nitrate, a Low-Melting Fused Salt. J. Colloid Interface Sci. 1982, 88, 89–96. [Google Scholar] [CrossRef]
- Evans, D.F.; Yamauchi, A.; Wei, G.J.; Bloomfleid, V.A. Micelle Size in Ethylammonium Nitrate As Determined by Classical and Quasi-Elastic Light Scattering. J. Phys. Chem. 1983, 87, 3537–3541. [Google Scholar] [CrossRef]
- Frost, D.S.; Ngan, M.; Dai, L.L. Spontaneous Transport of Microparticles across Liquid-Liquid Interfaces. Langmuir 2013, 29, 9310–9315. [Google Scholar] [CrossRef]
- Frost, D.S.; Machas, M.; Perea, B.; Dai, L.L. Nonconvective Mixing of Miscible Ionic Liquids. Langmuir 2013, 29, 10159–10165. [Google Scholar] [CrossRef]
- Greaves, T.L.; Weerawardena, A.; Fong, C.; Krodkiewska, I.; Drummond, C.J. Protic Ionic Liquids: Solvents with Tunable Phase Behavior and Physicochemical Properties. J. Phys. Chem. B 2006, 110, 22479–22487. [Google Scholar] [CrossRef]
- Greaves, T.L.; Weerawardena, A.; Fong, C.; Drummond, C.J. Formation of Amphiphile Self-Assembly Phases in Protic Ionic Liquids. J. Phys. Chem. B 2007, 111, 4082–4088. [Google Scholar] [CrossRef]
- Greaves, T.L.; Mudie, S.T.; Drummond, C.J. Effect of protic ionic liquids (PILs) on the formation of non-ionic dodecyl poly(ethylene oxide) surfactant self-assembly structures and the effect of these surfactants on the nanostructure of PILs. Phys. Chem. Chem. Phys. 2011, 13, 20441–20452. [Google Scholar] [CrossRef]
- Hadded, M.; Biquard, M.; Letellier, P.; Schaal, R. Proprietes volumiques du nitrate d’ethylammonium fondu a 298 K et de ses melanges avec l’eau. Can. J. Chem. 1985, 63, 565–570. [Google Scholar] [CrossRef]
- Hadded, M.; Bahri, H.; Letellier, P. Tensions superficielles des mélanges binaires EAU-Nitrate d’éthylammonium à 298 K. J. Chim. Phys. 1986, 83, 419–426. [Google Scholar] [CrossRef]
- Hadded, M.; Mayaffre, A.; Letellier, P. Tensions superficielles des solutions idéales: Application aux solvants binaires constitués de methanol et de nitrate d’ethylammonium fondu a 298 K. J. Chim. Phys. 1989, 86, 525–537. [Google Scholar] [CrossRef]
- Hjalmarsson, N.; Atkin, R.; Rutland, M.W. Effect of Lithium Ions on Rheology and Interfacial Forces in Ethylammonium Nitrate and Ethanolammonium Nitrate. J. Phys. Chem. C 2016, 120, 26960–26967. [Google Scholar] [CrossRef]
- Hjalmarsson, N.; Atkin, R.; Rutland, M.W. Is the boundary layer of an ionic liquid equally lubricating at higher temperature? Phys. Chem. Chem. Phys. 2016, 18, 9232–9239. [Google Scholar] [CrossRef]
- Kaneko, K.; Yoshimura, Y.; Shimizu, A. Water concentration dependence of the refractive index of various ionic liquid-water mixtures. J. Mol. Liq. 2018, 250, 283–286. [Google Scholar] [CrossRef]
- Kanzaki, R.; Uchida, K.; Song, X.; Umebayashi, Y.; Ishiguro, S. Acidity and Basicity of Aqueous Mixtures of a Protic Ionic Liquid, Ethylammonium Nitrate. Anal. Sci. 2008, 24, 1347–1349. [Google Scholar] [CrossRef]
- Krueger, M.; Bründermann, E.; Funkner, S.; Weingärtner, H.; Havenith, M. Communications: Polarity fluctuations of the protic ionic liquid ethylammonium nitrate in the terahertz regime. J. Chem. Phys. 2010, 132, 101101. [Google Scholar] [CrossRef]
- Kundu, N.; Roy, A.; Dutta, R.; Sarkar, N. Translational and Rotational Diffusion of Two Differently Charged Solutes in Ethylammonium Nitrate-Methanol Mixture: Does the Nanostructure of the Amphiphiles Influence the Motion of the Solute? J. Phys. Chem. B 2016, 120, 5481–5490. [Google Scholar] [CrossRef]
- López-Barrón, C.R.; Wagner, N.J. Structural Transitions of CTAB Micelles in a Protic Ionic Liquid. Langmuir 2012, 28, 12722–12730. [Google Scholar] [CrossRef]
- Malham, I.B.; Letellier, P.; Mayaffre, A.; Turmine, M. Part I: Thermodynamic analysis of volumetric properties of concentrated aqueous solutions of l-butyl-3-methylimidazolium tetrafluoro borate, l-butyl-2,3-dimethylimidazolium tetrafluoroborate, and ethylammonium nitrate based on pseudo-lattice theory. J. Chem. Thermodyn. 2007, 39, 1132–1143. [Google Scholar] [CrossRef]
- Mariani, A.; Russina, O.; Caminiti, R.; Triolo, A. Structural organization in a methanol:ethylammonium nitrate (1:4) mixture: A joint X-ray/Neutron diffraction and computational study. J. Mol. Liq. 2015, 212, 947–956. [Google Scholar] [CrossRef]
- Mariani, A.; Caminiti, R.; Ramondo, F.; Salvitti, G.; Mocci, F.; Gontrani, L. Inhomogeneity in Ethylammonium Nitrate-Acetonitrile Binary Mixtures: The Highest “Low q Excess” Reported to Date. J. Phys. Chem. Lett. 2017, 8, 3512–3522. [Google Scholar] [CrossRef]
- Mariani, A.; Bonomo, M.; Wu, B.; Centrella, B.; Dini, D.; Castner, E.W., Jr.; Gontrani, L. Intriguing transport dynamics of ethylammonium nitrate–acetonitrile binary mixtures arising from nano-inhomogeneity. Phys. Chem. Chem. Phys. 2017, 19, 27212–27220. [Google Scholar] [CrossRef]
- Méndez-Morales, T.; Carrete, J.; Cabeza, O.; Russina, O.; Triolo, A.; Gallego, L.J.; Varela, L.M. Solvation of Lithium Salts in Protic Ionic Liquids: A Molecular Dynamics Study. J. Phys. Chem. B 2014, 118, 761–770. [Google Scholar] [CrossRef] [PubMed]
- Moore, L.J.; Summers, M.D.; Ritchie, A.D. Optical trapping and spectroscopic characterisation of ionic liquid solutions. Phys. Chem. Chem. Phys. 2013, 15, 13489–13498. [Google Scholar] [CrossRef] [PubMed]
- Oleinikova, A.; Bonetti, M. Critical Behavior of the Electrical Conductivity of Concentrated Electrolytes: Ethylammonium Nitrate in n-Octanol Binary Mixture. J. Sol. Chem. 2002, 31, 397–413. [Google Scholar] [CrossRef]
- Perlt, E.; Ray, P.; Hansen, A.; Malberg, F.; Grimme, S.; Kirchner, B. Finding the best density functional approximation to describe interaction energies and structures of ionic liquids in molecular dynamics studies. J. Chem. Phys. 2018, 148, 193835. [Google Scholar] [CrossRef]
- Perron, G.; Hardy, A.; Justice, J.-C.; Desnoyers, J.E. Model System for Concentrated Electrolyte Solutions: Thermodynamic and Transport Properties of Ethylammonium Nitrate in Acetonitrile and in Water. J. Sol. Chem. 1993, 22, 1159–1178. [Google Scholar] [CrossRef]
- Poole, C.F.; Kersten, B.R.; Ho, S.S.; Coddens, M.E.; Furton, K.G. Organic Salts, Liquid at Room Temperature, as Mobile Phases in Liquid Chromatography. J. Chromatogr. A 1986, 352, 407–425. [Google Scholar] [CrossRef]
- Poole, C.F. Chromatographic and spectroscopic 1nethods f or the determination of solvent properties of room temperature ionic liquids. J. Chromatogr. A 2004, 1037, 49–82. [Google Scholar] [CrossRef] [PubMed]
- Porcedda, S.; Marongiu, B.; Schirru, M.; Falconieri, D.; Piras, A. Excess enthalpy and excess volume for binary systems of two ionic liquids + water. J. Therm. Anal. Calorim. 2011, 103, 29–33. [Google Scholar] [CrossRef]
- Prabhu, S.R.; Dutt, G.B. Does Addition of an Electrolyte Influence the Rotational Diffusion of Nondipolar Solutes in a Protic Ionic Liquid? J. Phys. Chem. B 2015, 119, 6311–6316. [Google Scholar] [CrossRef] [PubMed]
- Ridings, C.; Warr, G.G.; Andersson, G.G. Surface Ordering in Binary Mixtures of Protic Ionic Liquids. J. Phys. Chem. Lett. 2017, 8, 4264–4267. [Google Scholar] [CrossRef]
- Russina, O.; Mariani, A.; Caminiti, R.; Triolo, A. Structure of a Binary Mixture of Ethylammonium Nitrate and Methanol. J. Sol. Chem. 2015, 44, 669–685. [Google Scholar] [CrossRef]
- Shetty, P.H.; Youngberg, P.J.; Kersen, B.R.; Poole, C.F. Solvent properties of liquid organic salts used as mobile phases in microcolumn reversed-phase liquid chromatography. J. Chromatogr. A 1987, 411, 61–79. [Google Scholar] [CrossRef]
- Shotwell, J.B.; Flowers II, R.A. Electrochemical Investigation of the Solvolytic Properties of Ethylammonium Nitrate (EAN) and Propylammonium Nitrate (PAN). Electroanalysis 2000, 12, 223–226. [Google Scholar] [CrossRef]
- Smith, J.A.; Webber, G.B.; Warr, G.G.; Atkin, R. Rheology of Protic Ionic Liquids and Their Mixtures. J. Phys. Chem. B 2013, 117, 13930–13935. [Google Scholar] [CrossRef]
- Smith, J.A.; Webber, G.B.; Warr, G.G.; Zimmer, A.; Atkin, R.; Werzer, O. Shear dependent viscosity of poly( ethylene oxide) in two protic ionic liquids. J. Colloid Interface Sci. 2014, 430, 56–60. [Google Scholar] [CrossRef]
- Song, X.; Hamano, H.; Minofar, B.; Kanzaki, R.; Fujii, K.; Kameda, Y.; Kohara, S.; Watanabe, M.; Ishiguro, S.; Umebayashi, Y. Structural Heterogeneity and Unique Distorted Hydrogen Bonding in Primary Ammonium Nitrate Ionic Liquids Studied by High-Energy X-ray Diffraction Experiments and MD Simulations. J. Phys. Chem. B 2012, 116, 2801–2813. [Google Scholar] [CrossRef]
- Sonnleitner, T.; Nikitina, V.; Nazet, A.; Buchner, R. Do H-bonds explain strong ion aggregation in ethylammonium nitrate + acetonitrile mixtures? Phys. Chem. Chem. Phys. 2013, 15, 18445–18452. [Google Scholar] [CrossRef]
- Sonnleitner, T.; Turton, D.A.; Hefter, G.; Ortner, A.; Waselikowski, S.; Walther, M.; Wynne, K.; Buchner, R. Ultra-Broadband Dielectric and Optical Kerr-Effect Study of the Ionic Liquids Ethyl and Propylammonium Nitrate. J. Phys. Chem. B 2015, 119, 8826–8841. [Google Scholar] [CrossRef]
- Sugden, S.; Wilkins, H. CLXVII.—The parachor and chemical constitution. Part XII. Fused metals and salts. J. Chem. Soc. 1929, 1291–1298. [Google Scholar] [CrossRef]
- Thater, J.C.; Gérard, V.; Stubenrauch, C. Microemulsions with the Ionic Liquid Ethylammonium Nitrate: Phase Behavior, Composition, and Microstructure. Langmuir 2014, 30, 8283–8289. [Google Scholar] [CrossRef]
- Turton, D.A.; Sonnleitner, T.; Ortner, A.; Walther, M.; Hefter, G.; Seddon, K.R.; Stana, S.; Plechkova, N.V.; Buchner, R.; Wynne, K. Structure and dynamics in protic ionic liquids: A combined optical Kerr-effect and dielectric relaxation spectroscopy study. Faraday Discuss. 2012, 154, 145–153. [Google Scholar] [CrossRef] [PubMed][Green Version]
- Usula, M.; Matteoli, E.; Leonelli, F.; Mocci, F.; Marincola, F.C.; Gontrani, L.; Porcedda, S. Thermo-physical properties of ammonium-based ionic liquid + N-methyl-2-pyrrolidone mixtures at 298.15 K. Fluid Phase Equilib. 2014, 383, 49–54. [Google Scholar] [CrossRef]
- Wakeham, D.; Nelson, A.; Warr, G.G.; Atkin, R. Probing the protic ionic liquid surface using X-ray reflectivity. Phys. Chem. Chem. Phys. 2011, 13, 20828–20835. [Google Scholar] [CrossRef] [PubMed]
- Wakeham, D.; Eschebach, D.; Webber, G.B.; Atkin, R.; Warr, G.G. Surface Composition of Mixtures of Ethylammonium Nitrate, Ethanolammonium Nitrate, and Water. Aust. J. Chem. 2012, 65, 1554–1556. [Google Scholar] [CrossRef]
- Weingärtner, H.; Merkel, T.; Käshammer, S.; Schröer, W.; Wiegand, S. The Effect of Short-Range Hydrogen-Bonded Interactions on the Nature of the Critical Point of Ionic Fluids. Part I: General Properties of the New System Ethylammonium Nitrate+n-Octanol with an Upper Consolute Point Near Room Temperature. Ber. Bunsenges. Phys. Chem. 1993, 97, 970–975. [Google Scholar] [CrossRef]
- Weingärtner, H.; Knocks, A.; Schrader, W.; Kaatze, U. Dielectric Spectroscopy of the Room Temperature Molten Salt Ethylammonium Nitrate. J. Phys. Chem. A 2001, 105, 8646–8650. [Google Scholar] [CrossRef]
- Yalcin, D.; Drummond, C.J.; Greaves, T.L. High throughput approach to investigating ternary solvents of aqueous non-stoichiometric protic ionic liquids. Phys. Chem. Chem. Phys. 2019, 21, 6810–6827. [Google Scholar] [CrossRef]
- Zarrougui, R.; Dhahbi, M.; Lemordant, D. Volumetric Properties of Ethylammonium Nitrate + γ -Butyrolactone Binary Systems: Solvation Phenomena from Density and Raman Spectroscopy. J. Sol. Chem. 2010, 39, 1531–1548. [Google Scholar] [CrossRef]
- Zarrougui, R.; Dhahbi, M.; Lemordan, D. Electrochemical behaviour of iodine redox couples in aprotic and protic RTILs: 1-Butyl-1-methylpyrrolidinium bis( trifluoromethanesulfonyl)imide and ethylammonium nitrate. J. Electroanal. Chem. 2014, 717–718, 189–195. [Google Scholar] [CrossRef]
- Zarrougui, R.; Dhahbi, M.; Lemordant, D. Transport and Thermodynamic Properties of Ethylammonium Nitrate–Water Binary Mixtures: Effect of Temperature and Composition. J. Sol. Chem. 2015, 44, 686–702. [Google Scholar] [CrossRef]
- Cuadrado-Prado, S.; Domínguez-Pérez, M.; Rilo, E.; García-Garabal, S.; Segade, L.; Franjo, C.; Cabeza, O. Experimental measurement of the hygroscopic grade on eight imidazolium based ionic liquids. Fluid Phase Equilib. 2009, 278, 36–40. [Google Scholar] [CrossRef]
- Cabeza, O.; García-Garabal, S.; Segade, L.; Domínguez-Pérez, M.; Rilo, E.; Varela, L.M. Physical Properties of Binary Mixtures of ILs with Water and Ethanol. A Review. In Ionic Liquids: Theory, Properties, New Approaches; Kokorin, A., Ed.; InTech: Rijeka, Croatia, 2011; pp. 111–136. Available online: https://www.intechopen.com/books/ionic-liquids-theory-properties-new-approaches/physical-properties-of-binary-mixtures-of-ils-with-water-and-ethanol-a-review- (accessed on 6 July 2021).
- Vogel, H. The law of the relationship between viscosity of liquids and the temperature. Phys. Z. 1921, 22, 645–646. [Google Scholar]
- Tammam, G.; Hesse, W. Die Abhängigkeit der viskosität von der temperatur bie unterkühlten flüssigkeiten. Z. Anorg. Allg. Chem. 1926, 156, 245–257. [Google Scholar] [CrossRef]
- Fulcher, G.S. Analysis of recent measurements of the viscosity of glasses. J. Am. Ceram. Soc. 1952, 8, 339–360. [Google Scholar] [CrossRef]


| EAN | PAN | |||||
|---|---|---|---|---|---|---|
| T (°C) | ρIL | A1 (107) | R2 | ρIL | A1 (107) | R2 |
| 5 | 1.2234 | −1.4448 | 0.9963 | 1.1639 | −0.66515 | 0.9941 |
| 10 | 1.2202 | −1.4610 | 0.9971 | 1.1608 | −0.67382 | 0.9941 |
| 15 | 1.2171 | −1.4745 | 0.9988 | 1.1577 | −0.70588 | 0.9958 |
| 20 | 1.2140 | −1.5136 | 0.9939 | 1.1546 | −0.73063 | 0.9913 |
| 25 | 1.2108 | −1.5354 | 0.9989 | 1.1516 | −0.76511 | 0.9945 |
| 30 | 1.2077 | −1.5516 | 0.9978 | 1.1485 | −0.79664 | 0.9938 |
| 35 | 1.2046 | −1.5800 | 0.9934 | 1.1456 | −0.83059 | 0.9926 |
| 40 | 1.2016 | −1.6151 | 0.9988 | 1.1425 | −0.83760 | 0.9920 |
| 45 | 1.1986 | −1.6151 | 0.9988 | 1.1396 | −0.89210 | 0.9908 |
| 50 | 1.1956 | −1.6805 | 0.9977 | 1.1366 | −0.90778 | 0.9920 |
| 55 | 1.1927 | −1.6700 | 0.9944 | 1.1337 | −0.96657 | 0.9944 |
| 60 | 1.1898 | −1.6959 | 0.9969 | 1.1309 | −1.0122 | 0.9956 |
| 65 | 1.1869 | −1.7551 | 0.9947 | 1.1279 | −1.0033 | 0.9986 |
| 70 | 1.1840 | −1.7654 | 0.9913 | 1.1250 | −1.0411 | 0.9980 |
| 75 | 1.1812 | −1.8331 | 0.9907 | 1.1222 | −1.0732 | 0.9995 |
| 80 | 1.1783 | −1.8467 | 0.9922 | 1.1193 | −1.0732 | 0.9995 |
| 85 | 1.1755 | −1.8688 | 0.9945 | 1.1164 | −1.1194 | 0.9981 |
| 90 | 1.1727 | −1.9341 | 0.9969 | 1.1136 | −1.1428 | 0.9953 |
| 95 | 1.1699 | −1.9799 | 0.9954 | 1.1106 | −1.1107 | 0.9927 |
| EAN | PAN | ||||||
|---|---|---|---|---|---|---|---|
| T (°C) | ηIL | A1 (104) | R2 | ηIL | A1 (104) | A2 (109) | R2 |
| 5 | 86.5 | −15.60 | 0.9981 | 201.6 | −57.29 | 70.74 | 0.9990 |
| 10 | 69.3 | −12.10 | 0.9983 | 153.7 | −41.82 | 50.26 | 0.9990 |
| 15 | 56.3 | −9.517 | 0.9983 | 119.7 | −31.40 | 37.31 | 0.9989 |
| 20 | 46.3 | −7.504 | 0.9984 | 94.8 | −23.98 | 28.02 | 0.9989 |
| 25 | 38.7 | −6.084 | 0.9982 | 76.3 | −18.51 | 21.00 | 0.9988 |
| 30 | 32.7 | −4.960 | 0.9989 | 62.3 | −14.56 | 16.29 | 0.9988 |
| 35 | 27.9 | −4.125 | 0.9985 | 51.6 | −11.64 | 12.83 | 0.9987 |
| 40 | 24.05 | −3.439 | 0.9987 | 43.2 | −9.434 | 10.30 | 0.9984 |
| 45 | 20.92 | −2.901 | 0.9987 | 36.5 | −7.642 | 8.041 | 0.9987 |
| 50 | 18.33 | −2.468 | 0.9987 | 31.2 | −6.293 | 6.465 | 0.9986 |
| 55 | 16.19 | −2.120 | 0.9989 | 26.9 | −5.220 | 5.206 | 0.9983 |
| 60 | 14.40 | −1.832 | 0.9989 | 23.39 | −4.362 | 4.224 | 0.9982 |
| 65 | 12.88 | −1.600 | 0.9989 | 20.56 | −3.748 | 3.623 | 0.9989 |
| 70 | 11.59 | −1.405 | 0.9990 | 18.15 | −3.191 | 2.991 | 0.9991 |
| 75 | 10.48 | −1.239 | 0.9988 | 16.11 | −2.722 | 2.455 | 0.9993 |
| 80 | 9.53 | −1.094 | 0.9987 | 14.40 | −2.340 | 2.026 | 0.9995 |
| 85 | 8.69 | −0.9741 | 0.9987 | 12.93 | −2.021 | 1.673 | 0.9996 |
| 90 | 7.97 | −0.8775 | 0.9989 | 11.68 | −1.764 | 1.419 | 0.9998 |
| 95 | 7.34 | −0.7932 | 0.9989 | 10.59 | −1.534 | 1.157 | 0.9999 |
| EAN | PAN | |||||
|---|---|---|---|---|---|---|
| T (°C) | κIL | A1 (104) | R2 | κIL | A1 (104) | R2 |
| 5 | 10.55 | 1.989 | 0.9991 | 3.50 | 1.053 | 0.9982 |
| 15 | 15.10 | 2.566 | 0.9990 | 5.52 | 1.451 | 0.9987 |
| 25 | 20.4 | 3.436 | 0.9978 | 8.12 | 1.891 | 0.9986 |
| 35 | 27.1 | 3.849 | 0.9982 | 11.34 | 2.364 | 0.9984 |
| 45 | 33.9 | 4.469 | 0.9980 | 15.11 | 2.831 | 0.9990 |
| 55 | 41.1 | 5.141 | 0.9968 | 19.37 | 3.450 | 0.9954 |
| 65 | 48.7 | 5.780 | 0.9911 | 24.4 | 3.875 | 0.9927 |
| 75 | 56.3 | 6.504 | 0.9951 | 29.9 | 4.185 | 0.9984 |
| 85 | 64.7 | 6.795 | 0.9936 | 35.5 | 4.361 | 0.9981 |
| 95 | 73.2 | 7.087 | 0.9942 | 41.6 | 4.548 | 0.9974 |
| EAN | PAN | ||||||
|---|---|---|---|---|---|---|---|
| Property | QIL | A1 | A2 | R2 | QIL | A1 | R2 |
| nD | 1.45395 | −5.14135 × 10⁻⁸ | −3.00678 × 10⁻¹² | 0.9979 | 1.45536 | −1.08059 × 10⁻⁷ | 0.9980 |
| σ (mN·m−1) | 47.75 | 2.008 × 10⁻⁵ | 0.9932 | 38.72 | 2.201 × 10⁻⁵ | 0.9929 | |
| IL | Aρ,0 | Aρ,1 (104) | R2ρ | Bƞ | T0,ƞ | sƞ | Bκ | T0,κ | sκ | ||
|---|---|---|---|---|---|---|---|---|---|---|---|
| EAN | 1.2257 | −5.9379 | 0.9996 | 0.2111 | 778.8 | 148.7 | 0.06 | 666.2 | −424.9 | 175.8 | 0.7 |
| PAN | 1.1664 | −5.8998 | 0.9998 | 0.1823 | 869.5 | 154.1 | 0.10 | 904.1 | −620.8 | 166.4 | 0.3 |
| IL | EAN | PAN | ||||||
|---|---|---|---|---|---|---|---|---|
| A (T) | C0 | C1 | C2 | R2 | C0 | C1 | C2 | R2 |
| Aκ (T) | 1.554 × 10⁻⁴ | 7.445 × 10⁻⁶ | −1.549 × 10⁻⁸ | 0.9954 | 6.294 × 10⁻⁵ | 5.924 × 10⁻⁶ | −1.775 × 10⁻⁸ | 0.9923 |
| Aƞ,1 (T) | −6.246 | −4.994 × 10⁻² | 1.740 × 10⁻⁴ | 0.9997 | −4.917 | −5.883 × 10⁻² | 1.951 × 10⁻⁴ | 0.9996 |
| Aƞ,2 (T) | −16.22 | −6.074 × 10⁻² | 1.633 × 10⁻⁴ | 0.9994 | ||||
Publisher’s Note: MDPI stays neutral with regard to jurisdictional claims in published maps and institutional affiliations. |
© 2021 by the authors. Licensee MDPI, Basel, Switzerland. This article is an open access article distributed under the terms and conditions of the Creative Commons Attribution (CC BY) license (https://creativecommons.org/licenses/by/4.0/).
Share and Cite
Ausín, D.; Parajó, J.J.; Trenzado, J.L.; Varela, L.M.; Cabeza, O.; Segade, L. Influence of Small Quantities of Water on the Physical Properties of Alkylammonium Nitrate Ionic Liquids. Int. J. Mol. Sci. 2021, 22, 7334. https://doi.org/10.3390/ijms22147334
Ausín D, Parajó JJ, Trenzado JL, Varela LM, Cabeza O, Segade L. Influence of Small Quantities of Water on the Physical Properties of Alkylammonium Nitrate Ionic Liquids. International Journal of Molecular Sciences. 2021; 22(14):7334. https://doi.org/10.3390/ijms22147334
Chicago/Turabian StyleAusín, David, Juan J. Parajó, José L. Trenzado, Luis M. Varela, Oscar Cabeza, and Luisa Segade. 2021. "Influence of Small Quantities of Water on the Physical Properties of Alkylammonium Nitrate Ionic Liquids" International Journal of Molecular Sciences 22, no. 14: 7334. https://doi.org/10.3390/ijms22147334
APA StyleAusín, D., Parajó, J. J., Trenzado, J. L., Varela, L. M., Cabeza, O., & Segade, L. (2021). Influence of Small Quantities of Water on the Physical Properties of Alkylammonium Nitrate Ionic Liquids. International Journal of Molecular Sciences, 22(14), 7334. https://doi.org/10.3390/ijms22147334