
Influence of Genotype on High Glucosinolate Synthesis Lines of Brassica rapa

 ,
,  and
and 
Abstract
:1. Introduction
2. Results
2.1. Generation of BrYSP DH Lines and GSL Content Profiles
2.2. Resequencing of Parents, HGSL Lines, and LGSL Lines
2.3. SNP Genotyping and InDels
2.4. Identification of GSL Biosynthesis-Specific Recombinant Blocks

| Sample ID | No. of Reads | No. of Bases | No. of Clean Reads | Clean Reads (%) | No. of Clean Bases | Clean Bases (%) | De-Duplicated Reads | De- Duplicated Reads (%) | Mapped Reads | Mapped Reads (%) | Ave. Coverage (x) |
|---|---|---|---|---|---|---|---|---|---|---|---|
| LP08(♀) | 775,036,332 | 78,278,669,532 | 748,357,766 | 96.56 | 75,085,735,554 | 95.92 | 613,028,554 | 81.92 | 555,700,094 | 90.65 | 157.05 |
| LP21(♂) | 704,684,562 | 71,173,140,762 | 676,201,118 | 95.96 | 67,699,611,150 | 95.12 | 592,219,743 | 87.58 | 551,893,412 | 93.19 | 156.07 |
| BrYSP_DH005 | 135,586,708 | 20,473,592,908 | 132,434,320 | 97.68 | 19,674,335,422 | 96.10 | 121,145,704 | 91.48 | 116,215,959 | 95.93 | 48.48 |
| BrYSP_DH009 | 130,566,110 | 19,715,482,610 | 128,070,232 | 98.09 | 19,054,916,880 | 96.65 | 120,327,985 | 93.95 | 115,494,194 | 95.98 | 48.06 |
| BrYSP_DH014 | 143,278,512 | 21,635,055,312 | 141,074,216 | 98.46 | 21,128,122,142 | 97.66 | 133,925,200 | 94.93 | 127,330,977 | 95.08 | 53.5 |
| BrYSP_DH016 | 134,052,434 | 20,241,917,534 | 132,201,870 | 98.62 | 19,784,969,829 | 97.74 | 123,574,666 | 93.47 | 117,994,498 | 95.48 | 49.38 |
| BrYSP_DH017 | 145,561,748 | 21,979,823,948 | 144,029,952 | 98.95 | 21,590,666,966 | 98.23 | 133,547,331 | 92.72 | 126,848,299 | 94.98 | 53.23 |
| BrYSP_DH026 | 194,633,904 | 29,389,719,504 | 192,401,316 | 98.85 | 28,832,473,186 | 98.1 | 176,347,873 | 91.66 | 168,647,644 | 95.63 | 70.80 |
| BrYSP_DH059 | 126,815,042 | 19,149,071,342 | 125,484,032 | 98.95 | 18,829,119,983 | 98.33 | 117,116,774 | 93.33 | 111,549,893 | 95.25 | 46.89 |
| BrYSP_DH061 | 138,437,794 | 20,904,106,894 | 137,010,406 | 98.97 | 20,534,954,754 | 98.23 | 127,865,424 | 93.33 | 122,305,767 | 95.65 | 51.45 |
| ♀ | HGSL Line | LGSL Lines | ♂ | |||||||||||||
|---|---|---|---|---|---|---|---|---|---|---|---|---|---|---|---|---|
| Chrom | Start | Stop | Name | Gene ID V1.5 | Gene ID V3.0 | Stages | LP08 | DH 005 | DH 014 | DH 016 | DH 017 | DH 026 | DH 009 | DH 059 | DH 061 | LP21 |
| A03 | 21326869 | 21328218 | MYB28.1 | Bra012961 | BraA03g044440.3C | Transcription factors—Aliphatic | LP08 | LP08 | LP08 | LP08 | LP08 | LP08 | LP21 | LP21 | LP21 | LP21 |
| A09 | 3469113 | 3470483 | MYB28.2 | Bra035929 | BraA09g007000.3C | LP08 | LP21 | LP08 | LP08 | LP08 | LP08 | LP21 | LP21 | LP08 | LP21 | |
| A02 | 25403875 | 25405492 | MYB28.3 | Bra029311 | BraA02g043310.3C | LP08 | LP08 | LP21 | LP21 | LP21 | LP21 | LP08 | LP21 | LP21 | LP21 | |
| A03 | 1364309 | 1365719 | MYB29.1 | Bra005949 | BraA03g003070.3C | LP08 | LP08 | LP08 | LP21 | LP21 | LP08 | LP21 | LP21 | LP08 | LP21 | |
| A09 | 3356433 | 3357581 | MYB34.1 | Bra035954 | BraA09g006760.3C | Transcription factors—Indolic | LP08 | LP21 | LP08 | LP08 | LP08 | LP08 | LP21 | LP21 | LP08 | LP21 |
| A03 | 21129279 | 21130669 | MYB34.2 | Bra013000 | BraA03g043850.3C | LP08 | LP08 | LP08 | LP08 | LP08 | LP08 | LP21 | LP21 | LP21 | LP21 | |
| A02 | 25183826 | 25184998 | MYB34.3 | Bra029349 | BraA02g042890.3C | LP08 | LP08 | LP21 | LP21 | LP21 | LP21 | LP08 | LP21 | LP21 | LP21 | |
| A02 | 25172906 | 25179858 | MYB34.4 | Bra029350 | BraA02g042880.3C | LP08 | LP08 | LP21 | LP21 | LP21 | LP21 | LP08 | LP21 | LP21 | LP21 | |
| A08 | 18248352 | 18249890 | MYB51.2 | Bra016553 | BraA08g028300.3C | LP08 | LP21 | LP08 | LP08 | LP08 | LP08 | LP08 | LP21 | LP21 | LP21 | |
| A06 | 6841688 | 6842966 | MYB51.3 | Bra025666 | BraA06g013940.3C | LP08 | LP21 | LP21 | LP08 | LP08 | LP21 | LP08 | LP08 | LP21 | LP21 | |
| A07 | 23411313 | 23412768 | MYB122.1 | Bra015939 | BraA07g037950.3C | LP08 | LP08 | LP08 | LP08 | LP08 | LP08 | LP08 | LP08 | LP08 | LP21 | |
| A02 | 12327349 | 12329278 | MYB122.2 | Bra008131 | BraA02g022140.3C | LP08 | LP08 | LP21 | LP21 | LP21 | LP21 | LP08 | LP21 | LP08 | LP21 | |
| A03 | 18302919 | 18305368 | BCAT-4 | Bra001761 | BraA03g039030.3C | Side chain elongation | LP08 | LP08 | LP08 | LP08 | LP08 | LP08 | LP21 | LP21 | LP21 | LP21 |
| A05 | 18305152 | 18307632 | BCAT-4 | Bra022448 | BraA05g027600.3C | LP08 | LP21 | LP08 | LP08 | LP08 | LP08 | LP08 | LP08 | LP08 | LP21 | |
| A06 | 8849237 | 8851230 | BCAT-3 | Bra017964 | BraA06g017190.3C | LP08 | LP21 | LP21 | LP08 | LP08 | LP21 | LP08 | LP08 | LP21 | LP21 | |
| A01 | 14814889 | 14817183 | BCAT-3 | Bra029966 | BraA01g023550.3C | LP08 | LP21 | LP21 | LP21 | LP21 | LP21 | LP21 | LP21 | LP21 | LP21 | |
| A02 | 2391691 | 2393547 | IPMDH1 | Bra023450 | BraA02g005400.3C | LP08 | LP21 | LP21 | LP21 | LP21 | LP21 | LP08 | LP21 | LP08 | LP21 | |
| A03 | 21085392 | 21093219 | MAM1 | Bra013007 | BraA03g043770.3C | LP08 | LP08 | LP08 | LP08 | LP08 | LP08 | LP21 | LP21 | LP21 | LP21 | |
| A03 | 21061112 | 21065885 | MAM3 | Bra013009 | BraA03g043760.3C | LP08 | LP08 | LP08 | LP08 | LP08 | LP08 | LP21 | LP21 | LP21 | LP21 | |
| A03 | 21054537 | 21056963 | MAM3 | Bra013011 | BraA03g043750.3C | LP08 | LP08 | LP08 | LP08 | LP08 | LP08 | LP21 | LP21 | LP21 | LP21 | |
| A02 | 15934744 | 15944413 | MAM1 | Bra018524 | LP08 | LP08 | LP21 | LP21 | LP21 | LP21 | LP08 | LP21 | LP21 | LP21 | ||
| A02 | 25115507 | 25119702 | MAM1 | Bra029355 | BraA02g042820.3C | LP08 | LP08 | LP21 | LP21 | LP21 | LP21 | LP08 | LP21 | LP21 | LP21 | |
| A02 | 25103449 | 25106649 | MAM3 | Bra029356 | BraA02g042810.3C | LP08 | LP08 | LP21 | LP21 | LP21 | LP21 | LP08 | LP21 | LP21 | LP21 | |
| A04 | 5653874 | 5657118 | IPMI LSU1 | Bra032708 | BraA04g008730.3C | LP08 | LP21 | LP21 | LP21 | LP21 | LP21 | LP21 | LP21 | LP21 | LP21 | |
| A08 | 5964064 | 5967370 | IPMI LSU1 | Bra040341 | BraA08g006340.3C | LP08 | LP21 | LP21 | LP08 | LP08 | LP21 | LP08 | LP21 | LP21 | LP21 | |
| A05 | 1608381 | 1609157 | IPMI SSU2 | Bra004744 | BraA05g003360.3C | LP08 | LP21 | LP21 | LP08 | LP08 | LP21 | LP21 | LP08 | LP21 | LP21 | |
| A03 | 12943140 | 12945015 | BAT5 | Bra000760 | BraA03g027810.3C | LP08 | LP08 | LP08 | LP08 | LP08 | LP08 | LP21 | LP21 | LP21 | LP21 | |
| A09 | 17204468 | 17206516 | BAT5 | Bra029434 | BraA09g026220.3C | LP08 | LP08 | LP08 | LP08 | LP08 | LP08 | LP08 | LP08 | LP21 | LP21 | |
| A06 | 6007926 | 6010112 | CYP79F1 | Bra026058 | BraA06g012170.3C | Core structure synthesis—Aliphatic | LP08 | LP21 | LP21 | LP08 | LP08 | LP21 | LP08 | LP08 | LP21 | LP21 |
| A04 | 5460393 | 5462018 | CYP83A1 | Bra032734 | BraA04g008410.3C | LP08 | LP21 | LP21 | LP21 | LP21 | LP21 | LP21 | LP21 | LP21 | LP21 | |
| A02 | 768271 | 770517 | CYP79A2–Aromatic | Bra028764 | BraA02g001710.3C | LP08 | LP21 | LP21 | LP21 | LP21 | LP21 | LP08 | LP21 | LP08 | LP21 | |
| A05 | 24811698 | 24812553 | GSTF11 | Bra032010 | BraA05g041750.3C | LP08 | LP21 | LP08 | LP08 | LP08 | LP08 | LP08 | LP21 | LP08 | LP21 | |
| A07 | 17498418 | 17499341 | GSTU20 | Bra003645 | BraA07g026570.3C | LP08 | LP08 | LP08 | LP08 | LP08 | LP08 | LP08 | LP08 | LP08 | LP21 | |
| A01 | 3359620 | 3360837 | GGP1 | Bra011201 | BraA01g007200.3C | LP08 | LP21 | LP21 | LP21 | LP21 | LP21 | LP21 | LP21 | LP08 | LP21 | |
| A03 | 27901998 | 27903448 | GGP1 | Bra024068 | BraA03g029390.3C | LP08 | LP08 | LP08 | LP21 | LP21 | LP08 | LP21 | LP21 | LP21 | LP21 | |
| A08 | 12833451 | 12834884 | GGP1 | Bra010282 | LP08 | LP21 | LP21 | LP08 | LP08 | LP21 | LP08 | LP21 | LP21 | LP21 | ||
| A08 | 12835830 | 12837549 | GGP1 | Bra010283 | BraA08g017720.3C | LP08 | LP21 | LP21 | LP08 | LP08 | LP21 | LP08 | LP21 | LP21 | LP21 | |
| A09 | 5949618 | 5952361 | SUR1 | Bra036703 | BraA09g011980.3C | LP08 | LP21 | LP08 | LP08 | LP08 | LP08 | LP08 | LP21 | LP08 | LP21 | |
| A09 | 25123658 | 25125223 | UGT74B1 | Bra024634 | BraA09g038870.3C | LP08 | LP08 | LP08 | LP08 | LP08 | LP08 | LP08 | LP08 | LP21 | LP21 | |
| A01 | 16964878 | 16965828 | ST5b | Bra031476 | BraA01g028650.3C | LP08 | LP21 | LP21 | LP21 | LP21 | LP21 | LP21 | LP21 | LP21 | LP21 | |
| A07 | 18479546 | 18480592 | ST5b | Bra003817 | LP08 | LP08 | LP08 | LP08 | LP08 | LP08 | LP08 | LP08 | LP08 | LP21 | ||
| A07 | 18481748 | 18482782 | ST5b | Bra003818 | BraA07g028360.3C | LP08 | LP08 | LP08 | LP08 | LP08 | LP08 | LP08 | LP08 | LP08 | LP21 | |
| A07 | 18002729 | 18003723 | ST5b | Bra003726 | BraA07g027400.3C | LP08 | LP08 | LP08 | LP08 | LP08 | LP08 | LP08 | LP08 | LP08 | LP21 | |
| A07 | 23419048 | 23420082 | ST5b | Bra015938 | BraA07g037960.3C | LP08 | LP08 | LP08 | LP08 | LP08 | LP08 | LP08 | LP08 | LP08 | LP21 | |
| A07 | 23426595 | 23427635 | ST5b | Bra015936 | BraA07g037980.3C | LP08 | LP08 | LP08 | LP08 | LP08 | LP08 | LP08 | LP08 | LP08 | LP21 | |
| A09 | 7726767 | 7727825 | ST5b | Bra027623 | BraA09g012830.3C | LP08 | LP08 | LP08 | LP08 | LP08 | LP08 | LP08 | LP08 | LP08 | LP21 | |
| A09 | 9019311 | 9020375 | ST5b | Bra027117 | BraA09g016490.3C | LP08 | LP08 | LP08 | LP08 | LP08 | LP08 | LP08 | LP08 | LP08 | LP21 | |
| A09 | 9021641 | 9022747 | ST5b | Bra027118 | BraA09g016500.3C | LP08 | LP08 | LP08 | LP08 | LP08 | LP08 | LP08 | LP08 | LP08 | LP21 | |
| A09 | 9977892 | 9978911 | ST5b | Bra027880 | BraA09g017830.3C | LP08 | LP08 | LP08 | LP08 | LP08 | LP08 | LP08 | LP08 | LP21 | LP21 | |
| A06 | 6850053 | 6851066 | ST5c | Bra025668 | BraA06g013960.3C | LP08 | LP21 | LP21 | LP08 | LP08 | LP21 | LP08 | LP08 | LP21 | LP21 | |
| A01 | 374137 | 375874 | CYP79B2 | Bra011821 | BraA01g000840.3C | Core structure synthesis—Indolic | LP08 | LP21 | LP08 | LP08 | LP08 | LP08 | LP21 | LP21 | LP08 | LP21 |
| A03 | 31203169 | 31205210 | CYP79B2 | Bra017871 | BraA03g061480.3C | LP08 | LP08 | LP08 | LP21 | LP21 | LP08 | LP21 | LP21 | LP21 | LP21 | |
| A08 | 14973444 | 14975600 | CYP79B2 | Bra010644 | BraA08g021670.3C | LP08 | LP21 | LP08 | LP08 | LP08 | LP08 | LP08 | LP21 | LP21 | LP21 | |
| A08 | 5058097 | 5059748 | CYP83B1 | Bra034941 | BraA08g007380.3C | LP08 | LP21 | LP21 | LP08 | LP08 | LP21 | LP08 | LP21 | LP21 | LP21 | |
| A03 | 7230400 | 7231268 | GSTF9 | Bra022815 | BraA03g016240.3C | LP08 | LP08 | LP08 | LP08 | LP08 | LP08 | LP21 | LP21 | LP08 | LP21 | |
| A04 | 13901442 | 13902299 | GSTF9 | Bra021673 | BraA04g022220.3C | LP08 | LP21 | LP08 | LP21 | LP21 | LP08 | LP21 | LP21 | LP21 | LP21 | |
| A03 | 7232844 | 7233982 | GSTF10 | Bra022816 | BraA03g016250.3C | LP08 | LP08 | LP08 | LP08 | LP08 | LP08 | LP21 | LP21 | LP08 | LP21 | |
| A02 | 12337180 | 12338199 | ST5a | Bra008132 | BraA02g022150.3C | LP08 | LP08 | LP21 | LP21 | LP21 | LP21 | LP08 | LP21 | LP08 | LP21 | |
| A07 | 23427909 | 23428469 | ST5a | Bra015935 | LP08 | LP08 | LP08 | LP08 | LP08 | LP08 | LP08 | LP08 | LP08 | LP21 | ||
| A08 | 19203810 | 19205763 | FMOGS-OX5 | Bra016787 | BraA08g030720.3C | Side chain modification—Aliphatic | LP08 | LP21 | LP08 | LP08 | LP08 | LP08 | LP08 | LP21 | LP21 | LP21 |
| A09 | 8217824 | 8219479 | FMOGS-OX2 | Bra027035 | BraA09g015600.3C | LP08 | LP08 | LP08 | LP08 | LP08 | LP08 | LP08 | LP08 | LP08 | LP21 | |
| A02 | 15973741 | 15976278 | AOP2 | Bra018521 | BraA02g027430.3C | LP08 | LP08 | LP21 | LP21 | LP21 | LP21 | LP08 | LP21 | LP21 | LP21 | |
| A03 | 13492936 | 13494533 | AOP1 | Bra000847 | BraA03g028760.3C | LP08 | LP08 | LP08 | LP08 | LP08 | LP08 | LP21 | LP21 | LP21 | LP21 | |
| A03 | 13498815 | 13503183 | AOP2 | Bra000848 | BraA03g028770.3C | LP08 | LP08 | LP08 | LP08 | LP08 | LP08 | LP21 | LP21 | LP21 | LP21 | |
| A09 | 1170626 | 1172022 | AOP1 | Bra034182 | BraA09g001250.3C | LP08 | LP21 | LP08 | LP08 | LP08 | LP08 | LP21 | LP21 | LP08 | LP21 | |
| A09 | 1168503 | 1169786 | AOP1 | Bra034181 | BraA09g001260.3C | LP08 | LP21 | LP08 | LP08 | LP08 | LP08 | LP21 | LP21 | LP08 | LP21 | |
| A09 | 1165028 | 1166807 | AOP2 | Bra034180 | LP08 | LP21 | LP08 | LP08 | LP08 | LP08 | LP21 | LP21 | LP08 | LP21 | ||
| A03 | 7768293 | 7769612 | GSL-OH | Bra022920 | BraA03g017350.3C | LP08 | LP08 | LP08 | LP08 | LP08 | LP08 | LP21 | LP21 | LP08 | LP21 | |
| A04 | 13852551 | 13853809 | GSL-OH | Bra021670 | BraA04g022180.3C | LP08 | LP21 | LP08 | LP21 | LP21 | LP08 | LP21 | LP21 | LP21 | LP21 | |
| A04 | 13877397 | 13878646 | GSL-OH | Bra021671 | BraA04g022190.3C | LP08 | LP21 | LP08 | LP21 | LP21 | LP08 | LP21 | LP21 | LP21 | LP21 | |
| A02 | 5846392 | 5848174 | CYP81F2 | Bra020459 | BraA02g012540.3C | Side chain modification—Indolic | LP08 | LP08 | LP21 | LP21 | LP21 | LP21 | LP08 | LP21 | LP08 | LP21 |
| A03 | 5233924 | 5236233 | CYP81F2 | Bra006830 | BraA03g012390.3C | LP08 | LP08 | LP08 | LP08 | LP08 | LP08 | LP21 | LP21 | LP08 | LP21 | |
| A03 | 20376817 | 20378290 | APK1 | Bra013120 | BraA03g042630.3C | LP08 | LP08 | LP08 | LP08 | LP08 | LP08 | LP21 | LP21 | LP21 | LP21 | |
| A01 | 361733 | 363288 | APK2 | Bra011822 | BraA01g000800.3C | Sulphur supplementation | LP08 | LP21 | LP08 | LP08 | LP08 | LP08 | LP21 | LP21 | LP08 | LP21 |
| A03 | 31218969 | 31220359 | APK2 | Bra017872 | BraA03g061500.3C | LP08 | LP08 | LP08 | LP21 | LP21 | LP08 | LP21 | LP21 | LP21 | LP21 | |
| A08 | 14980248 | 14981406 | APK2 | Bra010645 | BraA08g021680.3C | LP08 | LP21 | LP08 | LP08 | LP08 | LP08 | LP08 | LP21 | LP21 | LP21 | |
2.5. Comparative Analysis of GSL Pathway between Individual Genotypes
2.6. GSL Hydrolysis Products
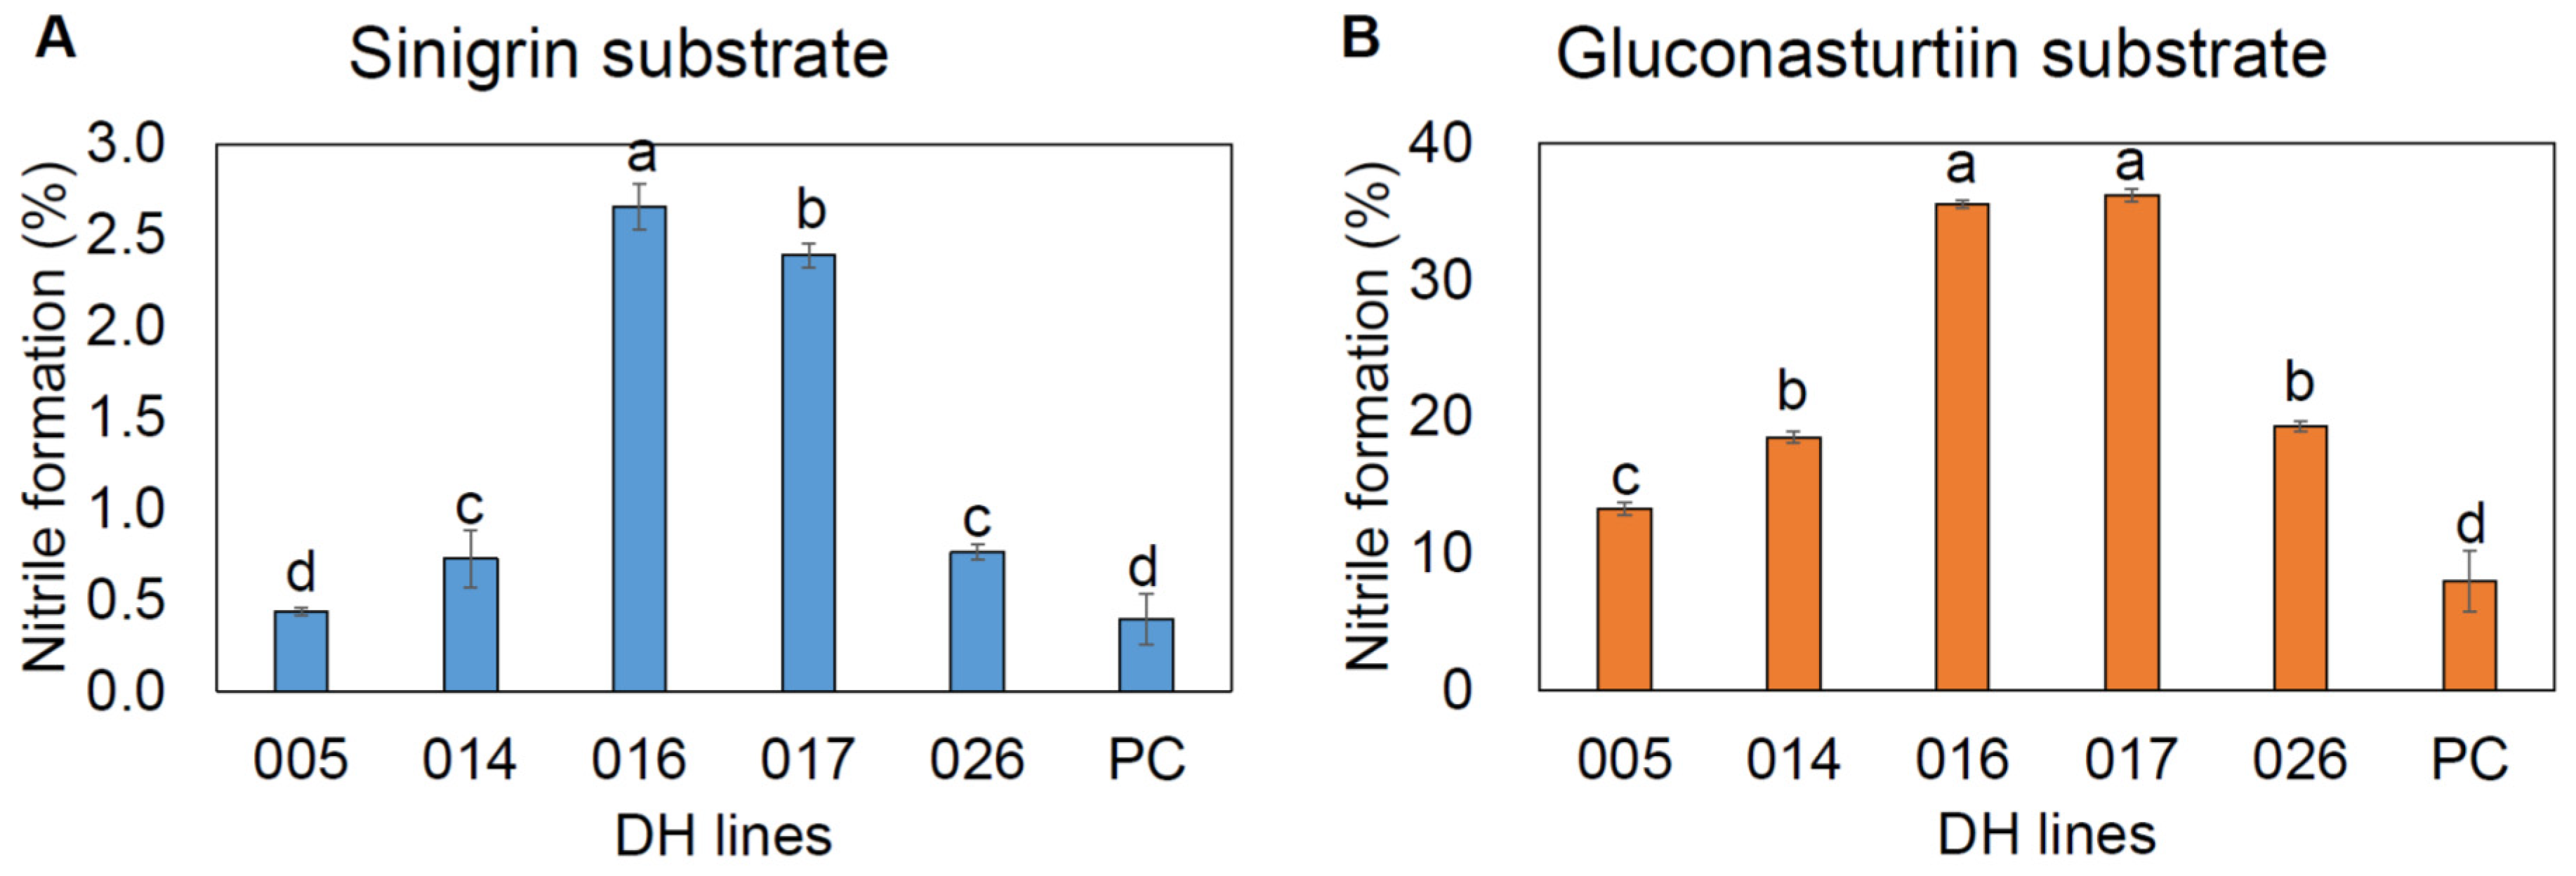
2.7. Nitrile Formation
3. Discussion
4. Materials and Methods
4.1. Plant Materials
4.2. HPLC Analysis for Identification of GSL Content
4.3. Resequencing
4.4. Variant Calling
4.5. Identification of Recombinant Blocks
4.6. Quantification of Glucosinolate Hydrolysis Products
4.7. Measurement of Nitrile Formation
4.8. Statistical Analysis
5. Conclusions
6. Patents
Supplementary Materials
Author Contributions
Funding
Institutional Review Board Statement
Informed Consent Statement
Data Availability Statement
Acknowledgments
Conflicts of Interest
References
- Frazie, M.D.; Kim, M.J.; Ku, K.M. Health-promoting phytochemicals from 11 mustard cultivars at baby leaf and mature stages. Molecules 2017, 22, 1749. [Google Scholar] [CrossRef] [PubMed] [Green Version]
- Ku, K.M.; Jeffery, E.H.; Juvik, J.A. Influence of seasonal variation and methyl jasmonate mediated induction of glucosinolate biosynthesis on quinone reductase activity in broccoli florets. J. Agric. Food Chem. 2013, 61, 9623–9631. [Google Scholar] [CrossRef] [PubMed]
- Lee, Y.S.; Ku, K.M.; Becker, T.M.; Juvik, J.A. Chemopreventive glucosinolate accumulation in various broccoli and collard tissues: Microfluidic-based targeted transcriptomics for by-product valorization. PLoS ONE 2017, 12, e0185112. [Google Scholar] [CrossRef] [PubMed] [Green Version]
- Prabhakaran, S.; Kim, J.S. Anti-carcinogenic glucosinolates in cruciferous vegetables and their antagonistic effects on prevention of Cancers. Molecules 2018, 23, 2983. [Google Scholar]
- Di Gioia, F.; Tzortzakis, N.; Rouphael, Y.; Kyriacou, M.C.; Sampaio, S.L.; Ferreira, I.; Petropoulos, S.A. Grown to be blue—Antioxidant properties and health effects of colored vegetables. Part II: Leafy, fruit, and other vegetables. Antioxidants 2020, 9, 97. [Google Scholar] [CrossRef] [PubMed] [Green Version]
- Sønderby, I.E.; Geu-Flores, F.; Halkier, B.A. Biosynthesis of glucosinolates–gene discovery and beyond. Trends Plant Sci. 2010, 15, 283–290. [Google Scholar] [CrossRef] [PubMed]
- Han, N.; Ku, K.M.; Kim, J.K. Postharvest variation of major glucosinolate and their hydrolytic products in Brassicoraphanus ‘BB1’. Posrtharvest Biol. Technol. 2019, 154, 70–78. [Google Scholar] [CrossRef]
- Nguyen, V.P.T.; Stewart, J.; Lopez, M.; Ioannou, I.; Allais, F. Glucosinolates: Natural Occurrence, Biosynthesis, Accessibility, Isolation, Structures, and Biological Activities. Molecules 2020, 19, 4537. [Google Scholar] [CrossRef]
- Halkier, B.A.; Gershenzon, J. Biology and biochemistry of glucosinolates. Annu. Rev. Plant Biol. 2006, 57, 303–333. [Google Scholar] [CrossRef] [Green Version]
- Li, X.; Ramchiary, N.; Dhandapani, V.; Choi, S.R.; Hur, Y.; Nou, I.S.; Yoon, M.K.; Lim, Y.P. Quantitative trait loci mapping in Brassica rapa revealed the structural and functional conservation of genetic loci governing morphological and yield component traits in the A, B, and C subgenomes of Brassica species. DNA Res. 2012, 20, 1–16. [Google Scholar] [CrossRef] [Green Version]
- Wang, H.; Wu, J.; Sun, S.; Liu, B.; Cheng, F.; Sun, R.; Wang, X. Glucosinolate biosynthetic genes in Brassica rapa. Gene 2011, 487, 135–142. [Google Scholar] [CrossRef]
- Yang, J.; Liu, D.; Wang, X.; Ji, C.; Cheng, F.; Liu, B.; Yao, P. The genome sequence of allopolyploid Brassica juncea and analysis of differential homoeolog gene expression influencing selection. Nat. Genet. 2016, 48, 1225–1232. [Google Scholar] [CrossRef] [PubMed]
- Sawada, Y.; Kuwahara, A.; Nagano, M.; Narisawa, T.; Sakata, A.; Saito, K.; Yokota, H.M. Omics-based approaches to methionine side chain elongation in Arabidopsis: Characterization of the genes encoding methylthioalkylmalate isomerase and methylthioalkylmalate dehydrogenase. Plant Cell. Physiol. 2009, 50, 1181–1190. [Google Scholar] [CrossRef] [PubMed] [Green Version]
- Textor, S.; Bartram, S.; Kroymann, J.; Falk, K.L.; Hick, A.; Pickett, J.A.; Gershenzon, J. Biosynthesis of methionine-derived glucosinolates in Arabidopsis thaliana: Recombinant expression and characterization of methylthioalkylmalate synthase, the condensing enzyme of the chain-elongation cycle. Planta 2004, 218, 1026–1035. [Google Scholar] [CrossRef]
- Hansen, B.G.; Kliebenstein, D.J.; Halkier, B.A. Identification of a flavin-monooxygenase as the S-oxygenating enzyme in aliphatic glucosinolate biosynthesis in Arabidopsis. Plant J. 2007, 50, 902–910. [Google Scholar] [CrossRef]
- Li, J.; Hansen, B.G.; Ober, J.A.; Kliebenstein, D.J.; Halkier, B.A. Subclade of flavin-monooxygenases involved in aliphatic glucosinolate biosynthesis. Plant Physiol. 2008, 148, 1721–1733. [Google Scholar] [CrossRef] [Green Version]
- Neal, C.S.; Fredericks, D.P.; Griffiths, C.A.; Neale, A.D. The characterisation of AOP2: A gene associated with the biosynthesis of aliphatic alkenyl glucosinolates in Arabidopsis thaliana. BMC Plant Biol. 2010, 10, 1–16. [Google Scholar] [CrossRef] [PubMed] [Green Version]
- Liu, S.; Liu, Y.; Yang, X.; Tong, C.; Edwards, D.; Parkin, I.A.; Zhao, M.; Ma, J.; Yu, J.; Huang, S.; et al. The Brassica oleracea genome reveals the asymmetrical evolution of polyploid genomes. Nat. Commun. 2014, 5, 1–11. [Google Scholar] [CrossRef] [PubMed]
- Zhang, J.; Liu, Z.; Liang, J.; Wu, J.; Cheng, F.; Wang, X. Three genes encoding AOP2, a protein involved in aliphatic glucosinolate biosynthesis, are differentially expressed in Brassica rapa. J. Exp. Bot. 2015, 66, 6205–6218. [Google Scholar] [CrossRef]
- Liu, Z.; Liang, J.; Zheng, S.; Zhang, J.; Wu, J.; Cheng, F.; Wang, X. Enriching glucoraphanin in Brassica rapa through replacement of BrAOP2. 2/BrAOP2. 3 with non-functional genes. Front. Plant Sci. 2017, 8, 1329. [Google Scholar] [CrossRef] [Green Version]
- Petersen, A.; Wang, C.; Crocoll, C.; Halkier, B.A. Biotechnological approaches in glucosinolate production. J. Integr. Plant Biol. 2018, 60, 1231–1248. [Google Scholar] [CrossRef]
- Sønderby, I.E.; Burow, M.; Rowe, H.C.; Kliebenstein, D.J.; Halkier, B.A. A complex interplay of three R2R3 MYB transcription factors determines the profile of aliphatic glucosinolates in Arabidopsis. Plant Physiol. 2010, 153, 348–363. [Google Scholar] [CrossRef] [Green Version]
- Seo, M.; Kim, J.S. Understanding of MYB transcription factors involved in glucosinolate biosynthesis in Brassicaceae. Moleules 2017, 9, 1549. [Google Scholar]
- Edwards, D.; Batley, J. Plant genome sequencing: Applications for crop improvement. Plant Biotechnol. J. 2010, 8, 2–9. [Google Scholar] [CrossRef]
- Yu, X.; Wang, H.; Zhong, W.; Bai, J.; Liu, P.; He, Y. QTL mapping of leafy heads by genome resequencing in the RIL population of Brassica rapa. PLoS ONE 2013, 8, e76059. [Google Scholar] [CrossRef] [PubMed] [Green Version]
- Cheng, F.; Sun, R.; Hou, X.; Zheng, H.; Zhang, F.; Zhang, Y.; Liu, B.; Liang, J.; Zhuang, M.; Liu, Y.; et al. Subgenome parallel selection is associated with morphotype diversification and convergent crop domestication in Brassica rapa and Brassica oleracea. Nat. Genet. 2016, 48, 1218–1224. [Google Scholar] [CrossRef]
- Lu, K.; Wei, L.; Li, X.; Wang, Y.; Wu, J.; Liu, M.; Zhang, C.; Chen, Z.; Xiao, Z.; Jian, H.; et al. Whole-genome resequencing reveals Brassica napus origin and genetic loci involved in its improvement. Nat. Commun. 2019, 10, 1–12. [Google Scholar] [CrossRef] [PubMed] [Green Version]
- Hatakeyama, K.; Suwabe, K.; Tomita, R.N.; Kato, T.; Nunome, T.; Fukuoka, H.; Matsumoto, S. Identification and characterization of Crr1a, a gene for resistance to clubroot disease (Plasmodiophora brassicae Woronin) in Brassica rapa L. PLoS ONE 2013, 8, e54745. [Google Scholar]
- Tollenaere, R.; Hayward, A.; Dalton-Morgan, J.; Campbell, E.; Lee, J.R.M.; Lorenc, M.T.; Manoli, S.; Manoli, S.; Raman, R.; Raman, H.; et al. Identification and characterization of candidate Rlm4 blackleg resistance genes in Brassica napus using nextgeneration sequencing. Plant Biotechnol. J. 2012, 10, 709–715. [Google Scholar] [CrossRef] [PubMed] [Green Version]
- Afrin, K.S.; Rahim, M.A.; Park, J.I.; Natarajan, S.; Kim, H.T.; Nou, I.S. Identification of NBS-encoding genes linked to black rot resistance in cabbage (Brassica oleracea var. capitata). Mol. Biol. Rep. 2018, 45, 773–785. [Google Scholar] [CrossRef]
- Xiao, D.; Zhao, J.J.; Hou, X.L.; Basnet, R.K.; Carpio, D.P.D.; Zhang, N.W.; Bucher, J.; Lin, K.; Cheng, F.; Wang, X.W.; et al. The Brassica rapa FLC homologue FLC2 is a key regulator of flowering time, identified through transcriptional coexpression networks. J. Exp. Bot. 2013, 64, 4503–4516. [Google Scholar] [CrossRef] [Green Version]
- Seo, M.S.; Jin, M.; Shon, S.H.; Kim, J.S. Expression profiles of BrMYB transcription factors related to glucosinolate biosynthesis and stress response in eight subspecies of Brassica rapa. FEBBS Open Bio 2017, 7, 1646–1659. [Google Scholar] [CrossRef]
- Zhao, J.; Wang, X.; Deng, B.; Lou, P.; Wu, J.; Sun, R.; Xu, Z.; Vromans, J.; Koornneef, M.; Bonnema, G. Genetic relationships within Brassica rapa as inferred from AFLP fingerprints. Theor. Appl. Genet. 2005, 110, 1301–13041. [Google Scholar] [CrossRef]
- Seo, M.S.; Sohn, S.H.; Park, B.S.; Ko, H.C.; Ji, M.A. Efficiency of microspore embryogenesis in Brassica rapa using different genotypes and culture conditions. J. Plant Biotechnol. 2014, 41, 116–122. [Google Scholar] [CrossRef]
- Seo, M.S.; Won, S.Y.; Kang, S.H.; Kim, J. S Analysis of flavonoids in double haploid population derived from microspore culture of F1 hybrid of Brassica rapa. J. Plant Biotechnol. 2017, 44, 35–41. [Google Scholar] [CrossRef] [Green Version]
- Zhang, L.; Cai, X.; Wu, J.; Liu, M.; Grob, S.; Cheng, F.; Wang, F. Improved Brassica rapa reference genome by single-molecule sequencing and chromosome conformation capture technologies. Hortic. Res. 2018, 5, 1–11. [Google Scholar] [CrossRef] [PubMed] [Green Version]
- Augustine, R.; Majee, M.; Gershenzon, J.; Bisht, N.C. Four genes encoding MYB28, a major transcriptional regulator of the aliphatic glucosinolate pathway, are differentially expressed in the allopolyploid Brassica juncea. J. Exp. Bot. 2013, 64, 4907–4921. [Google Scholar] [CrossRef]
- Liu, M.; Zhang, L.; Ser, S.L.; Cumming, J.R.; Ku, K.M. Comparative phytonutrient analysis of broccoli by-products: The potentials for broccoli by-product utilization. Molecules 2018, 23, 900. [Google Scholar] [CrossRef] [Green Version]
- Kang, J.N.; Won, S.Y.; Seo, M.S.; Lee, J.Y.; Lee, S.M.; Kwon, S.J.; Kim, J.S. Induction of glucoraphasatin biosynthesis genes by MYB29 in Radish (Raphanus sativus L.) roots. Int. J. Mol. Sci. 2020, 21, 5721. [Google Scholar] [CrossRef]
- Ku, K.M.; Jeffery, E.H.; Jubik, J.A.; Kushad, M.M. Correlation of quinone reductase activity and allyl isothiocyanate formation among different genotypes and grades of horseradish roots. J. Agric. Food Chem. 2015, 63, 2947–2955. [Google Scholar] [CrossRef]
- Kim, M.J.; Chiu, Y.C.; Kim, N.K.; Park, H.M.; Lee, C.H.; Juvik, J.A.; Ku, K.M. Cultivar-specific changes in primary and secondary metabolites in pak choi (Brassica rapa, chinensis group) by methyl jasmonate. Int. J. Mol. Sci. 2017, 18, 1004. [Google Scholar] [CrossRef] [Green Version]
- Paux, E.; Sourdille, P.; Mackay, I.; Feuillet, C. Sequence-based marker development in wheat: Advances and applications to breeding. Biotechnol. Adv. 2012, 30, 1071–1088. [Google Scholar] [CrossRef]
- Rai, A.; Yamazaki, M.; Saito, K. A new era in plant functional genomics. Curr. Opin. Syst. Biol. 2019, 15, 58–67. [Google Scholar] [CrossRef] [Green Version]
- Frerigmann, H. Glucosinolate Regulation in a Complex Relationship—MYC and MYB—No One Can Act Without Each Other. In Glucosinolates; Kopriva, S., Ed.; Academic Press: London, UK, 2016; Volume 80, pp. 57–97. [Google Scholar]
- Sønderby, I.E.; Hansen, B.G.; Bjarnholt, N.; Ticconi, C.; Halkier, B.A.; Kliebenstein, D.J. A systems biology approach identifies a R2R3 MYB gene subfamily with distinct and overlapping functions in regulation of aliphatic glucosinolates. PLoS ONE 2007, 2, e1322. [Google Scholar] [CrossRef]
- Frerigmann, H.; Gigolashvili, T. MYB34, MYB51, and MYB122 distinctly regulate indolic glucosinolate biosynthesis in Arabidopsis thaliana. Mol. Plant 2014, 7, 814–828. [Google Scholar] [CrossRef] [Green Version]
- Zuluaga, D.L.; Graham, N.S.; Klinder, A.; Kloeke, A.E.E.O.; Marcotrigiano, A.R.; Wagstaff, C.; Gabriella, S.; Aarts, M.G.M. Overexpression of the MYB29 transcription factor affects aliphatic glucosinolate synthesis in Brassica oleracea. Plant Mol. Biol. 2019, 101, 65–79. [Google Scholar] [CrossRef] [Green Version]
- Gigolashvili, T.; Yatusevich, R.; Rollwitz, I.; Humphry, M.; Gershenzon, J.; Flügge, U.I. The plastidic bile acid transporter 5 is required for the biosynthesis of methionine-derived glucosinolates in Arabidopsis thaliana. Plant Cell 2009, 21, 1813–1829. [Google Scholar] [CrossRef] [Green Version]
- Textor, S.; de Kraker, J.W.; Hause, B.; Gershenzon, J.; Tokuhisa, J.G. MAM3 catalyzes the formation of all aliphatic glucosinolate chain lengths in Arabidopsis. Plant Physiol. 2007, 144, 60–71. [Google Scholar] [CrossRef] [Green Version]
- Chen, S.; Glawischnig, E.; Jørgensen, K.; Naur, P.; Jørgensen, B.; Olsen, C.E.; Halkier, B.A. CYP79F1 and CYP79F2 have distinct functions in the biosynthesis of aliphatic glucosinolates in Arabidopsis. Plant J. 2003, 33, 923–937. [Google Scholar] [CrossRef] [Green Version]
- Wittstock, U.; Halkier, B.A. Cytochrome P450 CYP79A2 from Arabidopsis thaliana L. catalyzes the conversion of L-phenylalanine to phenylacetaldoxime in the biosynthesis of benzylglucosinolate. J. Biol. Chem. 2000, 275, 14659–14666. [Google Scholar] [CrossRef] [Green Version]
- Naur, P.; Petersen, B.L.; Mikkelsen, M.D.; Bak, S.; Rasmussen, H.; Olsen, C.E.; Halkier, B.A. CYP83A1 and CYP83B1, two nonredundant cytochrome P450 enzymes metabolizing oximes in the biosynthesis of glucosinolates in Arabidopsis. Plant Physiol. 2003, 133, 63–72. [Google Scholar] [CrossRef] [PubMed] [Green Version]
- Geu-Flores, F.; Nielsen, M.T.; Nafisi, M.; Møldrup, M.E.; Olsen, C.E.; Motawia, M.S.; Halkier, B.A. Glucosinolate engineering identifies a γ-glutamyl peptidase. Nat. Chem. Biol. 2009, 5, 575–577. [Google Scholar] [CrossRef]
- Mikkelsen, M.D.; Naur, P.; Halkier, B.A. Arabidopsis mutants in the C–S lyase of glucosinolate biosynthesis establish a critical role for indole-3-acetaldoxime in auxin homeostasis. Plant J. 2004, 37, 770–777. [Google Scholar] [CrossRef] [PubMed]
- Grubb, C.D.; Abel, S. Glucosinolate metabolism and its control. Trends Plant Sci. 2006, 11, 89–100. [Google Scholar] [CrossRef] [PubMed]
- Mugford, S.G.; Yoshimoto, N.; Reichelt, M.; Wirtz, M.; Hill, L.; Mugford, S.T.; Gigolashvili, T. Disruption of adenosine-5′-phosphosulfate kinase in Arabidopsis reduces levels of sulfated secondary metabolites. Plant Cell 2009, 21, 910–927. [Google Scholar] [CrossRef] [Green Version]
- Piotrowski, M.; Schemenewitz, A.; Lopukhina, A.; Müller, A.; Janowitz, T.; Weiler, E.W.; Oecking, C. Desulfoglucosinolate sulfotransferases from Arabidopsis thaliana catalyze the final step in the biosynthesis of the glucosinolate core structure. J. Biol. Chem. 2004, 279, 50717–50725. [Google Scholar] [CrossRef] [Green Version]
- Matusheski, N.V.; Swarup, R.; Juvik, J.A.; Mithen, R.; Bennett, M.; Jeffery, E.H. Epithiospecifier protein from broccoli (Brassica oleracea L. ssp. italica) inhibits formation of the anticancer agent sulforaphane. J. Agric. Food Chem. 2006, 54, 2069–2076. [Google Scholar] [CrossRef]
- Kim, J.S.; Chung, T.Y.; King, G.J.; Jin, M.; Yang, T.J.; Jin, Y.M.; Kim, H.I.; Park, B.S. A sequence-tagged linkage map of Brassica rapa. Genetics 2006, 174, 29–39. [Google Scholar] [CrossRef] [Green Version]


| Genotype | Aliphatic | Indolic | Aromatic | ||||||||||
|---|---|---|---|---|---|---|---|---|---|---|---|---|---|
| GRA | GAL | SNG | GNA | GBN | GNL | PRO | GBS | 4-MOGBS | NGBS | GNT | Total μmol g−1 dw | ||
| Chiffu | ND | ND | ND | 0.00 e | 0.00 f | 0.00 c | 0.38 ± 0.00 def | 4.00 ± 0.26 a | 1.09 ± 0.04 a | 3.16 ± 0.52 b | 0.14 ± 0.09 de | 8.77 ± 0.69 ef | |
| LP08(♀) | 0.11 ± 0.05 b | 0.55 ± 0.05 g | 0.17 ± 0.00 a | 43.40 ± 3.63 b | 0.66 ± 0.06 e | 0.00c | 0.71 ± 0.06 cd | 0.40 ± 0.01 d | 0.31 ± 0.04 c | 0.76 ± 0.06 d | 0.47 ± 0.14 bc | 47.55 ± 3.66 bc | |
| LP21(♂) | 0.00b | 0.89 ± 0.10 def | 0.00e | 1.82 ± 0.66 d | 0.00f | 0.27 ± 0.03 a | 0.88 ± 0.09 c | 2.03 ± 0.02 b | 0.63 ± 0.03 b | 3.44 ± 0.24 b | 0.81 ± 0.09 a | 10.76 ± 0.36 e | |
| F1 | 0.10 ± 0.01 b | 0.85 ± 0.12 ef | 0.00e | 1.97 ± 0.16 d | 1.68 ± 0.14 d | 0.34 ± 0.03 a | 3.86 ± 0.29 a | 0.59 ± 0.02 c | 0.64 ± 0.03 b | 4.58 ± 0.16 a | 0.47 ± 0.05 bc | 15.07 ± 0.79 d | |
| High GSL lines | BrYSP_DH005 | 1.23 ± 0.18 a | 3.47 ± 0.18 a | 0.05 ± 0.01 cde | 35.51 ± 2.84 c | 0.63 ± 0.04 e | 0.10 ± 0.04 b | 0.22 ± 0.03 ef | 0.14 ± 0.00 e | 0.06 ± 0.00 f | 2.03 ± 0.20 c | 0.68 ± 0.34 ab | 44.12 ± 2.86 c |
| BrYSP_DH014 | 0.07 ± 0.02 b | 2.16 ± 0.05 b | 0.05 ± 0.01 cde | 45.19 ± 2.69 ab | 7.13 ± 0.62 a | 0.02 ± 0.01 bc | 0.06 ± 0.02 f | 0.11 ± 0.01 e | 0.10 ± 0.01 ef | 0.77 ± 0.04 d | 0.39 ± 0.04 cd | 56.06 ± 3.28 a | |
| BrYSP_DH016 | 0.12 ± 0.07 b | 0.43 ± 0.05 g | 0.11 ± 0.07 b | 44.42 ± 1.34 b | 1.68 ± 0.07 d | ND | 0.57 ± 0.37 cde | 0.20 ± 0.01 e | 0.16 ± 0.01 d | 0.76 ± 0.02 d | 0.24 ± 0.03 cde | 48.69 ± 0.95 b | |
| BrYSP_DH017 | 0.07 ± 0.01 b | 0.62 ± 0.17 fg | 0.08 ± 0.02 bc | 45.66 ± 1.25 ab | 2.70 ± 0.09 c | 0.10 ± 0.11 b | 0.32 ± 0.03 ef | 0.19 ± 0.01 e | 0.19 ± 0.02 d | 0.50 ± 0.02 def | 0.20 ± 0.01 cde | 50.62 ± 1.51 b | |
| BrYSP_DH026 | 0.09 ± 0.02 b | 2.05 ± 0.04 b | 0.07 ± 0.04 bcd | 48.23 ± 1.31 a | 5.39 ± 0.25 b | 0.03 ± 0.02 bc | 0.05 ± 0.00 f | 0.08 ± 0.00 e | 0.11 ± 0.00 e | 0.57 ± 0.05 de | 0.39 ± 0.03 cd | 57.04 ± 1.54 a | |
| Low GSL lines | BrYSP_DH009 | 0.04 ± 0.03 b | 1.16 ± 0.10 d | 0.00 ± 0.00 e | 0.25 ± 0.05 d | 0.26 ± 0.07 ef | 0.09 ± 0.03 b | 0.82 ± 0.26 c | 0.12 ± 0.02 e | 0.10 ± 0.01 ef | 0.33 ± 0.03 ef | 0.08 ± 0.03 e | 3.26 ± 0.62 g |
| BrYSP_DH059 | 0.06 ± 0.01 b | 1.44 ± 0.19 c | 0.01 ± 0.01 de | 0.32 ± 0.06 d | 0.52 ± 0.08 ef | 0.30 ± 0.03 a | 1.97 ± 0.23 b | 0.10 ± 0.02 e | 0.07 ± 0.01 ef | 0.38 ± 0.03 def | 0.15 ± 0.02 de | 5.31 ± 0.67 fg | |
| BrYSP_DH061 | ND | 1.13 ± 0.26 de | 0.01 ± 0.01 de | 2.35 ± 0.81 d | 1.70 ± 0.64 d | 0.00 ± 0.00 c | 0.05 ± 0.01 f | 0.05 ± 0.01 e | 0.01 ± 0.00 g | 0.11 ± 0.02 f | 0.23 ± 0.07 cde | 5.63 ± 1.76 fg | |
| ANOVA | Sum of square | 3.852 | 29.573 | 0.091 | 16,645 | 165.68 | 0.525 | 39.6 | 46.36 | 3.601 | 72.88 | 1.669 | 16,984 |
| Mean sum of square | 0.350 | 2.688 | 0.008 | 1513.2 | 15.061 | 0.047 | 3.6 | 4.215 | 0.327 | 6.626 | 0.152 | 1544 | |
| F value | 68.22 | 103.25 | 9.09 | 348.84 | 132.28 | 22.81 | 80.11 | 471.38 | 494.16 | 129.53 | 7.5 | 286.69 | |
| p | **** | **** | **** | **** | **** | **** | **** | **** | **** | **** | **** | **** | |
| Accessions | BITC | 4-PEITC | 2-PEITC | SFN | Total | Fold |
|---|---|---|---|---|---|---|
| BrYSP_DH005 | 601.0 ± 16.8 | 47.7 ± 1.3 | 40.8 ± 0.8 | 20.24 ± 1.33 | 709.8 ± 16.7 | 5.1 |
| BrYSP_DH014 | 778.8 ± 32.9 | 64.5 ± 3.9 | 25.0 ± 1.2 | 2.03 ± 0.15 | 870.3 ± 37.6 | 6.3 |
| BrYSP_DH016 | 425.1 ± 10.0 | 100.1 ± 2.5 | 18.5 ± 0.7 | 2.90 ± 0.13 | 546.6 ± 12.5 | 3.9 |
| BrYSP_DH017 | 281.7 ± 15.3 | 120.7 ± 5.3 | 12.7 ± 0.8 | 2.35 ± 0.21 | 417.5 ± 21.5 | 3.0 |
| BrYSP_DH026 | 653.0 ± 20.8 | 94.0 ± 2.3 | 34.5 ± 0.5 | 2.39 ± 0.15 | 783.9 ± 23.5 | 5.6 |
| pak choi© | 108.9 ± 2.7 | 21.6 ± 0.6 | 8.1 ± 0.2 | 0.57 ± 0.04 | 139.2 ± 3.6 | Control |
Publisher’s Note: MDPI stays neutral with regard to jurisdictional claims in published maps and institutional affiliations. |
© 2021 by the authors. Licensee MDPI, Basel, Switzerland. This article is an open access article distributed under the terms and conditions of the Creative Commons Attribution (CC BY) license (https://creativecommons.org/licenses/by/4.0/).
Share and Cite
Soundararajan, P.; Park, S.-G.; Won, S.Y.; Moon, M.-S.; Park, H.W.; Ku, K.-M.; Kim, J.S. Influence of Genotype on High Glucosinolate Synthesis Lines of Brassica rapa. Int. J. Mol. Sci. 2021, 22, 7301. https://doi.org/10.3390/ijms22147301
Soundararajan P, Park S-G, Won SY, Moon M-S, Park HW, Ku K-M, Kim JS. Influence of Genotype on High Glucosinolate Synthesis Lines of Brassica rapa. International Journal of Molecular Sciences. 2021; 22(14):7301. https://doi.org/10.3390/ijms22147301
Chicago/Turabian StyleSoundararajan, Prabhakaran, Sin-Gi Park, So Youn Won, Mi-Sun Moon, Hyun Woo Park, Kang-Mo Ku, and Jung Sun Kim. 2021. "Influence of Genotype on High Glucosinolate Synthesis Lines of Brassica rapa" International Journal of Molecular Sciences 22, no. 14: 7301. https://doi.org/10.3390/ijms22147301
APA StyleSoundararajan, P., Park, S.-G., Won, S. Y., Moon, M.-S., Park, H. W., Ku, K.-M., & Kim, J. S. (2021). Influence of Genotype on High Glucosinolate Synthesis Lines of Brassica rapa. International Journal of Molecular Sciences, 22(14), 7301. https://doi.org/10.3390/ijms22147301