Article

LncRSPH9-4 Facilitates Meningitic Escherichia coli-Caused Blood–Brain Barrier Disruption via miR-17-5p/MMP3 Axis

1
State Key Laboratory of Agricultural Microbiology, College of Veterinary Medicine, Huazhong Agricultural University, Wuhan 430070, China
2
Key Laboratory of Preventive Veterinary Medicine in Hubei Province, The Cooperative Innovation Center for Sustainable Pig Production, Wuhan 430070, China
3
Key Laboratory of Development of Veterinary Diagnostic Products, Ministry of Agriculture of the People’s Republic of China, Wuhan 430070, China
4
International Research Center for Animal Disease, Ministry of Science and Technology of the People’s Republic of China, Wuhan 430070, China
*
Author to whom correspondence should be addressed.
Int. J. Mol. Sci. 2021, 22(12), 6343; https://doi.org/10.3390/ijms22126343
Submission received: 1 June 2021 / Revised: 9 June 2021 / Accepted: 11 June 2021 / Published: 14 June 2021
(This article belongs to the Section Molecular Genetics and Genomics)

Abstract

:
Brain microvascular endothelial cells (BMECs) constitute the structural and functional basis for the blood–brain barrier (BBB) and play essential roles in bacterial meningitis. Although the BBB integrity regulation has been under extensive investigation, there is little knowledge regarding the roles of long non-coding RNAs (lncRNAs) in this event. The present study aimed to investigate the roles of one potential lncRNA, lncRSPH9-4, in meningitic E. coli infection of BMECs. LncRSPH9-4 was cytoplasm located and significantly up-regulated in meningitic E. coli-infected hBMECs. Electrical cell-substrate impedance sensing (ECIS) measurement and Western blot assay demonstrated lncRSPH9-4 overexpression in hBMECs mediated the BBB integrity disruption. By RNA-sequencing analysis, 639 mRNAs and 299 miRNAs were significantly differentiated in response to lncRSPH9-4 overexpression. We further found lncRSPH9-4 regulated the permeability in hBMECs by competitively sponging miR-17-5p, thereby increasing MMP3 expression, which targeted the intercellular tight junctions. Here we reported the infection-induced lncRSPH9-4 aggravated disruption of the tight junctions in hBMECs, probably through the miR-17-5p/MMP3 axis. This finding provides new insights into the function of lncRNAs in BBB integrity during meningitic E. coli infection and provides the novel nucleic acid targets for future treatment of bacterial meningitis.

1. Introduction

Bacterial meningitis is the most important life-threatening infection of the central nervous system (CNS) with high morbidity and mortality and Escherichia coli is the most common gram-negative pathogenic bacterium causing this outcome [1]. Most bacterial meningitis develops from bacterial penetration of the BBB [2]. Vascular endothelium constitutes the structural and functional basis of the BBB and plays an important role in maintaining the integrity of the BBB, as well as CNS homeostasis [3]. BMECs are characterized by the presence of tight junction proteins (TJs), including Claudins, Occludin and zonula-occludens [4,5]. BMECs dysfunction is often caused by the decrease or re-distribution of these TJs, which lead to disruption of the BBB [6]. Thus, protecting and maintaining the BBB function is of positive significance in alleviating brain damage after the CNS-invading pathogens infection.
LncRNAs are considered regulators of diverse biological processes, including imprinting control, cell differentiation and development [7,8,9], as well as many pathological processes, such as cancer, chronic inflammation and infectious diseases [10,11,12]. Aberrant expression and mutations of lncRNAs uncovered in various brain dysfunctions have led researchers to investigate the potential roles of lncRNAs in brain physiology and pathology [13]. For example, lncRNAs MALAT1 GAS5 and NEAT1 are widely recognized to be implicated in cancer, vascular diseases and neurological disorders [14,15,16,17]. MALAT1 was reported to promote the BMEC autophagy; NEAT1 was able to activate the NF-κB signaling pathway in nerve cells [17,18]. Regarding lncRNAs, the competing endogenous RNA (ceRNA) working mechanism has been largely evidenced, in which lncRNAs act as the ceRNA to interact competitively with miRNAs and regulate the expression of the target proteins [19]. Our previous lncRNA transcriptomics sequencing identified a batch of significantly different lncRNAs in hBMECs upon meningitic E. coli infection [20] and we further noticed one novel lncRNA, lncRSPH9-4, that was significantly up-regulated along with the infection. We focused on this lncRNA because we found that overexpressing lncRSPH9-4 in hBMECs would cause a decrease of the impedance values. However, the specific working mechanism of this lncRNA in the pathogenic process is unclear.
A variety of miRNAs have been reported to regulate the integrity of the BBB, such as miR-18a, miR-338-3p and miR-182 [13,21,22]. In the current study, we also focused on a miRNA, miR-17-5p, which is a member of the miRNA-17-92 cluster and has been reported in several cancers and CNS dysfunctions, such as ischemia-reperfusion injury and neurodegenerative disease [23,24]. More importantly, we found that lncRSPH9-4 can specifically sponge miR-17-5p by ceRNA analysis. Whether this miRNA was rightly involved in lncRSPH9-4 regulation of the hBMECs barrier function will be elucidated in this work.

2. Results

2.1. LncRSPH9-4 Was Significantly Up-Regulated and Cytoplasmically Distributed in Meningitic E. coli-Challenged hBMECs

Based on our previous study, a total of 895 lncRNAs in hBMECs exhibited significant differences in response to meningitic E. coli infection [20], among which one lncRNA, lncRSPH9-4, was included and focused on in the current study. LncRSPH9-4, a sense overlapping lncRNA, was located on chromosome 6 of the genome (Figure 1A). It was significantly and time-dependently up-regulated in hBMECs, when challenged with meningitic E. coli (Figure 1B).
Next, three tools, including Coding Potential Caculator (CPC), Coding-Potential Assessment Tool (CAPT), ORF Length and GC content (LGC), were used to predict the protein-coding potential of lncRSPH9-4. The prediction results supported that lncRSPH9-4 has no protein-coding potential, similar to the potential coding analyses of the known lncRNAs HULC and MEG3, but opposite to the typical protein-coding mRNAs like PCNA, MAPK1 and ACTN4 (Figure 1C). The subcellular localization of this lncRNA in hBMECs was next determined by both nucleocytoplasmic separation assay and fluorescence in situ hybridization (FISH). As shown in Figure 1D, lncRSPH9-4 could be detected in both nuclear and cytoplasmic compartments but was highly enriched in the cytoplasm, which was similar to that of the 18S rRNA (Figure 1D). FISH results also supported the cytoplasmic distribution of this lncRSPH9-4 in hBMECs (Figure 1E). Together, these data show that lncRSPH9-4 is a cytoplasm-located lncRNA in hBMECs and is significantly up-regulated in response to meningitic E. coli infection.

2.2. LncRSPH9-4 Negatively Affected the Barrier Permeability of hBMECs

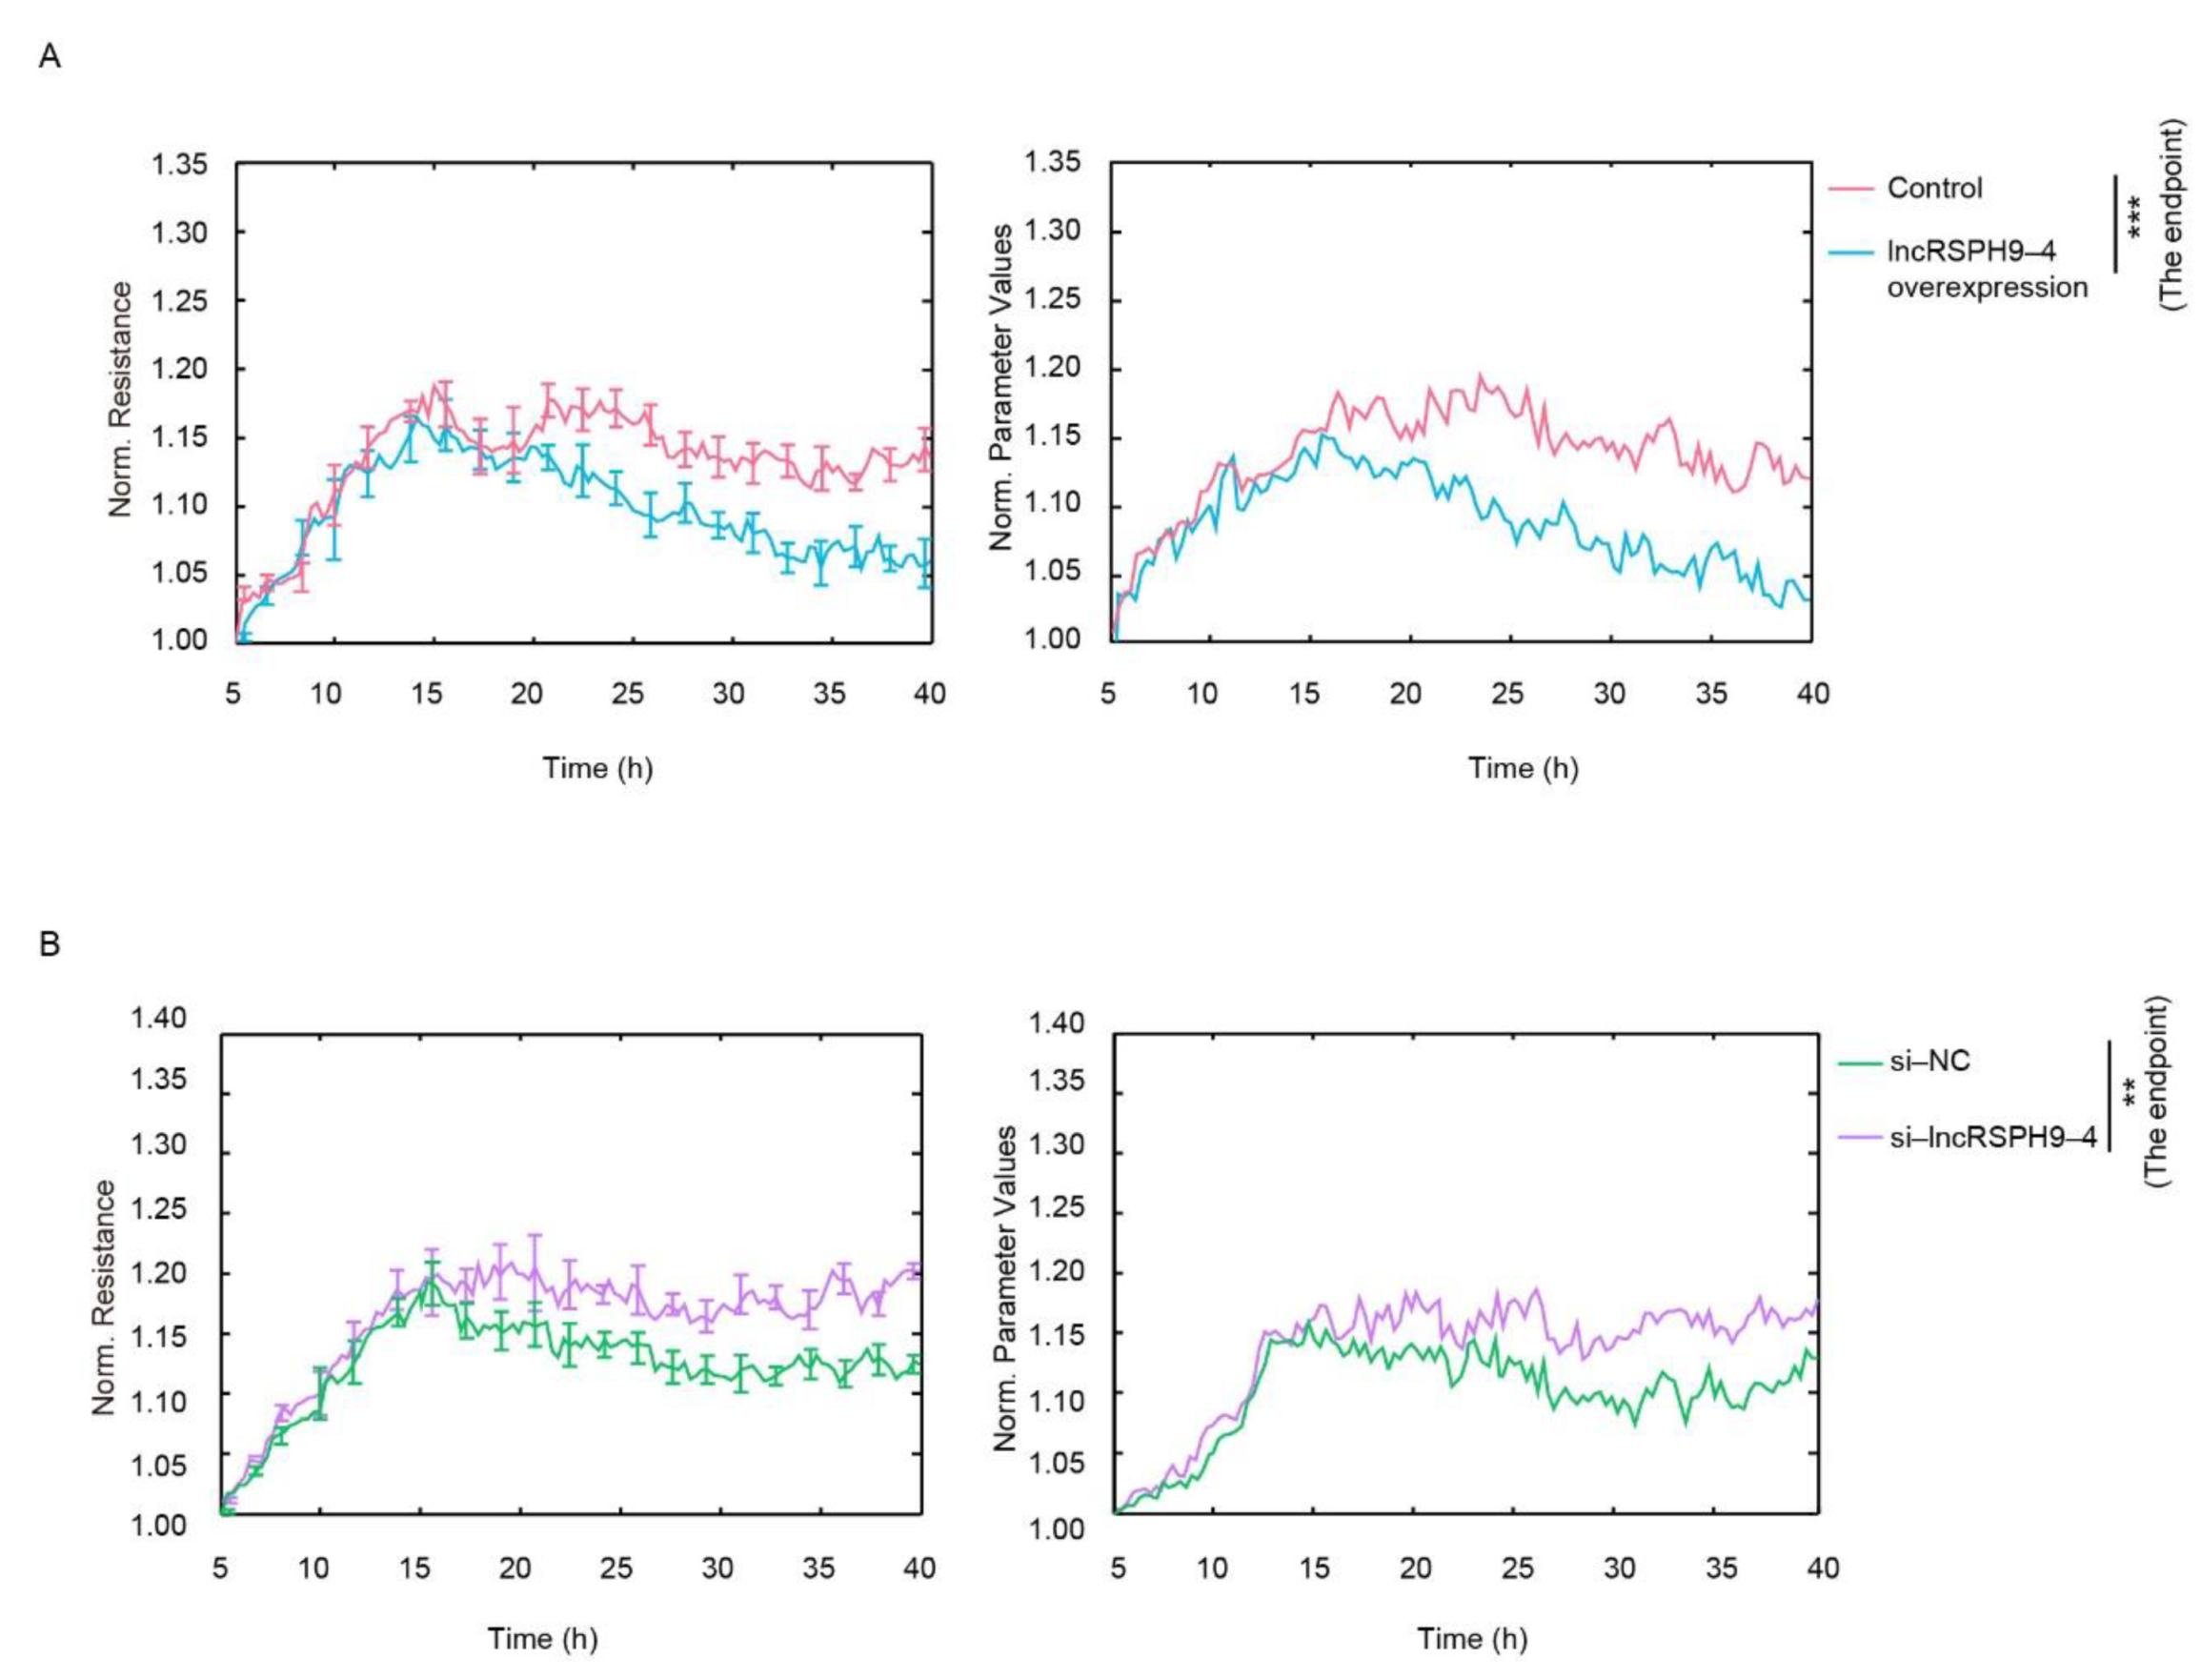
To study the function of lncRSPH9-4 in the infected hBMECs, we first evaluated the possible influence of lncRSPH9-4 on growth characters of monolayer hBMECs. By application of an ECIS system that tests impedance values, an important indicator of the monolayer permeability, we observed that overexpression of lncRSPH9-4 significantly reduced the impedance values of the hBMECs monolayer after 20 h of growth (Figure 2A). In contrast, knocking-down of lncRSPH9-4 by siRNA significantly enhanced the resistance of hBMECs (Figure 2B). These data suggested that lncRSPH9-4 negatively affected the barrier resistance of the hBMECs monolayer.

2.3. Differential mRNAs Transcription in hBMECs with LncRSPH9-4 Overexpression

We next seek to explore the possible mechanism of lncRSPH9-4 regulating cell barrier resistance. LncRSPH9-4 was inserted into pcDNA3.1(+) to obtain the overexpression constructs (Figure S1A) and the overexpression efficiency was further verified by qPCR (Figure S1B). The total RNAs in hBMECs with lnsRSPH9-4 overexpression were extracted and subjected to mRNA and miRNA sequencing with three replicates.
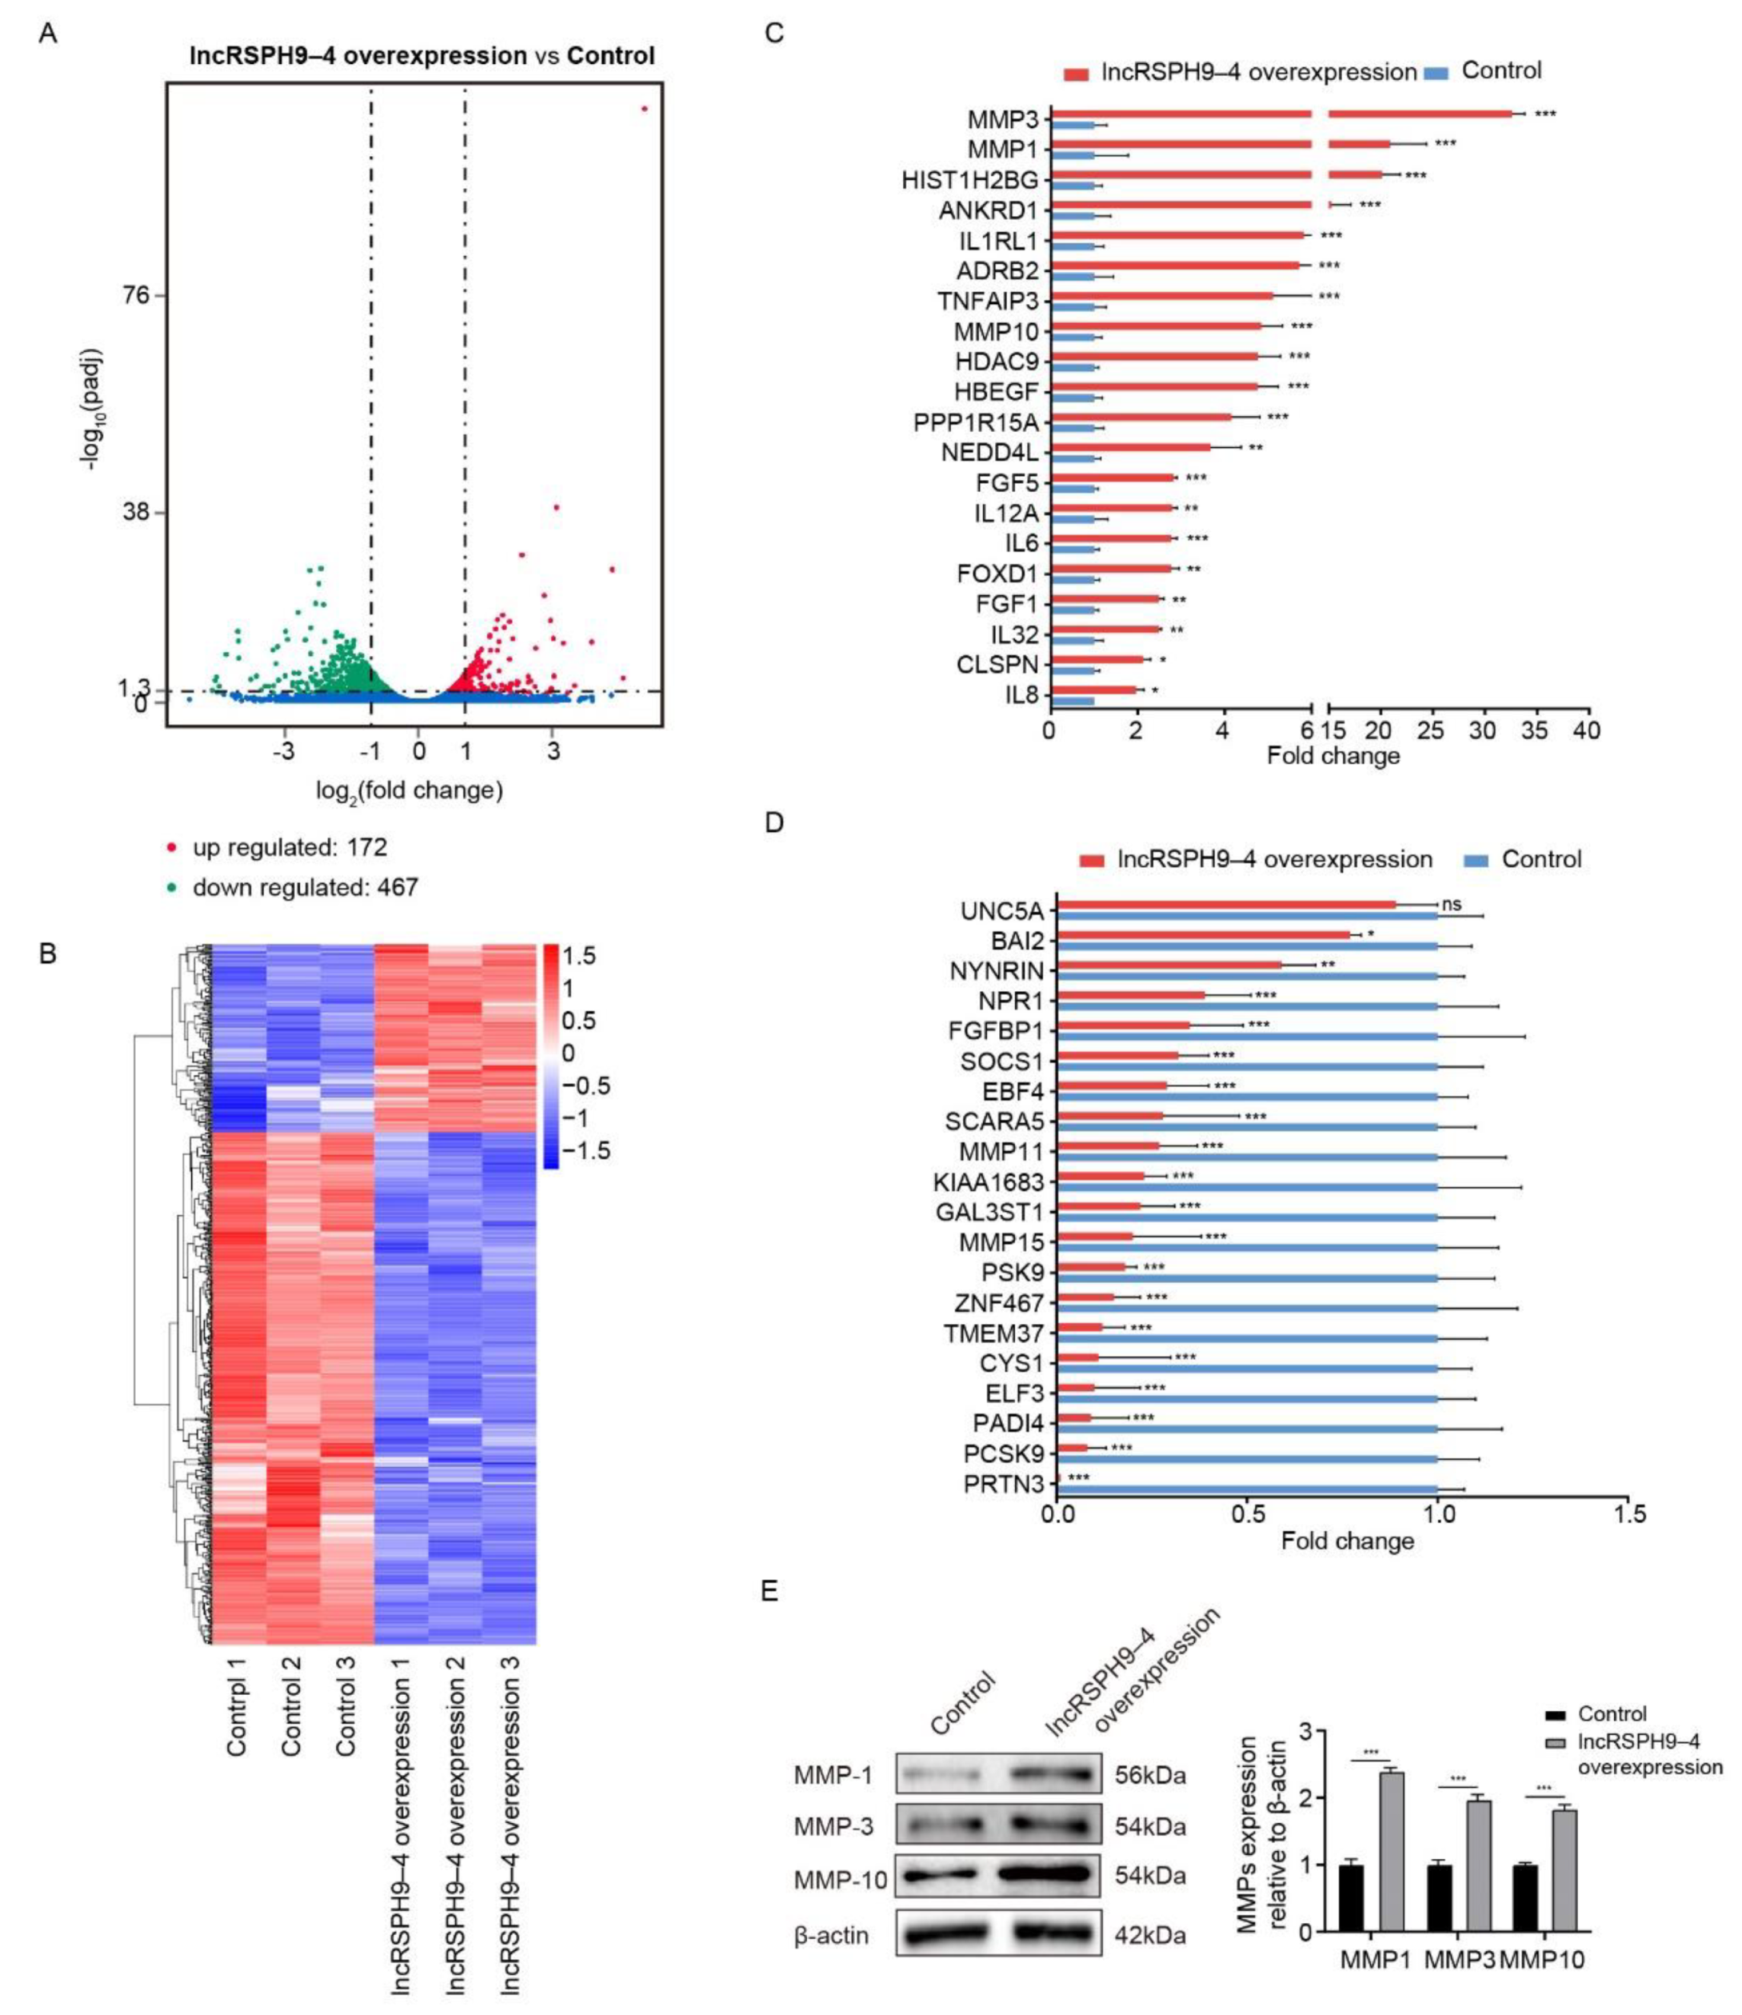
As the volcano map (Figure 3A) and heat map (Figure 3B) show, lncRSPH9-4 overexpression resulted in a total of 639 mRNAs that significantly changed (increase by ≥2-fold, or decrease to ≤0.5-fold, at p ≤ 0.05), including 172 up-regulated mRNAs and 467 down-regulated mRNAs. Forty differentially altered mRNAs with the most significant changes were chosen to verify their expression levels by qPCR. The results demonstrated that these up-regulated or down-regulated mRNAs exhibited similar alteration trends as obtained from sequencing data (Figure 3C,D). Noticeably, as shown in Figure 3C, the MMPs family exhibited significant up-regulation after lncRSPH9-4 overexpression. Therefore, the expression of MMP3, MMP1 and MMP10 were verified by Western blot analysis (Figure 3E). Meanwhile, the functional enrichment analysis revealed that the lncRSPH9-4 overexpression-enriched differential mRNAs were involved in several canonical pathways, such as the TNF signaling pathway, PPAR signaling pathway, MAPK signaling pathway, focal adhesion and ECM-receptor interaction, etc., which have previously been reported to regulate the barrier function of endothelial cells (Figure S2).

2.4. Altered miRNAs Profiles in hBMECs with LncRSPH9-4 Overexpression

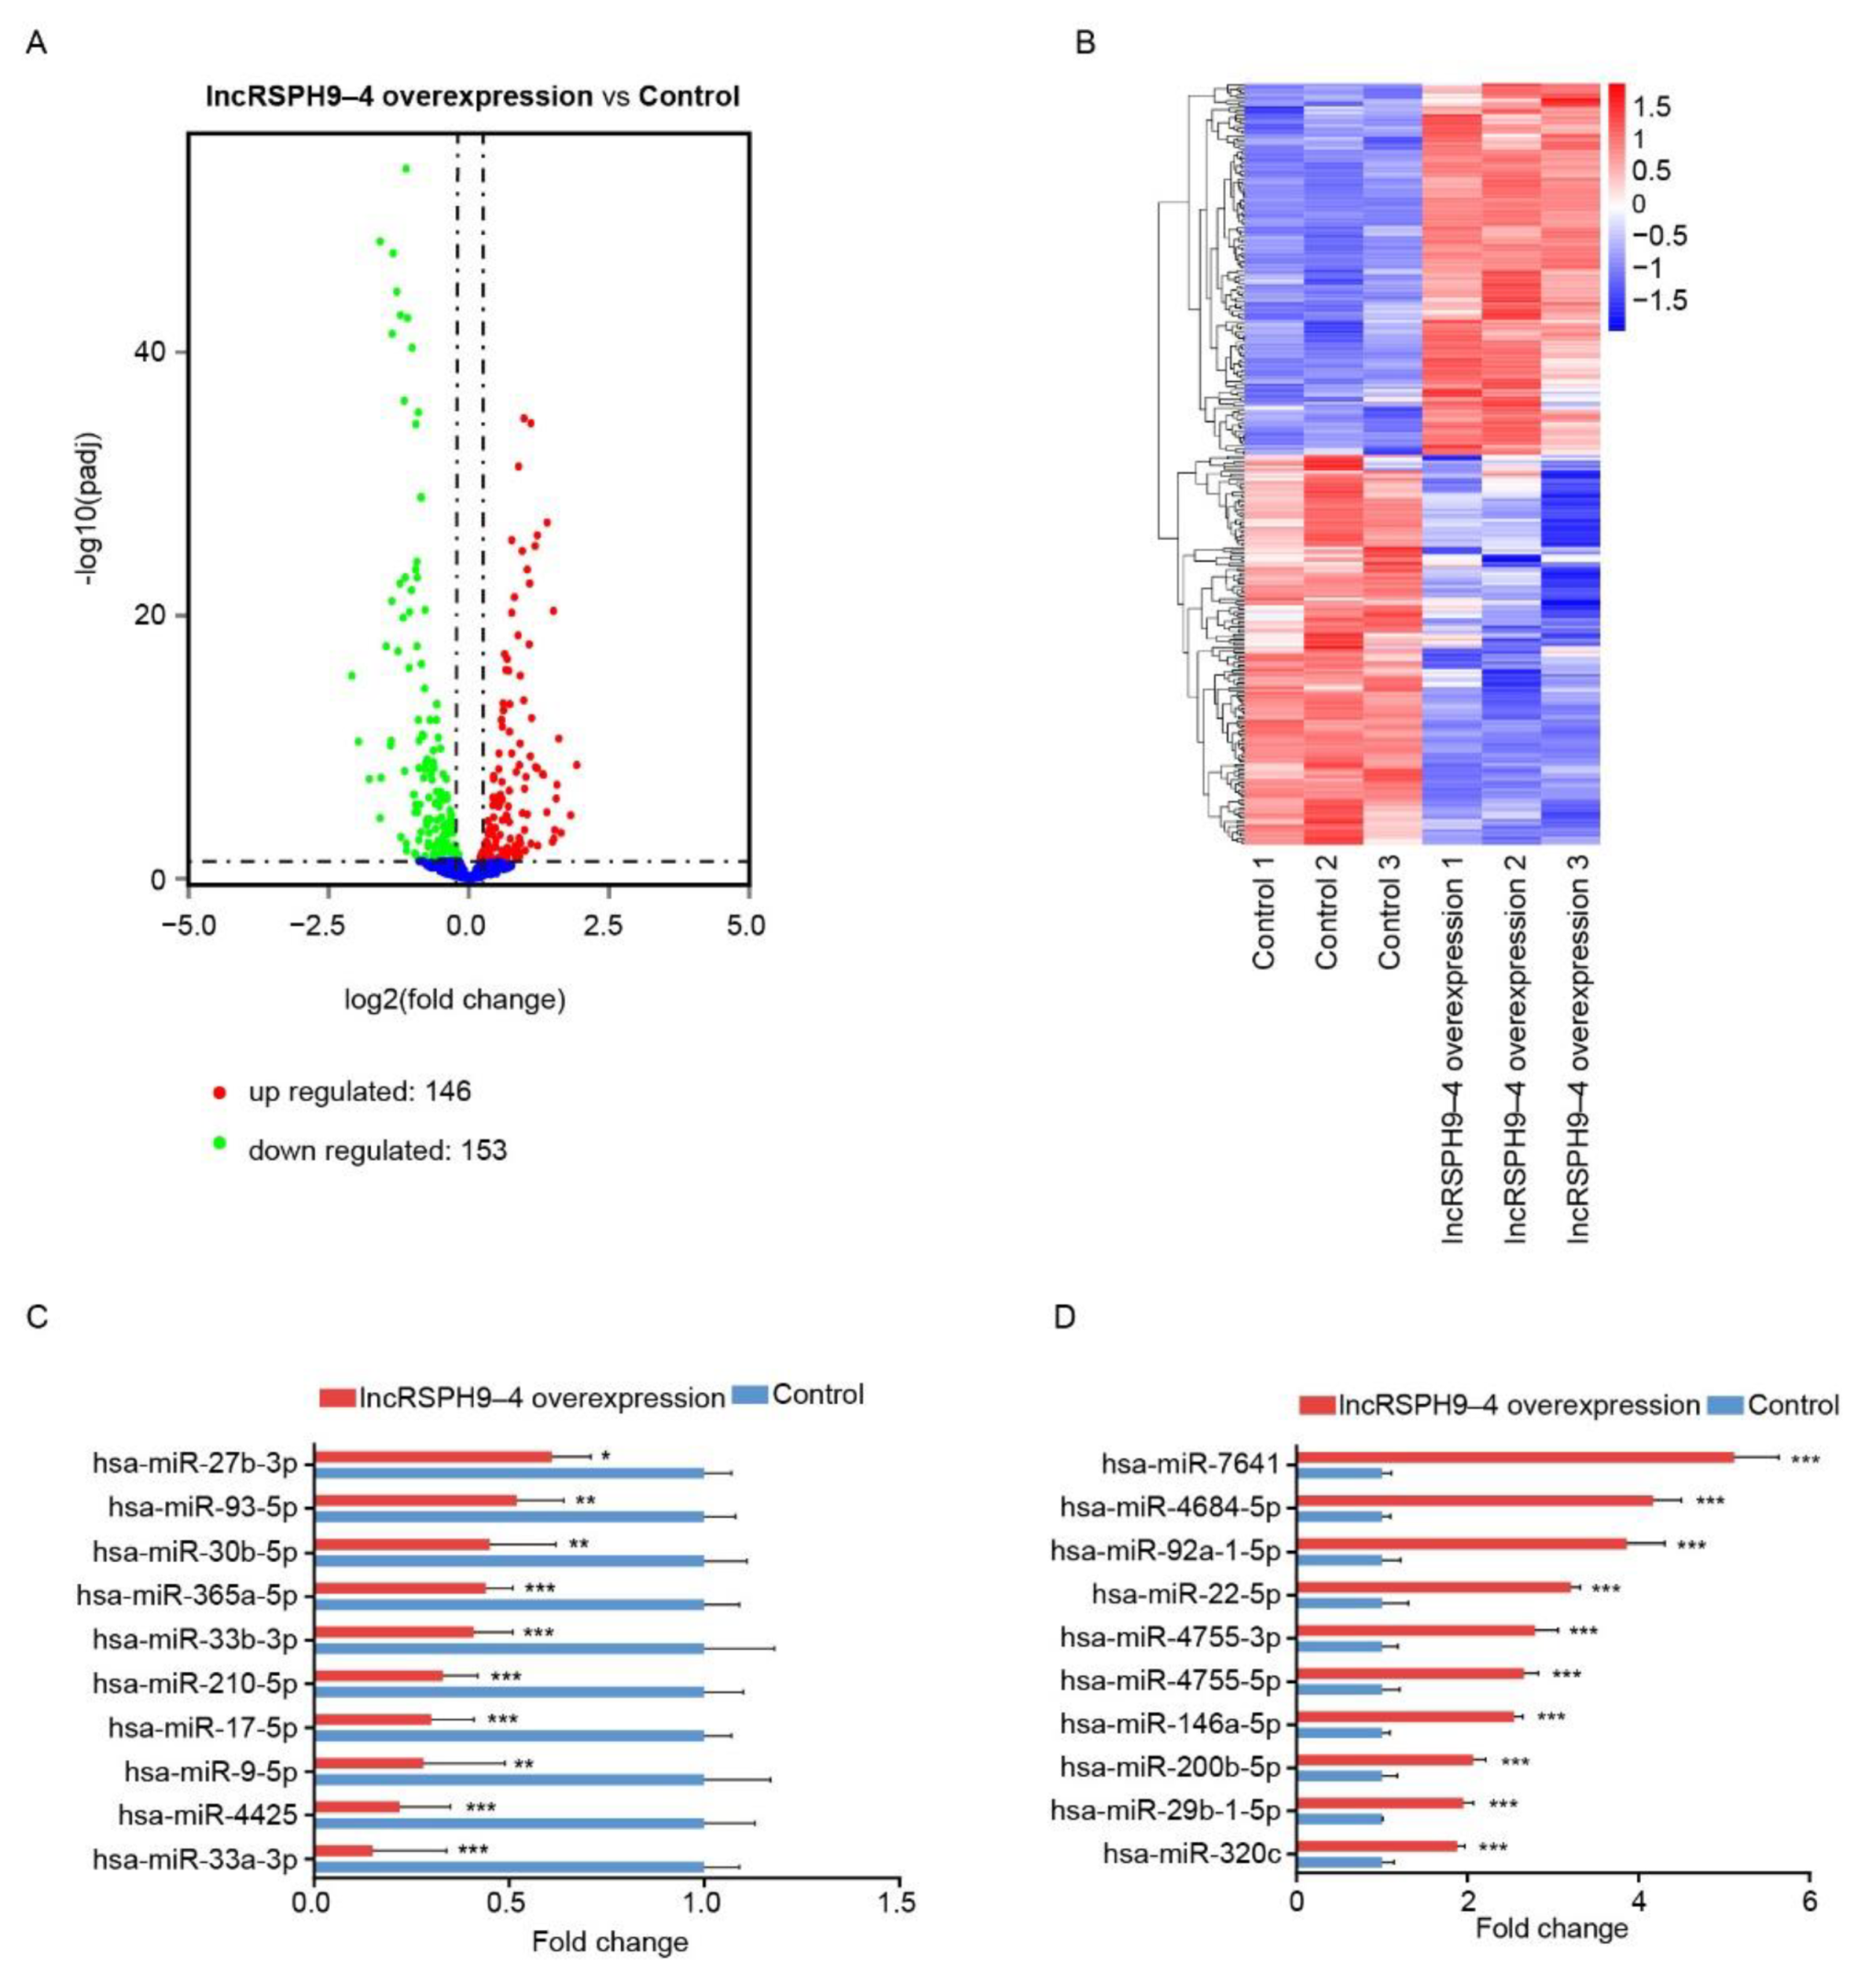
The miRNAs profiles in response to lncRSPH9-4 overexpression were also characterized. As shown, 153 miRNAs (decrease to <0.87-fold, at p ≤ 0.05) were significantly down-regulated and 146 miRNAs were significantly up-regulated (increase by >1.13-fold, at p ≤ 0.05) (Figure 4A,B). Among these, twenty miRNAs with the most significant changes were selected and verified by qPCR. They all showed the same alteration trends after lncRSPH9-4 overexpression as that in miRNA sequencing data (Figure 4C,D). Similarly, functional enrichment analyses supported that they were widely involved in multiple regulative pathways and diverse processes, such as the VEGF signaling pathway, NOD-like receptor signaling pathway, MAPK signaling pathway, etc. (Figure S3). Noticeably, some pathways, such as the VEGF signaling and MAPK signaling ones have been previously evidenced to be associated with hBMECs permeability regulation. Combining both lncRNAs and miRNAs analyses, we thus presumed that lncRSPH9-4 might work as the potential ceRNA to affect the barrier resistance of hBMECs.

2.5. The Competitive Endogenous RNA Network Analysis of LncRSPH9-4

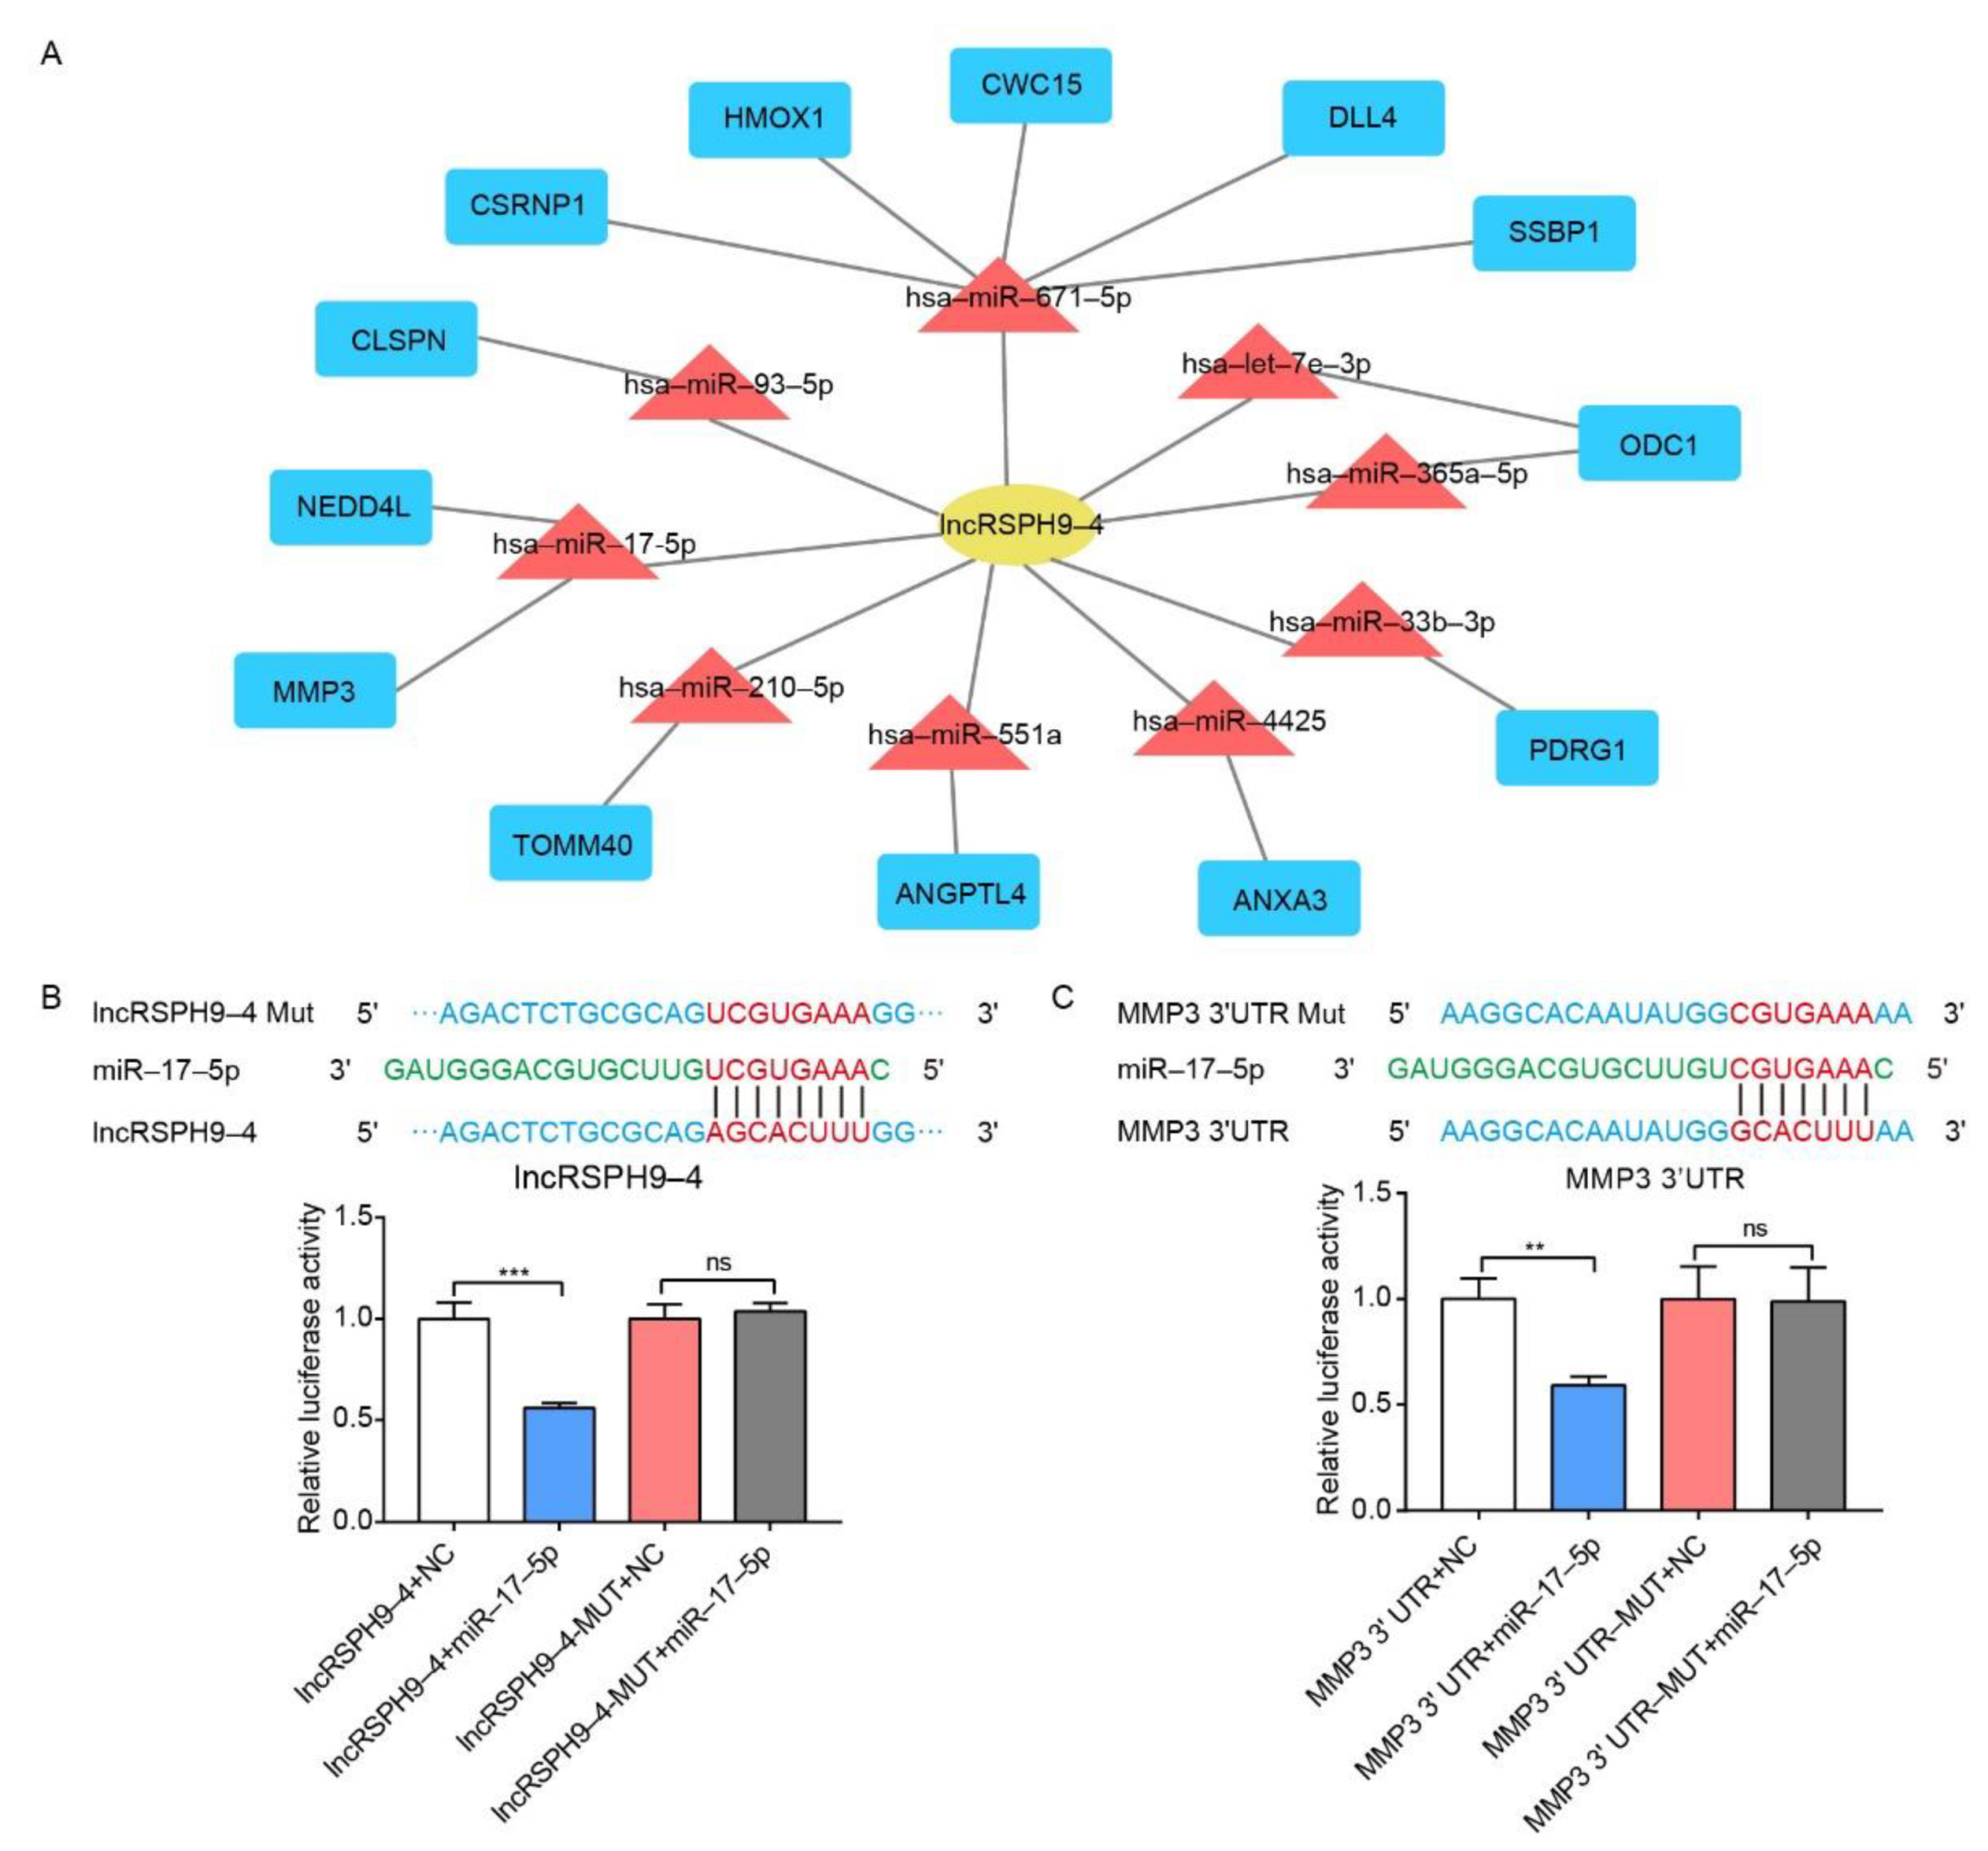
Based on the ceRNA theory, we subsequently constructed a ceRNA regulatory network that centered on lncRSPH9-4. As exhibited in Figure 5A, a total of 9 significantly differential miRNAs and 13 significantly differential mRNAs were involved in the lncRSPH9-4-centered regulative network. These 9 miRNAs, miR-93-5p, miR-671-5p, let-7e-3p, miR-365a-5p, miR-33b-3p, miR-4425, miR-551a, miR-210-5p and miR-17-5p, were therefore predicted as the sponging miRNAs and statistically significantly correlated with lncRSPH9-4 expression. Notably, one miRNA, has-miR-17-5p, was predicted to negatively regulate the expression of MMP3, suggesting that lncRSPH9-4 may exert certain effects via sponging miRNAs and subsequently influencing the function of MMP3.
The interrelationship between miR-17-5p and lncRSPH9-4 and that between miR-17-5p and MMP3 were examined next, by luciferase report assay. As shown in Figure 5B, both the wild-type and mutant lncRSPH9-4 (LncRSPH9-4 MUT) were cloned into luciferase reporter plasmid psiCHECK2 and then co-transfected with or without miR-17-5p mimics. Likewise, both the wild-type MMP3 and its 3′-UTR mutant (MMP3 3′UTR-MUT) were cloned into luciferase reporter plasmid psiCHECK2 and co-transfected with or without miR-17-5p mimics (Figure 5C). It was demonstrated that miR-17-5p mimics co-transfection significantly reduced the luciferase activity of the wild-type lncRSPH9-4, but not that of the lncRSPH9-4 MUT (Figure 5B). Similarly, the miR-17-5p co-transfection also significantly decreased the luciferase activity of the wild-type MMP3 3′UTR, but not that of the mutant MMP3 3′UTR (Figure 5C). These results indicated the lncRSPH9-4-involved ceRNA working mechanism and supported the regulative relationship between lncRSPH9-4 and miR-17-5p, as well as between miR-17-5p and MMP3.

2.6. LncRSPH9-4 Positively Regulated MMP3 Expression

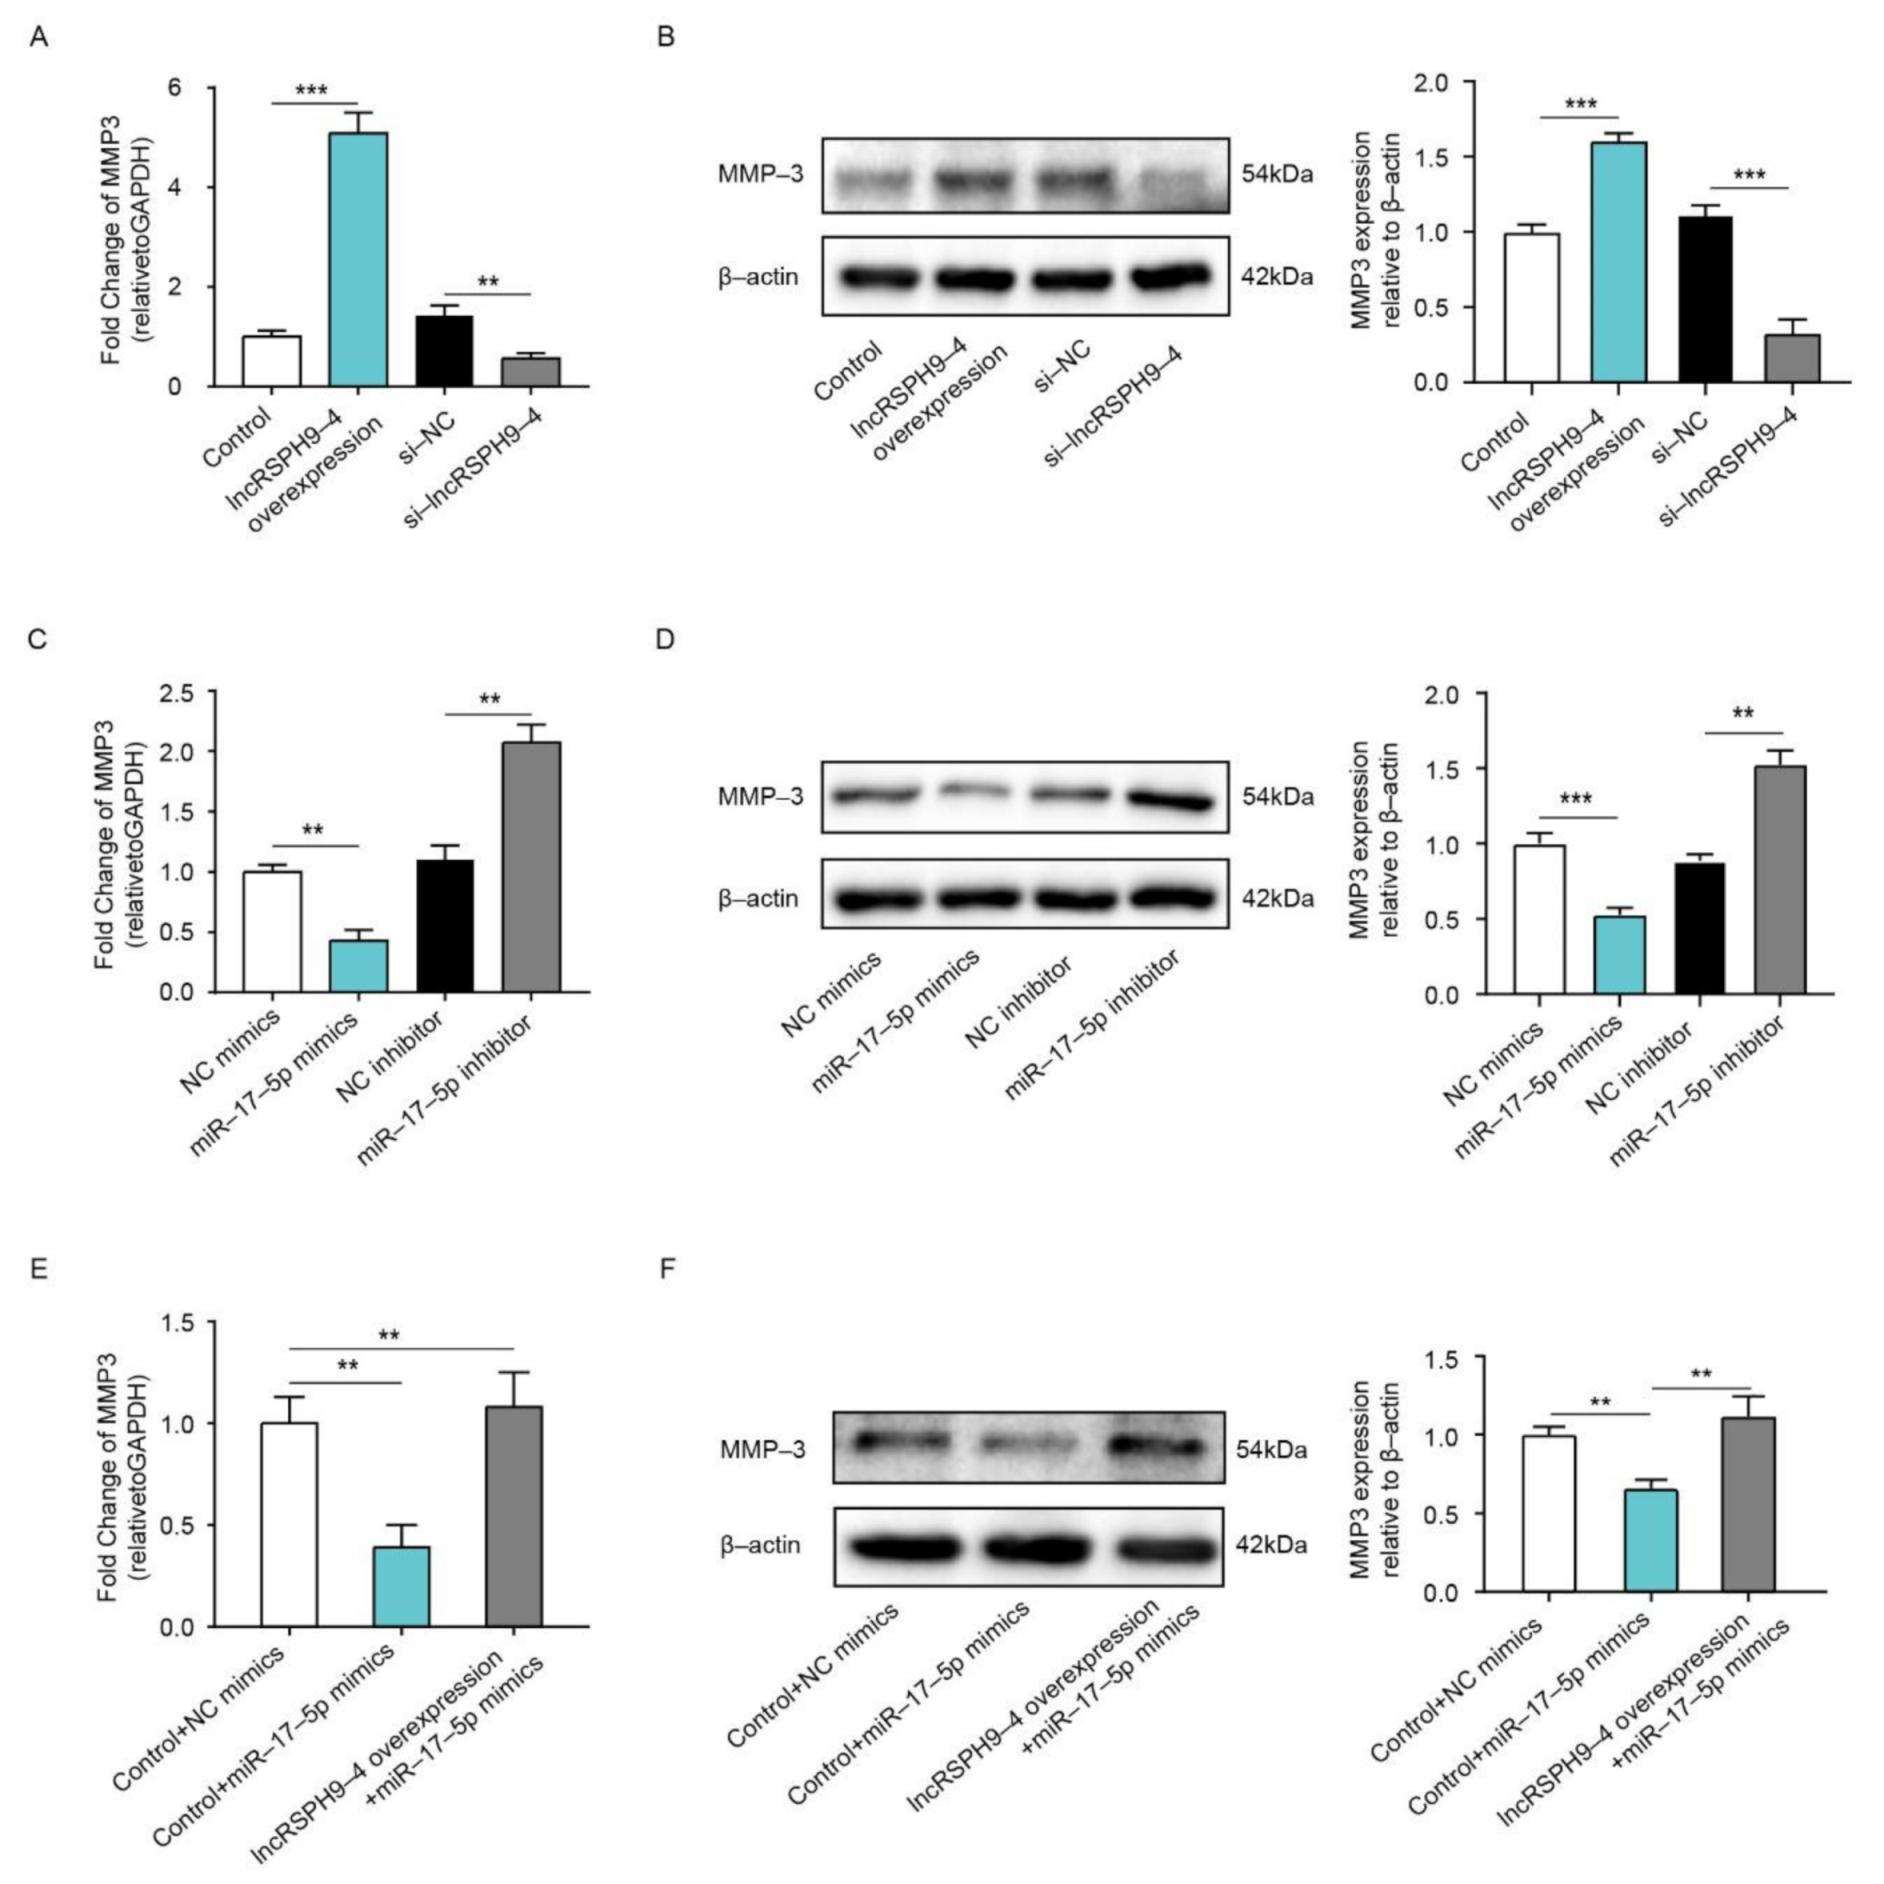
We next validated the regulative effects of lncRSPH9-4 and miR-17-5p on MMP3 expression. As demonstrated, lncRSPH9-4 overexpression significantly increased mRNA transcription and protein expression of MMP3, while, in contrast, the siRNA knocking-down of lncRSPH9-4 significantly decreased MMP3 expression (Figure 6A,B). Meanwhile, miR-17-5p mimics significantly decreased the transcription, as well as expression, of MMP3. However, the miR-17-5p inhibitor resulted in a significant increase in the MMP3 level (Figure 6C,D). Notably, we observed that the miR-17-5p mimics-caused decrease of MMP3 could be entirely restored by the overexpression of lncRSPH9-4 (Figure 6E,F), indicating that lncRSPH9-4 positively regulated MMP3 expression via competitively sponging miR-17-5p.

2.7. LncRSPH9-4 Disrupted BBB Junction Protein through miR-17-5p/MMP3 Axis

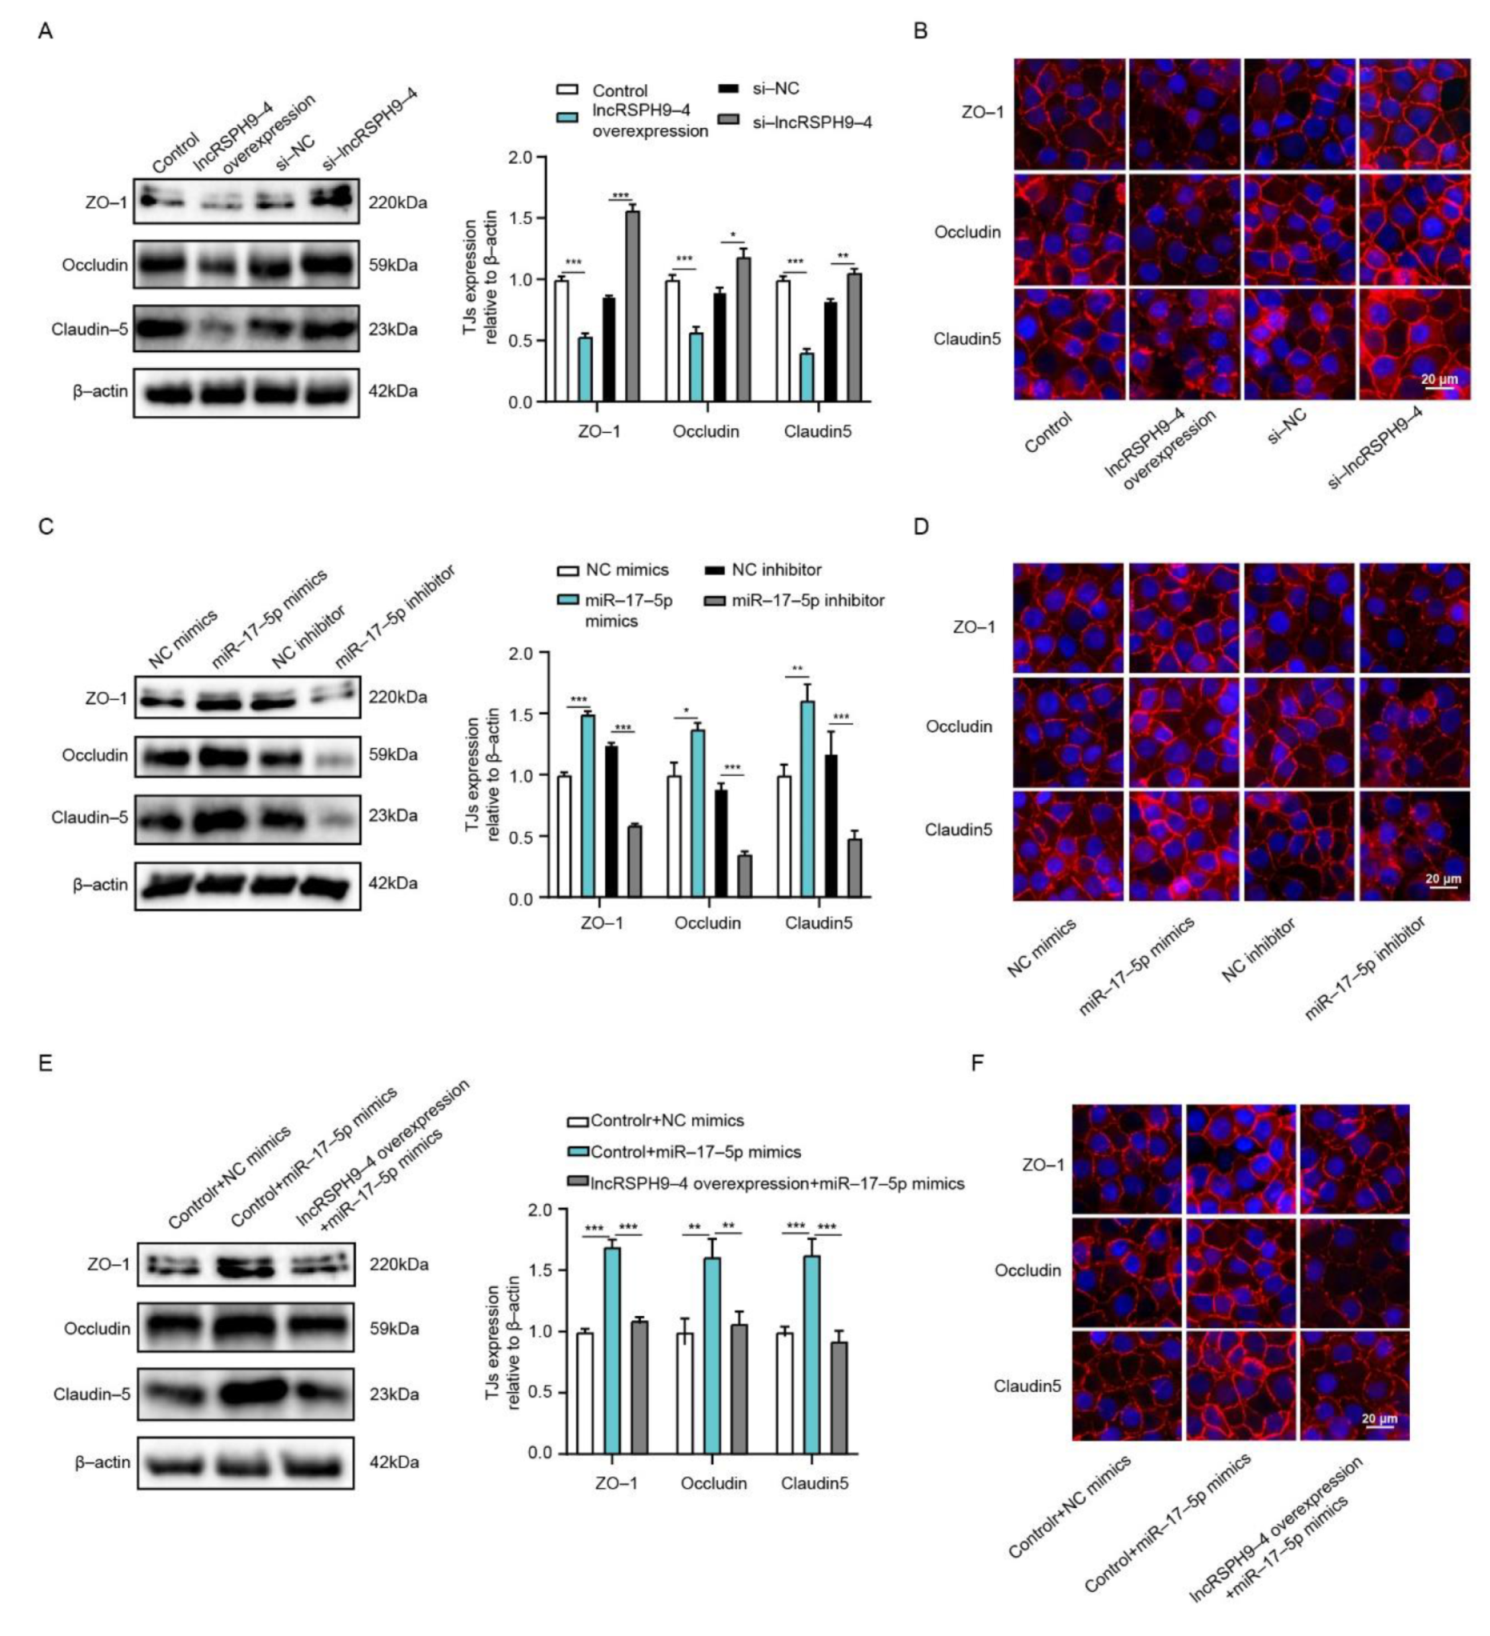
Previous studies have reported that MMP3 contributed to the disruption of TJs [25,26]. We subsequently determined whether lncRSPH9-4 participated in decreasing the TJs in hBMECs through miR-17-5p/MMP3 axis. By Western blotting analyses, we found that lncRSPH9-4 negatively regulated the expression of TJs, by the demonstrations that lncRSPH9-4 overexpression caused a significant decrease of ZO-1, Occludin and Claudin-5, while silencing lncRSPH9-4 significantly increased their protein levels (Figure 7A). In addition, immunofluorescence assays were performed to further examine the effect of lncRSPH9-4 on the BBB integrity. As shown in Figure 7B, the levels of TJs between adjacent endothelial cells were significantly decreased upon overexpression of lncRSPH9-4 and silencing lncRSPH9-4 well maintained the morphology of TJs. Correspondingly, the effects of miR-17-5p on the expression of TJs were also determined and the results showed an obvious positive-regulation on the expression of TJs, by the observations that miR-17-5p mimics increased the expression of ZO-1, Occludin and Claudin-5, while miR-17-5p inhibitors significantly decreased their expression (Figure 7C). Likewise, by immunofluorescence analysis, we demonstrated that TJs between adjacent endothelial cells could be well maintained when overexpressing miR-17-5p, whereas transfection with the miR-17-5p inhibitor resulted in a significant breakdown of TJs (Figure 7D). More importantly, the up-regulative effects of miR-17-5p mimics on TJs were primarily reversed by the overexpression of lncRSPH9-4 (Figure 7E), which was consistent with the regulation mode of lncRSPH9-4/miR-17-5p on MMP3. The immunofluorescence assays also showed that the up-regulative effects of miR-17-5p mimics on hBMECs monolayer integrity were well blocked when lncRSPH9-4 was overexpressed (Figure 7F). Taken together, these findings suggested that lncRSPH9-4 aggravated the TJs disruption in hBMECs by sponging miR-17-5p to regulate MMP3 expression, which eventually broke the barrier integrity and increased the permeability of hBMECs.

3. Discussion

Due to their extensive involvement in biological processes, lncRNAs have attracted immense research interest in recent years. LncRNAs have been increasingly involved in the regulation of multiple central nervous system disorders, such as ischemic stroke, multiple sclerosis and Huntington’s disease [16,27,28]. However, in CNS infectious diseases, the regulatory function of lncRNAs was largely unclear. In this study, we identified and characterized an up-regulated lncRNA, lncRSPH9-4, in hBMECs challenged with meningitic E. coli. We demonstrated that lncRSPH9-4 helped the infection-caused disruption of the BBB integrity via sponging miR-17-5p, thus promoted the expression of MMP3 and eventually increased the degradation of TJs.
Lots of lncRNAs were involved in the development of neurodegenerative diseases. A well-studied lncRNA, MALAT1, was reported to contribute to protecting the BBB after stroke [29]. Other lncRNAs, such as BC200 and Sox2OT, were found to be associated with Alzheimer’s disease or Parkinson’s disease [30,31]. Accumulating pieces of evidence have also supported the essential roles of lncRNAs in virus infection. For example, a lncRNA called lncRNA-ACOD1 was found to facilitate Vesicular vtomatitis virus replication in macrophages through enhancing GOT2 enzymatic activity [12]. LncRNAs exerted their functions from many aspects. In recent years, the concept of ceRNA as a new regulatory mechanism has been raised and widely accepted in diverse physiological and pathological processes, which means that lncRNAs could act as a ceRNA to competitively sponge miRNA, thus resulting in a decreased mRNA degradation [32]. Numerous studies have increasingly reported that lncRNAs function as sponges to interact with miRNAs at the post-transcriptional level [33,34]. For example, a lncRNA named linc-EPHA6-1 can sponge miR-4485-5p to regulate NKP46 expression and enhance NK cells cytotoxicity against Zika virus-infected cells [35]. However, there are few studies about the lncRNAs function in bacterial infectious diseases. We previously found one lncRNA, lncRSPH9-4, that was significantly increased in meningitic E. coli-infected hBMECs. Here, we further analyzed the transcriptomic profiles in hBMECs in response to the overexpression of lncRSPH9-4 via RNA-sequencing. A total of 639 mRNAs and 299 miRNAs with significant alteration upon lncRSPH9-4 overexpression have been identified and the ceRNA regulatory network was built based on the sequencing data. One miRNA, miR-17-5p, showed the possibility of being sponged by lncRSPH9-4 and influenced the expression of MMP3, an important protein associated with intercellular integrity and permeability.
It is worth wondering about the relationship between miR-17-5p and the BBB permeability. The BBB is ultrastructurally assembled by a monolayer of BMECs, which are tightly attached via TJs and adherens junctions (AJs) [6,36]. Many miRNAs have been shown to influence the BBB permeability. Some pathogens, such as Coxsackievirus A16, can increase the expression of miRNA-1303 and trigger the changes in the BBB permeability [37]. Other miRNAs, such as miRNA-29b and miRNA-15, were reported to control the BBB integrity by targeting MMP9 [38,39]. Exosomes-derived miRNA-132 regulated the expression of vascular endothelial cadherin (VE-cadherin) by directly targeting eukaryotic elongation factor 2 kinase (eef2k) and increased the permeability of the BBB [40]. It has been reported that miR-17-5p plays a vital role in endothelial cells by binding to VEGF-A 3′UTR and inhibiting VEGF-A expression in HUVECs [41]. Here, in our study, we used an immortalized hBMECs cell line, established by Kwang Sik Kim in Johns Hopkins University School of Medicine, as our in vitro BBB model. This immortalized hBMECs line was positive for Factor VIII-Rag, could intake DiI-AcLDL and showed a positive reaction for GGTP, which indicated that they exhibited brain endothelial characteristics [42]. It also expressed VCAM-1, ICAM-1 and TJs and maintained their barrier properties [43]. The hBMECs monolayer model provided by Kim has been largely applied in BBB functional research. For example, molecules such as CC chemokine ligand 2 (CCL2) and snail family transcriptional repressor 1 (Snail1) have been reported to contribute to blood–brain barrier disruption by the application of the hBMEC monolayer [44,45]. In our study, we found that miR-17-5p expression was significantly downregulated in hBMECs when overexpressing lncRSPH9-4. Consistently, miR-17-5p was also decreased in hBMECs in response to meningitic E. coli infection, as observed in our previous work [46]. Here, we showed that miR-17-5p was one of the competitive-sponging targets of lncRSPH9-4 and miR-17-5p could bind to 3′UTR of MMP3 to suppress the expression of MMP3. MMP3 is a member of the MMP family, which is widely involved in the breakdown of extracellular matrix proteins during tissue remodeling, such as embryonic development and reproduction, as well as in disease processes, such as arthritis and tumor metastasis [47]. MMP3 can degrade collagen, elastin, fibronectin, laminin, as well as tight junctions, so as to increase vascular permeability and disrupt the BBB [25,41,48,49]. In hBMECs, our results suggested that lncRSPH9-4 was able to regulate MMP3 expression by acting as a competitive sponge of miR-17-5p. Since previous studies have already evidenced that MMP3 can directly degrade the TJs of vascular endothelial cells [25,41], we therefore next investigated the potential effects on MMP3 regulated by lncRSPH9-4 and miR-17-5p and results showed that lncRSPH9-4 could negatively regulate the TJs, while miR-17-5p positively regulated the TJs and, importantly, this regulatory axis was probably mediated by the change of MMP3 expression during this process.
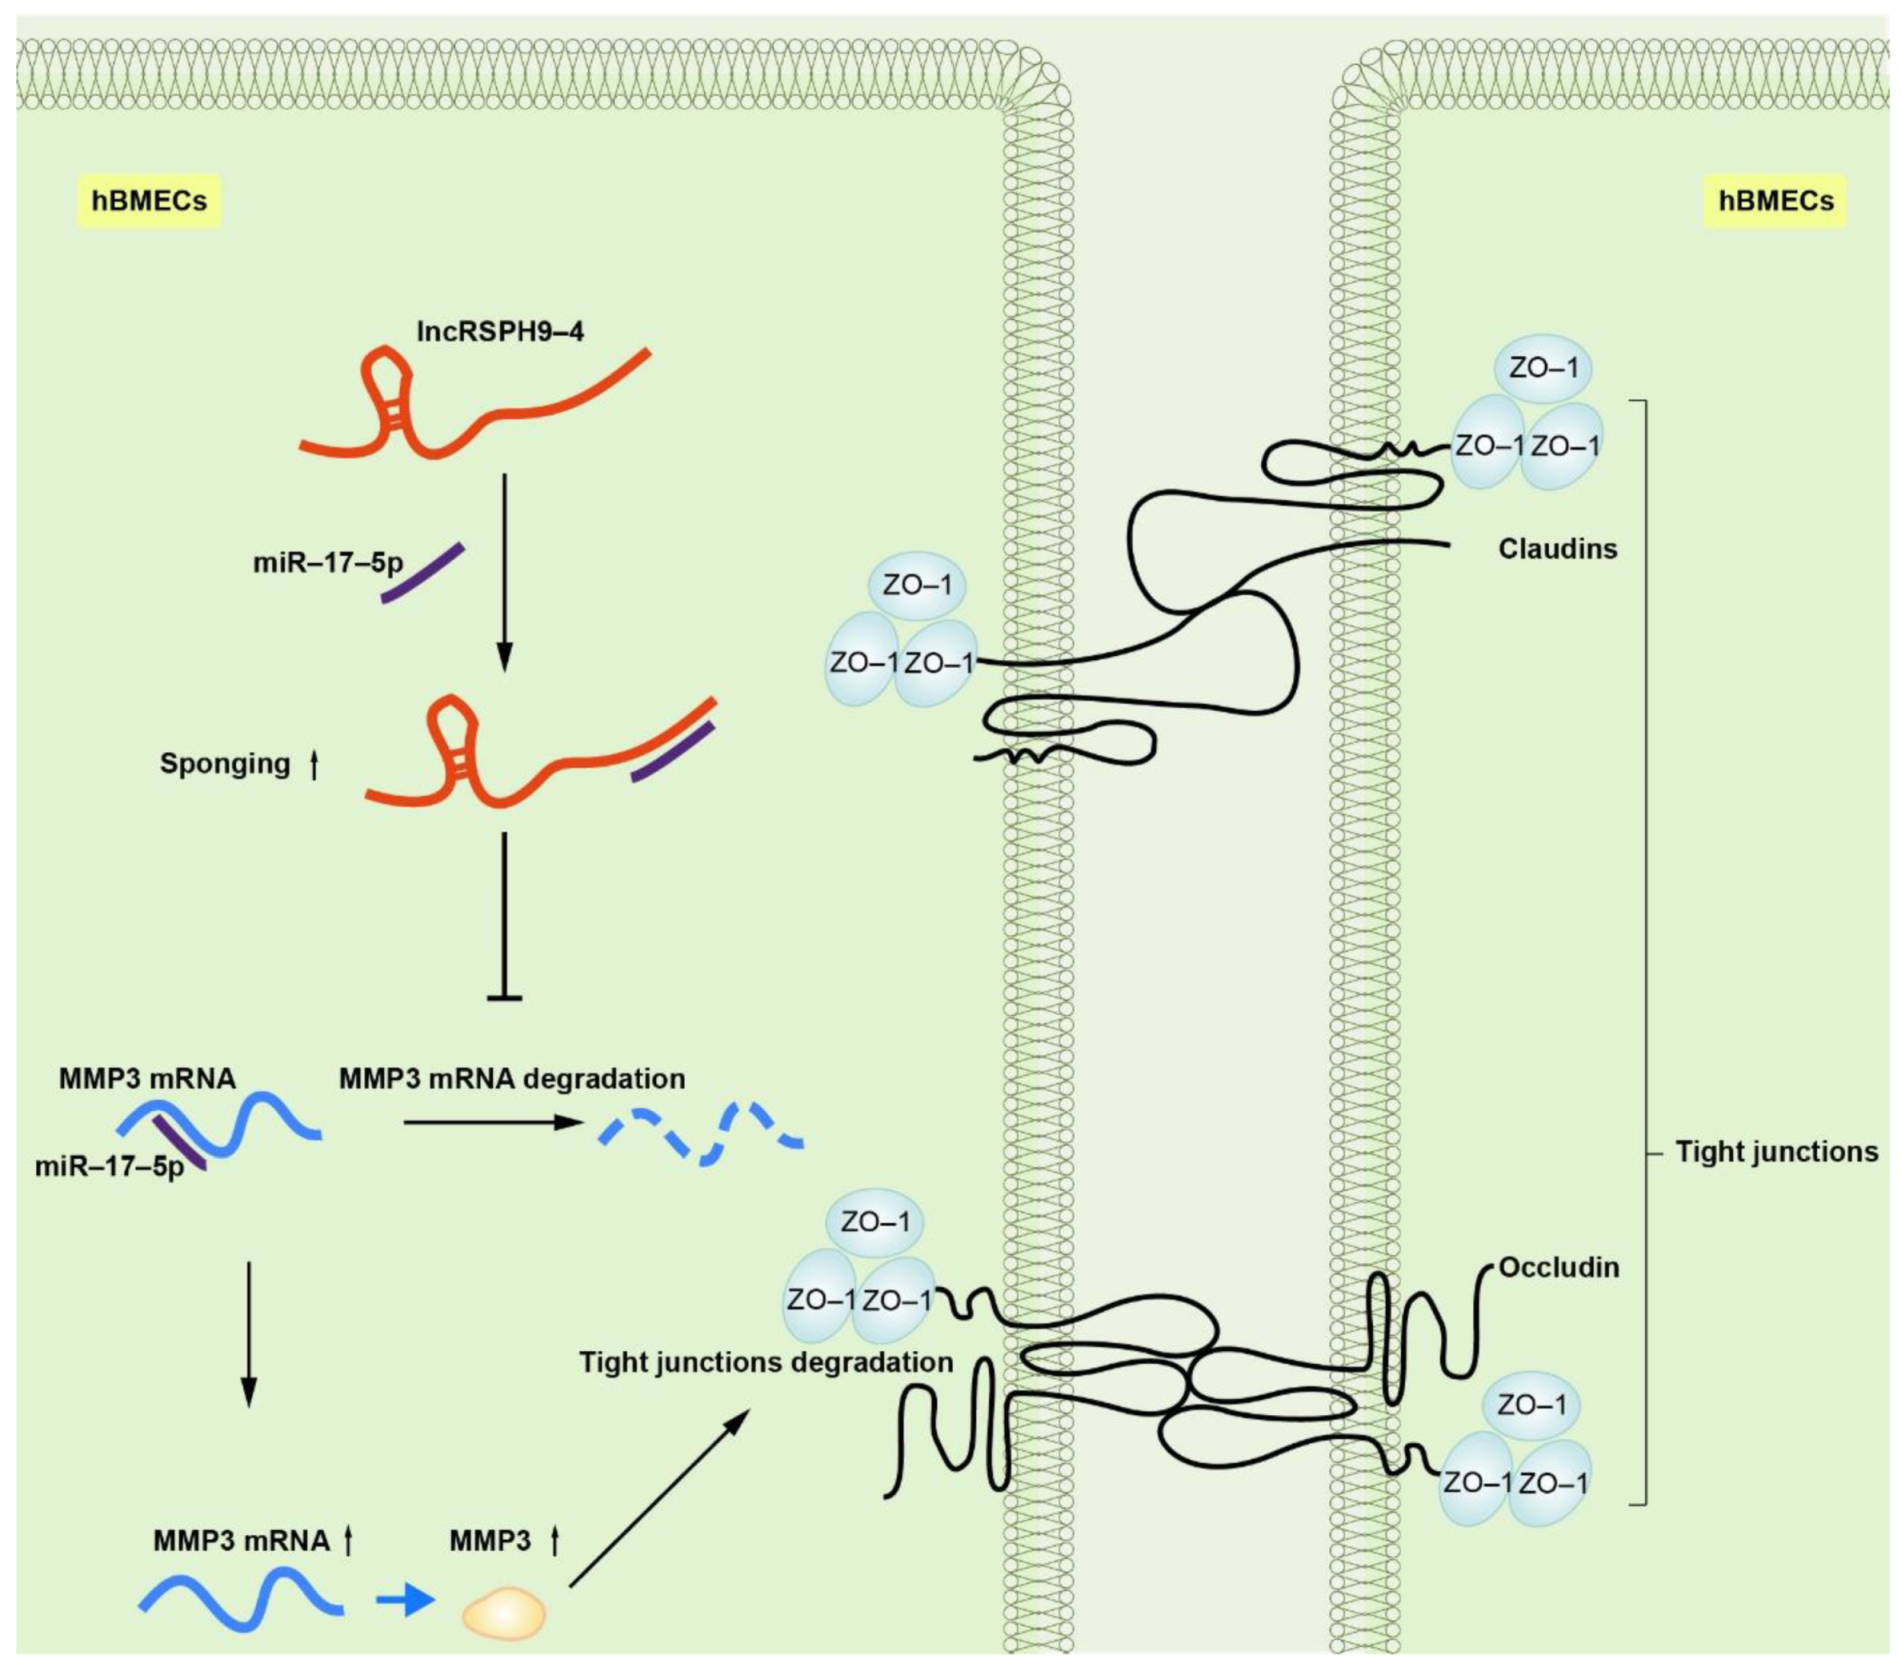
Taken together, our findings provided substantial evidence, for the first time clarifying the regulatory function of lncRNA during meningitis-causing bacterial infection. We demonstrated that meningitic E. coli-induced lncRSPH9-4 could function as a ceRNA to compete with miR-17-5p, which led to the increased expression of MMP3 and therefore the degradation of the TJs barrier (Figure 8). However, the mechanisms of BBB disruption in the development of bacterial meningitis are quite complex and the contribution of lncRSPH9-4 is just the tip of the iceberg. At the same time, we investigated the expression specificity of lncRSPH9-4 in the other endothelial cells (peripheric endothelial cells, such as HUVECs), as well as other barrier-forming (not endothelium) cells, such as astrocytes, in our previous work. As demonstrated below, lncRSPH9-4 was also significantly induced by the challenge of meningitic E. coli, indicating that lncRSPH9-4 probably exhibits a similar working mechanism in the astrocytes cell line U251. We also noticed the expression/transcription of lncRSPH9-4 in the peripheric vascular endothelial cells HUVECs; however, it was not significantly induced by the infection, suggesting that lncRSPH9-4 might not work in this type of endothelial cells [20]. At last, further efforts are required to explore the generation of lncRSPH9-4 and whether there are some other targets as well as regulative mechanisms of lncRSPH9-4 in meningitic bacterial penetration of the BBB.

4. Materials and Methods

4.1. Cell Line and Cell Culture

The immortalized hBMECs cell line was kindly provided by Kwang Sik Kim, at Johns Hopkins University School of Medicine. The immortalized hBMECs were obtained by transfecting the pBR322 construct containing simian virus large T protein (SV-large T). This hBMECs cell line was authenticated by the Genetic Testing Biotechnology Corporation (Suzhou, China), using short tandem repeat (STR) markers. It was routinely cultured in RPMI1640 supplemented with 10% fetal bovine serum (FBS), 2mML-glutamine, 1 mM sodium pyruvate, essential amino acids, nonessential amino acids, vitamins and penicillin and streptomycin (100 U/mL), in a 37 °C-incubator under 5% CO2 until monolayer confluence.

4.2. Meningitic E. coli Infection of hBMECs

The meningitic E. coli strain used in this study, PCN033 [Genbank: CP006632.1], was isolated from swine cerebrospinal fluid in China. The strain was routinely grown aerobically at 37 °C in Luria-Bertani (LB) medium overnight. PCN033-induced infections of hBMECs were performed as follows. An overnight E. coli culture was resuspended and diluted in serum-free medium and then it was added to a starved confluent hBMEC monolayer grown in 10 cm dishes at an MOI of 10 (approximately 108 colony-forming units per dish) to allow invasion at 37 °C for 3 h.

4.3. Transfection

The hBMECs were cultured until 50%–60% confluence in a 6-well plate and transfected with pcDNA3.1 (+)-lncRSPH9-4, which was purchased from Genscript (Genscript, Nanjing, China) using the jetPRIME transfection reagent (Polyplus transfection, Illkirch, France), according to the manufacturers’ instructions. Briefly, 200 μL jetPRIME buffer was added into the pcDNA3.1 (+)-lncRSPH9-4 plasmid before the addition of 4 μL of jetPRIME. The suspension was shortly mixed by vortexing, incubated at room temperature for 10 min and then added dropwise to the cells and incubated at 37 °C with 5% CO2 for 48 h.

4.4. Electrical Cell-Substrate Impedance Sensing

To evaluate the real-time alteration of the monolayer cell resistance, the ECIS system (Applied BioPhysics, Troy, MI, USA) was applied to compare the impedance values in hBMECs with or without lncRSPH9-4 overexpression seeded on the collagen-coated, gold-plate electrodes in 96-well chanmer slides (96W1E+), as previously described [50]. Two ECIS parameters, R (Ω), representing the electrical cell–cell contacts, and Rb (Ωcm2), representing the paracellular barrier, were extracted from the continuously recorded impedance spectra to reflect the real-time changes of the monolayer barrier function.

4.5. RNA Isolation and Quantitative Real-Time PCR Analysis

Total cellular RNA was extracted using the TRIzol reagent (Invitrogen, Carlsbad, CA, USA) in hBMECs, after being washed three times with chilled PBS buffer. For miRNAs, cDNA synthesis was carried out using miRcute plus miRNA First-Strand cDNA kit (Tiangen, Beijing, China), according to the manufacturer’s instructions. The qPCR was performed using the miRcute plus miRNA qPCR detection kit (Tiangen, Beijing, China). Primers for the miRNA qPCR are listed in Supplementary Table S1. For mRNAs, aliquots (500 ng) of the total RNAs were reverse-transcribed into cDNA using the HiScript II Q RT SuperMix (Vazyme, Nanjing, China). Real-time PCR was performed with a qTOWER3/G quantitative real-time PCR thermal cycler (Analytikjena, Jena, Germany) with the AceQ qPCR SYBR Green Master Mix (Vazyme, Nanjing, China), according to the manufacturer’s instructions. The amplification conditions were 50 °C for 2 min, 95 °C for 10 min, followed by 40 cycles of 95 °C for 15 s and 60 °C for 1 min. The products were then subjected to a melting curve stage comprising denaturation at 95 °C for 15 s, annealing at 60 °C for 1 min and slow dissociation by ramping from 60 °C to 95 °C at 0.1 °C/s to ensure the specificity of the primers for their target sequences. Expression of the target genes was normalized against GAPDH. Each assay was performed with three replicates.

4.6. mRNA Library Preparation and Sequencing

Six RNA sequencing libraries were constructed and 150-bp paired-end sequencing was applied with the Illumina HiSeq platform. RNA sequencing libraries were prepared from 2 μg of total RNAs using the TruSeq kit (Illumina, San Diego, CA, USA) with the following modification. Instead of purifying poly-A RNA using poly-dT primer beads, we removed ribosomal RNA using the Ribo-Zero rRNA Removal kit (Illumina, San Diego, CA, USA). All other steps were performed according to the manufacturer’s protocols. RNA-seq libraries were analyzed for quality control and the average size of inserts was approximately 200–300 bp. The sequencing library was then sequenced on a Hiseq platform (Illumina, San Diego, CA, USA) by Shanghai Personal Biotechnology Cp. Ltd. (Personal Biotechnology, Shanghai, China).

4.7. Small RNA Library Preparation and Sequencing

Small RNA libraries were constructed using the NEBNext Multiplex Small RNA Library Prep Set for Illumina (New England Biolabs, Inc.). The total RNA from six samples were mixed with 3′ linker sequences, RT Primers and the 5′ adaptor sequences. The resulting RNA samples were reverse-transcribed by following these steps: degeneration at 94 °C for 15 s, annealing at 62 °C for 30 s and extension at 70 °C for 15 s. Small RNA libraries were analyzed for quality control and the average size of inserts was about 140–150 bp. The library was then subjected to the sequencing on a Hiseq platform (Illumina, San Diego, CA, USA) by Shanghai Personal Biotechnology Cp. Ltd. (Personal Biotechnology, Shanghai, China).

4.8. Construction of the lncRNA-miRNA-mRNA ceRNA Network

The lncRNA–miRNA–mRNA ceRNA network was based on the theory that lncRNAs can directly interact by invoking miRNA sponges to regulate mRNA activity. To investigate the potential interactions between lncRNAs and mRNAs, we constructed the ceRNA co-regulated network using differentially expressed lncRNAs, differentially expressed miRNA and differentially expressed mRNA data. The co-regulated network was constructed using Cytoscape software version 3.7.0 (http://www.cytoscape.org) to illustrate the ceRNA network.

4.9. Dual-Luciferase Reporter Assays

Until 50–70% of confluence, HEK293T cells were co-transfected with 100 ng psiCheck-2 lncRSPH9-4 or MMP3 3′ UTR luciferase reporter plasmid along with miR-17-5p mimics or controls (final concentration, 50 nM). HEK293T cells were co-transfected with 100 ng psiCheck-2 mutant lncRSPH9-4 or mutant MMP3 3′ UTR luciferase reporter plasmid lacking the miR-17-5p binding site along with miR-17-5p mimics or controls (final concentration, 50 nM). At 24 h post-transfection, the reporter luciferase activities were measured using the Dual-Luciferase reporter assay system (Promega, Madison, WI, USA), following the manufacturers’ instruction.

4.10. FISH

The commercial FISH Kit, purchased from GenePharma (Shanghai, China), was used for the FISH assays, following the manufacturer’s procedures. Briefly, hBMECs were fixed in 4% paraformaldehyde for 30 min at room temperature and washed twice with PBS. Cells were incubated in proteinase K solution for 15 min at 37 °C, washed twice with PBS for 5 min and then mixed with 1% fixation solution for 10 min at room temperature. Fixed samples were incubated with 70% ethanol for 5 min, 85% ethanol for 5 min and 100% ethanol for 5 min at −20 °C, before drying. Samples were next incubated with a pre-hybridization solution for 30 min at 37 °C, followed by incubating in the hybridization buffer with specific probes for lncRSPH9-4 (5′-Cy3-AGGAAAGAGGCTCAGGCCCA-3′) for 18 h at 37 °C. After strict wash in SSC buffer, 1mg/mL of 4′,6-diamidino-2-phenylindole (DAPI, Beyotime Biotechnology, Shanghai, China) was used for nucleus staining. Fluorescent images were acquired with an OlympusFV10 laser scanning confocal microscope (Olympus, Tokyo, Japan).

4.11. Western Blotting

The hBMECs transfected with pcDNA3.1-lncRSPH9-4, si-lncRSPH9-4, or miR-17-5p mimics, or miR-17-5p inhibitors were lysed in RIPA buffer with a protease inhibitor cocktail (Sigma-Aldrich, St. Louis, MO, USA), sonicated and centrifuged at 10,000 g for 10 min at 4 °C. The insoluble debris was removed and protein concentration in the supernatant was measured using the BCA protein assay kit (NCM Biotech, Suzhou, China). The protein samples were then separated on 12% sodium dodecyl sulfate-polyacrylamide gel electrophoresis (SDS-PAGE) and transferred to polyvinylidene difluoride (PVDF) membranes. The blots were blocked in 5% BSA in Tris-buffered saline with Tween 20 (TBST) for 2 h at room temperature and then incubated overnight with primary antibodies against ZO-1, Occludin, Claudin-5, MMP3 (Abcam, Cambridge, MA, USA), MMP1, β-actin (Proteintech, Chicago, IL, USA), or MMP10 (ABclonal, Wuhan, China). The blots were subsequently washed and incubated with horseradish peroxidase-conjugated anti-rabbit or anti-mouse IgG (Biodragon, Beijing, China) at 37 °C for 1 h. The blots were visualized with the Super electrochemiluminescence (ECL) Prime kit (US Everbright, Suzhou, China) and were densitometrically analyzed using the Image Lab software (Bio-Rad, Hercules, CA, USA).

4.12. Immunofluorescence Assay

The hBMECs grown in 12-well dishes were fixed with 4% paraformaldehyde for 15 min, followed by three washes with PBS. Cells were incubated with the primary rabbit ZO-1, Occludin, or Claudin-5 antibody (Abcam, Cambridge, MA, USA) overnight at 4 °C and then incubated with Cy3 goat anti-rabbit antibody (Proteintech, Chicago, IL, USA) for 1 h. Cells were counterstained with DAPI to visualize the nucleus morphology and mounted and photographed using the BX41 fluorescence microscopy (Olympus, Tokyo, Japan).

4.13. Statistical Analysis

Data were expressed as mean ± SD from three independent experiments and the significance of differences between groups was evaluated by one-way analysis of variance. * p < 0.05 was considered significant, ** p < 0.01 and *** p < 0.001 were all considered extremely significant. Graphs were plotted and analyzed using GraphPad Prism version 6.0 (GraphPad Software, La Jolla, CA, USA).

5. Conclusions

This study provided novel insights into the molecular mechanism of lncRSPH9-4 in meningitic E. coli invasion of the BBB. We demonstrated that meningitic E. coli infection of hBMECs induced the significant upregulation of lncRSPH9-4, which facilitated the barrier disruption of the endothelial cells, probably through lncRSPH9-4/miR-17-5p/MMP3 axis. This finding provides a new idea for understanding the function of lncRNAs in bacterial infection, especially in bacterial penetration of the CNS. Blocking these lncRNAs, such as lncRSPH9-4, may also represent a new strategy to better prevent and improve the CNS dysfunctions.

Supplementary Materials

The following are available online at https://www.mdpi.com/article/10.3390/ijms22126343/s1, Figure S1: The construction and transfection efficiency of the lncRSPH9-4 overexpression plasmid in hBMECs, Figure S2: The KEGG and GO enrichment analyses of the differential mRNAs in hBMECs with the lncRSPH9-4 overexpression, Figure S3: The KEGG and GO enrichment analyses presenting the differential mRNA targets of the differential miRNAs in hBMECs with lncRSPH9-4 overexpression. Table S1 Primers used for miRNA qPCR.

Author Contributions

Conceptualization, H.C. and X.W.; methodology, X.W. and B.X.; validation, B.X., R.Y., and J.C.; data curation, B.X., B.Y., and J.F.; writing—original draft preparation, B.X. and X.W.; writing—review and editing, R.Y., B.Y., and J.C.; visualization, J.F. and B.X.; project administration, C.T. and H.C.; funding acquisition, H.C., X.W., and R.Y. All authors have read and agreed to the published version of the manuscript.

Funding

This work was funded by grants from the National Natural Science Foundation of China, China (31772736), the earmarked fund for China Agriculture Research System (CARS-35), the outstanding youth project of Natural Science Foundation of Hubei Province, China (2018CFA070), National Key Research and Development Program of China (2016YFD0500406), Hubei Postdoctoral Preferential Foundation, China (590320102), and China Postdoctoral Science Foundation, China (2020M672379).

Institutional Review Board Statement

Not applicable.

Informed Consent Statement

Not applicable.

Data Availability Statement

The data presented in this study are available on request from the corresponding author.

Acknowledgments

We would like to thank Kwang Sik Kim at Johns Hopkins University School of Medicine for providing the hBMECs.

Conflicts of Interest

The authors declare no conflict of interest.

References

  1. Kim, K.S. Mechanisms of microbial traversal of the blood-brain barrier. Nat. Rev. Microbiol. 2008, 6, 625–634. [Google Scholar] [CrossRef] [Green Version]
  2. Kim, K.S. Pathogenesis of bacterial meningitis: From bacteraemia to neuronal injury. Nat. Rev. Neurosci. 2003, 4, 376–385. [Google Scholar] [CrossRef]
  3. Sandoval, K.E.; Witt, K.A. Blood-brain barrier tight junction permeability and ischemic stroke. Neurobiol. Dis. 2008, 32, 200–219. [Google Scholar] [CrossRef] [PubMed]
  4. Dejana, E.; Tournier-Lasserve, E.; Weinstein, B.M. The control of vascular integrity by endothelial cell junctions: Molecular basis and pathological implications. Dev. Cell 2009, 16, 209–221. [Google Scholar] [CrossRef] [PubMed] [Green Version]
  5. Edwards, V.L.; Wang, L.C.; Dawson, V.; Stein, D.C.; Song, W. Neisseria gonorrhoeae breaches the apical junction of polarized epithelial cells for transmigration by activating EGFR. Cell. Microbiol. 2013, 15, 1042–1057. [Google Scholar] [CrossRef] [PubMed] [Green Version]
  6. Hawkins, B.T.; Davis, T.P. The blood-brain barrier/neurovascular unit in health and disease. Pharmacol. Rev. 2005, 57, 173–185. [Google Scholar] [CrossRef] [PubMed]
  7. Batista, P.J.; Chang, H.Y. Long noncoding RNAs: Cellular address codes in development and disease. Cell 2013, 152, 1298–1307. [Google Scholar] [CrossRef] [Green Version]
  8. Lee, J.T.; Bartolomei, M.S. X-inactivation, imprinting, and long noncoding RNAs in health and disease. Cell 2013, 152, 1308–1323. [Google Scholar] [CrossRef] [Green Version]
  9. Fatica, A.; Bozzoni, I. Long non-coding RNAs: New players in cell differentiation and development. Nat. Rev. Genet. 2014, 15, 7–21. [Google Scholar] [CrossRef] [PubMed]
  10. Huarte, M.; Rinn, J.L. Large non-coding RNAs: Missing links in cancer? Hum. Mol. Genet. 2010, 19, R152–R161. [Google Scholar] [CrossRef] [Green Version]
  11. Huang, W.; Thomas, B.; Flynn, R.A.; Gavzy, S.J.; Wu, L.; Kim, S.V.; Hall, J.A.; Miraldi, E.R.; Ng, C.P.; Rigo, F.; et al. DDX5 and its associated lncRNA Rmrp modulate TH17 cell effector functions. Nature 2015, 528, 517–522. [Google Scholar] [CrossRef] [PubMed] [Green Version]
  12. Wang, P.; Xu, J.; Wang, Y.; Cao, X. An interferon-independent lncRNA promotes viral replication by modulating cellular metabolism. Science 2017, 358, 1051–1055. [Google Scholar] [CrossRef] [Green Version]
  13. Zhang, L.; Luo, X.; Chen, F.; Yuan, W.; Xiao, X.; Zhang, X.; Dong, Y.; Zhang, Y.; Liu, Y. LncRNA SNHG1 regulates cerebrovascular pathologies as a competing endogenous RNA through HIF-1alpha/VEGF signaling in ischemic stroke. J. Cell. Biochem. 2018, 119, 5460–5472. [Google Scholar] [CrossRef]
  14. Ji, P.; Diederichs, S.; Wang, W.; Boing, S.; Metzger, R.; Schneider, P.M.; Tidow, N.; Brandt, B.; Buerger, H.; Bulk, E.; et al. MALAT-1, a novel noncoding RNA, and thymosin beta4 predict metastasis and survival in early-stage non-small cell lung cancer. Oncogene 2003, 22, 8031–8041. [Google Scholar] [CrossRef] [PubMed] [Green Version]
  15. Shen, L.; Chen, L.; Wang, Y.; Jiang, X.; Xia, H.; Zhuang, Z. Long noncoding RNA MALAT1 promotes brain metastasis by inducing epithelial-mesenchymal transition in lung cancer. J. Neurooncol. 2015, 121, 101–108. [Google Scholar] [CrossRef] [PubMed]
  16. Sun, D.; Yu, Z.; Fang, X.; Liu, M.; Pu, Y.; Shao, Q.; Wang, D.; Zhao, X.; Huang, A.; Xiang, Z.; et al. LncRNA GAS5 inhibits microglial M2 polarization and exacerbates demyelination. EMBO Rep. 2017, 18, 1801–1816. [Google Scholar] [CrossRef]
  17. Liu, W.Q.; Wang, Y.J.; Zheng, Y.; Chen, X. Effects of long non-coding RNA NEAT1 on sepsis-induced brain injury in mice via NF-kappaB. Eur. Rev. Med. Pharmacol. Sci. 2019, 23, 3933–3939. [Google Scholar] [CrossRef]
  18. Li, Z.; Li, J.; Tang, N. Long noncoding RNA Malat1 is a potent autophagy inducer protecting brain microvascular endothelial cells against oxygen-glucose deprivation/reoxygenation-induced injury by sponging miR-26b and upregulating ULK2 expression. Neuroscience 2017, 354, 1–10. [Google Scholar] [CrossRef] [PubMed]
  19. Tay, Y.; Rinn, J.; Pandolfi, P.P. The multilayered complexity of ceRNA crosstalk and competition. Nature 2014, 505, 344–352. [Google Scholar] [CrossRef] [PubMed] [Green Version]
  20. Yang, R.; Huang, F.; Fu, J.; Dou, B.; Xu, B.; Miao, L.; Liu, W.; Yang, X.; Tan, C.; Chen, H.; et al. Differential transcription profiles of long non-coding RNAs in primary human brain microvascular endothelial cells in response to meningitic Escherichia coli. Sci. Rep. 2016, 6, 38903. [Google Scholar] [CrossRef] [PubMed] [Green Version]
  21. Yang, X.; Zi, X.H. LncRNA SNHG1 alleviates OGD induced injury in BMEC via miR-338/HIF-1alpha axis. Brain Res. 2019, 1714, 174–181. [Google Scholar] [CrossRef]
  22. Zhang, T.; Tian, C.; Wu, J.; Zhang, Y.; Wang, J.; Kong, Q.; Mu, L.; Sun, B.; Ai, T.; Wang, Y.; et al. MicroRNA-182 exacerbates blood-brain barrier (BBB) disruption by downregulating the mTOR/FOXO1 pathway in cerebral ischemia. FASEB J. 2020. [Google Scholar] [CrossRef]
  23. Bobbili, M.R.; Mader, R.M.; Grillari, J.; Dellago, H. OncomiR-17-5p: Alarm signal in cancer? Oncotarget 2017, 8, 71206–71222. [Google Scholar] [CrossRef] [PubMed] [Green Version]
  24. Dellago, H.; Bobbili, M.R.; Grillari, J. MicroRNA-17-5p: At the Crossroads of Cancer and Aging—A Mini-Review. Gerontology 2017, 63, 20–28. [Google Scholar] [CrossRef] [PubMed]
  25. Gurney, K.J.; Estrada, E.Y.; Rosenberg, G.A. Blood-brain barrier disruption by stromelysin-1 facilitates neutrophil infiltration in neuroinflammation. Neurobiol. Dis. 2006, 23, 87–96. [Google Scholar] [CrossRef] [PubMed]
  26. Qiao, S.; Qian, Y.; Xu, G.; Luo, Q.; Zhang, Z. Long-term characterization of activated microglia/macrophages facilitating the development of experimental brain metastasis through intravital microscopic imaging. J. Neuroinflamm. 2019, 16, 4. [Google Scholar] [CrossRef] [PubMed] [Green Version]
  27. Johnson, R. Long non-coding RNAs in Huntington’s disease neurodegeneration. Neurobiol. Dis. 2012, 46, 245–254. [Google Scholar] [CrossRef] [PubMed]
  28. Bao, M.H.; Szeto, V.; Yang, B.B.; Zhu, S.Z.; Sun, H.S.; Feng, Z.P. Long non-coding RNAs in ischemic stroke. Cell Death Dis. 2018, 9, 281. [Google Scholar] [CrossRef] [Green Version]
  29. Ruan, W.; Li, J.; Xu, Y.; Wang, Y.; Zhao, F.; Yang, X.; Jiang, H.; Zhang, L.; Saavedra, J.M.; Shi, L.; et al. MALAT1 Up-Regulator Polydatin Protects Brain Microvascular Integrity and Ameliorates Stroke Through C/EBPbeta/MALAT1/CREB/PGC-1alpha/PPARgamma Pathway. Cell. Mol. Neurobiol. 2019, 39, 265–286. [Google Scholar] [CrossRef]
  30. Mus, E.; Hof, P.R.; Tiedge, H. Dendritic BC200 RNA in aging and in Alzheimer’s disease. Proc. Natl. Acad. Sci. USA 2007, 104, 10679–10684. [Google Scholar] [CrossRef] [Green Version]
  31. Arisi, I.; D’Onofrio, M.; Brandi, R.; Felsani, A.; Capsoni, S.; Drovandi, G.; Felici, G.; Weitschek, E.; Bertolazzi, P.; Cattaneo, A. Gene expression biomarkers in the brain of a mouse model for Alzheimer’s disease: Mining of microarray data by logic classification and feature selection. J. Alzheimers Dis. 2011, 24, 721–738. [Google Scholar] [CrossRef] [Green Version]
  32. Yue, X.H.; Guo, L.; Wang, Z.Y.; Jia, T.H. Inhibition of miR-17-5p promotes mesenchymal stem cells to repair spinal cord injury. Eur. Rev. Med. Pharmacol. Sci. 2019, 23, 3899–3907. [Google Scholar] [CrossRef]
  33. Salmena, L.; Poliseno, L.; Tay, Y.; Kats, L.; Pandolfi, P.P. A ceRNA hypothesis: The Rosetta Stone of a hidden RNA language? Cell 2011, 146, 353–358. [Google Scholar] [CrossRef] [PubMed] [Green Version]
  34. Han, X.; Yang, F.; Cao, H.; Liang, Z. Malat1 regulates serum response factor through miR-133 as a competing endogenous RNA in myogenesis. FASEB J. 2015, 29, 3054–3064. [Google Scholar] [CrossRef] [Green Version]
  35. Li, S.; Zhu, A.; Ren, K.; Li, S.; Chen, L. IFNbeta-induced exosomal linc-EPHA6-1 promotes cytotoxicity of NK cells by acting as a ceRNA for hsa-miR-4485-5p to up-regulate NKp46 expression. Life Sci. 2020, 257, 118064. [Google Scholar] [CrossRef]
  36. Hermann, D.M.; ElAli, A. The abluminal endothelial membrane in neurovascular remodeling in health and disease. Sci. Signal 2012, 5, re4. [Google Scholar] [CrossRef]
  37. Song, J.; Hu, Y.; Li, H.; Huang, X.; Zheng, H.; Hu, Y.; Wang, J.; Jiang, X.; Li, J.; Yang, Z.; et al. miR-1303 regulates BBB permeability and promotes CNS lesions following CA16 infections by directly targeting MMP9. Emerg. Microbes Infect. 2018, 7, 155. [Google Scholar] [CrossRef] [PubMed] [Green Version]
  38. Deng, X.; Zhong, Y.; Gu, L.; Shen, W.; Guo, J. MiR-21 involve in ERK-mediated upregulation of MMP9 in the rat hippocampus following cerebral ischemia. Brain Res. Bull. 2013, 94, 56–62. [Google Scholar] [CrossRef]
  39. Kalani, A.; Kamat, P.K.; Familtseva, A.; Chaturvedi, P.; Muradashvili, N.; Narayanan, N.; Tyagi, S.C.; Tyagi, N. Role of microRNA29b in blood-brain barrier dysfunction during hyperhomocysteinemia: An epigenetic mechanism. J. Cereb. Blood Flow Metab. 2014, 34, 1212–1222. [Google Scholar] [CrossRef] [PubMed] [Green Version]
  40. Xu, B.; Zhang, Y.; Du, X.F.; Li, J.; Zi, H.X.; Bu, J.W.; Yan, Y.; Han, H.; Du, J.L. Neurons secrete miR-132-containing exosomes to regulate brain vascular integrity. Cell. Res. 2017, 27, 882–897. [Google Scholar] [CrossRef] [PubMed]
  41. Yang, Y.; Kimura-Ohba, S.; Thompson, J.F.; Salayandia, V.M.; Cosse, M.; Raz, L.; Jalal, F.Y.; Rosenberg, G.A. Vascular tight junction disruption and angiogenesis in spontaneously hypertensive rat with neuroinflammatory white matter injury. Neurobiol. Dis. 2018, 114, 95–110. [Google Scholar] [CrossRef] [PubMed]
  42. Stins, M.F.; Badger, J.; Sik Kim, K. Bacterial invasion and transcytosis in transfected human brain microvascular endothelial cells. Microb. Pathog. 2001, 30, 19–28. [Google Scholar] [CrossRef]
  43. Stins, M.F.; Gilles, F.; Kim, K.S. Selective expression of adhesion molecules on human brain microvascular endothelial cells. J. Neuroimmunol. 1997, 76, 81–90. [Google Scholar] [CrossRef]
  44. Kim, B.J.; Hancock, B.M.; Bermudez, A.; Del Cid, N.; Reyes, E.; van Sorge, N.M.; Lauth, X.; Smurthwaite, C.A.; Hilton, B.J.; Stotland, A.; et al. Bacterial induction of Snail1 contributes to blood-brain barrier disruption. J. Clin. Investig. 2015, 125, 2473–2483. [Google Scholar] [CrossRef] [Green Version]
  45. Liu, T.; Miao, Z.; Jiang, J.; Yuan, S.; Fang, W.; Li, B.; Chen, Y. Visfatin Mediates SCLC Cells Migration across Brain Endothelial Cells through Upregulation of CCL2. Int. J. Mol. Sci. 2015, 16, 11439–11451. [Google Scholar] [CrossRef] [PubMed] [Green Version]
  46. Yang, R.; Chen, J.; Xu, B.; Yang, B.; Fu, J.; Xiao, S.; Tan, C.; Chen, H.; Wang, X. circ_2858 Helps Blood-Brain Barrier Disruption by Increasing VEGFA via Sponging miR-93-5p during Escherichia coli Meningitis. Mol. Ther. Nucleic Acids 2020, 22, 708–721. [Google Scholar] [CrossRef]
  47. Lerner, A.; Neidhofer, S.; Reuter, S.; Matthias, T. MMP3 is a reliable marker for disease activity, radiological monitoring, disease outcome predictability, and therapeutic response in rheumatoid arthritis. Best Pract. Res. Clin. Rheumatol. 2018, 32, 550–562. [Google Scholar] [CrossRef]
  48. Zhang, Q.; Zheng, M.; Betancourt, C.E.; Liu, L.; Sitikov, A.; Sladojevic, N.; Zhao, Q.; Zhang, J.H.; Liao, J.K.; Wu, R. Increase in Blood-Brain Barrier (BBB) Permeability Is Regulated by MMP3 via the ERK Signaling Pathway. Oxid. Med. Cell Longev. 2021, 2021, 6655122. [Google Scholar] [CrossRef]
  49. Rosenberg, G.A.; Yang, Y. Vasogenic edema due to tight junction disruption by matrix metalloproteinases in cerebral ischemia. Neurosurg. Focus 2007, 22, E4. [Google Scholar] [CrossRef] [Green Version]
  50. Von Wedel-Parlow, M.; Schrot, S.; Lemmen, J.; Treeratanapiboon, L.; Wegener, J.; Galla, H.J. Neutrophils cross the BBB primarily on transcellular pathways: An in vitro study. Brain Res. 2011, 1367, 62–76. [Google Scholar] [CrossRef]
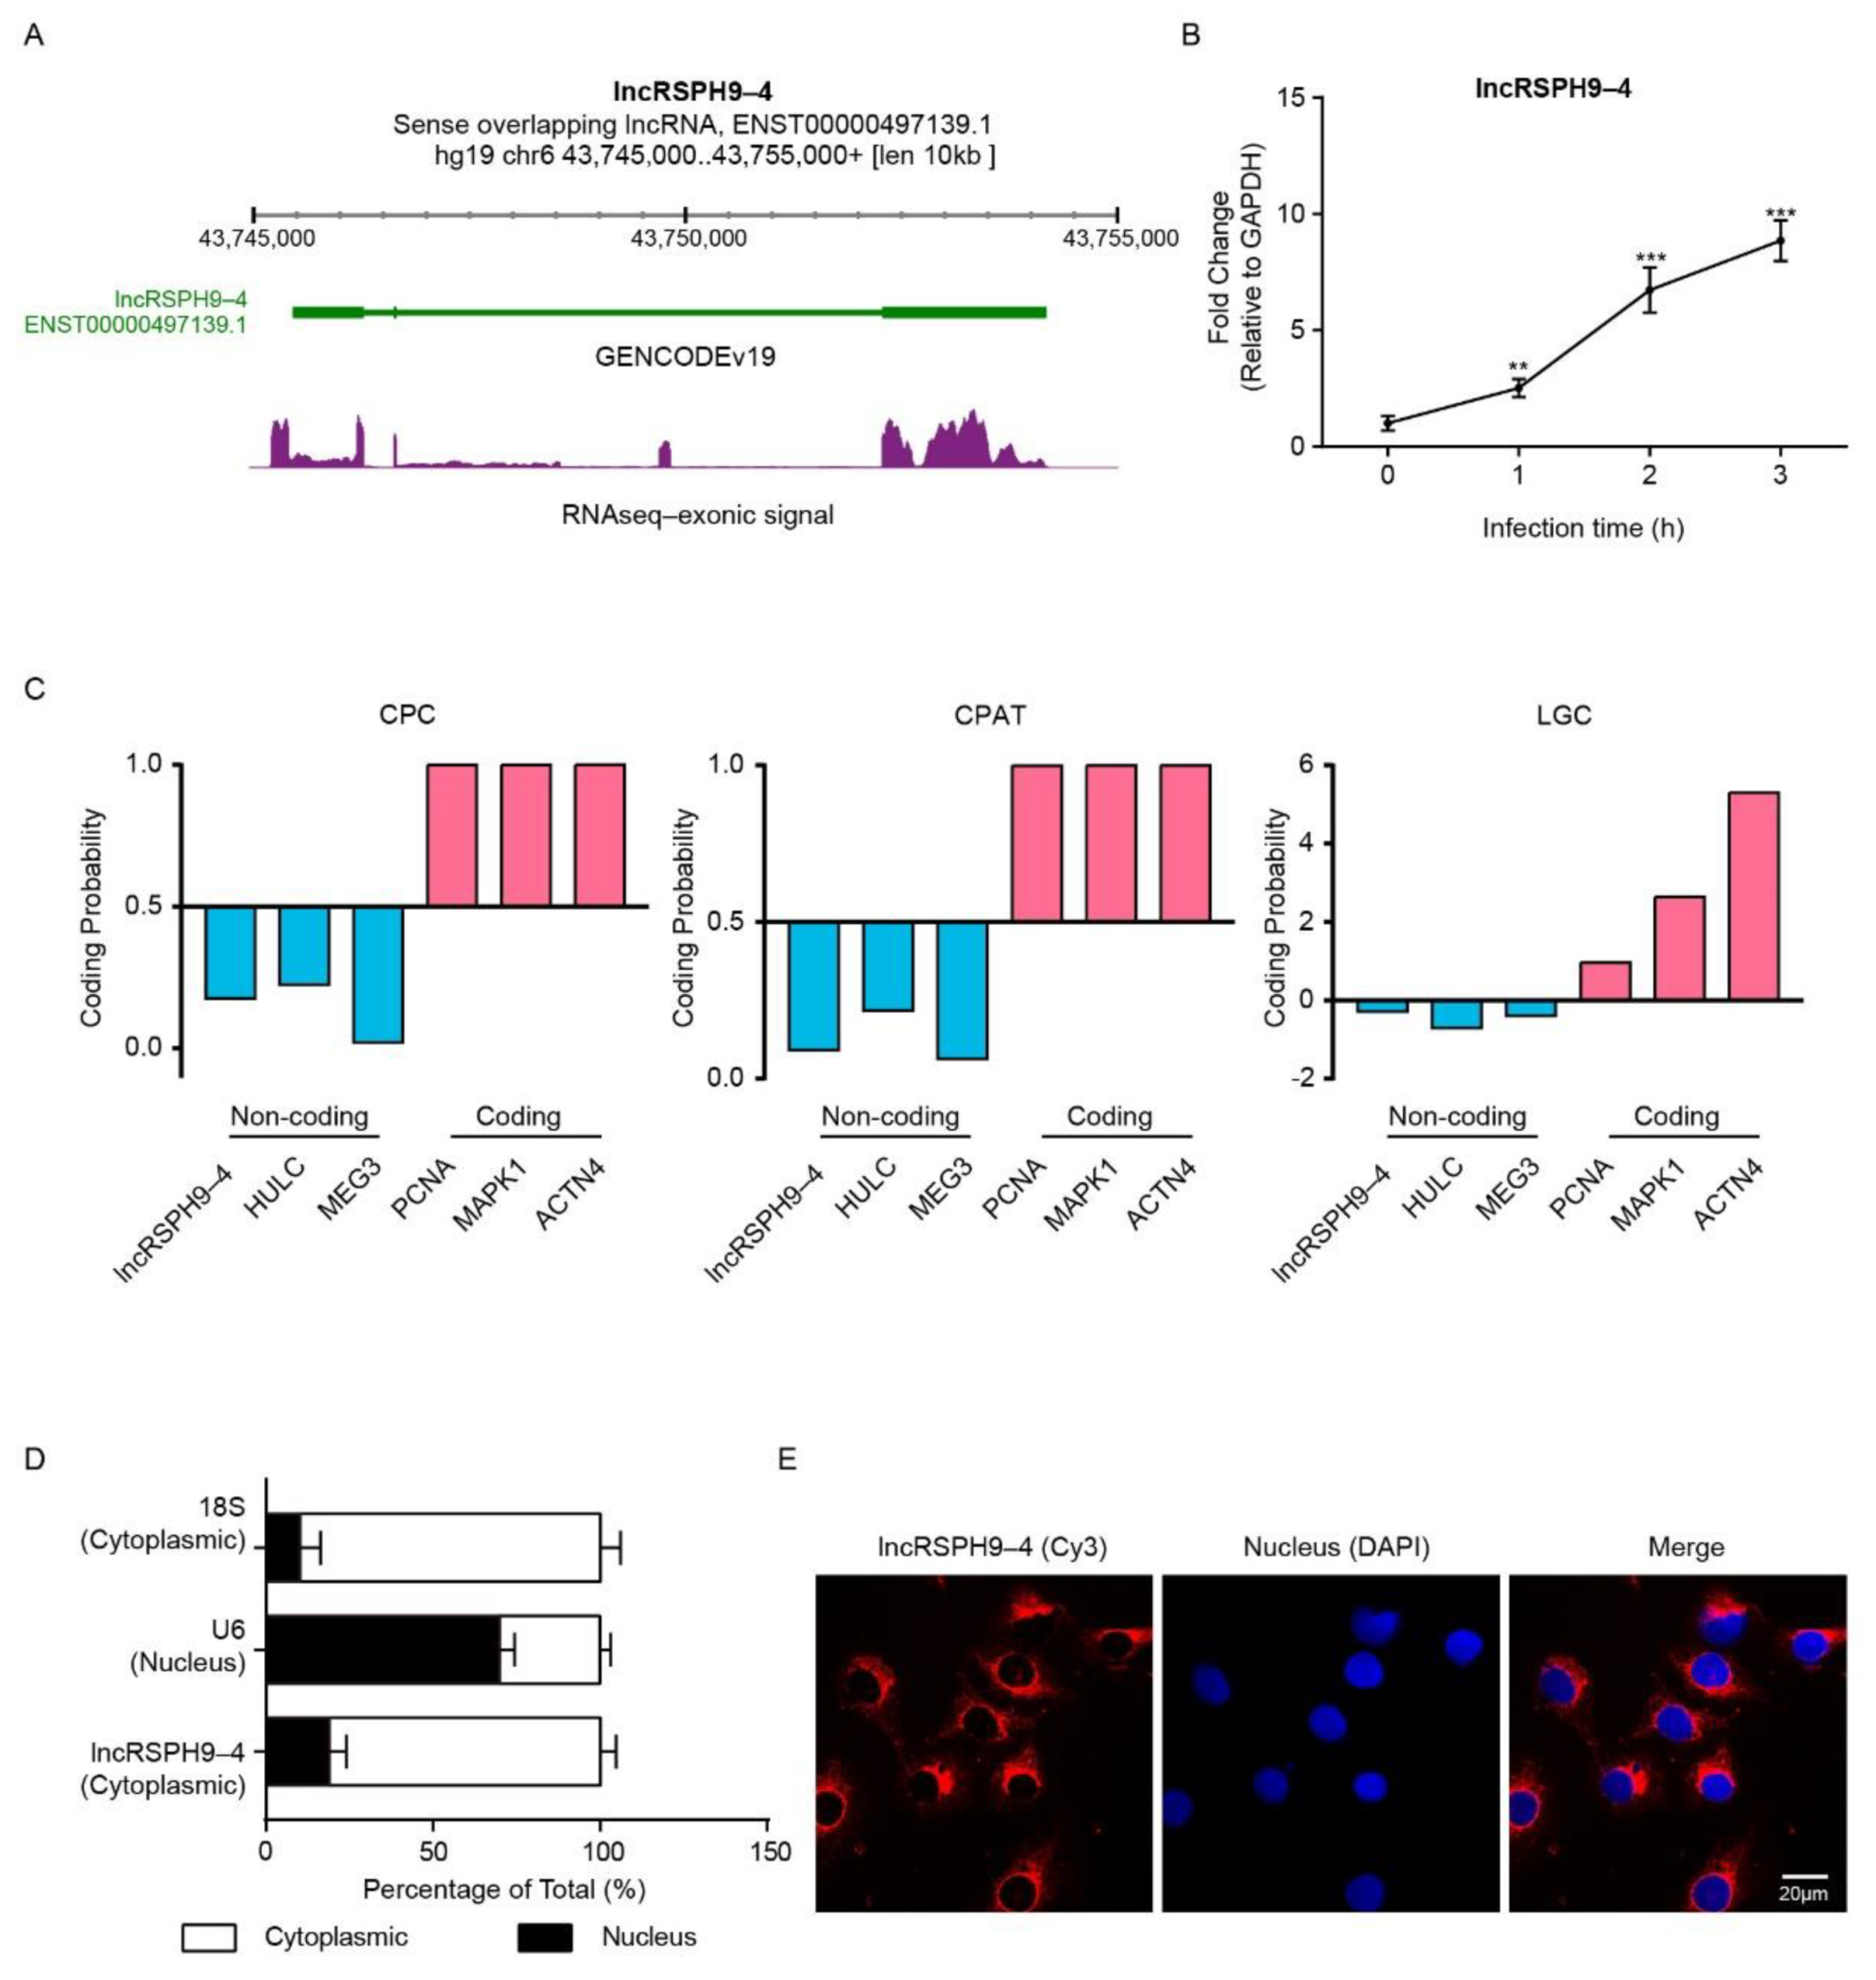
Figure 1. The expression and subcellular localization of lncRSPH9-4. (A) Visualization of lncRSPH9-4 in ZENBU browser, which showed exonic expression signal in several different visualizations. (B) LncRSPH9-4 expression in hBMECs was measured using qPCR after meningitic E. coli infection for 0 h, 1 h, 2 h and 3 h. GAPDH was used as the reference control. ** indicated p < 0.01 and *** indicated p < 0.001 by one-way ANOVA analysis. (C) The prediction of lncRSPH9-4 coding potential by using CPC, CPAT and LGC. (D) Nuclear/Cytoplasmic localization analyses of lncRSPH9-4 in hBMECs by qPCR. The 18S and U6 distribution were selected as the cytoplasmic control and the nuclear control, respectively. (E) Subcellular localization of lncRSPH9-4 in hBMECs by FISH assay. Red, Cy3-labeled positive hybridization signals; Blue, DAPI-stained nucleus. Scale bars, 20 μm.
Ijms 22 06343 g001
Figure 2. The impedance analyses of the hBMECs monolayer with lncRSPH9-4 overexpression or knocking-down. (A) The impedance changes of hBMECs by the overexpression of lncRSPH9-4, monitored by the ECIS system. Data were collected and presented as mean ± SD from three replicated wells at each time point. *** p < 0.001. (B) The impedance changes of hBMECs with knocking-down of lncRSPH9-4 determined by ECIS. Data were collected and presented as mean ± SD from three replicates at each time point. ** p < 0.01.
Ijms 22 06343 g002
Figure 3. The mRNA transcription profiles in lncRSPH9-4 overexpressed hBMECs. (A) Volcano plot showing the differentially expressed mRNAs in lncRSPH9-4 overexpressed hBMECs compared with control cells. The red and green plots represent the significantly up-regulated and down-regulated mRNAs, respectively. (B) The heatmap showing the unsupervised clustering of significantly expressed mRNAs in hBMECs with or without lncRSPH9-4 overexpression. (C,D) qPCR validation of the up-regulated (C) or down-regulated (D) mRNAs in hBMECs in response to lncRSPH9-4 overexpression. GAPDH was used as the reference control. * p < 0.05, ** p < 0.01 and *** p < 0.001 by one-way ANOVA analysis. (E) Western blotting showed the significant up-regulation of the MMPs family members MMP1, MMP3 and MMP10. The β-actin was used as the loading control and densitometry was performed to analyze differences.
Ijms 22 06343 g003
Figure 4. The miRNA transcription profiles in lncRSPH9-4 overexpressed hBMECs. (A) Volcano plot exhibiting the differentially expressed miRNAs in hBMECs in response to lncRSPH9-4 overexpression. The red and green plots represent the significantly up-regulated and down-regulated miRNAs, respectively. (B) Heatmap showing the unsupervised clustering of significantly changed miRNAs in hBMECs with or without lncRSPH9-4 overexpression. (C,D) qPCR validation of the down-regulated or up-regulated miRNAs in hBMECs with the overexpression of lncRSPH9-4. U6 was used as the reference control. * p < 0.05, ** p < 0.01 and *** p < 0.001.
Ijms 22 06343 g004
Figure 5. The competing endogenous RNA network of lncRSPH9-4. (A) Regulatory network analysis of lncRSPH9-4 associated with significantly changed mRNAs and miRNAs based on ceRNA theory. (B) Predicted binding sites between lncRSPH9-4 and miR-17-5p. Dual-luciferase reporter assays showing that miR-17-5p significantly reduced the luciferase activity of the wild-type lncRSPH9-4 construct but not of the mutant construct. Data were presented as mean ± SD from three independent experiments. *** p < 0.001; ns, not significant. (C) Predicted binding sites between the MMP3 3′UTR region and miR-17-5p. Dual-luciferase reporter assays showing that miR-17-5p significantly reduced the luciferase activity of the wild-type MMP3 3′UTR construct but not of its mutant construct. Data were presented as mean ± SD from three independent experiments. ** p < 0.01; ns, not significant.
Ijms 22 06343 g005
Figure 6. LncRSPH9-4 overexpression increased MMP3 expression via miR-17-5p. (A,B) The transcription and expression levels of MMP3 in hBMECs with lncRSPH9-4 overexpression or silencing by qPCR and Western blot analyses. GAPDH was used as the reference control for the qPCR, β-actin was the loading control for the blotting and densitometry was performed to analyze differences. The qPCR data were presented as mean ± SD from three independent assays. ** p < 0.01; *** p < 0.001. (C,D) The transcription and expression levels of MMP3 in hBMECs with miR-17-5p overexpression or inhibition by qPCR and Western blot analyses. GAPDH was used as the reference control for the qPCR, β-actin was the loading control for the blotting and densitometry was performed to analyze differences. The qPCR data were presented as mean ± SD from three independent assays. ** p < 0.01; *** p < 0.001. (E,F) The transcription and expression levels of MMP3 in hBMECs with miR-17-5p mimics transfection or with both miR-17-5p mimics and lncRSPH9-4 co-transfection, determined by qPCR and Western blotting. GAPDH was used as the reference control for the qPCR, β-actin was the loading control for the blotting and densitometry was performed to analyze differences. The qPCR data were presented as mean ± SD from three independent assays. ** p < 0.01.
Ijms 22 06343 g006
Figure 7. LncRSPH9-4 overexpression decreased TJs expression via miR-17-5p. (A) The expression of TJs in hBMECs with lncRSPH9-4 overexpression or silencing by Western blot analysis. β-actin was used as the loading control and densitometry was performed to analyze differences. * p < 0.05, ** p < 0.01 and *** p < 0.001. (B) Distribution of TJs in hBMECs with lncRSPH9-4 overexpression or silencing by immunofluorescence analysis. (C) The expression of TJs in hBMECs with miR-17-5p overexpression or inhibition by Western blot analysis. β-actin was used as the loading control and densitometry was performed to analyze differences. * p < 0.05, ** p < 0.01 and *** p < 0.001. (D) Distribution of TJs in hBMECs with miR-17-5p overexpression or inhibition by immunofluorescence analysis. (E) The expression of TJs in miR-17-5p-overexpressed hBMECs co-transfected with or without lncRSPH9-4 by Western blot analysis. β-actin was used as the loading control and densitometry was performed to analyze differences. ** p < 0.01 and *** p < 0.001. (F) Distribution of TJs in miR-17-5p-overexpressed hBMECs co-transfected with or without lncRSPH9-4 by immunofluorescence analysis.
Ijms 22 06343 g007
Figure 8. Schematic of the working mechanism of lncRSPH9-4 in the regulation of the endothelial barrier disruption. Meningitic E. coli infection of hBMECs induced the up-regulation of lncRSPH9-4, which could sponge miR-17-5p and thus increase the expression of MMP3 in hBMECs and finally lead to the tight junction degradation.
Ijms 22 06343 g008
Publisher’s Note: MDPI stays neutral with regard to jurisdictional claims in published maps and institutional affiliations.