
Bioenergetic Alterations of Metabolic Redox Coenzymes as NADH, FAD and FMN by Means of Fluorescence Lifetime Imaging Techniques

 , , ,
, , ,
Abstract
1. Introduction
2. Results and Discussion
3. Materials and Methods/Experimental
3.1. FLIM of NAD(P)H and Flavins
3.2. FLIM Data Analysis
3.3. Cell Culture Studies
3.4. Statistical Analysis
4. Summary and Conclusions
Supplementary Materials
Author Contributions
Funding
Institutional Review Board Statement
Informed Consent Statement
Data Availability Statement
Acknowledgments
Conflicts of Interest
Abbreviations
| AOM | optoacoustic modulator |
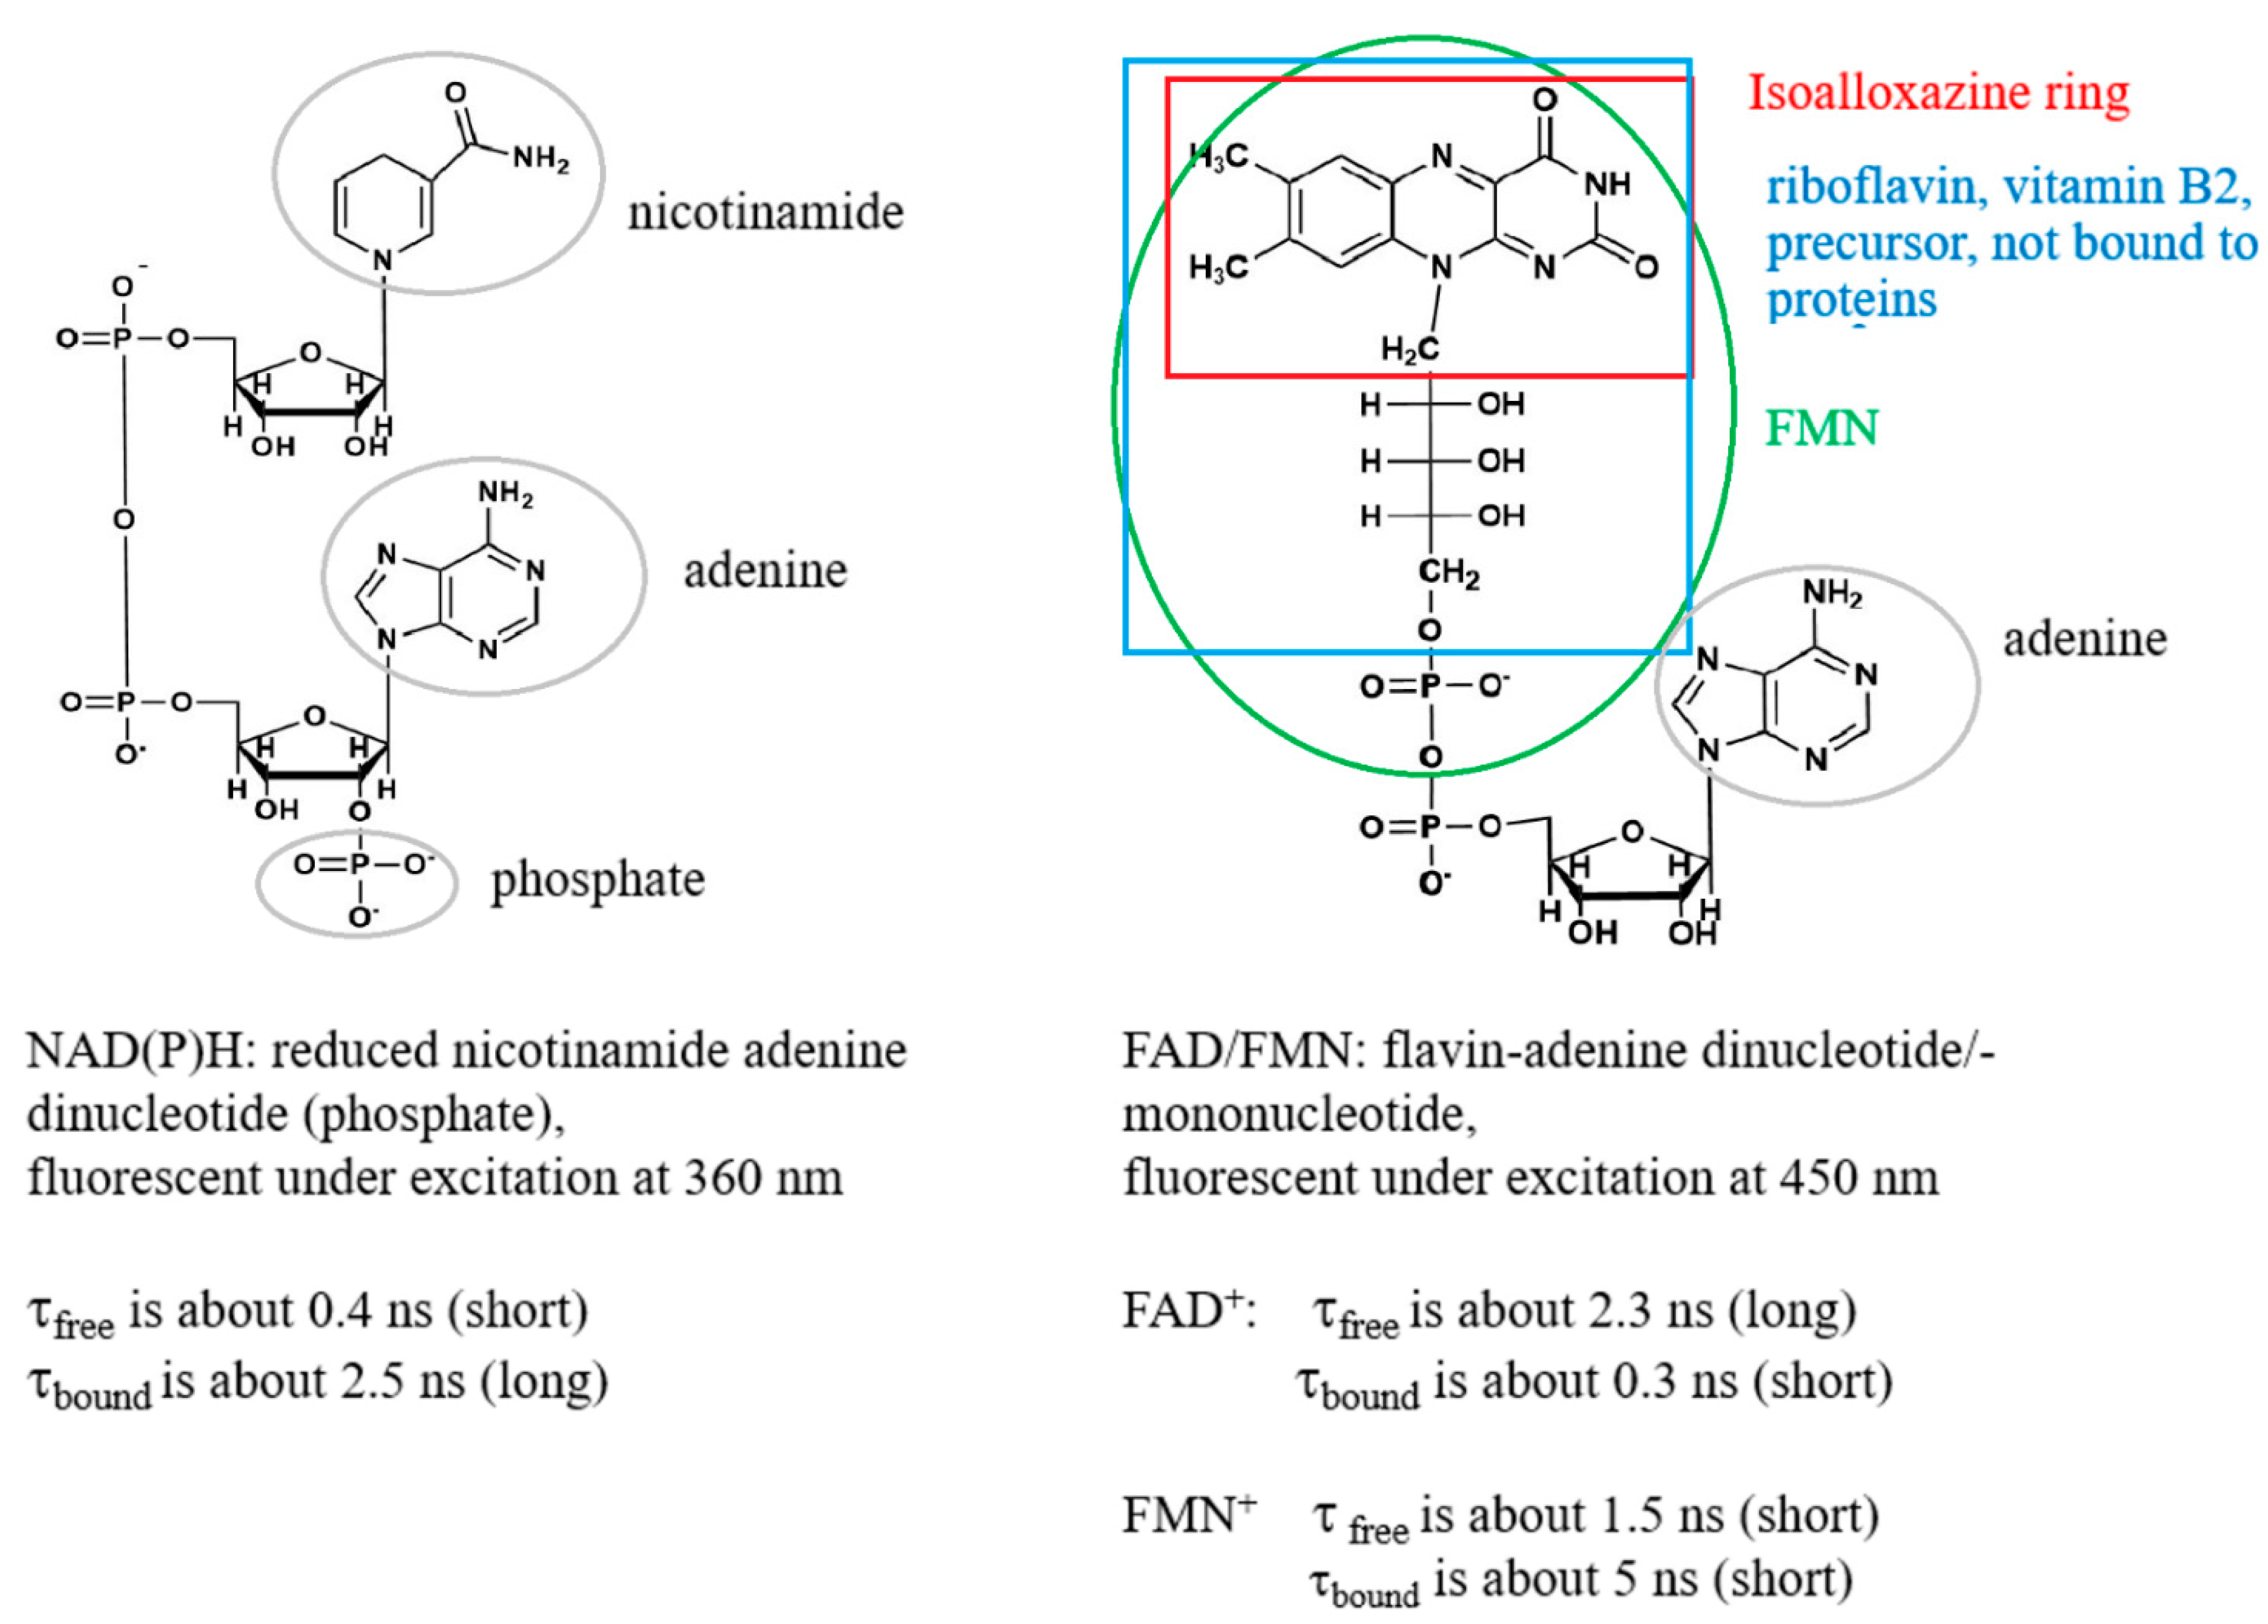
| FAD | flavin adenine dinucleotide |
| FLIM | fluorescence lifetime imaging |
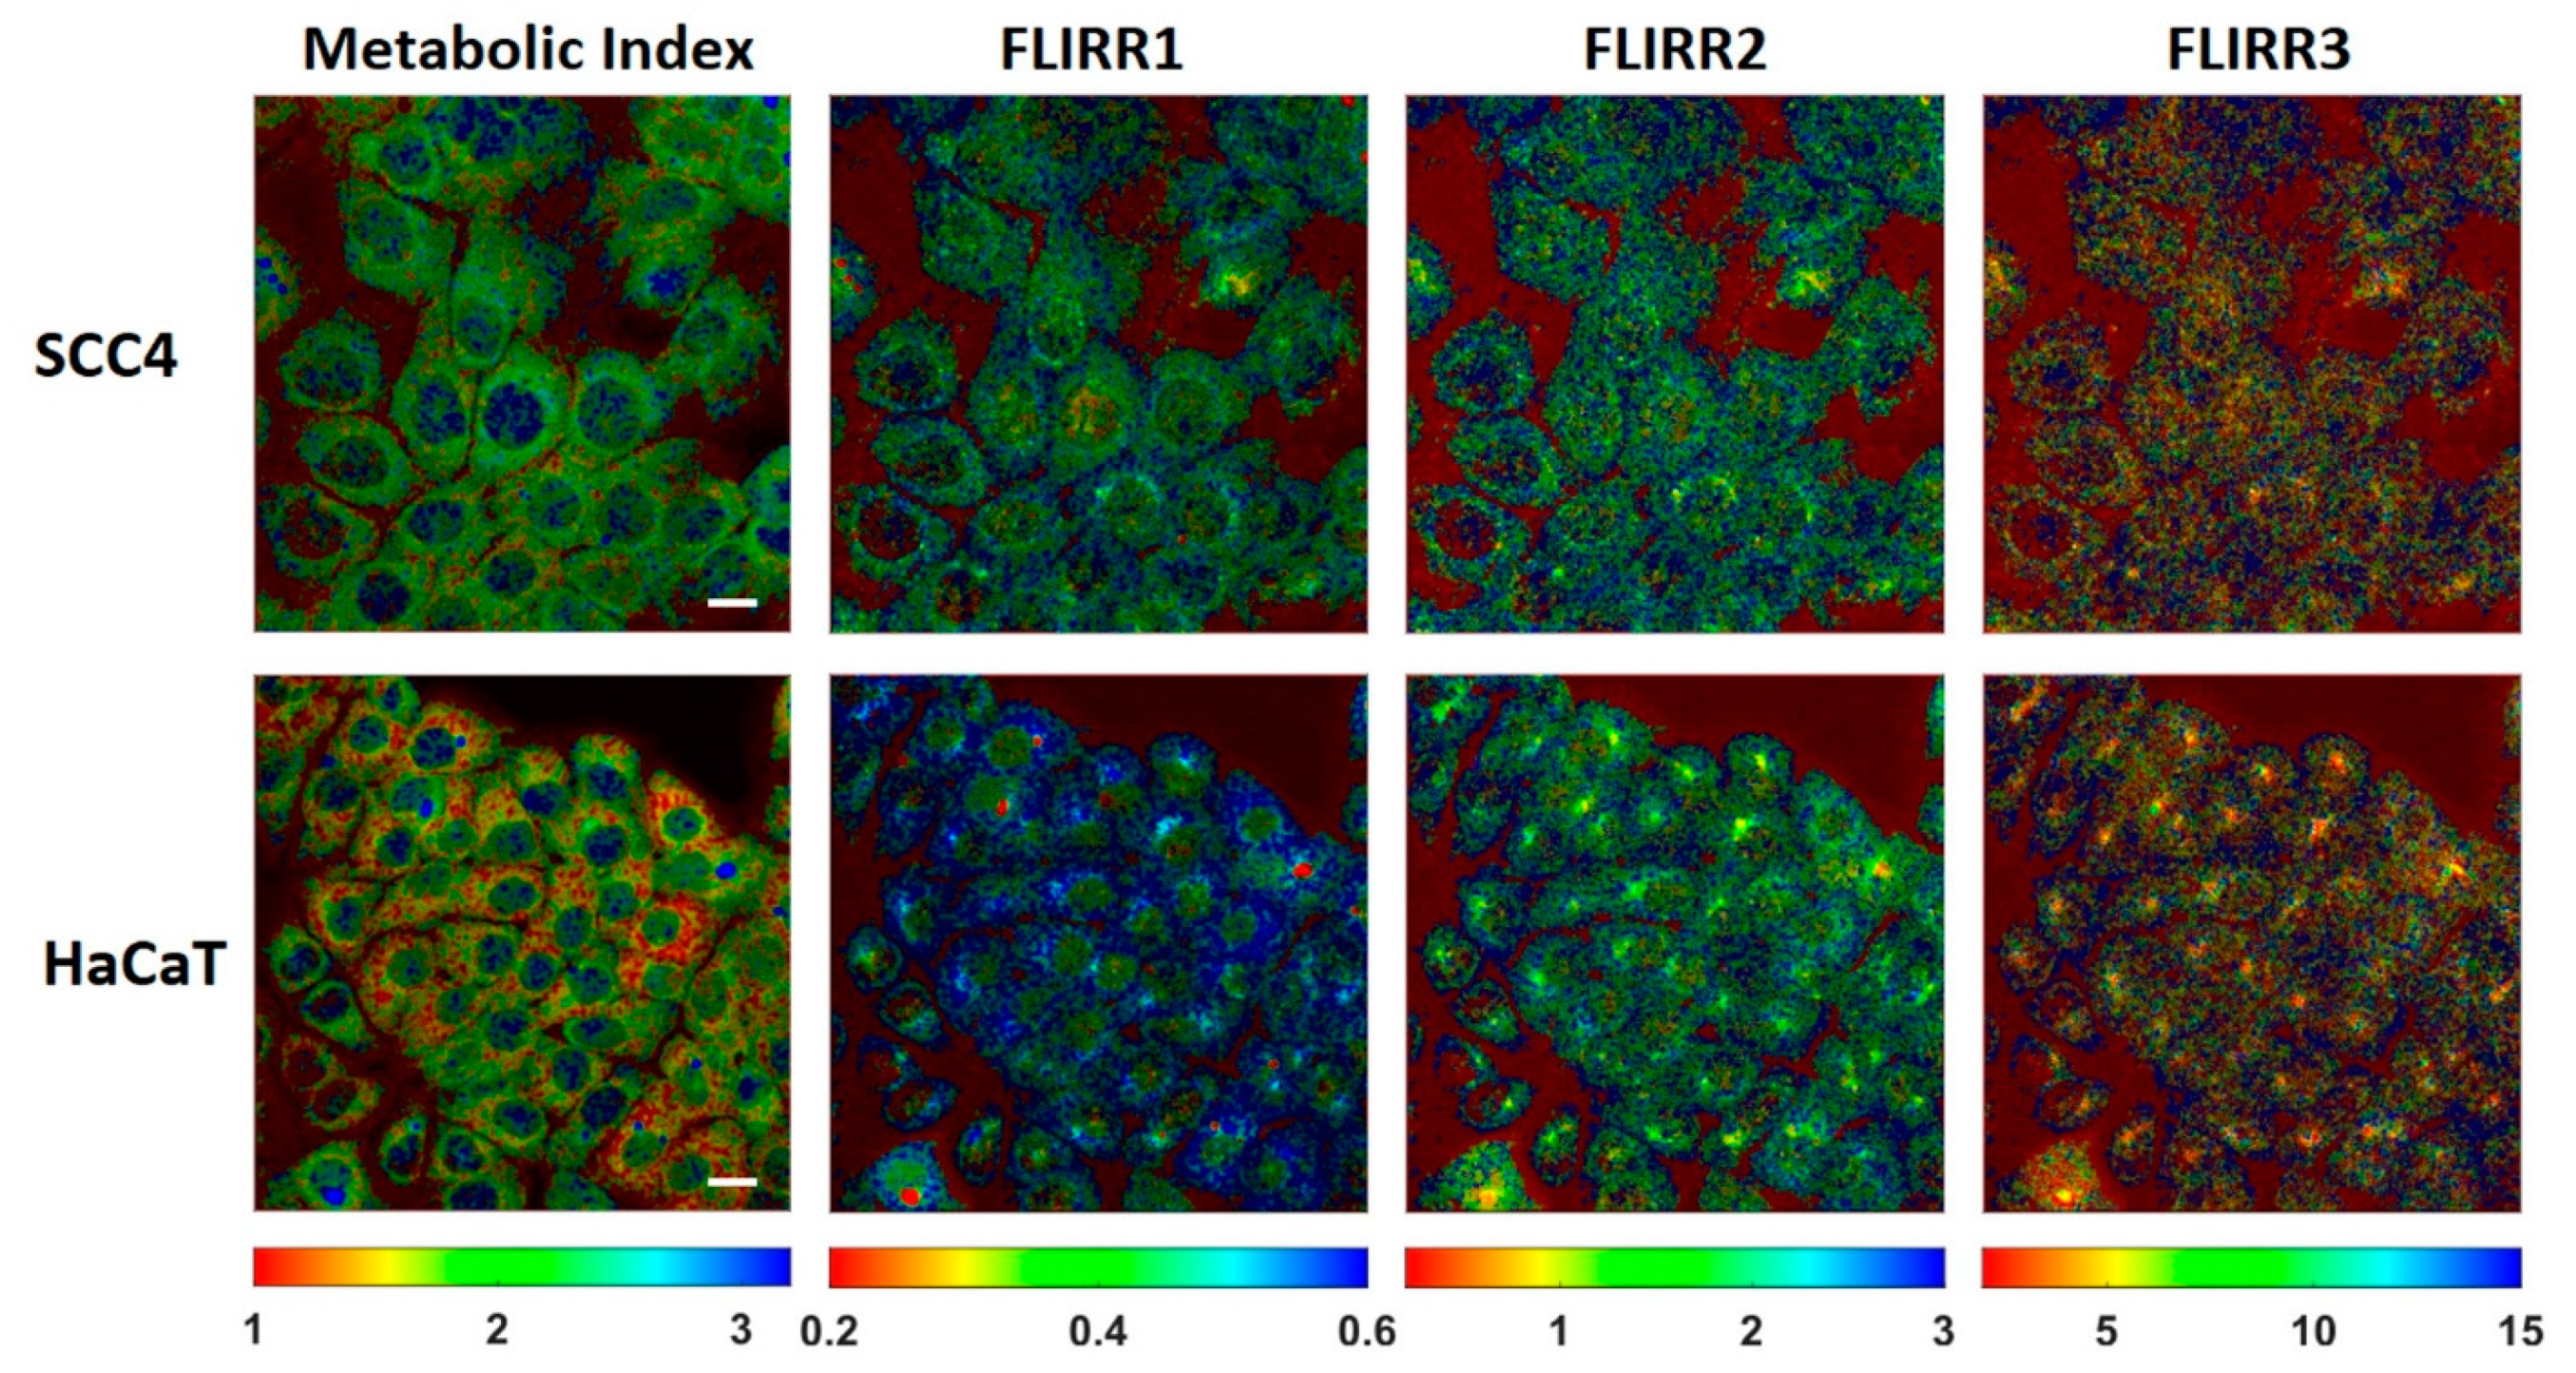
| FLIRR | fluorescence lifetime induced redox ratio |
| FMN | flavin mononucleotide |
| NAD(P)H | reduced nicotinamide adenine dinucleotide (phosphate) |
| OXPHOS | oxidative phosphorylation |
| TCSPC | time-correlated single photon counting |
References
- Becker, W. Advanced Time-Correlated Single Photon Counting Applications; Springer Series in Chemical Physics; Springer International Publishing: Berlin, Germany, 2015; ISBN 978-3-319-14928-8. [Google Scholar]
- Datta, R.; Heaster, T.M.; Sharick, J.T.; Gillette, A.A.; Skala, M.C. Fluorescence Lifetime Imaging Microscopy: Fundamentals and Advances in Instrumentation, Analysis, and Applications. J. Biomed. Opt. 2020, 25, 1. [Google Scholar] [CrossRef]
- Yuan, X.; Liu, Y.; Bijonowski, B.M.; Tsai, A.-C.; Fu, Q.; Logan, T.M.; Ma, T.; Li, Y. NAD+/NADH Redox Alterations Reconfigure Metabolism and Rejuvenate Senescent Human Mesenchymal Stem Cells in Vitro. Commun. Biol. 2020, 3, 774. [Google Scholar] [CrossRef] [PubMed]
- Quinn, K.P.; Sridharan, G.V.; Hayden, R.S.; Kaplan, D.L.; Lee, K.; Georgakoudi, I. Quantitative Metabolic Imaging Using Endogenous Fluorescence to Detect Stem Cell Differentiation. Sci. Rep. 2013, 3, 3432. [Google Scholar] [CrossRef] [PubMed]
- Heikal, A.A. Intracellular Coenzymes as Natural Biomarkers for Metabolic Activities and Mitochondrial Anomalies. Biomark. Med. 2010, 4, 241–263. [Google Scholar] [CrossRef]
- Schaefer, P.M.; Hilpert, D.; Niederschweiberer, M.; Neuhauser, L.; Kalinina, S.; Calzia, E.; Rueck, A.; von Einem, B.; Arnim, C.A.F. von Mitochondrial Matrix PH as a Decisive Factor in Neurometabolic Imaging. Neurophotonics 2017, 4, 045004. [Google Scholar] [CrossRef][Green Version]
- Yu, Q.; Heikal, A.A. Two-Photon Autofluorescence Dynamics Imaging Reveals Sensitivity of Intracellular NADH Concentration and Conformation to Cell Physiology at the Single-Cell Level. J. Photochem. Photobiol. B 2009, 95, 46–57. [Google Scholar] [CrossRef]
- Liu, Z.; Pouli, D.; Alonzo, C.A.; Varone, A.; Karaliota, S.; Quinn, K.P.; Münger, K.; Karalis, K.P.; Georgakoudi, I. Mapping Metabolic Changes by Noninvasive, Multiparametric, High-Resolution Imaging Using Endogenous Contrast. Sci. Adv. 2018, 4, eaap9302. [Google Scholar] [CrossRef]
- Alam, S.R.; Wallrabe, H.; Svindrych, Z.; Chaudhary, A.K.; Christopher, K.G.; Chandra, D.; Periasamy, A. Investigation of Mitochondrial Metabolic Response to Doxorubicin in Prostate Cancer Cells: An NADH, FAD and Tryptophan FLIM Assay. Sci. Rep. 2017, 7, 10451. [Google Scholar] [CrossRef] [PubMed]
- Blacker, T.S.; Mann, Z.F.; Gale, J.E.; Ziegler, M.; Bain, A.J.; Szabadkai, G.; Duchen, M.R. Separating NADH and NADPH Fluorescence in Live Cells and Tissues Using FLIM. Nat. Commun. 2014, 5, 3936. [Google Scholar] [CrossRef]
- Chorvat, D.; Chorvatova, A. Spectrally Resolved Time-Correlated Single Photon Counting: A Novel Approach for Characterization of Endogenous Fluorescence in Isolated Cardiac Myocytes. Eur. Biophys. J. 2006, 36, 73–83. [Google Scholar] [CrossRef]
- Lakowicz, J.R.; Szmacinski, H.; Nowaczyk, K.; Johnson, M.L. Fluorescence Lifetime Imaging of Free and Protein-Bound NADH. Proc. Natl. Acad. Sci. 1992, 89, 1271–1275. [Google Scholar] [CrossRef]
- Penjweini, R.; Roarke, B.; Alspaugh, G.; Gevorgyan, A.; Andreoni, A.; Pasut, A.; Sackett, D.L.; Knutson, J.R. Single Cell-Based Fluorescence Lifetime Imaging of Intracellular Oxygenation and Metabolism. Redox Biol. 2020, 34, 101549. [Google Scholar] [CrossRef]
- van den Berg, P.A.W.; Feenstra, K.A.; Mark, A.E.; Berendsen, H.J.C.; Visser, A.J.W.G. Dynamic Conformations of Flavin Adenine Dinucleotide: Simulated Molecular Dynamics of the Flavin Cofactor Related to the Time-Resolved Fluorescence Characteristics. J. Phys. Chem. B 2002, 106, 8858–8869. [Google Scholar] [CrossRef]
- Visser, A. Time-Resolved Fluorescence Studies on Flavins. In Fluorescent Biomolecules; Jameson, D.M., Reinhart, G.D., Eds.; Springer US: Boston, MA, USA, 1989; pp. 319–341. ISBN 978-1-4684-5621-9. [Google Scholar]
- Bird, D.K.; Yan, L.; Vrotsos, K.M.; Eliceiri, K.W.; Vaughan, E.M.; Keely, P.J.; White, J.G.; Ramanujam, N. Metabolic Mapping of MCF10A Human Breast Cells via Multiphoton Fluorescence Lifetime Imaging of the Coenzyme NADH. Cancer Res. 2005, 65, 8766–8773. [Google Scholar] [CrossRef] [PubMed]
- Pastore, M.N.; Studier, H.; Bonder, C.S.; Roberts, M.S. Non-Invasive Metabolic Imaging of Melanoma Progression. Exp. Dermatol. 2017, 26, 607–614. [Google Scholar] [CrossRef] [PubMed]
- Shirmanova, M.V.; Druzhkova, I.N.; Lukina, M.M.; Dudenkova, V.V.; Ignatova, N.I.; Snopova, L.B.; Shcheslavskiy, V.I.; Belousov, V.V.; Zagaynova, E.V. Chemotherapy with Cisplatin: Insights into Intracellular PH and Metabolic Landscape of Cancer Cells in Vitro and in Vivo. Sci. Rep. 2017, 7, 8911. [Google Scholar] [CrossRef] [PubMed]
- Walsh, A.J.; Skala, M.C. Optical Metabolic Imaging Quantifies Heterogeneous Cell Populations. Biomed. Opt. Express 2015, 6, 559–573. [Google Scholar] [CrossRef]
- Chosrowjan, H.; Taniguchi, S.; Mataga, N.; Nakanishi, T.; Haruyama, Y.; Sato, S.; Kitamura, M.; Tanaka, F. Effects of the Disappearance of One Charge on Ultrafast Fluorescence Dynamics of the FMN Binding Protein. J. Phys. Chem. B 2010, 114, 6175–6182. [Google Scholar] [CrossRef] [PubMed]
- Mataga, N.; Chosrowjan, H.; Shibata, Y.; Tanaka, F.; Nishina, Y.; Shiga, K. Dynamics and Mechanisms of Ultrafast Fluorescence Quenching Reactions of Flavin Chromophores in Protein Nanospace. J. Phys. Chem. B 2000, 104, 10667–10677. [Google Scholar] [CrossRef]
- Chakraborty, S.; Nian, F.-S.; Tsai, J.-W.; Karmenyan, A.; Chiou, A. Quantification of the Metabolic State in Cell-Model of Parkinson’s Disease by Fluorescence Lifetime Imaging Microscopy. Sci. Rep. 2016, 6, 19145. [Google Scholar] [CrossRef]
- Skala, M.C.; Riching, K.M.; Gendron-Fitzpatrick, A.; Eickhoff, J.; Eliceiri, K.W.; White, J.G.; Ramanujam, N. In Vivo Multiphoton Microscopy of NADH and FAD Redox States, Fluorescence Lifetimes, and Cellular Morphology in Precancerous Epithelia. Proc. Natl. Acad. Sci. 2007, 104, 19494–19499. [Google Scholar] [CrossRef] [PubMed]
- Kunz, W.S.; Kunz, W. Contribution of Different Enzymes to Flavoprotein Fluorescence of Isolated Rat Liver Mitochondria. Biochim. Biophys. Acta BBA Gen. Subj. 1985, 841, 237–246. [Google Scholar] [CrossRef]
- Nakabayashi, T.; Islam, M.S.; Ohta, N. Fluorescence Decay Dynamics of Flavin Adenine Dinucleotide in a Mixture of Alcohol and Water in the Femtosecond and Nanosecond Time Range. J. Phys. Chem. B 2010, 114, 15254–15260. [Google Scholar] [CrossRef] [PubMed]
- Islam, M.S.; Honma, M.; Nakabayashi, T.; Kinjo, M.; Ohta, N. PH Dependence of the Fluorescence Lifetime of FAD in Solution and in Cells. Int. J. Mol. Sci. 2013, 14, 1952–1963. [Google Scholar] [CrossRef]
- Esposito, R.; Delfino, I.; Portaccio, M.; Iannuzzi, C.; Lepore, M. An Insight into PH-Induced Changes in FAD Conformational Structure by Means of Time-Resolved Fluorescence and Circular Dichroism. Eur. Biophys. J. 2019, 48, 395–403. [Google Scholar] [CrossRef]
- Sato, K.; Nishina, Y.; Shiga, K.; Tanaka, F. Hydrogen-Bonding Dynamics of Free Flavins in Benzene and FAD in Electron-Transferring Flavoprotein upon Excitation. J. Photochem. Photobiol. B 2003, 70, 67–73. [Google Scholar] [CrossRef]
- Hühner, J.; Ingles-Prieto, Á.; Neusüß, C.; Lämmerhofer, M.; Janovjak, H. Quantification of Riboflavin, Flavin Mononucleotide, and Flavin Adenine Dinucleotide in Mammalian Model Cells by CE with LED-Induced Fluorescence Detection: CE and CEC. Electrophoresis 2015, 36, 518–525. [Google Scholar] [CrossRef]
- Islam, S.D.M.; Susdorf, T.; Penzkofer, A.; Hegemann, P. Fluorescence Quenching of Flavin Adenine Dinucleotide in Aqueous Solution by PH Dependent Isomerisation and Photo-Induced Electron Transfer. Chem. Phys. 2003, 295, 137–149. [Google Scholar] [CrossRef]
- Visser, A.J.W.G. Kinetics of Stacking Interactions in Flavin Adenine Dinucleotide from Time-Resolved Flavin Fluorescence. Photochem. Photobiol. 1984, 40, 703–706. [Google Scholar] [CrossRef]
- Wahl, P.; Auchet, J.C. Time Resolved Fluorescence of Flavin Adenine Dinucleotide. FEBS Lett. 1974, 44, 67–70. [Google Scholar] [CrossRef]
- Kalinina, S.; Breymayer, J.; Schäfer, P.; Calzia, E.; Shcheslavskiy, V.; Becker, W.; Rück, A. Correlative NAD(P)H-FLIM and Oxygen Sensing-PLIM for Metabolic Mapping. J. Biophotonics 2016, 9, 800–811. [Google Scholar] [CrossRef] [PubMed]
- Kalinina, S.; Breymayer, J.; Reeß, K.; Lilge, L.; Mandel, A.; Rück, A. Correlation of Intracellular Oxygen and Cell Metabolism by Simultaneous PLIM of Phosphorescent TLD1433 and FLIM of NAD(P)H. J. Biophotonics 2018, 11, e201800085. [Google Scholar] [CrossRef] [PubMed]
- Agostini, M.; Silva, S.D.; Zecchin, K.G.; Coletta, R.D.; Jorge, J.; Loda, M.; Graner, E. Fatty Acid Synthase Is Required for the Proliferation of Human Oral Squamous Carcinoma Cells. Oral Oncol. 2004, 40, 728–735. [Google Scholar] [CrossRef] [PubMed]
- Ghisla, S.; Massey, V. Mechanisms of flavoprotein-catalyzed reactions. In EJB Reviews 1989; Christen, P., Hofmann, E., Eds.; EJB Reviews; Springer: Berlin/Heidelberg, Germany, 1989; pp. 29–45. ISBN 978-3-642-75189-9. [Google Scholar]
- Mattevi, A. To Be or Not to Be an Oxidase: Challenging the Oxygen Reactivity of Flavoenzymes. Trends Biochem. Sci. 2006, 31, 276–283. [Google Scholar] [CrossRef]


| τmean (ps) | τ1 (ps) | τ2 (ns) | τ3 (ns) | ||||
| HaCaT | 791 ± 44 | 297 ± 33 | 1.53 ± 0.09 | 5.40 ± 0.54 | |||
| SCC4 | 686 ± 52 | 246 ± 32 | 1.40 ± 0.10 | 4.87 ± 0.46 | |||
| a1 (%) | a2 (%) | a3 (%) | |||||
| HaCaT | 71.62 ± 0.78 | 23.18 ± 1.69 | 10.34 ± 0.39 | ||||
| SCC4 | 72.30 ± 0.88 | 21.94 ± 0.85 | 9.98 ± 0.79 | ||||
| τmean (ps) | a1 (%) | a2 (%) | a3 (%) | |
|---|---|---|---|---|
| HaCaT | 766 ± 47 | 68.7 ± 2.9 | 27.0 ± 2.6 | 4.98 ± 0.40 |
| SCC4 | 706 ± 26 | 72.6 ± 1.6 | 23.5 ± 1.5 | 4.35 ± 0.34 |
| τmean (ps) | a1 (%) | a2 (%) | a1/a2 | |
|---|---|---|---|---|
| HaCaT | 1160 ± 34 | 63.8 ± 1.6 | 36.2 ± 1.6 | 1.77 ± 0.12 |
| SCC4 | 1073 ± 28 | 68.0 ± 1.3 | 32.0 ± 1.3 | 2.12 ± 0.13 |
| FLIRR1 (a2/a1) | FLIRR2 (a2/a2) | FLIRR3 (a2/a3) | |
|---|---|---|---|
| HaCaT | 0.51 ± 0.02 | 1.57 ± 0.14 | 3.5 ± 0.2 |
| SCC4 | 0.44 ± 0.02 | 1.46 ± 0.08 | 3.2 ± 0.3 |
| FLIRR1 (a2/a1) | FLIRR2 (a2/a2) | FLIRR3 (a2/a3) | |
|---|---|---|---|
| HaCaT | 0.53 ± 0.04 | 1.35 ± 0.13 | 7.3 ± 0.7 |
| SCC4 | 0.44 ± 0.02 | 1.37 ± 0.10 | 7.0 ± 0.7 |
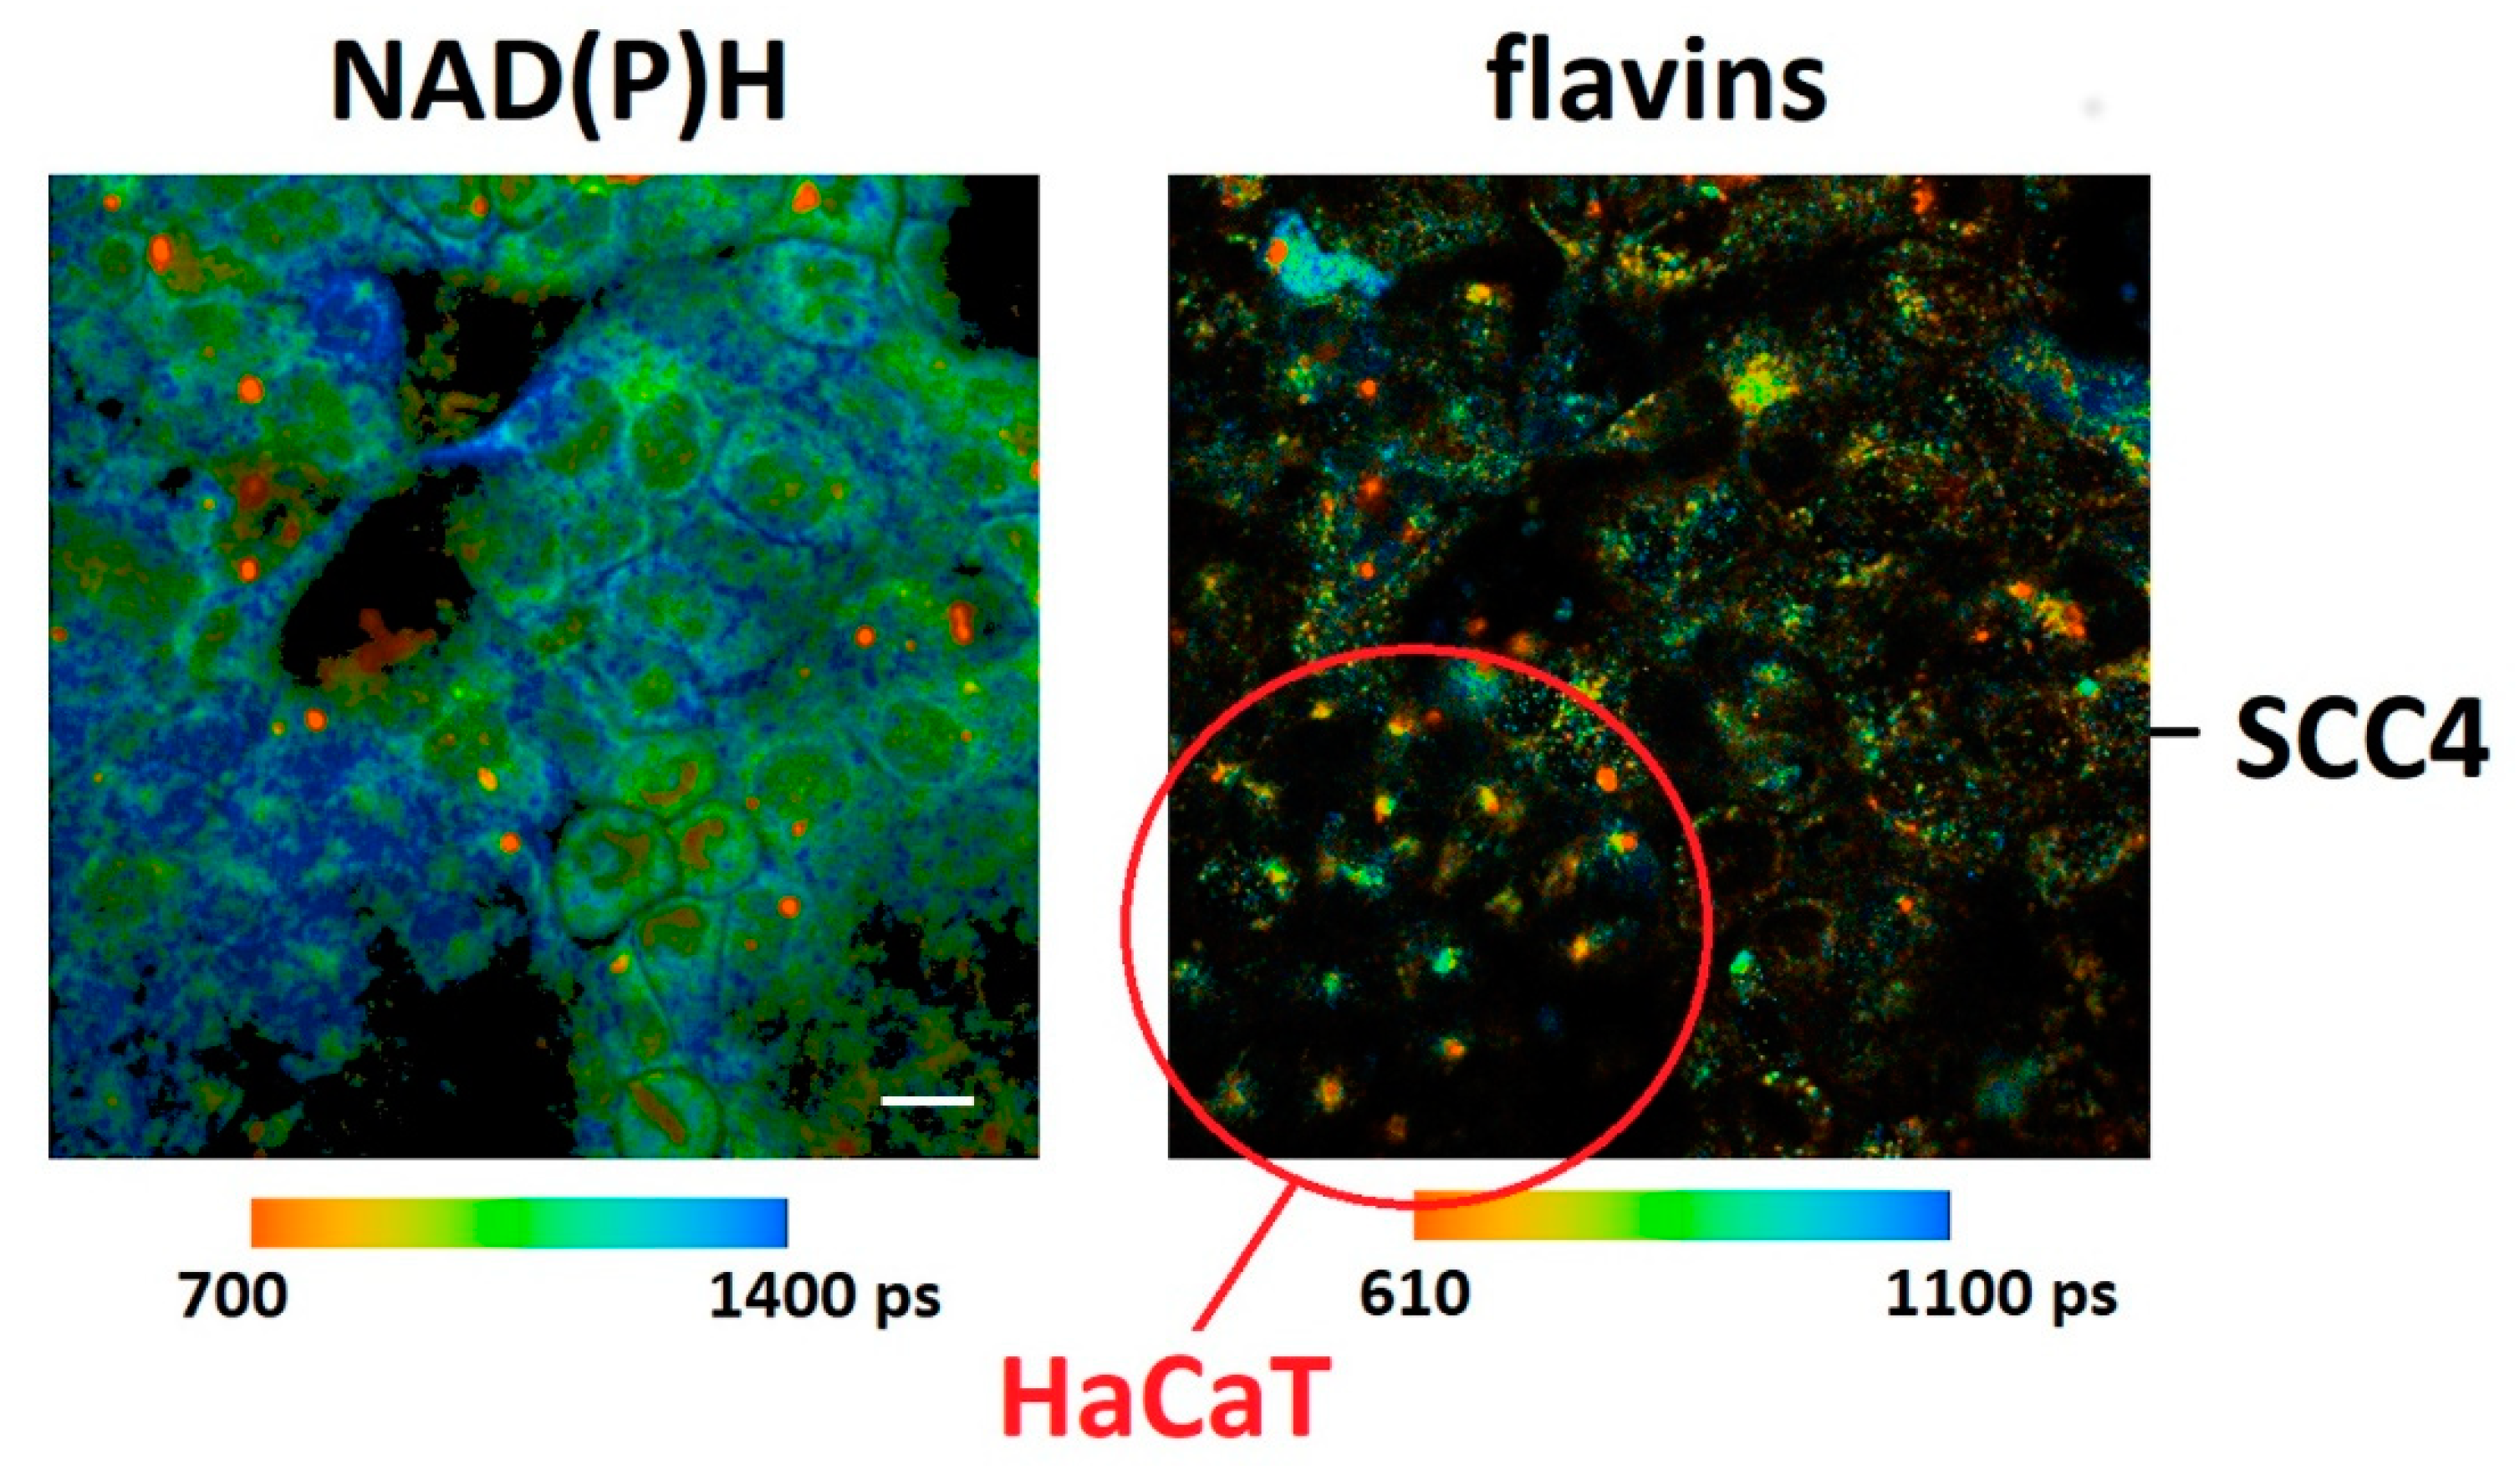
| NAD(P)H τmean (ps) | Flavins τmean (ps) | Metabolic Index (NAD(P)H a1/NAD(P)H a2) | FLIRR1 (NAD(P)H a2/flavins a1) | |
|---|---|---|---|---|
| HaCaT | 1154 ± 51 | 704 ± 90 | 1.8 ± 0.2 | 0.49 ± 0.03 |
| SCC4 | 1099 ± 47 | 673 ± 89 | 2.0 ± 0.2 | 0.46 ± 0.03 |
Publisher’s Note: MDPI stays neutral with regard to jurisdictional claims in published maps and institutional affiliations. |
© 2021 by the authors. Licensee MDPI, Basel, Switzerland. This article is an open access article distributed under the terms and conditions of the Creative Commons Attribution (CC BY) license (https://creativecommons.org/licenses/by/4.0/).
Share and Cite
Kalinina, S.; Freymueller, C.; Naskar, N.; von Einem, B.; Reess, K.; Sroka, R.; Rueck, A. Bioenergetic Alterations of Metabolic Redox Coenzymes as NADH, FAD and FMN by Means of Fluorescence Lifetime Imaging Techniques. Int. J. Mol. Sci. 2021, 22, 5952. https://doi.org/10.3390/ijms22115952
Kalinina S, Freymueller C, Naskar N, von Einem B, Reess K, Sroka R, Rueck A. Bioenergetic Alterations of Metabolic Redox Coenzymes as NADH, FAD and FMN by Means of Fluorescence Lifetime Imaging Techniques. International Journal of Molecular Sciences. 2021; 22(11):5952. https://doi.org/10.3390/ijms22115952
Chicago/Turabian StyleKalinina, Sviatlana, Christian Freymueller, Nilanjon Naskar, Bjoern von Einem, Kirsten Reess, Ronald Sroka, and Angelika Rueck. 2021. "Bioenergetic Alterations of Metabolic Redox Coenzymes as NADH, FAD and FMN by Means of Fluorescence Lifetime Imaging Techniques" International Journal of Molecular Sciences 22, no. 11: 5952. https://doi.org/10.3390/ijms22115952
APA StyleKalinina, S., Freymueller, C., Naskar, N., von Einem, B., Reess, K., Sroka, R., & Rueck, A. (2021). Bioenergetic Alterations of Metabolic Redox Coenzymes as NADH, FAD and FMN by Means of Fluorescence Lifetime Imaging Techniques. International Journal of Molecular Sciences, 22(11), 5952. https://doi.org/10.3390/ijms22115952