Article

Integration of the Microbiome, Metabolome and Transcriptomics Data Identified Novel Metabolic Pathway Regulation in Colorectal Cancer

1
Institute of Cancer and Genomic Sciences, College of Medical and Dental Sciences, University of Birmingham, Birmingham B15 2TH, UK
2
MRC Health Data Research UK (HDR UK), Midlands B15 2TT, UK
3
College of Medical and Dental Sciences, University of Birmingham, Birmingham B15 2TT, UK
4
Institute of Translational Medicine, University Hospitals Birmingham NHS, Foundation Trust, Birmingham B15 2TT, UK
5
KTH Royal Institute of Technology, School of Electrical Engineering and Computer Science, 100 44 Stockholm, Sweden
6
Science for Life Laboratory, 171 65 Solna, Sweden
7
Department of Gastroenterology and Hepatology, AG&M research institute, Amsterdam UMC, 1105 AZ Amsterdam, The Netherlands
8
NIHR Surgical Reconstruction and Microbiology Research Centre, University Hospital Birmingham, Birmingham B15 2WB, UK
9
NIHR Experimental Cancer Medicine Centre, Birmingham B15 2TT, UK
10
NIHR Biomedical Research Centre, University Hospital Birmingham, Birmingham B15 2TT, UK
*
Author to whom correspondence should be addressed.
Sharing First authorship.
Int. J. Mol. Sci. 2021, 22(11), 5763; https://doi.org/10.3390/ijms22115763
Submission received: 29 April 2021 / Revised: 25 May 2021 / Accepted: 26 May 2021 / Published: 28 May 2021
(This article belongs to the Special Issue In Silico Analyses: Translating and Making Sense of Omics Data 2.0)

Abstract

:
Integrative multiomics data analysis provides a unique opportunity for the mechanistic understanding of colorectal cancer (CRC) in addition to the identification of potential novel therapeutic targets. In this study, we used public omics data sets to investigate potential associations between microbiome, metabolome, bulk transcriptomics and single cell RNA sequencing datasets. We identified multiple potential interactions, for example 5-aminovalerate interacting with Adlercreutzia; cholesteryl ester interacting with bacterial genera Staphylococcus, Blautia and Roseburia. Using public single cell and bulk RNA sequencing, we identified 17 overlapping genes involved in epithelial cell pathways, with particular significance of the oxidative phosphorylation pathway and the ACAT1 gene that indirectly regulates the esterification of cholesterol. These findings demonstrate that the integration of multiomics data sets from diverse populations can help us in untangling the colorectal cancer pathogenesis as well as postulate the disease pathology mechanisms and therapeutic targets.

1. Introduction

Colorectal cancer (CRC) is the second most common cause of death due to cancer worldwide, with an incidence of almost two million cases in 2018 [1]. Early detection and treatment are critical factors in the course and prognosis of CRC, as the survival rate decreases with disease progression [2]. It is thought that CRC arises due to complex interactions of the transcriptome, metabolome, microbiome and immune system [3]. Assessment of these omics platforms and their associations may reveal important pathways that can be used for early cancer detection as well as therapeutic targets. Recent development of high throughput sequencing technology has enabled the quantification of the expression labels of multiple omics data including metabolomics, transcriptomics microbiome and inflammatory markers.
Growing evidence indicates that the gastrointestinal microbiome is strongly associated with the development of colorectal cancer, as abundance of specific microbiota have been found to be increased or decreased in colorectal cancer patients in comparison to healthy controls [4]. A recent study, by Ternes et al. (2020), collated all current knowledge on the gut microbiome in colorectal cancer; Fusobacterium, Peptostreptococcus, Porphromonas, Prevotella, Parvimonas, Bacteroides and Gemella were identified to be the most prominent CRC-associated bacteria [4].
The human and microbial metabolome may also play a vital role in colorectal carcinogenesis [5]. For example, polyamines, which are thought to contribute to carcinogenesis, show a higher abundance in the CRC patients in comparison to healthy individuals [5]. Conversely, poly- and monounsaturated fatty acids, short chain fatty acids and hydrocinnamic acid have been found to be decreased in multiple CRC cohorts [5].
Within the transcriptomics realm, it has been estimated that 10% of the human epithelium transcriptome is regulated by the gut microbiome via the metabolome [6]. The biological mechanisms for this relationship are not fully understood, though there are multiple ideas theorising this relationship, as the majority of these genes are involved in immunity, cell proliferation and metabolic pathways [6].
There are very few studies that explored the interplay between different sets of microbiome, metabolome and transcriptomics datasets. Wang et al. recently identified significant associations between the microbiome, butyrate-related metabolites and gene expression in patients with CRC [7]. However, this was a pilot study which used only four samples to identify relationships between metabolites, microbial taxa and DNA methylation data sets. Other studies solely focused on single or two omics data sets. For example, Clos Garcia performed an integrative analysis of faecal UHPLC-MS metagenomics and 16S metagenomics in CRC in 224 faeces samples [7]. Differences in faecal levels of cholesteryl esters and sphingolipids were identified. Additionally, Fusobacterium, Parvimonas and Staphylococcus were increased in CRC whilst the Lachnospiraceae family were reduced. Integration of this data identified tight interactions which were superior to the conventional faecal occult blood test for CRC diagnostics. Similarly, Kim et al. identified strong gut microbiome–metabolome associations in CRC and colorectal adenoma patients, supporting the importance of metabolites and their interplay in the development of CRC [8]. Data on clinical measurements, gene expression, DNA methylation and miRNA expression have also been integrated to identify a prognostic model, which was shown to improve prediction of prognosis in CRC patients [9].
Exploration of the relationship between the microbiome, metabolome and transcriptomics is vital to improve CRC prevention, diagnosis and treatment. Integration of multiomics data sets may provide knowledge on CRC pathogenesis, in addition to which bacteria may drive or protect against carcinogenesis. This could enable targeted probiotic administration, antibiotic treatment, or nutritional interventions to alter the gastrointestinal microbiome to prevent or treat CRC [10]. Metabolites could also be administered if they are known to protect against, or halt progression, of CRC.
In this study we used public omics data sets to investigate the association between the microbiome, metabolome, bulk transcriptomics and single cell RNA sequencing datasets, aiming to explore their potential role in colorectal cancer pathogenesis and to postulate causative mechanisms for associations identified.

2. Results

2.1. Microbiome and Metabolome Analysis Identified Novel Interactions

In order to identify potential microbiome–metabolome interactions, we applied a Bayesian additive regression trees classification method (BART) to discriminate CRC cases from healthy controls in two published datasets; Kim et al. [8] and Clos-Garcia et al. [11]. The BART method was chosen because it is capable of both capturing nonlinear effects and estimating uncertainties associated with the estimates. Models were built with (1) microbiome only and (2) combined microbiome and metabolome data. In each case, two steps were followed. First, BART was used to select important features by local thresholding (please see Section 4 for more details). Second, having obtained the set of important features, a cross-validated BART model was built to optimise the classification accuracy. Since, within Kim et al. [8] dataset, controls (n = 102) were over-represented in relation to cases (n = 36), step 1 was repeated 10 times, each time using a different, but balanced, data resampling, in order to reduce the bias introduced by subsampling. Hypothesising that interactions that appear more frequently are potentially interacting ones, potential interaction effects were examined by counting the number of times each pair of features co-occurred in any downward path of the fitted trees. Partial dependence plots were constructed for both individual features and high frequency interacting pairs.
Both microbiome and metabolome features, within the Kim et al. [8] dataset, were selected (Supplementary Table S2). The out-of-sample (oos) misclassification error of the cross-validated BART model was 0.306. When only microbiome features were used, however, the oos error increased to 0.528, implying that the model, built on microbiome features alone, does not convey predictive power in differentiating carcinoma from control samples. Figure 1a,b shows the partial dependence of harmane and 5-aminovalerate, two of the metabolic features that were selected in all 10 repeats. We observe a decrease in the risk of cancer in relation to an increase of harmane levels, in addition, the risk is elevated as 5-aminovalerate increases. Partial dependence plots for the rest of the features, which were selected in at least half of the runs, are presented in Supplementary Figure S1. Although these features are selected by the model as significantly impacting the prediction of the outcome, no strong relationship with CRC risk was observed when considered individually, as illustrated, for example, by the partial dependence plots of ornithine, 1,2-dilinoleoyl-GPC (18:2/18:2), glycochenodeoxycholate, cholesterol and bacterium genus Eubacterium (OTU37). However, this inconsistency may be explained by interaction effects, which are not captured by partial dependence, since partial dependence, by definition, averages out the effect of all other variables.
We therefore investigated pairwise interaction effects for all selected microbiome and metabolomic features. Figure 1c displays the interaction count matrix resulting from the BART model. The most noticeable metabolite is 5-aminovalerate, which is shown to interact with many other metabolites and some bacteria, in particular, the genus Eubacterium, Adlercreutzia and SMB53. Although less prominent, 1,2-Dilinoleoyl-GPC (18:2/18:2), guanosine and indolin-2-one also were shown to be involved in multiple interactions.
These metabolites were shown to interact with 5-aminovalerate as well amongst themselves, as indicated by the interactions among all such pairs highlighted in Figure 1c. This suggests that high-order interactions may be present.
The top 2% feature pairs with the highest counts in Figure 1c were selected for partial dependence investigation. For each such pair, we estimate log-odds of cancer on a regular 2D grid of feature values of this pair, by fixing the feature values to be on the grid and averaging over all predictions from the training instances. Among all feature pairs, higher risk of CRC implies elevated level of 5-aminovalerate, however, increased 5-aminovalerate does not necessarily imply higher risk of CRC, when considering the effect of other metabolites (Figure 2 and Supplementary Figure S2). In particular, increased harmane, guanosine, arabonate_xylonate, glycerate, N_Formylmethionine and Pyridoxamine levels or decreased 1,2-Dilinoleoyl-GPC (18:2/18:2), N_Acetylvaline and indolin-2-one levels, are shown to lower the risk of CRC, even though 5-aminovalerate is abundant. When 5-aminovalerate is not abundant, CRC risk is minimised, for example, by increasing harmane, guanosine, or by decreasing 1,2-Dilinoleoyl-GPC (18:2/18:2) levels. In addition, the absence of the genus Adlercreutzia is shown to lower the risk of CRC when 5-aminovalerate is elevated. The complete results are represented within Supplementary Table S3.
Although when not considering interaction effects, CRC risk increases as 5-aminovalerate levels increase (Figure 1b), the result of BART interaction analysis suggests that the risk is attenuated when controlling for other metabolites. This observation offers additional insights to the regulation of metabolomic and microbiome markers in CRC tumorigenesis, and could serve as a basis for future experimental and validation studies in the search for potential targets for therapeutic intervention.
The Clos-Garcia [11] dataset analysis revealed a better performance in discriminating CRC from healthy controls, in both combined microbiome metabolome dataset (oos: 0.094) and microbiome dataset alone (oos: 0.113). Compared with Kim et al. [8], the Clos-Garcia [11] microbiome samples confer considerably higher predictive power. This noticeable difference in the classification error between the two published datasets may be partly explained by the observation that no common microbes, at the genus level, were selected by BART. The BART interaction analysis identified three microbiome–metabolome pairs and three microbial pairs that exhibit strong interactions compared to other feature pairs. All microbiome–metabolome pairs involve ChoE(20:4), which is shown to interact with the bacteria genera Staphylococcus, Blautia and Roseburia. Partial dependence of ChoE(20:4) showed that the risk of CRC increases when ChoE(20:4) is high, although the relation is nonlinear as the risk remains low as long as ChoE(20:4) level is below some threshold (Figure 3a). Partial dependence of these feature pairs (Figure 3b), however, provides us with valuable insights into how the risk may be mitigated by controlling for specific microbes. As can be seen from the contour plots, under high values (log-normalised) of ChoE(20:4), decreasing Staphylococcus and Roseburia, or increasing Blautia, reduces the risk of CRC. Further inspection of the contour plots for microbial interactions reveals that the risk is minimised when Staphylococcus and Roseburia decrease simultaneously; and when Blautia and an unknown genus (OTU17213), from the same family as Blautia, Lachnospiraceae, increase simultaneously. Supplementary Table S4 provides a summary of these results.

2.2. Metabolite Enrichment Analysis

The Kim et al. [8] metabolites dataset was also analysed using the IMPaLA (Integrated Molecular Pathway Level Analysis) tool. IMPaLA is a web tool, developed for integrated pathway analysis of metabolomics data alongside gene expression or protein abundance data [12,13]. It works through extending over-representation and enrichment analyses to multiple data types. Supplementary Table S5 depicts the pathways enriched with the Kim et al. [8] metabolites. The ABC transporters and Purine Nucleoside Phosphorylase pathways are the most significant pathways associated with the Kim et al. [8] metabolites, KEGG (p value: 6.9 × 10⁻¹⁰) and SMPDB (p value: 7.65 × 10⁻⁸), respectively.
Supplementary Table S6 shows the list of IMPaLA identified enriched pathways using the Clos-Garcia metabolite dataset. Amongst the most significantly enriched pathways were the ABC transporter (p value: 6.09 × 10⁻⁹) and the Purine Nucleoside Phosphorylase Deficiency (p value: 7.65 × 10⁻⁸) pathways. Cholesterol was found to be significantly enriched among several biochemical and metabolic pathways, primarily featuring pathways involving vitamin digestion and absorption (p value: 0.0003), and digestion of dietary lipids (p value: 0.0006).

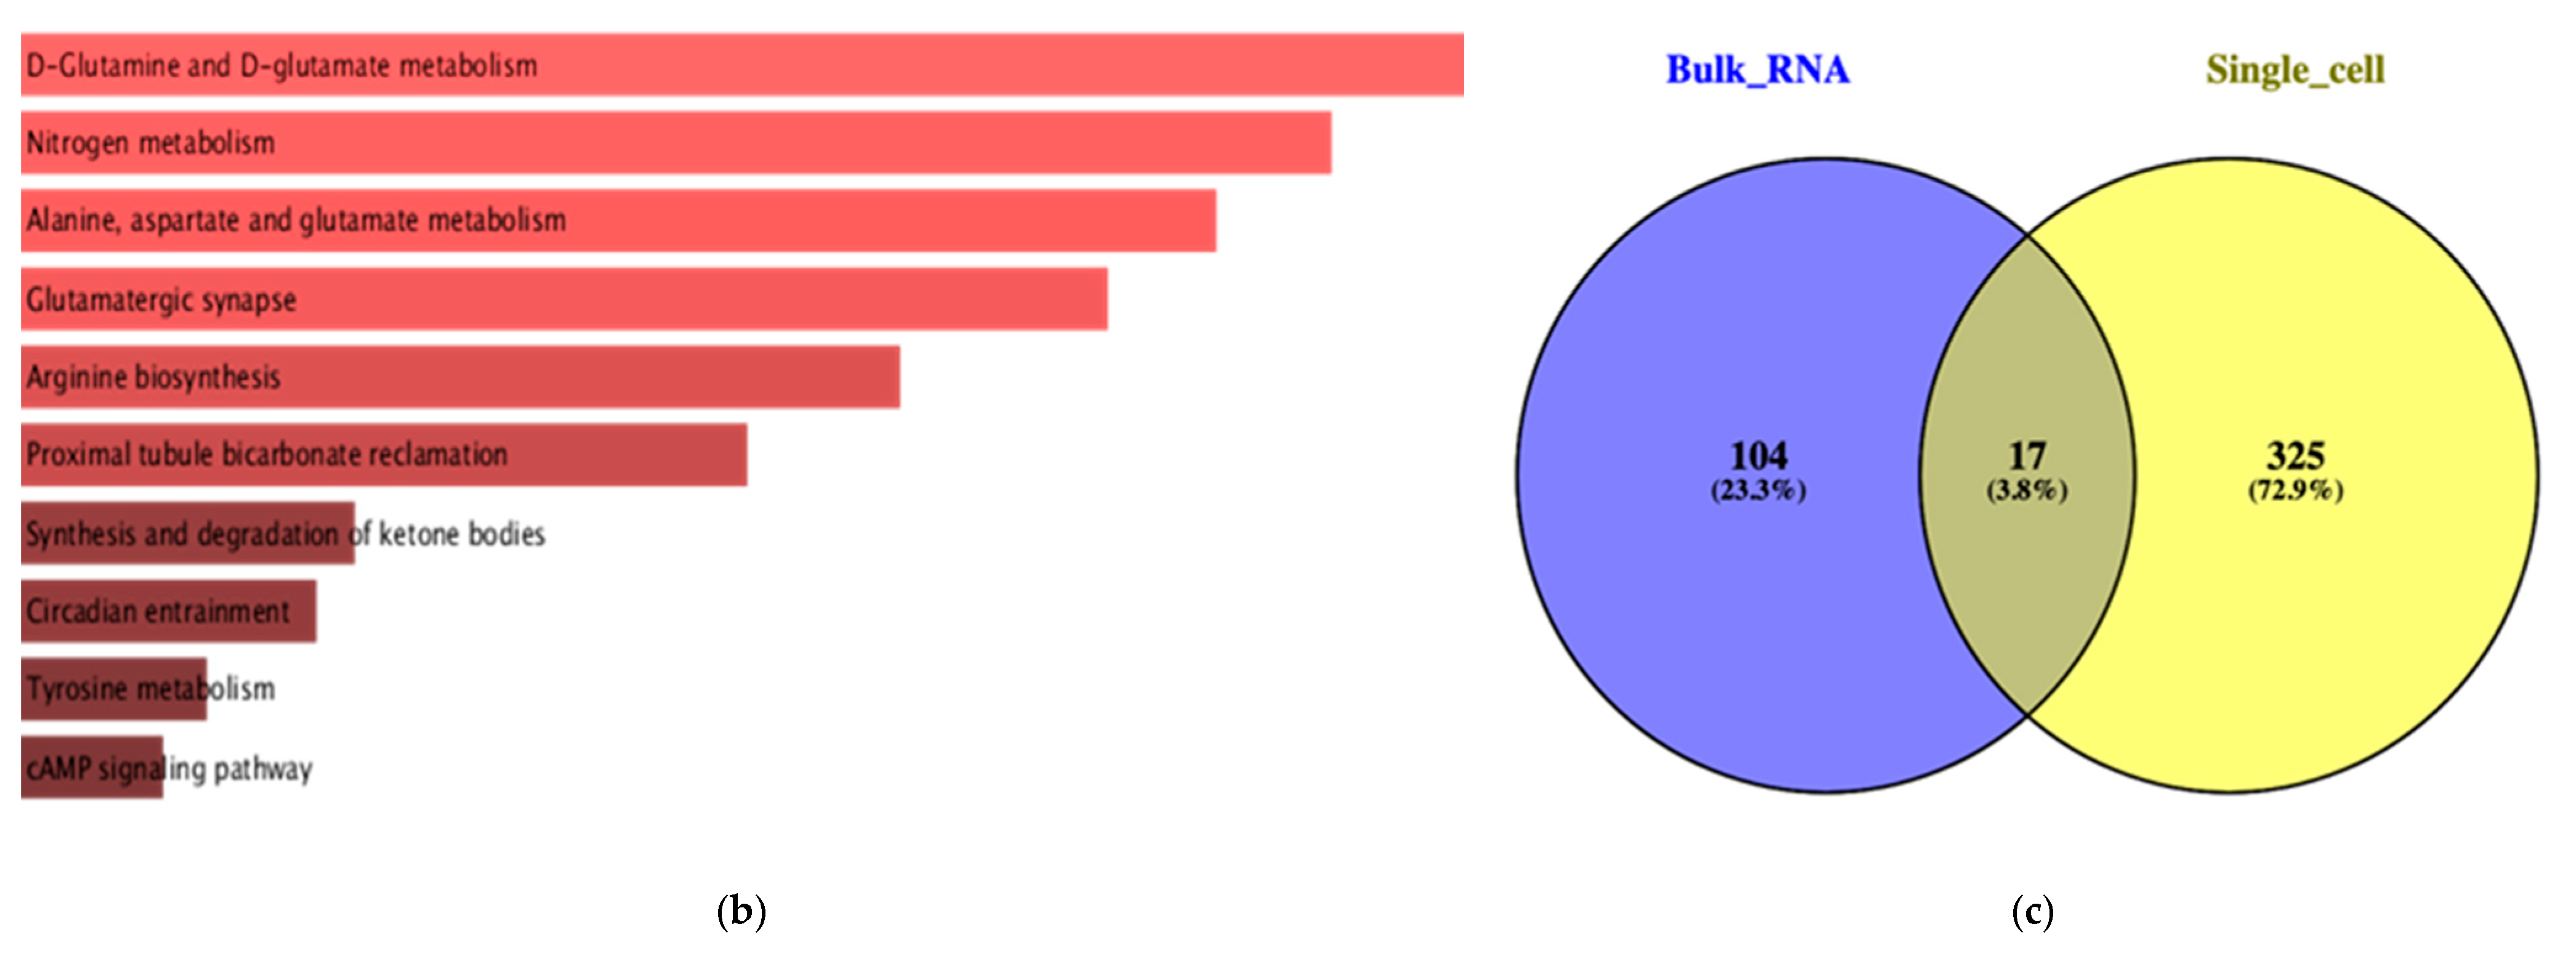
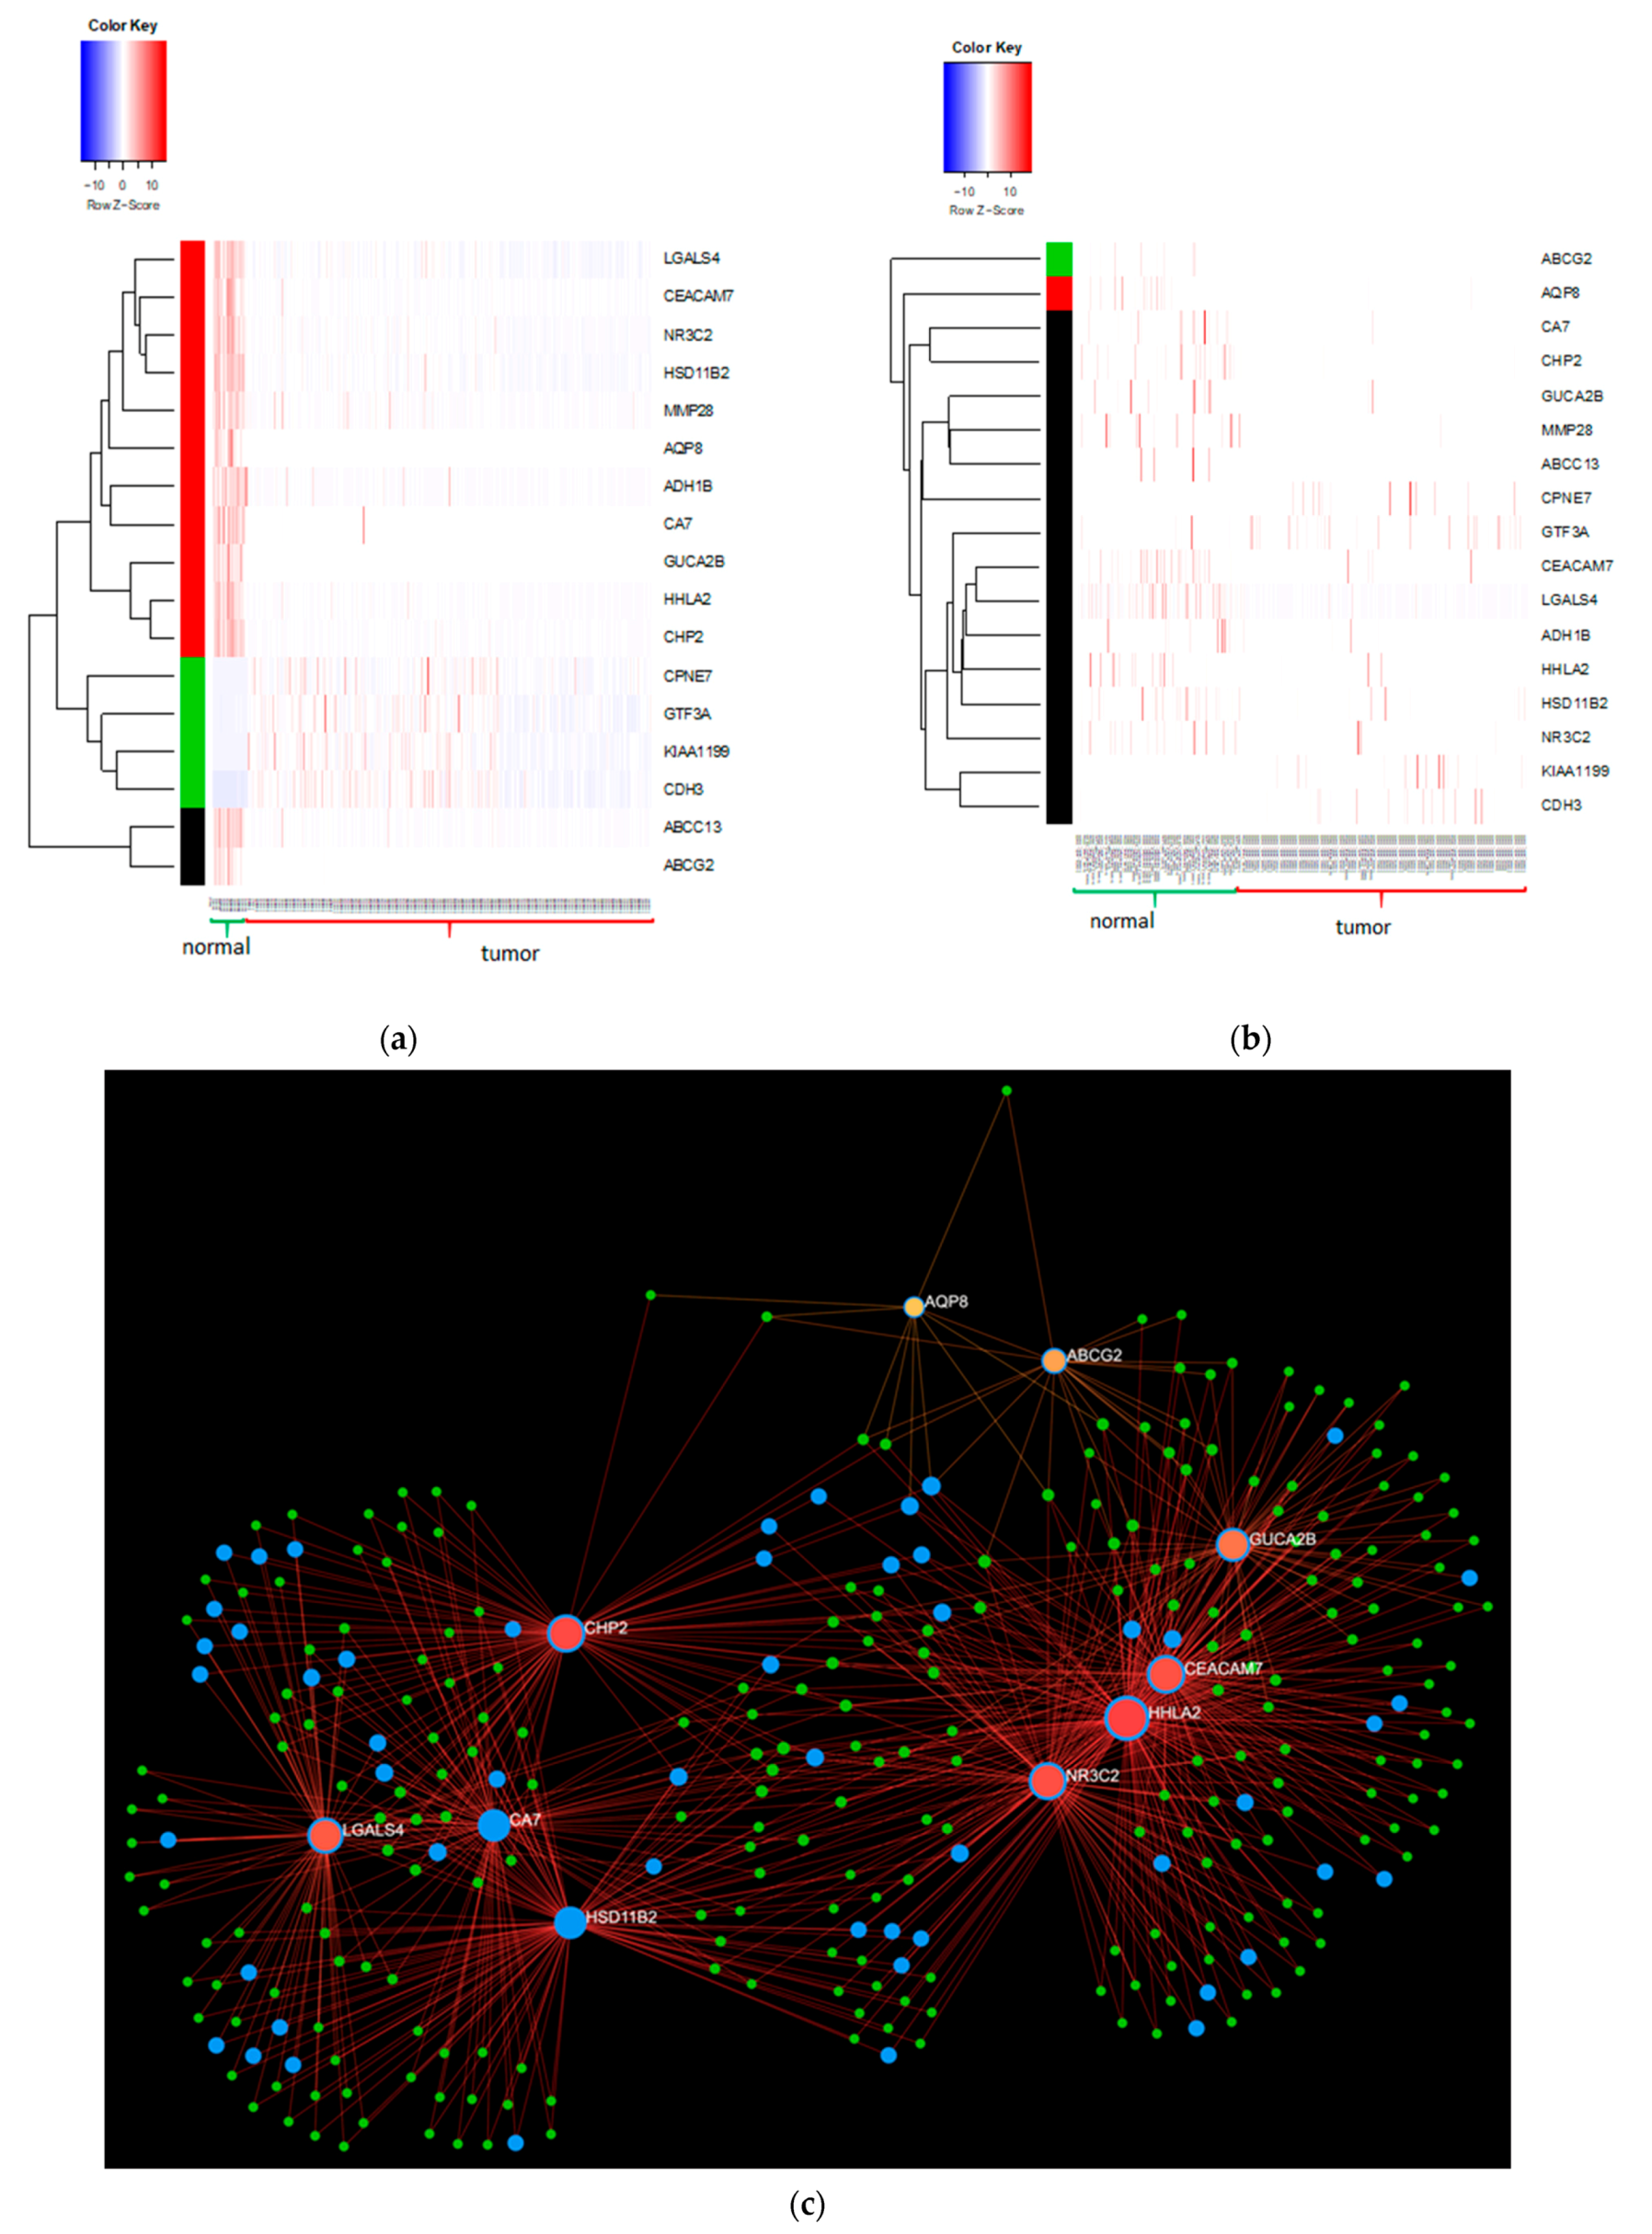
2.3. Bulk RNA Seq Analysis

A list of 6066 differential genes were obtained from COAD—TCGA (The Cancer Genome Atlas—Colon Adenocarcinoma) [14] study after iterative undersampling, detailed in Section 2, and the resulting p value significance of the fold change was 0.0001. Out of the 6066 genes, 2653 (43.74%) were upregulated and 3413 (56.26%) were downregulated. Figure 4a shows a volcano plot for the selected 6066 genes. The application of a Recursive Feature Elimination [15] over the 6066 differential gene expression dataset resulted in the identification of 121 unique genes. Out of these 121 genes, 76 appear more than once among the iterations. We used Enrichr [16] for the enrichment analysis for the selected 76 genes which revealed that the Glutamatergic synapse pathway was significantly associated (p value: 0.001) with the GNG3, GLS2, GNG7, GRIK1, GRIA3 and GRIN2D genes (Figure 4b). Furthermore, the alanine, aspartate and glutamate metabolism pathways were significantly associated (p value: 0.02) with GLS2, GPT and ASPA. A list of KEGG pathways can be found in Supplementary Table S1.

2.4. Single Cell RNA Seq Analysis

We obtained four lists of differential genes in four different cell types described by Li H et al. (2017) [17] listed in Supplementary Table S7. DAVID enrichment analysis was performed to obtain the significant pathways for these genes [18]. For the case of fibroblast cells associated dataset, the most significant pathway obtained was Proteoglycans in cancer (p value 1.2 × 10⁻³) (CD63, DDX5, DCN, LUM, ITGB1). In epithelial cells, oxidative phosphorylation was identified as the most significant pathway (p value 2.0 × 10⁻⁶) (ATP5A1, ATP5G1, ATP5I, NDUFB1, COX6C, COX7C, UQCR10). In case of myeloid cells, the key pathways identified were the oxidative phosphorylation (p value 2.2 × 10⁻³) (ATP6, ATP8, ND6, ND8) as well as metabolic pathways (p value 8.6 × 10⁻²) (ATP6, ATP8, ND6, ND8, CECR1, SAT1). For the B-cell related dataset, the most significant pathway identified was the protein processing in the endoplasmic reticulum (p value 4.9 × 10⁻²) (HSPA8, HSPH1) pathway. The 342 genes and pathways identified within the epithelial cells related dataset (obtained from Zhang GL et al. (2019) [19]) are provided within the Supplementary Table S8.
Significant downregulated pathways identified were the oxidative phosphorylation (p value 0.000347) (NDUFB1, COX6B1, COX7A2, COX7C, ATP5C1, ATP5G1, ATP5H) and the nitrogen metabolism (p value 0.000595) (CA1, CA7, CA2) pathways. The p53 signalling pathway (p value 0.00244) (ATR, MDM2, PERP, SESN3) was depicted as significantly upregulated. We further compared the 121 significant genes obtained from the bulk RNA-seq analysis and compared them to the 342 genes obtained from single-cell epithelial cells. A total of 17 genes were identified to be present in both analyses (Figure 4c). All 17 genes show a similar regulatory pattern in both the bulk and single-cell RNA-seq and are represented in Table 1. A heatmap for the 17 genes reveals a differential gene expression pattern across both the bulk (Figure 5a) and single cell RNA seq datasets (Figure 5b). We then employed the Network Analyst platform [20] and constructed a tissue specific interaction network using these 17 genes (Figure 5c). In the resulting network the seed nodes are shown in red while the genes that are involved in metabolism are shown in blue.

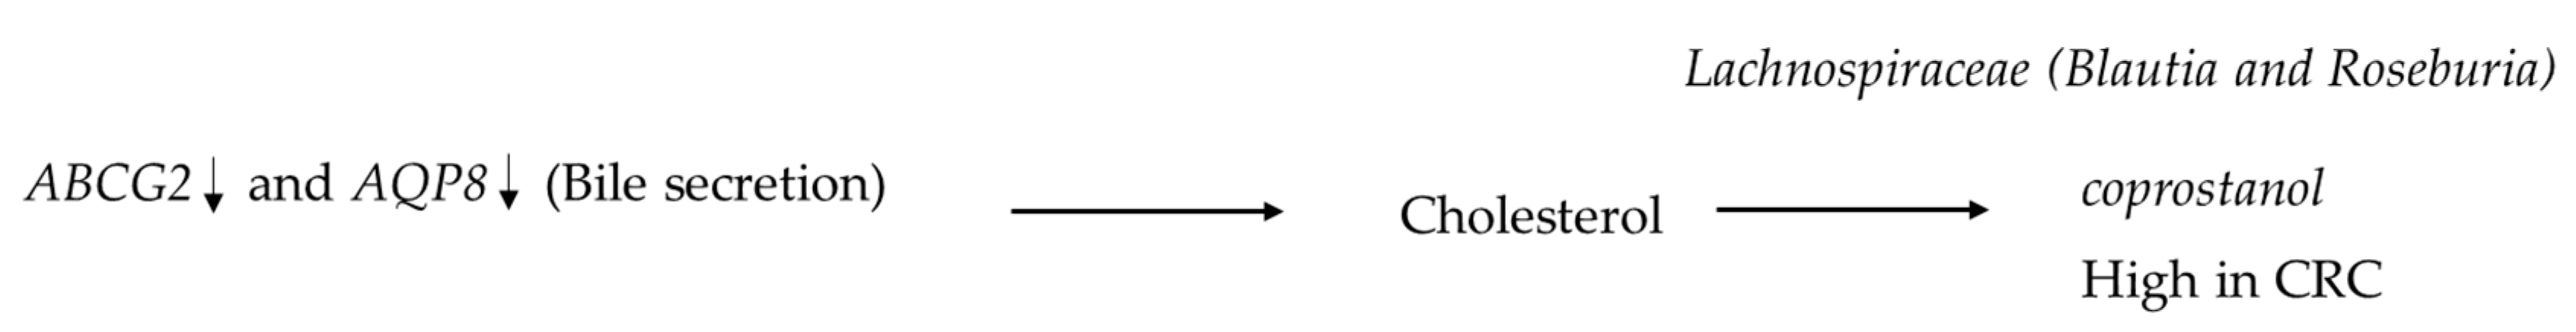
2.5. Qualitative Integration

We attempt to integrate multiple features from diverse data sets based on the enrichment analysis and literature review. ABCG2 and AQP8 genes are responsible for bile secretion (AQP8 is downregulated), which is converted to cholesterol by the gut enzymes[63]. Cholesterol is further converted to coprostanol by members of the Lachnospiraceae family, including Blautia and Roseburia [64]. In Figure 6, we provide an example of the qualitative integration.

3. Discussion

In this study, we used multiomics data sets from different populations to understand pathophysiological pathways and identify potential therapeutic CRC targets. In an effort to understand the complex interactions between microbiome and metabolome we employed two datasets (Kim et al. [8] and Clos-Garcia [11]) and quantified the top ranked interactions using the BART model. We observed a decrease in the predictive risk of CRC as the level of harmane increased with estimated credible intervals from BART. In our BART model, sex and age were used as a covariate. Kim et al. also considered age, sex, and smoking status (smoker/non-smoker) as covariates. Moreover, we were able to show that this predictive risk is elevated as serum levels of faecal 5-aminovalerate increases. In this case, 5-aminovalerate are considered as interactions as they appear in a contiguous downward path of the tree from the root node to a terminal node. Moreover, a partial dependence of ChoE(20:4) showed that the risk of CRC increases when cholesteryl ester, ChoE(20:4), is high. Importantly, a pairwise interaction analysis suggests that the risk may be mitigated by controlling for other microbial and/or metabolomic features, as shown in Supplementary Tables S3 and S4. This offers great potential for targeted experimental pathophysiology studies which could provide further evidence for our findings. To make our analysis consistent across the two datasets of Kim et al. and Clos-Garcia et al., we removed the adenoma samples and considered only the carcinoma and healthy controls, instead of pooling adenomas and carcinomas together. Clos-Garcia et al. identified increased levels of Fusobacterium, Parvimonas and Staphylococcus, with decreased levels of Lachnospiracaea family members in CRC [11]. We also note that in Clos-Garcia et al., a logistic regression model was only fitted to 16 genera and 6 metabolites, which were identified by comparison with their previously published results. Conversely, in our case all available microbiome and metabolome features were included in BART modelling. Kim et al. identified multiple associations between bacteria and metabolites [8].
To add biological pathway information on the metabolomics and microbiome data sets, we used enrichment analysis. Interestingly, based on an analysis of the Kim et al. metabolomics dataset, we identified many biochemical pathways enriched with 5-aminovalerate. We found 5-aminovalerate to be significantly enriched within the arginine and proline metabolism (p-value: 0.00243) and D-arginine and D-ornithine metabolism (p value: 0.0541) pathways. Lysine, proline and arginine have previously shown antitumour effects on cancer cell line HCT 116 by inhibiting MMP expression and invasion [65]. Although it may be thought that their metabolism would be downregulated in cancer if a tumour has been able to develop, a systematic review evaluating the effects of arginine on colorectal cancer found decreased tumour production and crypt cell hyperproliferation during the initiation stage of carcinogenesis, but a stimulation of tumour growth during the promotion stage [66]. Evidence also indicates that the gut microbiome plays an important role in the production of 5-aminovalerate. Lower levels of 5-aminovalerate are found in germ free mice in comparison to normal mice [67,68], and high levels are thought to indicate bacterial overgrowth [69]. In addition to that, 5-aminovalerate is thought to be a metabolite of dietary proteins, particularly lysine, produced by bacteria in the gastrointestinal tract and has also been found to be increased in a haem-enriched diet, which has also been associated with a higher risk of CRC [70].
A metabolic pathway enrichment analysis also identified the short chain fatty acids (SCFAs) acetate, propionate and butyrate to be significantly associated (p < 0.05) with CRC. However, in the data set the expression label was low, so it might be due to the quantification of the metabolomics experimental process. Fibre is digested by anaerobic bacteria in the gut to produce these SCFAs [71]. SCFAs have been detected in higher levels in healthy individuals in comparison to CRC patients, and have been shown to inhibit histone deacetylase activity and interact with cell surface receptors in enterocytes affecting the epigenetic gene expression [72]. Their role is postulated to be protective against CRC, as they have been shown to arrest growth and differentiation in human colon carcinoma cells [73].
In our analysis we performed an integration of metabolomic, microbiome and transcriptome datasets from multiple different CRC cohort studies to identify potential new disease targets. Methodologically it is different from Acharjee et al. [73], and Quraishi et al. [74]. In both of these studies, omics integration was performed from the same cohorts for obesity and inflammatory bowel disease. The data integration performed here for different CRC patient cohorts is being done for the first time. However, in the case of humanised microbiome mouse models [75] the transcriptome, microbiome and metabolites were integrated.
In this analysis, we identified 17 genes common between bulk and single cell RNA sequencing datasets and these genes were used for the pathway analysis. Interestingly several genes like KIAA1199, CDH3, GUCA2B, LGALS4, CA7, NR3C2, ABCG2, AQP8, etc. were found to be implicated in CRC pathophysiology. Few genes that we have identified are involved in various metabolic processes, for example HSD11B2 (converts cortisone to cortisol), NR3C2 and HSD11B2 (Aldosterone regulated sodium reabsorption), ABCG2 and AQP8 (Bile secretion), CA7 (nitrogen metabolism). In our metabolic analysis we identified choE(20:4), also known as cholesteryl ester, as a significant metabolite. It is synthesised by the esterification of cholesterol; the enzyme responsible for it is ACAT1 [76]. Our network analysis suggests that ACAT1 and several other metabolic genes are interacting with the 17 genes we identified either directly or indirectly. Metabolites with high ranking seem to be interacting with multiple microbiome species, for example Indolin-2-one is a tryptophan metabolite, likely of gut microbiome origin [77]. Indolin-2-one compounds have been identified as an effective cancer treatment, with indolin-2-one derivatives showing anticancer effects in vitro against ovarian cancer cells [78,79,80]. Louis et al. [81] have also identified higher log blood harmane concentration in colon cancer and other cancers in comparison to those without cancer.
There are some limitations of this study. Firstly, the different cohorts of populations employed exhibit heterogeneity which limits comparability of results. Secondly, we only considered pairwise interactions. However, it is anticipated that higher order interactions may be present, as indicated by all pairwise interactions between Staphylococcus, Roseburia and ChoE(20:4) (Cholesterol Ester). Thirdly, nutrition, exercise and other lifestyle factors strongly influence the composition of the gut microbiome and metabolome. Unfortunately, these could not be considered in our analysis. Fourthly, the targets (metabolites, genes and microbiota) generated from this study were not validated in follow-up for the participants as only one stool sample was collected. Potential future studies could include the collection of multiple longitudinal stool samples for causal analysis to improve validity of results.
A small proportion of colorectal cancers, which are not included in our analysis, are directly caused by inherited gene mutations, including mutations of the MUTYH gene or mismatch repair genes [82]. Nonetheless, alterations in gene expression are seen across all patients with colorectal cancer [82]. Mutations in the APC, Kirsten-ras and p53 genes are thought to be an alternative pathway in tumour development [83]. Additionally, the transcription of other genes may be upregulated or downregulated in CRC [84], as seen in our analysis.

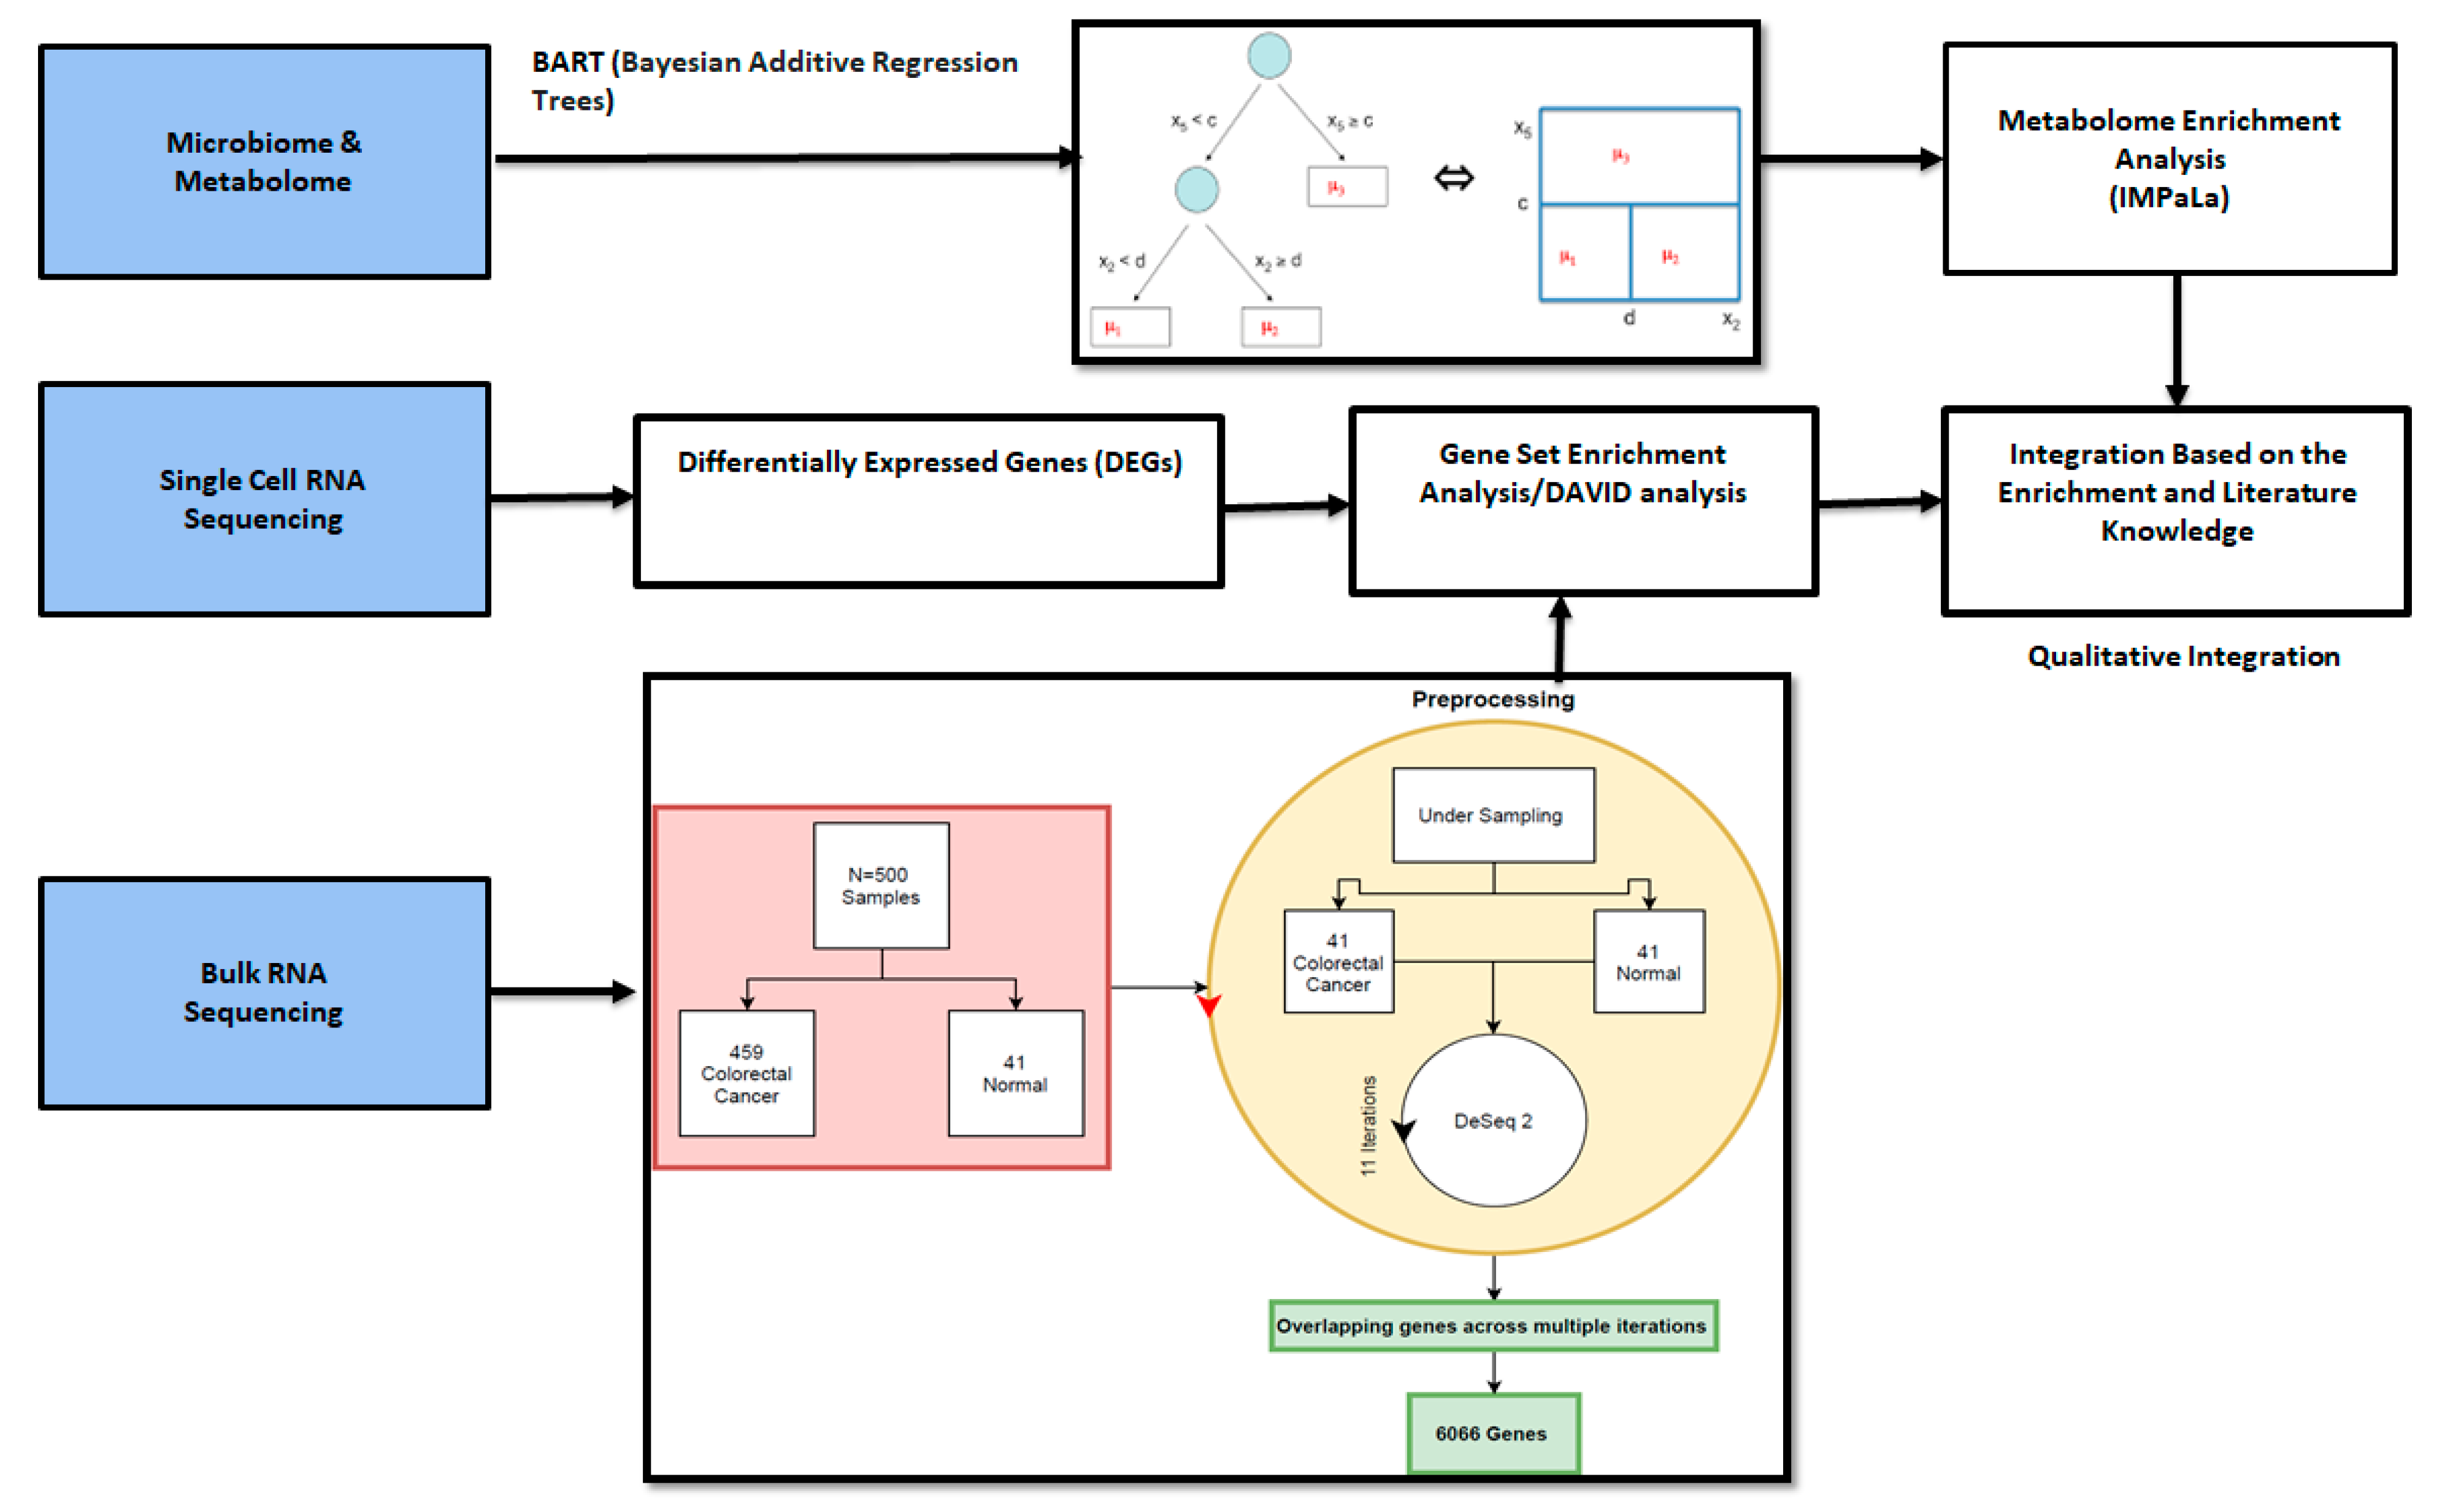
4. Materials and Methods

We used existing public datasets (Table 2) to identify potential mechanisms and interactions between microbiome, metabolome and genes for CRC. A workflow of all the methods and processes are described in Figure 7.
The R package “bartMachine” [86] is a Bayesian model characterised by the sum of regression trees. Consider an input x = (x1, ⋯, xp) with “p” predictors, the prediction label “y” is modelled as y = f(x) + ε, ε∼N(0, 2), where f(x) = k = 1 m T k ( x ) , and Tk(x) represent regression trees.
Given an input x, Tk assigns x to one of the terminal node values which is consistent with the rules used to split the predictors in x in the tree, and the prediction target is obtained by summing all Tk(x), k = 1, ⋯, m from the m trees, plus some Gaussian noise.
Tree-based machine learning methods, such as decision tree and random forest, typically directly learn from the data the partition and the terminal node values. For the case of the BART method, these are assigned priors, and inference is drawn from the posterior distribution of the sum of trees given the data observed. One distinct feature of BART is the specification of the priors. First, as in many Bayesian machine learning methods, the prior is chosen to regularise the fit so that individual tree effect is small and no single tree dominates the prediction, a property shared by gradient boosted trees (GBM); however, unlike GBM, the number of trees m required in BART is often much smaller—studies have shown that BART performs well with no more than 200 trees across a variety of datasets [87] and in some cases the performance improvement is only marginal for using more than 50 trees [86].
Second, data-informed priors for terminal node values and observation variance are used are used to ensure that they do not deviate much from what the training data entails, a desirable property when external information is unavailable. The posterior distribution of sum-of-trees given data is simulated through the backfitting MCMC algorithm [87]. Parameter estimates and predictions can then be obtained from the posterior. Additionally, the uncertainty of the estimates can be quantified through Bayesian credible intervals. With some modification to the backfitting algorithm, the BART probit model for (binary) classification: P(Y = 1|x) = Φ(f(x)) can be used.
The variable importance was assessed by the fraction of times each variable is used to split the nodes in the posterior sum of trees, called “inclusion proportion”. Variables that appear frequently in the trees, hence higher inclusion proportion, are likely to be important. Significance was assessed by local thresholding [86], that is, a variable will be selected if its inclusion proportion exceeds the 0.95 quantile of its null distribution obtained by permuting the response. The interaction effect was estimated by counting the number of times a set of variables appear together in a downward path of the tree from the root node to a terminal node [86]. When the number of trees m is large, the flexibility offered by so many trees means that inclusion of irrelevant variables is unlikely to significantly degrade the fit, and so these variables could appear frequently in the trees, resulting in spurious interactions and less effective variable selection. Therefore, by limiting the number of trees to be small and forcing the variables to compete to enter into the model, BART can be an effective method for determining variable importance and interaction effect.
Metabolic enrichment analysis was conducted using IMPaLA, a publicly available web platform, that has been developed for integrated pathway analysis of metabolomics data alongside gene expression or protein abundance data [12]. It performs an over-representation or enrichment analysis with user-specified lists of metabolites and genes using over 3000 preannotated pathways from 11 databases. It provides pathway over-representation and enrichment analysis functionality with user-specified lists of genes/proteins and/or metabolites, generally termed physical entities.
We analysed the differential expression of genes involved in colon adenocarcinoma using. The TCGA-COAD (The Cancer Genome Atlas—Colon Adenocarcinoma) mRNASeq level 3 raw count data [14] generated by the UNC version 2 analysis pipeline. The inspected 20,532 gene loci out of which 29 were hypothetical loci and 500 samples (Colon adenocarcinoma: 459 and Normal: 41). We used DESeq2 to investigate the RNAseq raw count and identify differentially expressed genes [88]. DESeq2 reduces the number of genes tested by removing the genes unlikely to be significantly differentially expressed prior to testing and performs gene-level quality control. The p-values are attained by the Wald test and are corrected for multiple testing using the Benjamini and Hochberg method. The number of genes, in the output table of DESeq analysis with the significance cutoff set to 0.1, was the same as the original (20,532). As unbalanced class distribution of labels (Colon adenocarcinoma: 459 and Normal: 41) can affect predictive performance, specifically for minority class [89], we performed under sampling of the data [90]. We chose 41 colon adenocarcinoma samples and 41 normal samples iteratively (not repeating the samples) and analysed them using DESeq2. We then combined the results by taking the union of the list of genes in the resultant table from each iteration. We subset the results iteratively by decreasing the significance cut off from 0.05 to 0.0001 (0.05, 0.01, 0.001, 0.0001), which resulted in 12,290 genes with p adjusted < 0.001. We then selected the overlapping genes across all the iterations, 6066 genes.
We used Recursive Feature Elimination (RFE) to select a small subset of genes from a broad range of gene expression data [15]. RFE fits a model, like random forests (rfFuncs), and removes the weakest feature (or features) until the specified number of features is reached. We used the RFE via CARET [91]. Due to the unbalanced classes, we performed RFE iteratively on the undersampled data as we did earlier. We used random forest to select the subset of genes from each iteration. This results in a list of 345 genes collectively from all iterations. Taking the union of the list of genes from each iteration resulted in a list of 121 genes and out of 345 genes 76 appeared more than once among 11 iterations. For the 76 genes selected, we used Enrichr for the enrichment analysis [16]. Enrichr is an integrative web-based software application that includes new gene-set libraries, an alternative approach to rank enriched terms, and various interactive visualisation approaches to display enrichment results.
The FPKM values of the significant genes from the single-cell data for four different cell types were obtained from the Li et al. [13] and Zhang et al. [19] datasets. The list of genes used in this study can be found in Supplementary Table S1.
We used the DAVID (Database for Annotation, Visualization and Integrated Discovery) online tool [18] to find the significant pathways that are enriched for the different single cells’ significant genes lists.
The heatmaps were generated using gplots package heatmap2 function in R. The network analysis was done using NetworkAnalyst (v3.0) [91] where a tissue specific coexpression network was built with the degree filter of 1.0 on all the nodes. The seed genes are shown in red colour and are labelled while the proteins connected to the seed are shown in yellow. The blue colour nodes are the proteins involved in the metabolic processes.
We used enrichment analysis to associate and integrate genes and metabolites identified from transcriptomics and metabolomics datasets derived from diverse populations. Moreover, a literature-based validation was performed to gain insights to CRC associated pathways.

5. Conclusions

Our microbiome and metabolome analysis identified novel interactions related to 5-aminovalerate and cholesterol. Using bulk and single cell RNA sequencing, we identified 17 genes (e.g., KIAA1199, CDH3, GUCA2B, LGALS4, CA7, NR3C2, ABCG2, AQP8, etc.) including several metabolic genes (HSD11B2, NR3C2, ABCG2, CA7) associated with CRC pathophysiology. A metabolic enrichment analysis revealed a prominent of cholesterol pathways in CRC physiology. Finally, our qualitative integration approach catered the identification of the downregulation of ABCG2 and AQP8 genes, responsible for bile secretion, which directly increases the cholesterol synthesis facilitated by gut microbes.

Supplementary Materials

The following are available online at https://www.mdpi.com/article/10.3390/ijms22115763/s1.

Author Contributions

Conceptualisation, A.A.; methodology, V.B., Y.X., A.A., P.A.; software, V.B., Y.X., A.A., P.A.; validation, V.B., Y.X., A.A., P.A.; formal analysis, V.B., Y.X., A.A., P.A.; investigation, V.B., Y.X., A.A., P.A.; resources, A.A.; writing—original draft preparation, V.B., K.N., Y.X., P.A., A.A.; writing—review and editing, V.B., K.N., Y.X., P.A., G.V.G., S.B., A.A.; visualisation, A.A.; supervision, A.A., G.V.G.; project administration, A.A.; funding acquisition, G.V.G. All authors have read and agreed to the published version of the manuscript.

Funding

This study was supported by the National Institute for Health Research (NIHR) Surgical Reconstruction and Microbiology Research Centre (SRMRC), Birmingham. GVG also acknowledges support from H2020-EINFRA (731075) and the National Science Foundation (IOS:1340112) as well as support from the NIHR Birmingham ECMC, the NIHR Birmingham Biomedical Research Centre and the MRC HDR UK. The views expressed in this publication are those of the authors and not necessarily those of the NHS, the National Institute for Health Research, the Medical Research Council or the Department of Health, UK. The funders provided the financial support to this research but had no role in the design of the study, analysis, interpretations of the data and in writing the manuscript.

Data Availability Statement

All the datasets are freely available. TCGA data was downloaded from https://portal.gdc.cancer.gov/projects/TCGA-COAD (accessed on 30 November 2020).

Conflicts of Interest

The authors declare no conflict of interest. The funders had no role in the design of the study; in the collection, analyses, or interpretation of data; in the writing of the manuscript, or in the decision to publish the results.

References

  1. Rawla, P.; Sunkara, T.; Barsouk, A. Epidemiology of Colorectal Cancer: Incidence, Mortality, Survival, and Risk Factors. Przeglad Gastroenterol. 2019, 14, 89–103. [Google Scholar] [CrossRef]
  2. Winawer, S. Colorectal Cancer Screening and Surveillance: Clinical Guidelines and Rationale?Update Based on New Evidence. Gastroenterology 2003, 124, 544–560. [Google Scholar] [CrossRef] [Green Version]
  3. Keku, T.O.; Dulal, S.; Deveaux, A.; Jovov, B.; Han, X. The Gastrointestinal Microbiota and Colorectal Cancer. Am. J. Physiol. Gastrointest. Liver Physiol. 2015, 308, G351–G363. [Google Scholar] [CrossRef] [Green Version]
  4. Ternes, D.; Karta, J.; Tsenkova, M.; Wilmes, P.; Haan, S.; Letellier, E. Microbiome in Colorectal Cancer: How to Get from Meta-Omics to Mechanism? Trends Microbiol. 2020, 28, 401–423. [Google Scholar] [CrossRef]
  5. Yang, Y.; Misra, B.B.; Liang, L.; Bi, D.; Weng, W.; Wu, W.; Cai, S.; Qin, H.; Goel, A.; Li, X.; et al. Integrated Microbiome and Metabolome Analysis Reveals a Novel Interplay between Commensal Bacteria and Metabolites in Colorectal Cancer. Theranostics 2019, 9, 4101–4114. [Google Scholar] [CrossRef] [PubMed]
  6. Sommer, F.; Nookaew, I.; Sommer, N.; Fogelstrand, P.; Bäckhed, F. Site-Specific Programming of the Host Epithelial Transcriptome by the Gut Microbiota. Genome Biol. 2015, 16, 62. [Google Scholar] [CrossRef] [PubMed] [Green Version]
  7. Wang, Q.; Ye, J.; Fang, D.; Lv, L.; Wu, W.; Shi, D.; Li, Y.; Yang, L.; Bian, X.; Wu, J.; et al. Multi-Omic Profiling Reveals Associations between the Gut Mucosal Microbiome, the Metabolome, and Host DNA Methylation Associated Gene Expression in Patients with Colorectal Cancer. BMC Microbiol. 2020, 20, 83. [Google Scholar] [CrossRef] [PubMed]
  8. Kim, M.; Vogtmann, E.; Ahlquist, D.A.; Devens, M.E.; Kisiel, J.B.; Taylor, W.R.; White, B.A.; Hale, V.L.; Sung, J.; Chia, N.; et al. Fecal Metabolomic Signatures in Colorectal Adenoma Patients Are Associated with Gut Microbiota and Early Events of Colorectal Cancer Pathogenesis. mBio 2020, 11, e03186-19. [Google Scholar] [CrossRef] [Green Version]
  9. Tong, D.; Tian, Y.; Zhou, T.; Ye, Q.; Li, J.; Ding, K.; Li, J. Improving Prediction Performance of Colon Cancer Prognosis Based on the Integration of Clinical and Multi-Omics Data. BMC Med. Inform. Decis. Mak. 2020, 20. [Google Scholar] [CrossRef] [PubMed]
  10. Wong, S.H.; Yu, J. Gut Microbiota in Colorectal Cancer: Mechanisms of Action and Clinical Applications. Nat. Rev. Gastroenterol. Hepatol. 2019, 16, 690–704. [Google Scholar] [CrossRef] [PubMed]
  11. Clos-Garcia, M.; Garcia, K.; Alonso, C.; Iruarrizaga-Lejarreta, M.; D’Amato, M.; Crespo, A.; Iglesias, A.; Cubiella, J.; Bujanda, L.; Falcón-Pérez, J.M. Integrative Analysis of Fecal Metagenomics and Metabolomics in Colorectal Cancer. Cancers 2020, 12, 1142. [Google Scholar] [CrossRef] [PubMed]
  12. Integrated Pathway-Level Analysis of Transcriptomics and Metabolomics Data with IMPaLA | Bioinformatics | Oxford Academic. Available online: https://academic.oup.com/bioinformatics/article/27/20/2917/202905 (accessed on 13 January 2021).
  13. Consensus-Phenotype Integration of Transcriptomic and Metabolomic Data Implies a Role for Metabolism in the Chemosensitivity of Tumour Cells. Available online: https://journals.plos.org/ploscompbiol/article?id=10.1371/journal.pcbi.1001113 (accessed on 13 January 2021).
  14. GDC Data Portal Exploration. Available online: https://portal.gdc.cancer.gov/ (accessed on 13 January 2021).
  15. Guyon, I.; Weston, J.; Barnhill, S.; Vapnik, V. Gene Selection for Cancer Classification Using Support Vector Machines. Mach. Learn. 2002, 46, 389–422. [Google Scholar] [CrossRef]
  16. Chen, E.Y.; Tan, C.M.; Kou, Y.; Duan, Q.; Wang, Z.; Meirelles, G.V.; Clark, N.R.; Ma’ayan, A. Enrichr: Interactive and Collaborative HTML5 Gene List Enrichment Analysis Tool. BMC Bioinform. 2013, 14, 128. [Google Scholar] [CrossRef] [Green Version]
  17. Li, H.; Courtois, E.T.; Sengupta, D.; Tan, Y.; Chen, K.H.; Goh, J.J.L.; Kong, S.L.; Chua, C.; Hon, L.K.; Tan, W.S.; et al. Reference Component Analysis of Single-Cell Transcriptomes Elucidates Cellular Heterogeneity in Human Colorectal Tumors. Nat. Genet. 2017, 49, 708–718. [Google Scholar] [CrossRef]
  18. Huang, D.W.; Sherman, B.T.; Lempicki, R.A. Systematic and Integrative Analysis of Large Gene Lists Using DAVID Bioinformatics Resources. Nat. Protoc. 2009, 4, 44–57. [Google Scholar] [CrossRef]
  19. Zhang, G.-L.; Pan, L.-L.; Huang, T.; Wang, J.-H. The Transcriptome Difference between Colorectal Tumor and Normal Tissues Revealed by Single-Cell Sequencing. J. Cancer 2019, 10, 5883–5890. [Google Scholar] [CrossRef]
  20. Zhou, G.; Soufan, O.; Ewald, J.; Hancock, R.E.W.; Basu, N.; Xia, J. NetworkAnalyst 3.0: A Visual Analytics Platform for Comprehensive Gene Expression Profiling and Meta-Analysis. Nucleic Acids Res. 2019, 47, W234–W241. [Google Scholar] [CrossRef] [PubMed] [Green Version]
  21. Crous-Bou, M.; Rennert, G.; Cuadras, D.; Salazar, R.; Cordero, D.; Saltz Rennert, H.; Lejbkowicz, F.; Kopelovich, L.; Monroe Lipkin, S.; Bernard Gruber, S.; et al. Polymorphisms in Alcohol Metabolism Genes ADH1B and ALDH2, Alcohol Consumption and Colorectal Cancer. PLoS ONE 2013, 8, e80158. [Google Scholar] [CrossRef] [PubMed] [Green Version]
  22. Sabates-Bellver, J.; Van der Flier, L.G.; de Palo, M.; Cattaneo, E.; Maake, C.; Rehrauer, H.; Laczko, E.; Kurowski, M.A.; Bujnicki, J.M.; Menigatti, M.; et al. Transcriptome Profile of Human Colorectal Adenomas. Mol. Cancer Res. MCR 2007, 5, 1263–1275. [Google Scholar] [CrossRef] [Green Version]
  23. Evensen, N.A.; Li, Y.; Kuscu, C.; Liu, J.; Cathcart, J.; Banach, A.; Zhang, Q.; Li, E.; Joshi, S.; Yang, J.; et al. Hypoxia Promotes Colon Cancer Dissemination through Up-Regulation of Cell Migration-Inducing Protein (CEMIP). Oncotarget 2015, 6, 20723–20739. [Google Scholar] [CrossRef] [PubMed] [Green Version]
  24. LaPointe, L.C.; Pedersen, S.K.; Dunne, R.; Brown, G.S.; Pimlott, L.; Gaur, S.; McEvoy, A.; Thomas, M.; Wattchow, D.; Molloy, P.L.; et al. Discovery and Validation of Molecular Biomarkers for Colorectal Adenomas and Cancer with Application to Blood Testing. PLoS ONE 2012, 7, e29059. [Google Scholar] [CrossRef] [Green Version]
  25. Tiwari, A.; Schneider, M.; Fiorino, A.; Haider, R.; Okoniewski, M.J.; Roschitzki, B.; Uzozie, A.; Menigatti, M.; Jiricny, J.; Marra, G. Early Insights into the Function of KIAA1199, a Markedly Overexpressed Protein in Human Colorectal Tumors. PLoS ONE 2013, 8, e69473. [Google Scholar] [CrossRef] [Green Version]
  26. Zhang, D.; Zhao, L.; Shen, Q.; Lv, Q.; Jin, M.; Ma, H.; Nie, X.; Zheng, X.; Huang, S.; Zhou, P.; et al. Down-Regulation of KIAA1199/CEMIP by MiR-216a Suppresses Tumor Invasion and Metastasis in Colorectal Cancer. Int. J. Cancer 2017, 140, 2298–2309. [Google Scholar] [CrossRef]
  27. Fink, S.P.; Myeroff, L.L.; Kariv, R.; Platzer, P.; Xin, B.; Mikkola, D.; Lawrence, E.; Morris, N.; Nosrati, A.; Willson, J.K.V.; et al. Induction of KIAA1199/CEMIP Is Associated with Colon Cancer Phenotype and Poor Patient Survival. Oncotarget 2015, 6, 30500–30515. [Google Scholar] [CrossRef] [PubMed] [Green Version]
  28. Hibi, K.; Kitamura, Y.; Mizukami, H.; Goto, T.; Sakuraba, K.; Sakata, M.; Saito, M.; Ishibashi, K.; Kigawa, G.; Nemoto, H.; et al. Frequent CDH3 Demethylation in Advanced Gastric Carcinoma. Anticancer Res. 2009, 29, 3945–3947. [Google Scholar]
  29. Kumara, H.M.C.S.; Bellini, G.A.; Caballero, O.L.; Herath, S.A.C.; Su, T.; Ahmed, A.; Njoh, L.; Cekic, V.; Whelan, R.L. P-Cadherin (CDH3) Is Overexpressed in Colorectal Tumors and Has Potential as a Serum Marker for Colorectal Cancer Monitoring. Oncoscience 2017, 4, 139–147. [Google Scholar] [CrossRef] [PubMed] [Green Version]
  30. Yang, G.-Z.; Hu, L.; Cai, J.; Chen, H.-Y.; Zhang, Y.; Feng, D.; Qi, C.-Y.; Zhai, Y.-X.; Gong, H.; Fu, H.; et al. Prognostic Value of Carbonic Anhydrase VII Expression in Colorectal Carcinoma. BMC Cancer 2015, 15, 209. [Google Scholar] [CrossRef] [Green Version]
  31. Hong, Y.; Liew, S.C.; Thean, L.F.; Tang, C.L.; Cheah, P.Y. Human Colorectal Cancer Initiation Is Bidirectional, and Cell Growth, Metabolic Genes and Transporter Genes Are Early Drivers of Tumorigenesis. Cancer Lett. 2018, 431, 213–218. [Google Scholar] [CrossRef] [PubMed]
  32. Zhang, H.; Du, Y.; Wang, Z.; Lou, R.; Wu, J.; Feng, J. Integrated Analysis of Oncogenic Networks in Colorectal Cancer Identifies GUCA2A as a Molecular Marker. Biochem. Res. Int. 2019, 2019, 6469420. [Google Scholar] [CrossRef] [PubMed] [Green Version]
  33. Feodorova, Y.; Tashkova, D.; Koev, I.; Todorov, A.; Kostov, G.; Simitchiev, K.; Belovejdov, V.; Dimov, R.; Sarafian, V. Novel Insights into Transcriptional Dysregulation in Colorectal Cancer. Neoplasma 2018, 65, 415–424. [Google Scholar] [CrossRef] [PubMed] [Green Version]
  34. Nagaraj, S.H.; Reverter, A. A Boolean-Based Systems Biology Approach to Predict Novel Genes Associated with Cancer: Application to Colorectal Cancer. BMC Syst. Biol. 2011, 5, 35. [Google Scholar] [CrossRef] [PubMed] [Green Version]
  35. Dvorak, P.; Hlavac, V.; Mohelnikova-Duchonova, B.; Liska, V.; Pesta, M.; Soucek, P. Downregulation of ABC Transporters in Non-Neoplastic Tissues Confers Better Prognosis for Pancreatic and Colorectal Cancer Patients. J. Cancer 2017, 8, 1959–1971. [Google Scholar] [CrossRef] [Green Version]
  36. Lin, P.-C.; Lin, H.-H.; Lin, J.-K.; Lin, C.-C.; Yang, S.-H.; Li, A.F.-Y.; Chen, W.-S.; Chang, S.-C. Expression of ABCG2 Associated with Tumor Response in Metastatic Colorectal Cancer Patients Receiving First-Line FOLFOX Therapy--Preliminary Evidence. Int. J. Biol. Markers 2013, 28, 182–186. [Google Scholar] [CrossRef]
  37. Kim, J.H.; Park, J.M.; Roh, Y.J.; Kim, I.-W.; Hasan, T.; Choi, M.-G. Enhanced Efficacy of Photodynamic Therapy by Inhibiting ABCG2 in Colon Cancers. BMC Cancer 2015, 15, 504. [Google Scholar] [CrossRef] [PubMed] [Green Version]
  38. Andersen, V.; Svenningsen, K.; Knudsen, L.A.; Hansen, A.K.; Holmskov, U.; Stensballe, A.; Vogel, U. Novel Understanding of ABC Transporters ABCB1/MDR/P-Glycoprotein, ABCC2/MRP2, and ABCG2/BCRP in Colorectal Pathophysiology. World J. Gastroenterol. 2015, 21, 11862–11876. [Google Scholar] [CrossRef] [Green Version]
  39. To, K.K.W.; Leung, W.W.; Ng, S.S.M. A Novel MiR-203-DNMT3b-ABCG2 Regulatory Pathway Predisposing Colorectal Cancer Development. Mol. Carcinog. 2017, 56, 464–477. [Google Scholar] [CrossRef] [PubMed]
  40. Andersen, V.; Vogel, L.K.; Kopp, T.I.; Sæbø, M.; Nonboe, A.W.; Hamfjord, J.; Kure, E.H.; Vogel, U. High ABCC2 and Low ABCG2 Gene Expression Are Early Events in the Colorectal Adenoma-Carcinoma Sequence. PLoS ONE 2015, 10, e0119255. [Google Scholar] [CrossRef] [PubMed] [Green Version]
  41. Ma, L.; Liu, T.; Jin, Y.; Wei, J.; Yang, Y.; Zhang, H. ABCG2 Is Required for Self-Renewal and Chemoresistance of CD133-Positive Human Colorectal Cancer Cells. Tumour Biol. 2016, 37, 12889–12896. [Google Scholar] [CrossRef]
  42. Abstract 4455: Identification of Novel Oncogene, Copine-7 (CPNE7), in Colorectal Cancer—Cancer Research. Available online: https://cancerres.aacrjournals.org/content/77/13_Supplement/4455 (accessed on 13 January 2021).
  43. Zhu, Z.; Dong, W. Overexpression of HHLA2, a Member of the B7 Family, Is Associated with Worse Survival in Human Colorectal Carcinoma. OncoTargets Ther. 2018, 11, 1563–1570. [Google Scholar] [CrossRef] [PubMed] [Green Version]
  44. Wang, C.; Feng, H.; Cheng, X.; Liu, K.; Cai, D.; Zhao, R. Potential Therapeutic Targets of B7 Family in Colorectal Cancer. Front. Immunol. 2020, 11, 681. [Google Scholar] [CrossRef]
  45. Chan, C.H.F.; Cook, D.; Stanners, C.P. Increased Colon Tumor Susceptibility in Azoxymethane Treated CEABAC Transgenic Mice. Carcinogenesis 2006, 27, 1909–1916. [Google Scholar] [CrossRef] [PubMed] [Green Version]
  46. Messick, C.A.; Sanchez, J.; Dejulius, K.L.; Hammel, J.; Ishwaran, H.; Kalady, M.F. CEACAM-7: A Predictive Marker for Rectal Cancer Recurrence. Surgery 2010, 147, 713–719. [Google Scholar] [CrossRef] [PubMed]
  47. Fischer, H.; Stenling, R.; Rubio, C.; Lindblom, A. Differential Expression of Aquaporin 8 in Human Colonic Epithelial Cells and Colorectal Tumors. BMC Physiol. 2001, 1, 1. [Google Scholar] [CrossRef] [PubMed] [Green Version]
  48. Choi, Y.; Kwon, C.H.; Lee, S.J.; Park, J.; Shin, J.-Y.; Park, D.Y. Integrative Analysis of Oncogenic Fusion Genes and Their Functional Impact in Colorectal Cancer. Br. J. Cancer 2018, 119, 230–240. [Google Scholar] [CrossRef]
  49. Lorenc, Z.; Waniczek, D.; Lorenc-Podgórska, K.; Krawczyk, W.; Domagała, M.; Majewski, M.; Mazurek, U. Profile of Expression of Genes Encoding Matrix Metallopeptidase 9 (MMP9), Matrix Metallopeptidase 28 (MMP28) and TIMP Metallopeptidase Inhibitor 1 (TIMP1) in Colorectal Cancer: Assessment of the Role in Diagnosis and Prognostication. Med. Sci. Monit. 2017, 23, 1305–1311. [Google Scholar] [CrossRef] [Green Version]
  50. Xiao, R.; Li, C.; Chai, B. MiRNA-144 Suppresses Proliferation and Migration of Colorectal Cancer Cells through GSPT1. Biomed. Pharmacother. Biomed. Pharmacother. 2015, 74, 138–144. [Google Scholar] [CrossRef]
  51. Kim, S.W.; Park, K.C.; Jeon, S.M.; Ohn, T.B.; Kim, T.I.; Kim, W.H.; Cheon, J.H. Abrogation of Galectin-4 Expression Promotes Tumorigenesis in Colorectal Cancer. Cell. Oncol. Dordr. 2013, 36, 169–178. [Google Scholar] [CrossRef]
  52. Rao, U.S.; Rao, P.S. Surface-Bound Galectin-4 Regulates Gene Transcription and Secretion of Chemokines in Human Colorectal Cancer Cell Lines. Tumour Biol. 2017, 39. [Google Scholar] [CrossRef] [Green Version]
  53. Ferlizza, E.; Solmi, R.; Miglio, R.; Nardi, E.; Mattei, G.; Sgarzi, M.; Lauriola, M. Colorectal Cancer Screening: Assessment of CEACAM6, LGALS4, TSPAN8 and COL1A2 as Blood Markers in Faecal Immunochemical Test Negative Subjects. J. Adv. Res. 2020, 24, 99–107. [Google Scholar] [CrossRef] [PubMed]
  54. Rodia, M.T.; Solmi, R.; Pasini, F.; Nardi, E.; Mattei, G.; Ugolini, G.; Ricciardiello, L.; Strippoli, P.; Miglio, R.; Lauriola, M. LGALS4, CEACAM6, TSPAN8, and COL1A2: Blood Markers for Colorectal Cancer-Validation in a Cohort of Subjects With Positive Fecal Immunochemical Test Result. Clin. Colorectal Cancer 2018, 17, e217–e228. [Google Scholar] [CrossRef]
  55. Satelli, A.; Rao, P.S.; Thirumala, S.; Rao, U.S. Galectin-4 Functions as a Tumor Suppressor of Human Colorectal Cancer. Int. J. Cancer 2011, 129, 799–809. [Google Scholar] [CrossRef] [Green Version]
  56. Zbánková, S.; Bryndová, J.; Kment, M.; Pácha, J. Expression of 11beta-Hydroxysteroid Dehydrogenase Types 1 and 2 in Colorectal Cancer. Cancer Lett. 2004, 210, 95–100. [Google Scholar] [CrossRef] [PubMed]
  57. Chen, J.; Liu, Q.-M.; Du, P.-C.; Ning, D.; Mo, J.; Zhu, H.-D.; Wang, C.; Ge, Q.-Y.; Cheng, Q.; Zhang, X.-W.; et al. Type-2 11β-Hydroxysteroid Dehydrogenase Promotes the Metastasis of Colorectal Cancer via the Fgfbp1-AKT Pathway. Am. J. Cancer Res. 2020, 10, 662–673. [Google Scholar] [PubMed]
  58. Andrieu, T.; Fustier, P.; Alikhani-Koupaei, R.; Ignatova, I.D.; Guettinger, A.; Frey, F.J.; Frey, B.M. Insulin, CCAAT/Enhancer-Binding Proteins and Lactate Regulate the Human 11β-Hydroxysteroid Dehydrogenase Type 2 Gene Expression in Colon Cancer Cell Lines. PLoS ONE 2014, 9, e105354. [Google Scholar] [CrossRef] [Green Version]
  59. Lian, W.; Jin, H.; Cao, J.; Zhang, X.; Zhu, T.; Zhao, S.; Wu, S.; Zou, K.; Zhang, X.; Zhang, M.; et al. Identification of Novel Biomarkers Affecting the Metastasis of Colorectal Cancer through Bioinformatics Analysis and Validation through QRT-PCR. Cancer Cell Int. 2020, 20, 105. [Google Scholar] [CrossRef] [PubMed]
  60. Yu, M.; Yu, H.-L.; Li, Q.-H.; Zhang, L.; Chen, Y.-X. MiR-4709 Overexpression Facilitates Cancer Proliferation and Invasion via Downregulating NR3C2 and Is an Unfavorable Prognosis Factor in Colon Adenocarcinoma. J. Biochem. Mol. Toxicol. 2019, 33, e22411. [Google Scholar] [CrossRef]
  61. Pesson, M.; Volant, A.; Uguen, A.; Trillet, K.; De La Grange, P.; Aubry, M.; Daoulas, M.; Robaszkiewicz, M.; Le Gac, G.; Morel, A.; et al. A Gene Expression and Pre-MRNA Splicing Signature That Marks the Adenoma-Adenocarcinoma Progression in Colorectal Cancer. PLoS ONE 2014, 9, e87761. [Google Scholar] [CrossRef] [Green Version]
  62. Bhalla, S.; Chaudhary, K.; Kumar, R.; Sehgal, M.; Kaur, H.; Sharma, S.; Raghava, G.P.S. Gene Expression-Based Biomarkers for Discriminating Early and Late Stage of Clear Cell Renal Cancer. Sci. Rep. 2017, 7, 44997. [Google Scholar] [CrossRef] [PubMed] [Green Version]
  63. Zhang, Q.; Zhao, H.; Wu, D.; Cao, D.; Ma, W. A Comprehensive Analysis of the Microbiota Composition and Gene Expression in Colorectal Cancer. BMC Microbiol. 2020, 20, 308. [Google Scholar] [CrossRef]
  64. Reddy, B.S.; Wynder, E.L. Metabolic Epidemiology of Colon Cancer. Fecal Bile Acids and Neutral Sterols in Colon Cancer Patients and Patients with Adenomatous Polyps. Cancer 1977, 39, 2533–2539. [Google Scholar] [CrossRef]
  65. Roomi, M.; Ivanov, V.; Kalinovsky, T.; Niedzwiecki, A.; Rath, M. Synergistic Effect of Combination of Lysine, Proline, Arginine, Ascorbic Acid, and Epigallocatechin Gallate on Colon Cancer Cell Line HCT 116. JANA 2004, 7, 40–43. [Google Scholar]
  66. Karimian, J.; Hadi, A.; Salehi-sahlabadi, A.; Kafeshani, M. The Effect of Arginine Intake on Colorectal Cancer: A Systematic Review of Literatures. Clin. Nutr. Res. 2019, 8, 209–218. [Google Scholar] [CrossRef] [Green Version]
  67. Shortt, C.; Hasselwander, O.; Meynier, A.; Nauta, A.; Fernández, E.N.; Putz, P.; Rowland, I.; Swann, J.; Türk, J.; Vermeiren, J.; et al. Systematic Review of the Effects of the Intestinal Microbiota on Selected Nutrients and Non-Nutrients. Eur. J. Nutr. 2018, 57, 25–49. [Google Scholar] [CrossRef] [PubMed] [Green Version]
  68. Claus, S.P.; Tsang, T.M.; Wang, Y.; Cloarec, O.; Skordi, E.; Martin, F.-P.; Rezzi, S.; Ross, A.; Kochhar, S.; Holmes, E.; et al. Systemic Multicompartmental Effects of the Gut Microbiome on Mouse Metabolic Phenotypes. Mol. Syst. Biol. 2008, 4, 219. [Google Scholar] [CrossRef] [PubMed] [Green Version]
  69. Human Metabolome Database: Showing Metabocard for 5-Aminopentanoic Acid (HMDB0003355). Hmdb.ca. 2020. Available online: https://Hmdb.ca/Metabolites/HMDB0003355 (accessed on 30 November 2020).
  70. Martin, O.C.B.; Olier, M.; Ellero-Simatos, S.; Naud, N.; Dupuy, J.; Huc, L.; Taché, S.; Graillot, V.; Levêque, M.; Bézirard, V.; et al. Haem Iron Reshapes Colonic Luminal Environment: Impact on Mucosal Homeostasis and Microbiome through Aldehyde Formation. Microbiome 2019, 7, 72. [Google Scholar] [CrossRef] [PubMed] [Green Version]
  71. Hinnebusch, B.F.; Meng, S.; Wu, J.T.; Archer, S.Y.; Hodin, R.A. The Effects of Short-Chain Fatty Acids on Human Colon Cancer Cell Phenotype Are Associated with Histone Hyperacetylation. J. Nutr. 2002, 132, 1012–1017. [Google Scholar] [CrossRef] [PubMed] [Green Version]
  72. Sanderson, I.R. Short Chain Fatty Acid Regulation of Signaling Genes Expressed by the Intestinal Epithelium. J. Nutr. 2004, 134, 2450S–2454S. [Google Scholar] [CrossRef] [Green Version]
  73. Acharjee, A.; Ament, Z.; West, J.A.; Stanley, E.; Griffin, J.L. Integration of Metabolomics, Lipidomics and Clinical Data Using a Machine Learning Method. BMC Bioinform. 2016, 17, 440. [Google Scholar] [CrossRef] [Green Version]
  74. Quraishi, M.N.; Acharjee, A.; Beggs, A.D.; Horniblow, R.; Tselepis, C.; Gkoutos, G.; Ghosh, S.; Rossiter, A.E.; Loman, N.; van Schaik, W.; et al. A Pilot Integrative Analysis of Colonic Gene Expression, Gut Microbiota, and Immune Infiltration in Primary Sclerosing Cholangitis-Inflammatory Bowel Disease: Association of Disease with Bile Acid Pathways. J. Crohns Colitis 2020, 14, 935–947. [Google Scholar] [CrossRef] [Green Version]
  75. Martin, F.-P.J.; Wang, Y.; Sprenger, N.; Yap, I.K.S.; Lundstedt, T.; Lek, P.; Rezzi, S.; Ramadan, Z.; van Bladeren, P.; Fay, L.B.; et al. Probiotic Modulation of Symbiotic Gut Microbial–Host Metabolic Interactions in a Humanized Microbiome Mouse Model. Mol. Syst. Biol. 2008, 4, 157. [Google Scholar] [CrossRef] [Green Version]
  76. Gerl, M.J.; Vaz, W.L.C.; Domingues, N.; Klose, C.; Surma, M.A.; Sampaio, J.L.; Almeida, M.S.; Rodrigues, G.; Araújo-Gonçalves, P.; Ferreira, J.; et al. Cholesterol Is Inefficiently Converted to Cholesteryl Esters in the Blood of Cardiovascular Disease Patients. Sci. Rep. 2018, 8, 14764. [Google Scholar] [CrossRef]
  77. Bent, S.; Lawton, B.; Warren, T.; Widjaja, F.; Dang, K.; Fahey, J.W.; Cornblatt, B.; Kinchen, J.M.; Delucchi, K.; Hendren, R.L. Identification of Urinary Metabolites That Correlate with Clinical Improvements in Children with Autism Treated with Sulforaphane from Broccoli. Mol. Autism 2018, 9, 1–12. [Google Scholar] [CrossRef] [Green Version]
  78. Leoni, A.; Locatelli, A.; Morigi, R.; Rambaldi, M. 2-Indolinone a Versatile Scaffold for Treatment of Cancer: A Patent Review (2008–2014). Expert Opin. Ther. Pat. 2016, 26, 149–173. [Google Scholar] [CrossRef]
  79. Kaminska, K.K.; Bertrand, H.C.; Tajima, H.; Stafford, W.C.; Cheng, Q.; Chen, W.; Wells, G.; Arner, E.S.J.; Chew, E.-H. Indolin-2-One Compounds Targeting Thioredoxin Reductase as Potential Anticancer Drug Leads. Oncotarget 2016, 7, 40233–40251. [Google Scholar] [CrossRef] [PubMed] [Green Version]
  80. Karthikeyan, C.; Amawi, H.; Ashby, C.R.; Khare, V.M.; Jones, V.; Hari Narayana Moorthy, N.S.; Trivedi, P.; Tiwari, A.K. Novel 3-((2-Chloroquinolin-3-Yl)Methylene)Indolin-2-One Derivatives Produce Anticancer Efficacy in Ovarian Cancer in Vitro. Heliyon 2019, 5, e01603. [Google Scholar] [CrossRef] [Green Version]
  81. Louis, E.D.; Pellegrino, K.M.; Factor-Litvak, P.; Rios, E.; Jiang, W.; Henchcliffe, C.; Zheng, W. Cancer and Blood Concentrations of the Comutagen Harmane in Essential Tremor. Mov. Disord. 2008, 23, 1747–1751. [Google Scholar] [CrossRef] [PubMed] [Green Version]
  82. Munteanu, I.; Mastalier, B. Genetics of Colorectal Cancer. J. Med. Life 2014, 7, 507–511. [Google Scholar] [PubMed]
  83. Smith, G.; Carey, F.A.; Beattie, J.; Wilkie, M.J.V.; Lightfoot, T.J.; Coxhead, J.; Garner, R.C.; Steele, R.J.C.; Wolf, C.R. Mutations in APC, Kirsten-Ras, and P53—Alternative Genetic Pathways to Colorectal Cancer. Proc. Natl. Acad. Sci. USA 2002, 99, 9433–9438. [Google Scholar] [CrossRef] [Green Version]
  84. Song, K.; Su, W.; Liu, Y.; Zhang, J.; Liang, Q.; Li, N.; Guan, Q.; He, J.; Bai, X.; Zhao, W.; et al. Identification of Genes with Universally Upregulated or Downregulated Expressions in Colorectal Cancer. J. Gastroenterol. Hepatol. 2019, 34, 880–889. [Google Scholar] [CrossRef]
  85. The Cancer Genome Atlas (TCGA) RNA-Seq Meta-Analysis 2018. Available online: https://portal.gdc.cancer.gov/projects/TCGA-COAD (accessed on 30 November 2020).
  86. Kapelner, A.; Bleich, J. bartMachine: Machine Learning with Bayesian Additive Regression Trees. J. Stat. Softw. 2016, 70, 1–40. [Google Scholar] [CrossRef] [Green Version]
  87. Chipman, H.A.; George, E.I.; McCulloch, R.E. BART: Bayesian Additive Regression Trees. Ann. Appl. Stat. 2010, 4, 266–298. [Google Scholar] [CrossRef]
  88. RNA-Seq Workflow: Gene-Level Exploratory Analysis and Differential Expression. Available online: https://bioconductor.org/packages/release/workflows/vignettes/rnaseqGene/inst/doc/rnaseqGene.html (accessed on 13 January 2021).
  89. Sun, Y.; Wong, A.K.C.; Kamel, M.S. Classification of Imbalanced Data: A Review. Int. J. Pattern Recognit. Artif. Intell. 2009, 23, 687–719. [Google Scholar] [CrossRef]
  90. Yen, S.-J.; Lee, Y.-S. Under-Sampling Approaches for Improving Prediction of the Minority Class in an Imbalanced Dataset. In Intelligent Control and Automation, International Conference on Intelligent Computing, ICIC 2006 Kunming, China, 16–19 August 2006; Huang, D.-S., Li, K., Irwin, G.W., Eds.; Lecture Notes in Control and Information Sciences; Springer: Berlin/Heidelberg, Germany, 2006; pp. 731–740. ISBN 978-3-540-37256-1. [Google Scholar]
  91. R Core Team. Caret: Classification and Regression Training; R Foundation for Statistical Computing: Vienna, Austria, 2020. [Google Scholar]
Figure 1. (a) Results from Kim et al. microbiome and metabolome analysis using BART methods; (a) Bayesian Additive Regression Trees (BART) model partial dependence plots for harmane, plotted at various quantiles (x-axis). y-axis shows the probits, a value of 0 indicates that CRC and normal are equally likely; values above 0 indicate that CRC is more likely and values below 0 indicate CRC is less likely. The shaded area shows the 0.95 Bayesian credible intervals of the probits; (b) BART model partial dependence plots for 5-aminovalerate, plotted at various quantiles (x-axis). y-axis shows the probits, a value of 0 indicates that CRC and normal are equally likely; values above 0 indicate that CRC is more likely and values below 0 indicate CRC is less likely. The shaded area shows the 0.95 Bayesian credible intervals of the probits; (c) matrix of counts of pairwise interactions from the BART mode, shown in the heatmap. The genera are Veillonella (OTU57), Eubacterium (OTU37), Haemophilus (OTU65), Adlercreutzia (OTU2), Anaerotruncus (OTU23), and SMB53 (OTU53). The metabolic and microbiome features are separated.
Ijms 22 05763 g001
Figure 2. Partial dependence on CRC for representative pairs of microbial/metabolomic features, shown as contour plots, coloured by log-odds of CRC. Higher values (yellow) indicate increased risk of CRC; lower values (blue) indicate decreased risk of CRC; a value of 0 indicates the risks are equal. Plots for more feature pairs can be found in Supplementary Figure S2. Top to bottom: (5-aminovalerate, harmane), (5-aminovalerate, 1,2-Dilinoleoyl-GPC), (5-aminovalerate, 1-oleoyl-2-linoleoyl-GPC), (guanosine, 5-aminovalerate).
Ijms 22 05763 g002
Figure 3. Partial results for Clos-Garcia microbiome and metabolome analysis using BART methods; (a) partial dependence plot of ChoE(20:4); (b) contour plots for microbiome–metabolome interactions between (1) Staphylococcus (OTU7517) and ChoE(20:4), (2) Blautia (OTU14967) and ChoE(20:4), (3) Roseburia (OTU9785) and ChoE(20:4); microbial interactions between (1) Roseburia (OTU9785) and Staphylococcus (OTU7517), (2) Blautia (OTU5962) and an unknown genus from family Lachnospiraceae (OTU17213), (3) OTU17213 and Blautia (OTU14967). The z-value (level) is the log-odds of CRC, interpreted in the same way as Figure 2.
Ijms 22 05763 g003
Figure 4. (a) Volcano plot for 6066 genes selected after preprocessing with p adjusted cut-off 10e-100 shown. Significantly up- or downregulated genes are shown in red; (b) enrichment analysis of the 76 genes participating in pathways that are presented in barplot. (c) Venn diagram representation of the common genes between bulk RNAseq analysis and single-cell analysis. In total 17 genes were found common between the RNA and single cell datasets.
Ijms 22 05763 g004aIjms 22 05763 g004b
Figure 5. (a) Shows the heatmaps for the 17 genes in the bulk RNA sequencing dataset; (b) heatmap for the 17 genes (single cell RNA sequencing). Red denotes upregulation, white indicates no expression or zero expression and blue depicts low expression; both heatmaps were performed using hierarchical clustering on the rows. The three clusters are coloured as red, black and green; (c) the network was generated using the 17 genes that were found to be differentially expressed in the network. The seed genes are labelled and shown in red, while the proteins connected to these genes are shown in green. The interactions between the genes and the proteins are shown in red. The blue coloured proteins or seed genes are involved in the metabolic pathways from KEGG.
Ijms 22 05763 g005
Figure 6. ABCG2 and AQP8 genes are responsible for bile secretion and bile is converted to cholesterol by the gut enzymes [63]. Cholesterol is further converted to coprostanol by members of the Lachnospiraceae family [64].
Ijms 22 05763 g006
Figure 7. Diagrammatic representation of the qualitative integration of different methods and omics data sets to identify markers for colorectal cancer using metabolomics, transcriptomics (single-cell RNA and bulk RNA) and microbiome data sets. Gene set enrichment was used to identify associations between the genes and metabolites.
Ijms 22 05763 g007
Table 1. List of the 17 genes and evidence of their involvement in regulation across normal and CRC patients.
Gene SymbolNormal vs. CRC (Bulk RNA Seq)Normal vs. CRC (Single-Cell RNA Seq) Epithelial CellsReference
ADH1BDownregulatedDownregulated[21]
KIAA1199 (CEMIP)UpregulatedUpregulated[22,23,24,25,26,27]
CDH3UpregulatedUpregulated[5,28,29]
CA7DownregulatedDownregulated[30,31]
GUCA2BDownregulatedDownregulated[32,33,34]
ABCC13DownregulatedDownregulated[35]
ABCG2DownregulatedDownregulated[36,37,38,39,40,41]
CPNE7UpregulatedUpregulated[42]
HHLA2DownregulatedDownregulated[43,44]
CEACAM7DownregulatedDownregulated[45,46]
AQP8DownregulatedDownregulated[47]
GTF3AUpregulatedUpregulated[48]
MMP28DownregulatedDown regulated[49,50]
LGALS4DownregulatedDownregulated[51,52,53,54,55]
HSD11B2DownregulatedDownregulated[56,57,58]
CHP2DownregulatedDownregulated[59]
NR3C2DownregulatedDownregulated[32,34,60,61,62]
Table 2. Description of the microbiome, metabolome, bulk RNA sequencing and single cell sequencing datasets.
Data SetFeaturesSampleReference
Kim et al., 202016S rRNA and metabolomicsNormal (N = 102) vs.
Colorectal cancer (N = 36)
[8]
Clos-Garcia et al., 202016S rRNA and metabolomicsNormal (N = 77) vs.
Colorectal cancer (N = 99)
[11]
The Cancer Genome Atlas (TCGA) ColonAdenocarcinomaRNA sequenceNormal (N = 41) vs.
Colon Adenocarcinoma (N = 459)
[85]
Li et al., 2017Single-cell transcriptomesNormal (N = 1591 cells) vs.
Colorectal cancer (N = 1591 cells)
[17]
Zhang et al., 2019Single-cell transcriptomesNormal (N = 160 cells) vs.
Colorectal cancer (N = 272 cells)
[19]
Publisher’s Note: MDPI stays neutral with regard to jurisdictional claims in published maps and institutional affiliations.

