Article

Intermittent Hypobaric Hypoxic Preconditioning Provides Neuroprotection by Increasing Antioxidant Activity, Erythropoietin Expression and Preventing Apoptosis and Astrogliosis in the Brain of Adult Rats Exposed to Acute Severe Hypoxia

1
Department of Cellular Biology, Physiology and Immunology, Faculty of Biology, Universitat de Barcelona, Av. Diagonal 643, 08028 Barcelona, Spain
2
Department of Neurophychiatry and Behavioural Science, Universidade Federal de Pernambuco, Av. da Engenharia, 186-298, Cidade Universitaria, Recife 50740-600, PE, Brazil
*
Author to whom correspondence should be addressed.
Int. J. Mol. Sci. 2021, 22(10), 5272; https://doi.org/10.3390/ijms22105272
Submission received: 25 March 2021 / Revised: 26 April 2021 / Accepted: 13 May 2021 / Published: 17 May 2021
(This article belongs to the Special Issue Brain Hypoxia: Mechanisms of Resilience and Tolerance)

Abstract

:
Background: Exposure to intermittent hypoxia has been demonstrated to be an efficient tool for hypoxic preconditioning, preventing damage to cells and demonstrating therapeutic benefits. We aimed to evaluate the effects of respiratory intermittent hypobaric hypoxia (IHH) to avoid brain injury caused by exposure to acute severe hypoxia (ASH). Methods: biomarkers of oxidative damage, mitochondrial apoptosis, and transcriptional factors in response to hypoxia were assessed by Western blot and immunohistochemistry in brain tissue. Four groups of rats were used: (1) normoxic (NOR), (2) exposed to ASH (FiO2 7% for 6 h), (3) exposed to IHH for 3 h per day over 8 days at 460 mmHg, and (4) ASH preconditioned after IHH. Results: ASH animals underwent increased oxidative-stress-related parameters, an upregulation in apoptotic proteins and had astrocytes with phenotype forms compatible with severe diffuse reactive astrogliosis. These effects were attenuated and even prevented when the animals were preconditioned with IHH. These changes paralleled the inhibition of NF-κB expression and the increase of erythropoietin (EPO) levels in the brain. Conclusions: IHH exerted neuroprotection against ASH-induced oxidative injury by preventing oxidative stress and inhibiting the apoptotic cascade, which was associated with NF-κB downregulation and EPO upregulation.

1. Introduction

The mammalian brain requires a continuous supply of oxygen to maintain its structure and properly develop its function. When undergoing hypoxia, brain cells may remodel, became injured or die depending on the severity and duration of the hypoxic insult. Thus, the brain cannot tolerate a significant reduction in partial pressure of oxygen (PO2) for long periods due to the inability of the anaerobic glycolysis metabolic pathway to provide enough energy supply [1]. Since only the oxidative metabolism can provide the high-energy demands required by brain cells, a continuous supply of oxygen and glucose is needed, making the brain a very sensitive organ PO2 reductions, such as in conditions of respiratory hypoxia [2,3]. However, sublethal hypoxic conditions stimulate neurogenesis and angiogenesis by the secretion of trophic factors [4], as has been described during embryonic brain development, where oxygen concentrations ranging from 1% to 5% allow the CNS cells to differentiate and proliferate, indicating that under certain circumstances, hypoxia plays an important role in neurogenesis, neuroprotection and neuronal survival [5]. In fact, it is known that brief hypoxia exposures can elicit neuroprotection by enhancing the tolerance of the exposed organism to ischemia [6] or severe hypoxia (see for review [7]). Brain preconditioning is a phenomenon by which repeated doses of a stressful sublethal stimulus protect the brain against subsequent injury. Intermittent hypoxia, i.e., repeated episodes of hypoxia interspersed with episodes of normoxia, is a form of preconditioning widely used to induce neuroprotection against severe hypoxia and ischemia [8]. Although both in hypoxia and ischemia, oxygen deficiency is a common factor, ischemia is a hypoxic episode characterized by insufficient nutrient supply due to decreased perfusion. In contrast, respiratory hypoxia involves decreased oxygen concentration in the tissue without affecting blood flow and nutrient supply [9]. The effects of preconditioning on the expression of antioxidants and apoptosis-related factors have been studied extensively in cerebral ischemia (see, for example, [10,11]), but few studies have addressed the effects of hypoxic preconditioning after respiratory hypobaric hypoxia in the brain [12,13,14,15]. Hypoxic preconditioning and its involved adaptive factors are interesting because hypoxia is at the base of the pathogenesis of many diseases, and preventing damage to cells by inducing milder processes that cause it could have several therapeutic benefits. Several uses of hypoxic preconditioning have been proposed. For example, to protect the neonatal brain, which is susceptible to hypoxic–ischemic injury due to its developmental characteristics [16]; to act against ischemic cell death that takes place in stroke [17], or to be used in preoperative interventions [9].
Hypoxic preconditioning could induce its neuroprotective action by triggering several mechanisms, such as enhancing vascular regulation, the activation of antiapoptosis and antioxidant signaling pathways, the suppression of excitotoxicity and the promotion of cell proliferation [16]. The hypoxia-inducible factor (HIF) has emerged as the master transcriptional regulator of oxygen homeostasis, controlling the expression of multiple genes, including those that encode erythropoietin (EPO) and other proteins involved in red blood cell production and, thus, increasing blood oxygen-carrying capacity that may contribute to hypoxia-induced tolerance [18]. Moreover, over the last few years, a neuroprotective role for EPO has been described. It has been shown that in neurons, the binding of EPO to its receptor leads to the activation of several signaling pathways ending in transcription factors that move to the nucleus and initiate the expression of Bcl-2 and Bcl-xL genes [19]. These proteins play a pivotal role in counteracting the activation of proapoptotic proteins by regulating the permeabilization of the mitochondrial outer membrane and consequently the release of cytochrome c into cytoplasm and the mitochondrial intrinsic apoptotic pathway [20]. The response to hypoxia is not only based on HIF since many other transcription factors have shown a response to hypoxia [21]. Among these is the transcription factor family Nuclear Factor-κB (NF-κB) formed by five different proteins that can diversely combine to form an active transcriptional dimer implicated in regulating cellular proliferation, inflammatory response, cell apoptosis and cell survival [22,23]. Oxidative stress that results from hypoxia exposure also plays an important role in the activation of NF-κB [21,24]. Recently, some evidence has been provided about the function of astrocytes as specialized CNS sensors for detecting physiological decreases in brain oxygenation [25]. The detection of low PO2 by these cells would stimulate the neurons that contribute to the respiratory response to hypoxia and increase the oxygenation of the arterial blood. Additionally, astrocytes are believed to release vasoactive substances, significantly affecting cerebral vasculature by controlling local cerebral microcirculation at low PO2 [26].
The present work aimed to evaluate the effects of an intermittent hypobaric hypoxia preconditioning protocol (4 h/day for 8 days at 460 mmHg) on brain injury caused by exposure to acute severe normobaric hypoxia (6 h at 7% FiO2), analyzing the pro-oxidant and antioxidant system, mitochondrial apoptotic markers, levels of hypoxia transcriptional factors, EPO and astrocyte’s morphology and reactivity in the brains of rats.

2. Results

2.1. Oxidative Stress

Exposure to ASH generated increased oxidative stress that led to significantly (p < 0.001) higher levels of lipid (thiobarbituric acid reactive substances, TBARS) and protein oxidation (advanced oxidation protein products, AOPP) and nitric oxide species (NOx) (Figure 1). This increase was prevented in IHH and IHH+ASH, showing a statistically significant reduction compared to ASH. Antioxidant enzymes, such as superoxide dismutase (SOD) and reduced glutathione (GSH), decreased significantly in ASH and recovered in both groups exposed to intermittent hypoxia (Table 1). Reduced glutathione (GSH) decreased significantly in all hypoxia-exposed groups, and oxidized glutathione (GSSG) showed no statistical differences between the groups. However, the greater significant decrease in GSH combined with the non-significant increase in GSSG resulted in a statistically significant decrease (p < 0.001) in GSH/GSSG ratio in ASH. This ratio did not show significant differences either in IHH or in IHH+ASH when compared to NOR. Glutathione peroxidase (GPx) was reduced in all the hypoxic groups, especially in those exposed to intermittent hypoxia, which presented statistically significant differences not only to NOR but also to ASH. Glutathione reductase (GR) decreased significantly due to the ASH insult, which was prevented both in IHH and IHH+ASH groups.

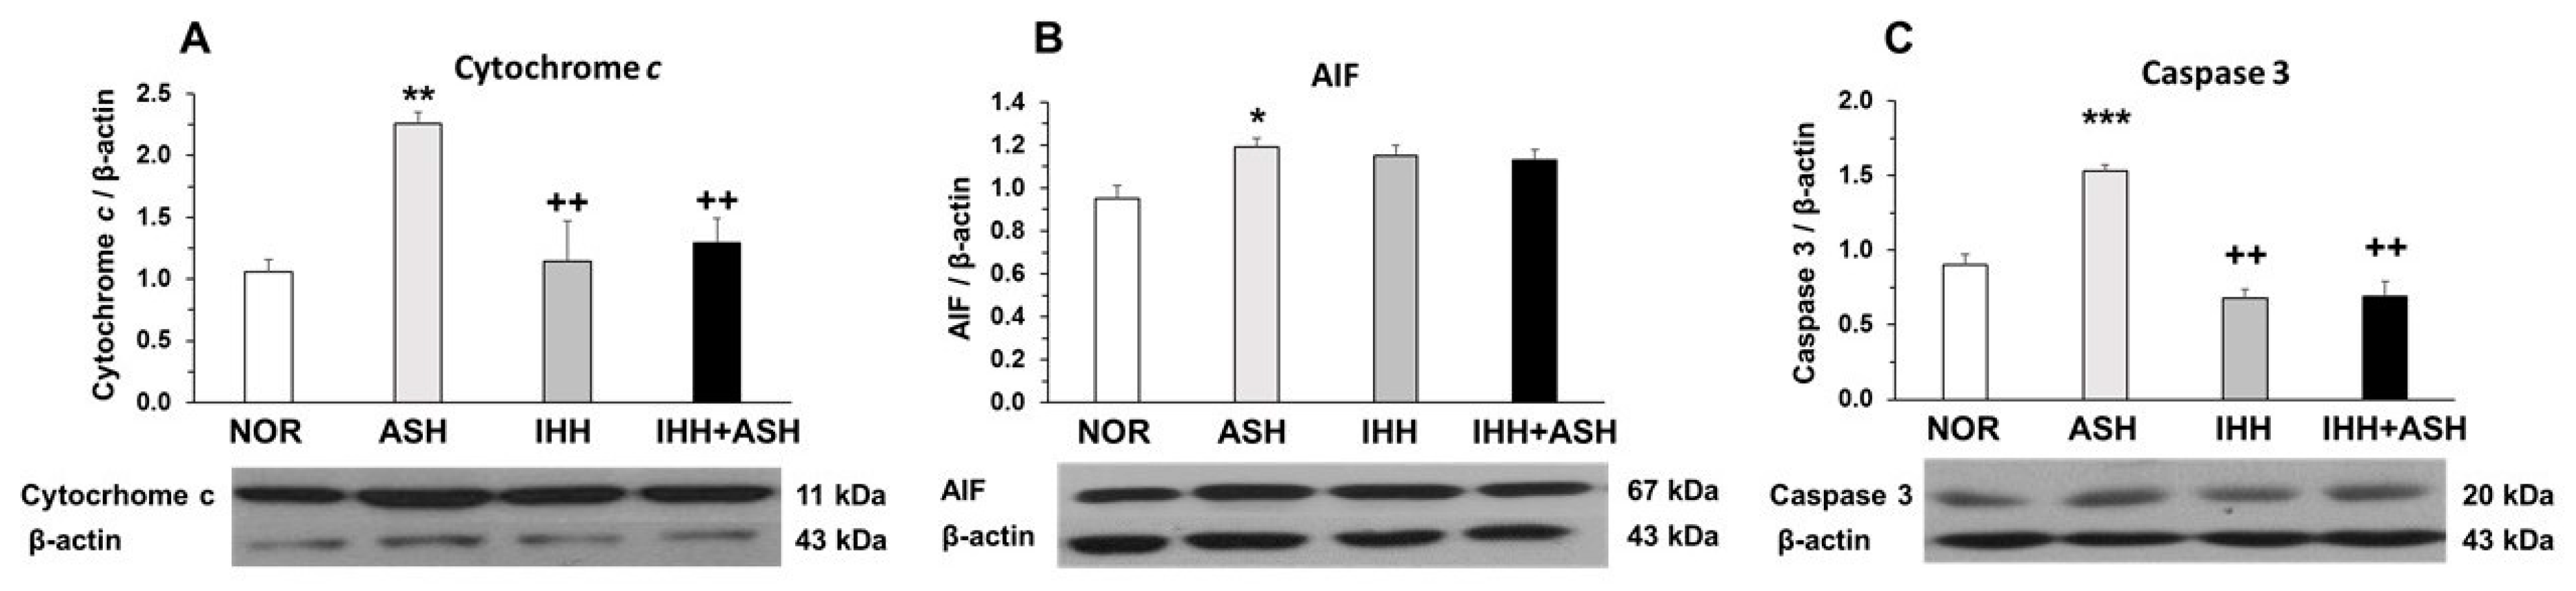
2.2. Mitochondrial Apoptosis

The measured mitochondrial apoptosis indicators, i.e., cytochrome c, apoptosis-inducing factor (AIF) and active caspase-3, showed significant increases in ASH, as indicated by Western blot semi-quantification (Figure 2). However, cytochrome c (Figure 2A) and active caspase-3 (Figure 2C) expression were similar to NOR levels in both IHH and IHH+ASH groups, having statistically significant lower levels when compared to ASH. The slight decrease in AIF was not statistically significant (Figure 2B).

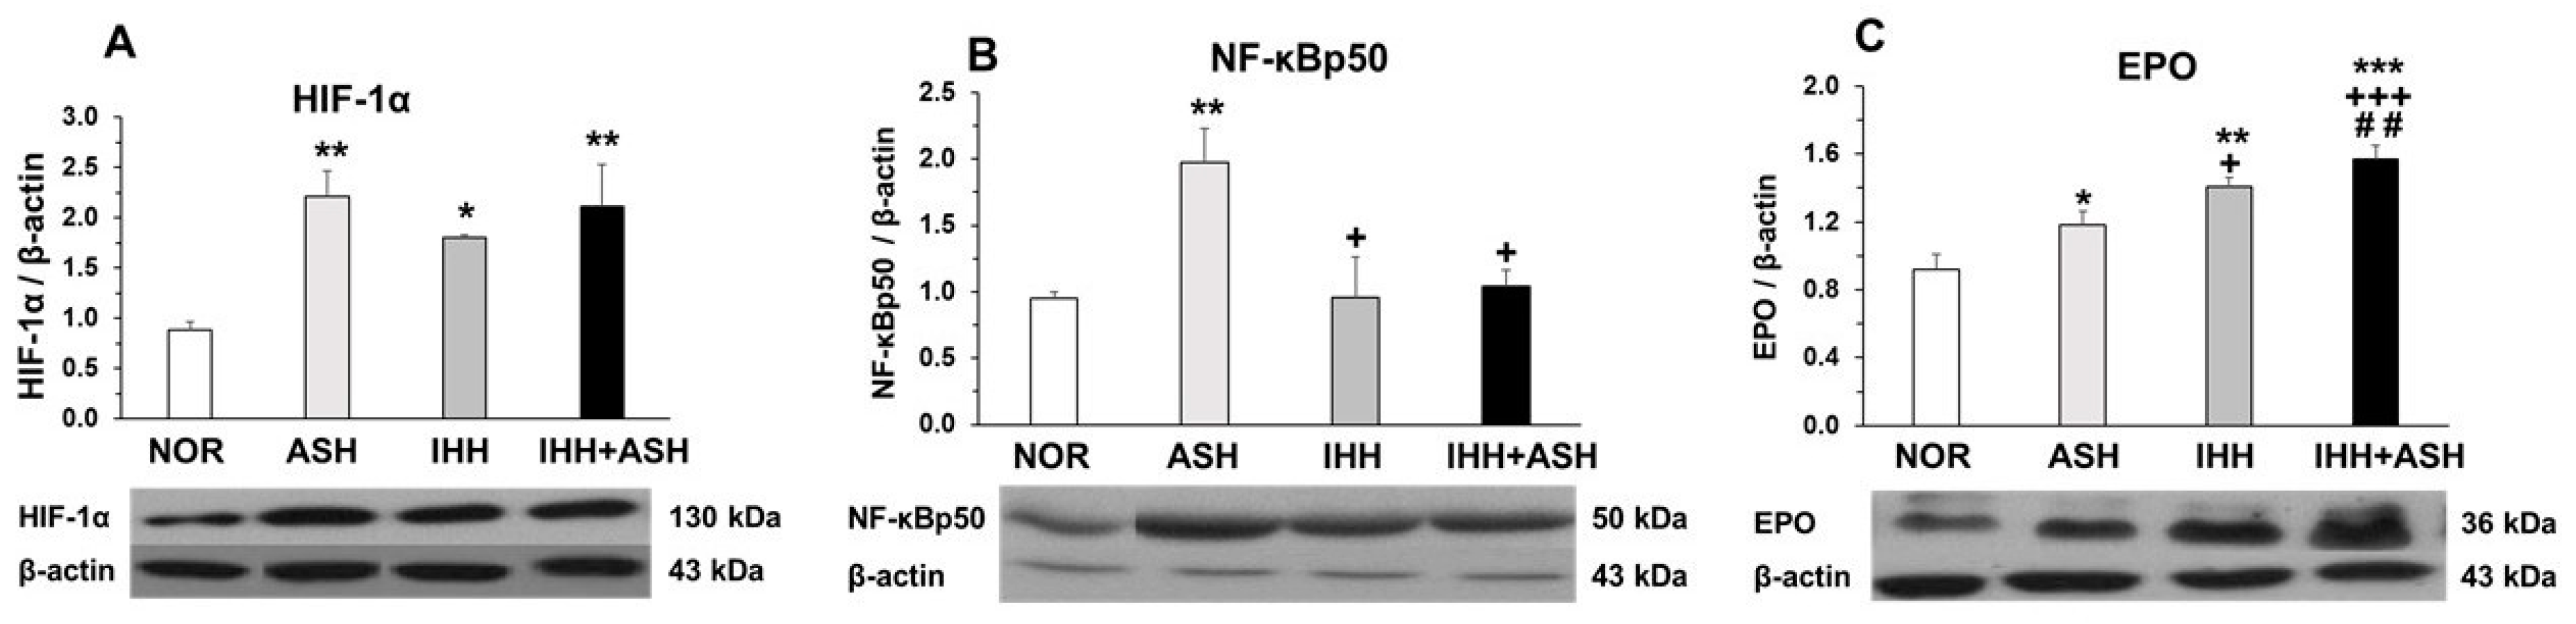
2.3. Transcriptional Factors in Response to Hypoxia

Similarly, the expression of HIF-1α significantly increased in the brain of all the groups exposed to hypoxia compared to the normoxic group (Figure 3A). The expression of the phosphorylated p50 subunit of NF-κB also increased significantly in ASH (Figure 3B), but, in contrast to what was found in HIF-1α, the expression of NF-κBp50 in intermittent hypoxia-exposed groups did not differ from NOR, both groups presenting significant differences when compared to ASH.

2.4. Erythropoietin (EPO) Expression in the Brain

Figure 3C shows the EPO levels in the brains of the four groups of rats. It can be seen that all hypoxia-exposed animals had higher statistically significant concentrations of EPO. The greatest EPO response to hypoxia was observed in IHH+ASH, which showed an additive effect to IHH and ASH exposure. Statistically significant differences were observed between all groups showing an accumulative effect from ASH, IHH to IHH+ASH.

2.5. Astrocytes

Figure 4 shows representative immunohistochemical slides from the Cornus ammonis CA1 hippocampus region stained for glial fibrillary acidic protein (GFAP). The quantitative analysis of the astrocyte morphology (soma areas and processes length) and the intensity of GFAP immunoreactivity are summarized in Figure 5. Exposure to acute severe respiratory hypoxia caused a severe diffuse reactive astrogliosis in ASH. Astrocytes from this group evidenced significant changes in their morphology with hypertrophy of the cellular bodies (larger soma areas) and retraction of the cellular extensions (shorter cell processes length) when compared to NOR astrocytes (Figure 4F,J–L and Figure 5A). Moreover, ASH astrocytes had a significant increase in GFAP protein immunoreactivity (Figure 5B). These morphological changes and immunoreactivity patterns did not appear in animals exposed to intermittent hypobaric hypoxia. In these animals, the soma areas (Figure 5A) and the expression of astrocyte GFAP immunoreactivity were significantly decreased (Figure 5B) together with a proliferation of the cellular processes compared with NOR (Figure 4 and Figure 5A). Thus, preconditioning by intermittent hypoxia (IHH+ASH) reduced the astrogliosis intensity caused by severe respiratory hypoxia compared to (ASH).

3. Discussion

We investigated the effects on the brain of a preconditioning protocol of exposure to intermittent hypobaric hypoxia before an acute severe normobaric hypoxia insult. In summary, the results show that: (1) exposure to ASH caused oxidative stress in the brain, as demonstrated by significant increases in lipid and protein oxidation and the NOx levels; a drop in the antioxidant capacity, as indicated the significant decrease in SOD activity, GSH levels and GSH/GSSG ratio; and activated the mitochondrial apoptotic pathway, as shown by the significant boost of cytochrome c, AIF and caspase-3 expression; (2) a protocol of IHH before exposure to ASH prevented these deleterious effects avoiding oxidative stress and maintaining the antioxidant capacity and the apoptotic markers at baseline (NOR) conditions; (3) the expression of HIF-1α and EPO in the brain of all groups exposed to hypoxia increased significantly when compared to NOR, both acute-exposed and preconditioned animals presenting similar values for HIF-1α, but the preconditioned group (IHH+ASH) having significantly higher EPO expression than the ASH- or IHH-exposed groups; (4) in contrast to this behavior, the significant increase found in NF-κB levels after ASH exposure was prevented by the IHH protocol; (5) ASH induced in hippocampus astrocytes’ morphology changes compatible with severe diffuse reactive astrogliosis, while IHH+ASH reduced the astrogliosis intensity to mild to moderate and increased GFAP expression compared to NOR.

3.1. Oxidative Stress

Brains from rats exposed to severe hypoxia (ASH) increased their oxidant activity leading to the oxidation of lipids (TBARS), proteins (AOPP) and nitric oxide species (NOx) (Figure 1). This was concomitant with decreased antioxidant activity as the decrease of SOD and GR activities and the ratio GSH/GSSG indicated (Table 1). All these results conform to a situation of oxidative distress [27] and are coincident with previous results from our group [28] and with findings reported by others [29,30,31].
Under normoxic conditions, the combined action of antioxidants and oxidants maintains the homeostasis of free radicals. Since cell survival depends on strict regulation of the free radical content, an excess of free radicals leads to a situation of oxidative distress, while a deficit of free radicals (specifically hydrogen peroxide) leads to oxidative eustress, which may affect important cellular signaling pathways [32]. Neurons obtain ATP primarily through oxidative phosphorylation via the mitochondrial electron transport chain, a process where it is a continuous production of the radical superoxide (O2). This radical is maintained within homeostatic levels by antioxidant systems, such as SOD [33,34]. Severe hypoxia affects the process of mitochondrial oxidative phosphorylation leading to increased production of O2 [35] and decreased antioxidant capacity elicited by SOD and GR [36]. SOD functions keeping the O2 homeostatic levels generating H2O2, which is converted to H2O by oxidation of GSH to GSSG through a concerted cascade of mechanisms involving GPx and GR [37]. Our results show that exposure to severe hypoxia (ASH) caused decreased SOD and GSH and increased GSSG, resulting in a decreased GSH/GSSG ratio (Table 1). Under normoxic conditions, this ratio is maintained by the action of GR and is decreased in hypoxia [29]. Thus, the increased production of reactive oxygen species (ROS) coupled with the decrease in SOD observed in our study in ASH implies that a fraction of the O2 is not reduced to H2O2. In the same way, the decreased levels of GSH may be insufficient to reduce the H2O2 to H2O, leading to a buildup of H2O2. These conditions derive from an accumulation of O2 and H2O2, which can, respectively, react either with NO, forming peroxynitrite (ONOO) or with ferrous ion (Fe2+) rendering OH and Fe3+ (Fenton reaction) [38]. Both ONOO and OH are highly reactive radicals, which explain the presence of oxidized forms of lipids and proteins that we have found in the brains of the ASH rats (Figure 1).
Our results show that the above-mentioned oxidative stress caused by the acute exposure to severe hypoxia was inhibited when the animals were previously exposed to a protocol of intermittent hypobaric hypoxia. IHH+ASH animals had a level of oxidation of lipids and proteins and the presence of NOx similar to the NOR group, with significantly lower values than ASH (Figure 1). Moreover, the antioxidant activity of SOD, GR, and the ratio GSH/GSSG did not differ from those observed in the brains of NOR rats (Table 1), indicating that the preconditioning protocol of intermittent hypoxia had a neuroprotective effect by preventing oxidative distress. Similar results were obtained by Stroev et al. [15] using a shorter hypoxic preconditioning protocol and exposing the animals to a more severe acute hypoxia. However, the present study additionally shows that preconditioning elevated SOD levels without a period of reoxygenation after IHH+ASH. As a future perspective to confirm these findings, it would be interesting to analyze protein or mRNA abundance of catalase and peroxidase since ROS damage caused by H2O2 can be mitigated by these enzymes. Additionally, to analyze some electron transport chain complex subunits (e.g., complex I or complex III) would also be particularly interesting due to the high mitochondrial sensibility to hypoxia.
There is concluding evidence that oxidative stress is linked to several neuropathological processes involving specific mitochondrial targets [39], suggesting that the mitochondria could be the main cell sites where brain damage produced by severe acute hypoxia exposure would act. In fact, under hypoxic conditions, mitochondria are the major source of ROS [40,41], and it is well-known that hypoxia alters mitochondrial function by affecting the oxidative phosphorylation due to decreased electron transport rate, a reduction of the mitochondrial membrane potential (∆ψm), and an enhanced nitric oxide synthase [42,43,44]. Furthermore, the mitochondria can be targeted by their own radicals [45], and in turn, ROS and reactive nitrogen species can interact to form peroxynitrite, affecting the function of key enzymes, such as mitochondrial complex I and resulting in less ATP production [39]. This complex interplay between oxidative stress and mitochondrial dysfunction may lead to a mechanism that activates the proapoptotic cascade. Thus, we aimed to determine if preconditioning, demonstrating prevention of oxidative stress, would also prevent mitochondrial apoptosis.

3.2. Mitochondrial Apoptosis

Levels of mitochondrial apoptosis markers, such as cytochrome c, AIF and active caspase-3, showed a significant increase in the brains of rats exposed to ASH (Figure 2). In contrast, when ASH was preceded by IHH exposure (IHH+ASH), the levels of cytochrome c and active caspase-3 did not differ from those found in normoxic rats. This antiapoptotic behavior induced by IHH preconditioning matches the prevention of oxidative stress markers, suggesting that prevention of oxidative stress in IHH and IHH+ASH groups also avoided mitochondrial dysfunction and apoptosis. Some explanation to the neuronal protective mechanisms involved after hypoxic preconditioning could be derived from a work that analyzed immunohistochemically the patterns of expression of antiapoptotic proteins Bcl-2 and Bcl-xL in rat hippocampus and neocortex after three sessions of IHH [13], where it was concluded that the protective action was in part mediated by the shift of neuronal Bax/Bcl-2-Bcl–xL ratio.
Contrasting with the results obtained for cytochrome c and caspase-3, we did not find significant differences in AIF levels between IHH and IHH+ASH groups and ASH (Figure 2B), suggesting that AIF was not involved in the mechanisms of neuroprotection induced by IHH. Since AIF has been described as a neuroprotective factor in the processes of excitotoxicity [46], our results suggest that the harmful effect caused by ASH in the brain is not associated with excitotoxicity, as is in the case of ischemic hypoxia. This conclusion agrees with other studies [47,48], reinforcing the idea that, although hypoxia is the determining factor in both severe respiratory hypoxia and ischemic hypoxia, respiratory hypoxia induces different responses in the brain from those induced by ischemic hypoxia.

3.3. Transcriptional Factors in Response to Hypoxia

The expression of HIF-1α increased in the brain of all the groups exposed to hypoxia compared to the normoxic group (Figure 3A), with no significant differences between animals exposed to ASH and those exposed to IHH+ASH. Since ASH caused significant oxidative stress, while preconditioning with IHH did not, the expression of HIF-1α seems independent of the presence of a state of oxidative stress in the brain, although it has been described that free radicals induced by hypoxia stabilize HIF-1α [49,50]. In any case, our results indicate that HIF-1α does not play an important role in preconditioning processes induced by IHH.
NF-κB had a similar type of behavior to HIF-1α in ASH rats, presenting a significant increase in the expression of its phosphorylated p50 subunit (Figure 3B). This increased expression of NF-κBp50 in response to exposure to severe hypoxia was already observed in previous work from our laboratory [28] and reported by others [22,51]. However, contrasting with HIF-1α, in the brains of IHH-exposed rats, the expression of NF-κB did not differ from the levels found in the brains of normoxic rats. Thus, there is a different type of behavior in response to hypoxia between HIF-1α and NF-κB since IHH interferes with the activation mechanisms of the NF-κBp50 subunit, but not with those of HIF-1α expression. Overall, these results indicate that the decrease in NF-κB in the brain of IHH and IHH+ASH rats was associated with the neuroprotective effect derived from reducing oxidative stress and the apoptotic markers and was independent of the expression levels of HIF-1α. Although the mechanisms of activation of NF-κB in response to hypoxia are very complex and not well-known [22,24], our results indicate that, while the expression of NF-κB depend on the occurrence of oxidative stress [52], the expression of HIF-1α depends on the hypoxic stimulus, regardless of whether it generates oxidative stress or not. Our results contrasted with those found by others [14,53], who reported an upregulation of NF-κB in the neocortex and hippocampus after quantitative immunohistochemistry. Two reasons could afford these contrasting results. On one hand, the differences in the IHH preconditioning protocols (days of exposure and barometric pressure), the ASH “dose” received by the exposed animals (6 h and 7% FiO2 vs. 3 h at 5% FiO2) and the absence or presence of a reoxygenation period. On the other hand, the well-known dual effects as survival or a pro-death factor in the nervous system described for NF-κB (see for review [54]) could also play a role in the reported opposing findings.

3.4. Erythropoietin (EPO) Expression in the Brain

The EPO gene was identified as one of the genes activated by HIF-1α in response to hypoxia [55]. Initially, it was believed that the only function of EPO was to regulate the number of erythrocytes in the blood, allowing maturation of erythrocyte precursors by inhibiting apoptosis [56]. Over the past decade, it has been shown that EPO is also induced by hypoxia in the central nervous system, acting in the brain as an antiapoptotic, antioxidant, anti-inflammatory, neuroprotective and neurotrophic factor [57,58]. In this work, we have found that EPO levels were significantly increased in all groups exposed to hypoxia, matching the increases in HIF-1α (Figure 3). It is noteworthy that EPO levels were higher in IHH-exposed animals’ brains, with the highest significant differences compared to NOR in the IHH+ASH group, indicating that IHH preconditioning favored the synthesis of EPO [59]. Moreover, the IHH+ASH group showed significantly higher EPO expression than ASH and IHH. As we have suggested recently, the neuroprotective effect of EPO is associated with increases in antioxidant activity (Figure 1, Table 1) [60] and attenuates apoptosis [61] (Figure 2 and Figure 3). This demonstrates that EPO would act as a powerful antioxidant allowing the neurons to regulate their intracellular redox condition [62] and suggesting that increased EPO levels in the brain after hypoxia exposure is a potential approach for promoting neuronal survival in vivo.
EPO can accomplish its protective role by targeting components common to many different neurodegenerative pathways, which results in a plethora of different actions [63]. Mechanistically, it has been proposed that EPO action takes place through multiple signaling pathways that can lead to tissue repair and cell protection [64]. These signaling pathways increase the expression of antiapoptotic proteins of the Bcl-2 family, reducing the release and expression of the main markers of the intrinsic mitochondrial apoptotic pathway, such as cytochrome c and caspase-3, the main executioner of the mitochondrial apoptotic pathway [19,63]. The integrity of mitochondria allows maintaining its redox state, and, in consequence, the mitochondria ceases to be the main source of ROS, avoiding the appearance of oxidative stress. Thus, the high levels of EPO found in our study in the IHH+ASH group would justify the neuroprotective effect against oxidative stress and apoptosis that are also deduced from our results.

3.5. Astrocytes

Since astrocytes have been considered specialized cells in detecting the decrease in oxygen availability in the brain [25], we considered it interesting to investigate how these cells may respond to ASH and the effects that preconditioning could elicit on them. Astrocytes are the most abundant glial cells involved in virtually every function of the central nervous system, and the reciprocal interactions between glia and neurons are essential for many critical functions in health and disease in the brain [65,66,67]. Astrocytes respond to all forms of brain insults by a process commonly referred to as reactive astrogliosis, characterized by the hypertrophy of their cell bodies and cell extensions and the upregulation of intermediate filament proteins, such as glial fibrillary acidic protein (GFAP). This is a process normally associated with beneficial consequences. However, it can lead to harmful effects under specific conditions, changing their phenotype from a resting to a reactive form after a finely graded continuum of changes that range from reversible alterations in gene expression and cell hypertrophy to scar formation [67,68]. Our results show important changes in the phenotype of astrocytes characterized by an increased expression of GFAP protein in the hippocampal CA1 area in response to hypoxia (Figure 4 and Figure 5B). Moreover, hypertrophy in cell bodies and cell process length reduction was observed in ASH. In this group, astrocyte morphology is compatible with what is defined as severe diffuse reactive astrogliosis, while in IHH+ASH, astrocytes’ condition with abundant extensions could be classified as mild to moderate astrogliosis. In the hippocampus, compared to NOR animals, hypoxic preconditioning caused a phenotype of reactive forms that expressed GFAP. Since the existence of astrocytes that do not express detectable levels of GFAP has been described, our results based on the detection of this protein do not allow us to distinguish whether the IHH induced astrocyte proliferation or if it simply underwent increased GFAP expression that was not detected in NOR. However, support for astrocyte proliferation can be derived from previous work in the hippocampus dentate gyrus [69]. These authors suggested that the neuroprotective effect observed in preconditioned rats, exposed to three sessions of intermittent hypoxia and a subsequent ASH session, was stimulated by the neurogenesis observed after immunohistochemistry for NeuroD2 transcription factor.
In conclusion, hypoxic preconditioning with a protocol of intermittent hypobaric hypoxia had neuroprotective effects on acute severe hypoxia-induced oxidative injury by reducing oxidative stress and inhibiting the apoptotic cascade, which was mediated by NF-κB downregulation and EPO upregulation. Moreover, important changes were found in the phenotype of astrocytes in the hippocampal CA1 area in response to hypoxia. In animals exposed to acute severe hypoxia, these cells showed soma hypertrophy and process length reduction compatible with severe diffuse reactive astrogliosis. The protocol of hypoxic preconditioning also ameliorated this pathological astrocyte phenotype by reducing the astrogliosis to mild or moderate.

4. Materials and Methods

4.1. Animals and Experimental Groups

Forty-four adult male Sprague-Dawley rats (Harlan Ibérica, Barcelona, Spain) weighing between 230 and 250 g were used for this study. The animals were maintained at 22 ± 1 °C with light/dark cycles of 12 h and had free access to food and water. Experimental procedures were conducted following the European Community Council Directive no. 86/609/EEC with the approval of the Ethical Institutional Committee on Animal Care and Research of the University of Barcelona. Every effort was made to reduce the number of animals and minimize animal suffering during the experiment.
Animals were randomly divided into four groups (Figure 6). (1) Group NOR (normoxic), which could be considered the control group, consisted of animals maintained in normoxic conditions (sea level) throughout the same time as the intervened animals. (2) Group ASH (acute severe hypoxia group) was comprised of animals exposed to normobaric hypoxia in a chamber with a continuous flow of a hypoxic gas mixture of 93% N2 and 7% O2 for a unique and continuous session that lasted for 6 h. ASH animals were killed by decapitation immediately after the exposure to hypoxia without giving time for reoxygenation. (3) Group IHH (intermittent hypobaric hypoxia) included animals exposed to hypobaric hypoxia for 8 consecutive days for 4 h sessions per day. A hypobaric chamber with a capacity of 136 L made of polymethyl methacrylate plastic was used to simulate an altitude of 4000 m. A relative vacuum (low-pressure) into the chamber was produced by a rotational vacuum pump (TRIVAC D5E; Leybold, Köln, Germany) by regulating a constant airflow rate of 2 L/h. Inner pressure was controlled by two differential pressure sensors (ID 2000; Leybold) connected to a vacuum controller (Combivac IT23, Leybold, Köln, Germany) driving a diaphragm pressure regulator (MR16, Leybold, Köln, Germany). (4) Group IHH+ASH consisted of rats exposed to the intermittent hypobaric hypoxia protocol followed by the exposure to the normobaric acute severe hypoxic session. After the hypoxic insult, animals were immediately killed by decapitation without giving time for reoxygenation.
Brain extraction protocol using an ice-cold isotonic saline solution (0.154 M KCl), sample storage at −80 °C and hemisphere processing for oxidative stress and Western blot analyses were completed as previously described [28].

4.2. Oxidative Stress Assays

4.2.1. Measurement of Oxidant Activity in the Brain

Lipid peroxidation was assessed using thiobarbituric acid-reactive substances (TBARS) as indicators, following Mihara and Uchiyama [70]. Advanced oxidation protein products (AOPP) were determined spectrophotometrically according to Barsotti et al. [71], and nitric oxide species (NOx) were monitored by a colorimetric assay (Cayman Chemical, Ann Arbor, MI, USA) as described by Castillo et al. [72]. A detailed description of all these methods for measuring oxidant activity in the brain can be found in Coimbra-Costa et al. [28].

4.2.2. Measurement of Antioxidant Activity in the Brain

Glutathione system. Reduced (GSH) and oxidized (GSSG) glutathione concentrations were measured in brain extracts obtained using the procedure described by [73]. Samples were homogenized in a cold 1:1 mixture (pH 6.8) of 0.1 M phosphate, 5 mM EDTA and 10% metaphosphoric acid. Later on, the homogenates were incubated in ice for 30 min, centrifuged at 100,000× g for 30 min, and the resulting supernatant was used to determine GSH and GSSG with the fluorescent probe ophthalaldehyde (OPA). To avoid interference, the aliquots for GSSG determination were previously incubated with N-ethylmaleimide, which reacts with GSH to produce a form that lacks luminescence. After 15 min of incubation with OPA, fluorescence was determined at 420 nm (excitation 350 nm). For determining glutathione reductase (GR) and glutathione peroxidase (GPx) activities, the tissue was homogenized by sonication in a cold buffer (pH 7.5) containing 50 mM NaH2PO4, 1 mM EDTA. Subsequently, homogenates were centrifuged at 10,000× g for 10 min at 4 °C. The resulting supernatant was used to measure GR and GPx activities using a Cayman kit at 340 nm (no. 703202 and no. 703102, Cayman Chemical, Ann Arbor, MI, USA).
Superoxide dismutase (SOD) activity. The brain tissue was homogenized by sonication in a cold buffer (pH 7.5) containing 50 mM NaH2PO4, 1 mM EDTA and the homogenates were centrifuged at 600× g for 10 min at 4 °C. SOD activity was measured from the supernatant at 450 nm using an Arbor kit (no. K028-H1, Arbor assays, Ann Arbor, MI, USA).

4.3. Western Blotting

The brain hemispheres were homogenized in an ice-cold lysis buffer (pH 7.4) containing 50 mM Tris-HCl, 150 mM NaCl, 1% DOC, 0.1% SDS, 1% Triton X 100, and a protease inhibitor cocktail (1:20) (sc-29130, Santa Cruz Biotechnology, Santa Cruz, CA, USA). Subsequently, the homogenates were centrifuged for 10 min at 12,000× g, and the proteins (50 μg) were electrophoresed and separated on 8%, 10% and 15% SDS–PAGE (Bio-Rad, Hercules, CA, USA) and transferred to nitrocellulose membranes (Whatman® Schleicher & Schuell, Keene, NH, USA). Urea-SDS gels were used to improve the resolution of the proteins of low molecular weight [74]. The membranes were blocked in a solution containing 5% non-fat milk powder in a Tris-buffered saline (pH 7.6) containing 150 nM NaCl, 20 nM Tris-HCl and 0.05% Tween-20 for 1.5 h at room temperature and then thoroughly incubated with the following primary antibodies (sc: Santa Cruz Biotechnology, Santa Cruz, CA, USA): β-actin (sc-47778), cytochrome c (sc-13561), apoptosis-inducing factor (AIF, sc-9416), hypoxia-inducible factor 1-alpha (HIF-1α, sc-10790), nuclear factor kappa-light-chain-enhancer of activated B cells (NF-κBp50, sc-33022), and erythropoietin (EPO, sc-795216). Anti-cleaved caspase-3 antibody #9661 from Cell Signaling Technology (Danvers, MA, USA) was used to assess the expression levels of cleaved caspase-3. β-actin was used as a load control of the amount of sample protein. After several washes with TBST, the membranes were incubated for 1.5 h at room temperature, with gentle stirring, with the following horseradish peroxidase-conjugated secondary antibodies: goat anti-rabbit IgG-HRP (111-035-003 Jackson Immuno Research, West Grove, PA, USA), goat anti-mouse IgG-h+I HRP (A090-116P, Bethyl Laboratories, Montgomery, TX, USA), and rabbit anti-Goat IgG-HR (sc-2768, Santa Cruz Biotechnology, Santa Cruz, CA, USA). Finally, membranes were developed using a Thermo Scientific kit (Fisher Scientific, Waltham, MA, USA), and bands were visualized on X-ray film (Kodak, Rochester, NY, USA). Densitometric analysis was carried out using ImageJ software (NIH, Bethesda, MD, USA).

4.4. Immunohistochemistry

Five rats per group were anesthetized with ketamine/xylazine and fixed by intracardiac perfusion with a 0.1 M phosphate buffer (pH 7.4). The brains were obtained and frozen after cryoprotecting them in a 30% sucrose solution. They were frozen and stored until sectioned with a cryostat (Leica Microsystems, Wetzlar, Germany). Immunohistochemistry was performed as described previously [75] in coronal sections of the Cornu ammonis (CA1) hippocampal zone, and images were obtained with a microscope (Olympus BX-61, Tokyo, Japan). Images of slides processed for GFAP immunohistochemistry were analyzed with ImageJ (Rasband) software at 500 × magnification. The morphology of GFAP-immunoreactive astrocytes was assessed quantitatively, measuring soma areas and process lengths. The intensity of the astrocyte GFAP immune staining was expressed as a percentage increase of the background stain of each slide.

4.5. Statistical Analysis

Statistical Package for Social Sciences (SPSS) software (v. 13.0, IBM, Armonk, NY, USA) was used for statistical analyses. After testing normality and homoscedasticity, one-way ANOVAs, with post hoc Bonferroni’s multiple comparison tests, were run for all-group comparisons. p-values are given in Figures and Table as indicated in their legends.

5. Conclusions

This research demonstrates that intermittent respiratory hypoxia induces neuroprotective responses that prevent damage to brain cells, opening the possibility to apply hypoxic preconditioning protocols to the whole organism for therapeutic purposes.

Author Contributions

Conceptualization, R.R. and N.A.; methodology, D.C.-C., F.G., F.A., N.A. and T.C.; investigation, D.C.-C., F.G., F.A., N.A., T.C. and R.R.; data curation, T.C.C.P., T.C. and J.R.T.; writing—original draft preparation, D.C.-C., R.R. and J.R.T.; writing—review and editing, R.R. and J.R.T.; project administration, R.R., T.C.C.P. and J.R.T. All authors have read and agreed to the published version of the manuscript.

Funding

This work was supported by research grants FIT-2002-62 from Ministerio de Ciencia y Tecnología (Spain) and 20005BE00372 from Agència de Gestió d’Ajuts Universitaris i de Reserca (AGAUR), Generalitat de Catalunya to R.R. Additional funding for publication costs was provided by ESAME Pharmaceutical Business School.

Institutional Review Board Statement

The study was conducted according to the guidelines of the Committee for the Care of Research Animals of the University of Barcelona, in accordance with the directive of the Council of the European Community (2010/63 y 86/609/EEC) on animal experimentation, and approved by the local University Committee (CEEA-UB, Comitè Étic d´Experimentació Animal de la Universitat de Barcelona) and by the Catalan Government (Generalitat de Catalunya, Departament de Territori i Sostenibilitat) with the approval number #9431 (January 2016).

Informed Consent Statement

Not applicable.

Data Availability Statement

Not applicable.

Acknowledgments

Authors are grateful to Encarni Capilla for her helping and counseling in laboratory techniques. We would also like to thank Jonny English for his assistance in proofreading the English text.

Conflicts of Interest

The authors declare no conflict of interest.

Abbreviations

AIFApoptosis-inducing factor
AOPPAdvanced oxidation protein products
ASHAcute severe hypoxia
CA1Hippocampus Cornu ammonis area 1
CNSCentral nervous system
EPOErythropoietin
GFAPGlial fibrillary acidic protein
GPxGlutathione peroxidase
GRGlutathione reductase
GSHReduced glutathione
GSSGOxidized glutathione
HIFHypoxia-inducible factor
IHHIntermittent hypobaric hypoxia
NF-κBNuclear factor kappa-light-chain-enhancer of activated B cells
NORNormoxic
NOxNitric oxide species
ROSReactive oxygen species
SODSuperoxide dismutase
TBARSThiobarbituric acid reactive substances (lipid peroxidation)

References

  1. Acker, T.; Acker, H. Cellular oxygen sensing need in CNS function: Physiological and pathological implications. J. Exp. Biol. 2004, 207, 3171–3188. [Google Scholar] [CrossRef] [Green Version]
  2. Maa, E.H. Hypobaric hypoxic cerebral insult: The neurological consequences of going higher. NeuroRehabilitation 2010, 26, 73–84. [Google Scholar] [CrossRef]
  3. Wilson, M.H.; Newman, S.; Imray, C.H. The cerebral effects of ascent to high altitudes. Lancet Neurol. 2009, 8, 175–191. [Google Scholar] [CrossRef]
  4. Francis, K.R.; Wei, L. Human embryonic stem cell neural differentiation and enhanced cell survival promoted by hypoxic preconditioning. Cell Death Dis. 2010, 1, e22. [Google Scholar] [CrossRef] [Green Version]
  5. Simon, M.C.; Keith, B. The role of oxygen availability in embryonic development and stem cell function. Nat. Rev. Mol. Cell Biol. 2008, 9, 285–296. [Google Scholar] [CrossRef] [PubMed]
  6. Blanco, M.; Lizasoain, I.; Sobrino, T.; Vivancos, J.; Castillo, J. Ischemic preconditioning: A novel target for neuroprotective therapy. Cerebrovasc. Dis. 2006, 21, 38–47. [Google Scholar] [CrossRef] [PubMed]
  7. Rybnikova, E.; Samoilov, M. Current insights into the molecular mechanisms of hypoxic pre- and postconditioning using hypobaric hypoxia. Front. Neurosci. 2015, 9, 388. [Google Scholar] [CrossRef] [PubMed] [Green Version]
  8. Ran, R.; Xu, H.; Lu, A.; Bernaudin, M.; Sharp, F.R. Hypoxia preconditioning in the brain. Dev. Neurosci. 2005, 27, 87–92. [Google Scholar] [CrossRef]
  9. Li, S.; Hafeez, A.; Noorulla, F.; Geng, X.; Guo, G.; Ren, C.; Lu, G.; Zhao, H.; Ding, Y.; Ji, X. Preconditioning in neuroprotection: From hypoxia to ischemia. Prog. Neurobiol. 2017, 157, 79–91. [Google Scholar] [CrossRef] [PubMed] [Green Version]
  10. Dirnagl, U.; Becker, K.; Meisel, A. Preconditioning and tolerance against cerebral ischaemia: From experimental strategies to clinical use. Lancet Neurol. 2009, 8, 398–412. [Google Scholar] [CrossRef] [Green Version]
  11. Sharp, F.R.; Ran, R.; Lu, A.; Tang, Y.; Strauss, K.I.; Glass, T.; Ardizzone, T.; Bernaudin, M. Hypoxic preconditioning protects against ischemic brain injury. NeuroRX 2004, 1, 26–35. [Google Scholar] [CrossRef]
  12. Rybnikova, E.A.; Khozhai, L.I.; Tyul’kova, E.I.; Glushchenko, T.S.; Sitnik, N.A.; PeltoHuikko, M.; Otellin, V.A.; Samoilov, M.O. Expression of early gene proteins, structural changes in brain neurons in hypobaric hypoxia, and the correcting effects of preconditioning. Neurosci. Behav. Physiol. 2005, 35, 383–388. [Google Scholar] [CrossRef] [PubMed]
  13. Rybnikova, E.; Sitnik, N.; Gluschenko, T.; Tjulkova, E.; Samoilov, M.O. The preconditioning modified neuronal expression of apoptosis-related proteins of Bcl-2 superfamily following severe hypobaric hypoxia in rats. Brain Res. 2006, 1089, 195–202. [Google Scholar] [CrossRef] [PubMed]
  14. Rybnikova, E.; Gluschenko, T.; Tulkova, E.; Churilova, A.; Jaroshevich, O.; Baranova, K.; Samoilov, M. Preconditioning induces prolonged expression of transcription factors pCREB and NF-kappa B in the neocortex of rats before and following severe hypobaric hypoxia. J. Neurochem. 2008, 106, 1450–1458. [Google Scholar]
  15. Stroev, S.A.; Gluschenko, T.S.; Tjulkova, E.I.; Rybnikova, E.A.; Samoilov, M.O.; Pelto-Huikko, M. The effect of preconditioning on the Cu, Zn superoxide dismutase expression and enzyme activity in rat brain at the early period after severe hypobaric hypoxia. Neurosci. Res. 2005, 53, 39–47. [Google Scholar] [CrossRef]
  16. Fan, X.; Wang, H.; Zhang, L.; Tang, J.; Qu, Y.; Mu, D. Neuroprotection of hypoxic/ischemic preconditioning in neonatal brain with hypoxic/ischemic injury. Rev. Neurosci. 2021, 32, 23–34. [Google Scholar] [CrossRef]
  17. Zhao, L.; Liu, X.; Liang, J.; Han, S.; Wang, Y.; Yin, Y.; Luo, Y.; Li, J. Phosphorylation of p38 MAPK mediates hypoxic preconditioning-induced neuroprotection against cerebral ischemic injury via mitochondria translocation of Bcl-xL in mice. Brain Res. 2013, 1503, 78–88. [Google Scholar] [CrossRef]
  18. Bernaudin, M.; Tang, Y.; Reilly, M.; Petit, E.; Sharp, F.R. Brain genomic response following hypoxia and re-oxygenation in the neonatal rat-Identification of genes that might contribute to hypoxia-induced ischemic tolerance. J. Biol. Chem. 2002, 277, 39728–39778. [Google Scholar] [CrossRef] [Green Version]
  19. Rabie, T.; Marti, H.H. Brain protection by erythropoietin: A manifold task. Physiology 2008, 23, 263–274. [Google Scholar] [CrossRef] [PubMed] [Green Version]
  20. Zhao, H.; Yenari, M.A.; Cheng, D.; Sapolsky, R.M.; Steinberg, G.K. Bcl-2 overexpression protects against neuron loss within the ischemic margin following experimental stroke and inhibits cytochrome c translocation and caspase-3 activity. J. Neurochem. 2003, 85, 1026–1036. [Google Scholar] [CrossRef]
  21. Kenneth, N.S.; Rocha, S. Regulation of gene expression by hypoxia. Biochem. J. 2008, 414, 19–29. [Google Scholar] [CrossRef] [PubMed] [Green Version]
  22. D´Ignazio, L.; Rocha, S. Hypoxia induced NF-κB. Cells 2016, 5, 10. [Google Scholar] [CrossRef] [PubMed] [Green Version]
  23. Gilmore, T.D. Introduction to NF-κB: Players, pathways, perspectives. Oncogene 2006, 25, 6680–6684. [Google Scholar] [CrossRef] [PubMed] [Green Version]
  24. Melvin, A.; Mudie, S.; Rocha, S. Mechanism of hypoxia-induced NF-κB. Cell Cycle 2011, 10, 879–882. [Google Scholar] [CrossRef] [PubMed]
  25. Angelova, P.R.; Kasymov, V.; Christie, I.; Sheikhbahaei, S.; Turovsky, E.; Marina, N.; Korsak, A.; Zwicker, J.; Teschemacher, A.G.; Ackland, G.L.; et al. Functional oxygen sensitivity of astrocytes. J. Neurosci. 2015, 35, 10460–10473. [Google Scholar] [CrossRef] [PubMed] [Green Version]
  26. Attwell, D.; Buchan, A.M.; Charpak, S.; Lauritzen, M.; Macvicar, B.A.; Newman, E.A. Glial and neuronal control of brain blood flow. Nature 2010, 468, 232–243. [Google Scholar] [CrossRef] [Green Version]
  27. Sies, H.; Berndt, C.; Jones, D.P. Oxidative stress. Annu. Rev. Biochem. 2017, 86, 715–748. [Google Scholar] [CrossRef]
  28. Coimbra-Costa, D.; Alva, N.; Duran, M.; Carbonell, T.; Rama, R. Oxidative stress and apoptosis after acute respiratory hypoxia and reoxygenation in rat brain. Redox Biol. 2017, 12, 216–225. [Google Scholar] [CrossRef]
  29. Maiti, P.; Singh, S.B.; Sharma, A.K.; Muthuraju, S.; Banerjee, P.K.; Ilavazhagan, G. Hypobaric hypoxia induces oxidative stress in rat brain. Neurochem. Int. 2006, 49, 709–716. [Google Scholar] [CrossRef]
  30. Peña, F.; Ramirez, J. Hypoxia-induced changes in neuronal network properties. Mol. Neurobiol. 2005, 32, 251–283. [Google Scholar] [CrossRef]
  31. Terraneo, L.; Paroni, R.; Bianciardi, P.; Giallongo, T.; Carelli, S.; Gorio, A.; Samaja, M. Brain adaptation to hypoxia and hyperoxia in mice. Redox Biol. 2017, 11, 12–20. [Google Scholar] [CrossRef] [PubMed] [Green Version]
  32. Sies, H. Hydrogen peroxide as a central redox signaling molecule in physiological oxidative stress: Oxidative eustress. Redox Biol. 2017, 11, 613–619. [Google Scholar] [CrossRef]
  33. Murphy, M.P. How mitochondria produce reactive oxygen species. Biochem. J. 2009, 417, 1–13. [Google Scholar] [CrossRef] [PubMed] [Green Version]
  34. Rigoulet, M.; Yoboue, E.D.; Devin, A. Mitochondrial ROS generation and its regulation: Mechanisms involved in H2O2 signaling. Antioxid. Redox Signal. 2011, 14, 459–468. [Google Scholar] [CrossRef]
  35. Guzy, R.D.; Hoyos, B.; Robin, E.; Chen, H.; Liu, L.; Mansfield, K.D.; Simon, M.C.; Hammerling, U.; Schumacker, P.T. Mitochondrial complex III is required for hypoxia-induced ROS production and cellular oxygen sensing. Cell Metabol. 2005, 1, 401–408. [Google Scholar] [CrossRef] [PubMed] [Green Version]
  36. Maiti, P.; Singh, S.B.; Mallick, B.; Muthuraju, S.; Ilavazhagan, G. High altitude memory impairment is due to neuronal apoptosis in hippocampus, cortex and striatum. J. Chem. Neuroanat. 2008, 36, 227–238. [Google Scholar] [CrossRef] [PubMed]
  37. Franklin, J. Redox regulation of the intrinsic pathway in neuronal apoptosis. Antioxid. Redox Signal. 2011, 14, 1437–1448. [Google Scholar] [CrossRef] [PubMed] [Green Version]
  38. Halliwell, B. Free radicals and antioxidants—quo vadis? Trends Pharmacol. Sci. 2011, 32, 125–130. [Google Scholar] [CrossRef]
  39. Bhat, A.H.; Dar, K.B.; Anees, S.; Zargar, M.A.; Masood, A.; Sofi, M.A.; Ganie, S.A. Oxidative stress, mitochondrial dysfunction and neurodegenerative diseases; a mechanistic insight. Biomed. Pharmacother. 2015, 74, 101–110. [Google Scholar] [CrossRef]
  40. Guzy, R.D.; Schumacker, P.T. Oxygen sensing by mitochondria at complex III: The paradox of increased reactive oxygen species during hypoxia. Exp. Physiol. 2006, 91, 807–819. [Google Scholar] [CrossRef]
  41. Lin, M.T.; Beal, M.F. Mitochondrial dysfunction and oxidative stress in neurodegenerative diseases. Nature 2006, 443, 787–795. [Google Scholar] [CrossRef] [PubMed]
  42. Chen, R.; Lai, U.H.; Zhu, L.; Singh, A.; Ahmed, M.; Forsyth, N.R. Reactive oxygen species formation in the brain at different oxygen levels: The role of hypoxia inducible factors. Front. Cell Dev. Biol. 2018, 6, 132. [Google Scholar] [CrossRef] [PubMed] [Green Version]
  43. Fuhrmann, D.C.; Brüne, B. Mitochondrial composition and function under the control of hypoxia. Redox Biol. 2017, 12, 208–215. [Google Scholar] [CrossRef] [PubMed]
  44. Solaini, G.; Baracca, A.; Lenaz, G.; Sgarbi, G. Hypoxia and mitochondrial oxidative metabolism. Biochim. Biophys. Acta 2010, 1797, 1171–1177. [Google Scholar] [CrossRef] [PubMed] [Green Version]
  45. Langley, B.; Ratan, R.R. Oxidative stress-induced death in the nervous system: Cell cycle dependent or independent? J. Neurosci. Res. 2004, 77, 621–629. [Google Scholar] [CrossRef]
  46. Öxler, E.M.; Dolga, A.; Culmsee, C. AIF depletion provides neuroprotection through a preconditioning effect. Apoptosis 2012, 17, 1027–1038. [Google Scholar] [CrossRef]
  47. Miyamoto, O.; Auer, R.N. Hypoxia, hyperoxia, ischemia, and brain necrosis. Neurology 2000, 54, 362–371. [Google Scholar] [CrossRef] [Green Version]
  48. Pearigen, P.; Gwinn, R.; Simon, R. The effects in vivo of hypoxia on brain injury. Brain Res. 1996, 725, 184–191. [Google Scholar] [CrossRef]
  49. Chandel, N.S.; McClintock, D.S.; Feliciano, C.E.; Wood, T.M.; Melendez, J.A.; Rodriguez, A.M.; Schumacker, P.T. Reactive oxygen species generated at mitochondrial complex III stabilize hypoxia-inducible factor-1 alpha during hypoxia-A mechanism of O2 sensing. J. Biol. Chem. 2000, 275, 25130–25138. [Google Scholar] [CrossRef] [Green Version]
  50. Görlach, A.; Dimova, E.Y.; Petry, A.; Martínez-Ruiz, A.; Hernansanz-Agustín, P.; Rolo, A.; Palmeira, C.M.; Kietzmann, T. Reactive oxygen species, nutrition, hypoxia and diseases: Problems solved? Redox Biol. 2015, 6, 372–385. [Google Scholar] [CrossRef] [PubMed]
  51. Culver, C.; Sundqvist, A.; Mudie, S.; Melvin, A.; Xirodimas, D.; Rocha, S. Mechanism of hypoxia-induced NF-κB. Mol. Cel. Biol. 2010, 30, 4901–4921. [Google Scholar] [CrossRef] [PubMed] [Green Version]
  52. Ravati, A.; Ahlemeyer, B.; Becker, A.; Klumpp, S.; Krieglstein, J. Preconditioning-induced neuroprotection is mediated by reactive oxygen species and activation of the transcription factor nuclear factor-κB. J. Neurochem. 2001, 78, 909–919. [Google Scholar] [CrossRef] [PubMed]
  53. Rybnikova, E.; Glushchenko, T.; Tyulkova, E.; Baranova, K.; Samoilov, M. Mild hypobaric hypoxia preconditioning up-regulates expression of transcription factors c-Fos and NGFI-A in rat neocortex and hippocampus. Neurosci. Res. 2009, 65, 360–366. [Google Scholar] [CrossRef] [PubMed]
  54. Perkins, N.D.; Gilmore, T.D. Good cop, bad cop: The different faces of NF-κB. Cell Death Differ. 2006, 13, 759–772. [Google Scholar] [CrossRef] [PubMed] [Green Version]
  55. Wang, G.L.; Semenza, G.L. Molecular basis of hypoxia-induced erythropoietin expression. Curr. Opin. Hematol. 1996, 3, 156–162. [Google Scholar] [CrossRef]
  56. Jelkmann, W. Erythropoietin: Structure, control of production, and function. Physiol. Rev. 1992, 72, 449–489. [Google Scholar] [CrossRef]
  57. Gassmann, M.; Heinicke, K.; Soliz, J.; Ogunshola, O.O. Non-erythroid functions of erythropoietin. Adv. Exp. Med. Biol. 2003, 543, 323–330. [Google Scholar]
  58. Noguchi, C.T.; Asavaritikrai, P.; Teng, R.; Jia, Y. Role of erythropoietin in the brain. Crit. Rev. Oncol. Hematol. 2007, 64, 159–171. [Google Scholar] [CrossRef] [Green Version]
  59. Liu, J.; Narasimhan, P.; Yu, F.S.; Chan, P.H. Neuroprotection by hypoxic preconditioning involves oxidative stress-mediated expression of hypoxia-inducible factor and erythropoietin. Stroke 2005, 36, 1264–1269. [Google Scholar] [CrossRef] [PubMed] [Green Version]
  60. Garzón, F.; Rodriguez, Y.; García, J.C.; Rama, R. Neuroprotective effects of neuroEPO using an in vitro model of stroke. Behav. Sci. 2018, 8, 26. [Google Scholar]
  61. Garzón, F.; Coimbra, D.; Parcerisas, A.; Rodriguez, Y.; García, J.C.; Soriano, E.; Rama, R. NeuroEPO preserves neurons from glutamate-induced excitotoxicity. J. Alzheimers Dis. 2018, 65, 1469–1483. [Google Scholar] [CrossRef]
  62. Maiese, K.; Chong, Z.Z.; Hou, J.; Shang, Y.S. Erythropoietin and oxidative stress. Curr. Neurovasc. Res. 2008, 5, 125–142. [Google Scholar] [CrossRef] [PubMed] [Green Version]
  63. Brines, M.; Cerami, A. Emerging biological roles for erythropoietin in the nervous system. Nat. Rev. Neurosci. 2005, 6, 484–494. [Google Scholar] [CrossRef] [PubMed]
  64. Maiese, K. Regeneration in nervous system with erythropoietin. Front. Biosci. 2016, 21, 561–593. [Google Scholar] [CrossRef] [PubMed] [Green Version]
  65. Allaman, I.; Bélanger, M.; Magistretti, P.J. Astrocyte-neuron metabolic relationships: For better and for worse. Trends Neurosci. 2011, 34, 76–87. [Google Scholar] [CrossRef] [PubMed]
  66. Barres, B.A. The mystery and magic of glia: A perspective on their roles in health and disease. Neuron 2008, 60, 430–440. [Google Scholar] [CrossRef] [Green Version]
  67. Sofroniew, M.V.; Vinters, H.V. Astrocytes: Biology and pathology. Acta Neuropathol. 2010, 119, 7–35. [Google Scholar] [CrossRef] [Green Version]
  68. Pekny, M.; Pekna, M. Astrocyte reactivity and reactive astrogliosis: Costs and benefits. Physiol. Rev. 2014, 94, 1077–1098. [Google Scholar] [CrossRef]
  69. Vetrovoi, O.V.; Rybnikova, E.A.; Glushchenko, T.S.; Samoilov, M.O. Effects of hypobaric hypoxia in various modes on expression of neurogenesis marker NeuroD2 in the dentate gyrus of rats hippocampus. Bull. Exp. Biol. Med. 2016, 160, 510–513. [Google Scholar] [CrossRef]
  70. Mihara, M.; Uchiyama, M. Determination of malonaldehyde precursor in tissues by thiobarbituric acid test. Anal. Biochem. 1978, 86, 271–278. [Google Scholar]
  71. Barsotti, A.; Fabbi, P.; Fedele, M.; Garibaldi, S.; Balbi, M.; Bezante, G.P.; Risso, D.; Indiveri, F.; Ghigliotti, G.; Brunelli, C. Role of advanced oxidation protein products and thiol ratio in patients with acute coronary syndromes. Clin. Biochem. 2011, 44, 605–611. [Google Scholar] [CrossRef] [PubMed]
  72. Castillo, J.; Rama, R.; Dávalos, A. Nitric oxide-related brain damage in acute ischemic stroke. Stroke 2000, 31, 852–857. [Google Scholar] [CrossRef] [PubMed] [Green Version]
  73. Alva, N.; Carbonell, T.; Palomeque, J. Hypothermic protection in an acute hypoxia model in rats: Acid-base and oxidant/antioxidant profiles. Resuscitation 2010, 81, 609–616. [Google Scholar] [CrossRef]
  74. Ruiz-Montasell, B.; Aguado, F.; Majo, G.; Chapman, E.R.; Canals, J.M.; Marsal, J.; Blasi, J. Differential distribution of syntaxin isoforms 1A and 1B in the rat central nervous system. Eur. J. Neurosci. 1996, 8, 2544–2552. [Google Scholar] [CrossRef]
  75. Plá, V.; Paco, S.; Ghezali, G.; Ciria, V.; Pozas, E.; Ferrer, I.; Aguado, F. Secretory sorting receptors carboxypeptidase E and Secretogranin III in amyloid b-associated neural degeneration in Alzheimer’s disease. Brain Pathol. 2013, 23, 274–284. [Google Scholar] [CrossRef] [PubMed] [Green Version]
Figure 1. Oxidative stress markers in the brain. Units are expressed per milligram of protein. (A) TBARS, thiobarbituric acid-reactive substances; (B) AOPP, advanced oxidation protein products; and (C) NOx, nitric oxide species. Statistically significant differences between groups are presented with asterisks (*, vs. NOR) or crosses (+, vs. ASH). Two symbols indicate p < 0.01 and three symbols p < 0.001. F-values after running one-way ANOVAs with Bonferroni’s post hoc multiple comparison tests were: F = 10.83 (TBARS), F = 12.42 (AOPP) and F = 6.33 (NOx). Animal experimental groups are abbreviated as NOR, normoxic; ASH, acute severe hypoxia; IHH, intermittent hypobaric hypoxia; IHH+ASH, intermittent hypobaric hypoxia followed by acute severe hypoxia.
Ijms 22 05272 g001
Figure 2. Mitochondrial apoptosis-related markers. Examples of Western blots bands normalized to β-actin (with each corresponding well) are shown. Units are expressed relative to the β-actin content. (A) cytochrome c; (B) AIF, apoptosis-inducing factor; (C) caspase-3. Statistically significant differences between groups are presented with asterisks (*, vs. NOR) or crosses (+, vs. ASH). One symbol indicates p < 0.05, two symbols p < 0.01 and three symbols p < 0.001. F-values after running one-way ANOVAs with Bonferroni’s post hoc multiple comparison tests were: F = 4.29 (cytochrome c), F = 2.93 (AIF) and F = 1.61 (caspase 3). Animal experimental groups are abbreviated as NOR, normoxic; ASH, acute severe hypoxia; IHH, intermittent hypobaric hypoxia; IHH+ASH, intermittent hypobaric hypoxia followed by acute severe hypoxia.
Ijms 22 05272 g002
Figure 3. Transcriptional factors in response to hypoxia. Examples of Western blots bands normalized to β-actin (with each corresponding well) are shown. Units are expressed relative to the β-actin content. (A) HIF-1α, hypoxia-inducible factor 1-alpha; (B) NF-κBp50, nuclear factor kappa-light-chain-enhancer of activated B cells; (C) EPO, erythropoietin. Statistically significant differences between groups are presented with asterisks (*, vs. NOR), crosses (+, vs. ASH) or hashtags (#, vs. IHH). One symbol indicates p < 0.05, two symbols p < 0.01 and three symbols p < 0.001. F-values after running one-way ANOVAs with Bonferroni’s post hoc multiple comparison tests were: F = 3.96 (HIF-1α), F = 1.01 (NF-κBp50) and F = 11.98 (EPO). Animal experimental groups are abbreviated as NOR, normoxic; ASH, acute severe hypoxia; IHH, intermittent hypobaric hypoxia; IHH+ASH, intermittent hypobaric hypoxia followed by acute severe hypoxia.
Ijms 22 05272 g003
Figure 4. Glial fibrillary acidic protein (GFAP) immunohistochemistry in the Cornu ammonis (CA1) hippocampal zone at different magnifications. The increase in GFAP expression and changes in astrocyte morphology is more pronounced in ASH (B,F,J,K,L). Animals exposed to IHH had greater GFAP expression but did not show astrogliosis (C,D,G,H). Bars represent the following distances: ((A)–(D)), 100 µm; ((E)–(H)), 40 µm; (I,J), 20 µm; (K,L), 15 µm. Animal experimental groups are abbreviated as NOR, normoxic; ASH, acute severe hypoxia; IHH, intermittent hypobaric hypoxia; IHH+ASH, intermittent hypobaric hypoxia followed by acute severe hypoxia.
Ijms 22 05272 g004
Figure 5. (A) Astrocyte morphometrical parameters (soma area and process length morphology). (B) expression of astrocyte glial fibrillary acidic protein (GFAP) immunoreactivity. All data were obtained in the Cornu ammonis (CA1) hippocampal zone. The box represents the interquartile range in the box-and-whisker plots and shows the first and third quartiles separated by the median. The black dot represents the mean, and whisker endpoints represent the minimum and maximum values. Statistically significant differences between groups are presented with asterisks (*, vs. NOR) or crosses (+, vs. ASH). The three symbols indicate p < 0.001. F-values after running one-way ANOVAs with Bonferroni’s post hoc multiple comparison tests were: F = 85.94 (soma area), F = 119.93 (process length) and F = 20.77 (GFAP immunoreactivity). Animal experimental groups are abbreviated as NOR, normoxic; ASH, acute severe hypoxia; IHH, intermittent hypobaric hypoxia; IHH+ASH, intermittent hypobaric hypoxia followed by acute severe hypoxia.
Ijms 22 05272 g005
Figure 6. Experimental design and hypoxia exposure protocols. Animal experimental groups are abbreviated as NOR (normoxic), maintained at sea level conditions for the whole experiment; ASH (acute severe hypoxia), exposed to normobaric hypoxia at 7% O2 for a single 6 h continuous session; IHH (intermittent hypobaric hypoxia) exposed to hypobaric hypoxia (4000 m) for 8 consecutive days for 4 h sessions per day; and IHH+ASH, exposed to the intermittent hypobaric hypoxia protocol followed by a single session of acute normobaric hypoxia. Brain extraction was carried out after 6 h of normoxia in NOR and IHH or immediately after 6 h of acute hypoxia in ASH and HII+ASH. Yellow boxes and arrows indicate time spent in normoxia; red boxes are acute normobaric hypoxia sessions, and blue boxes time spent in hypobaric hypoxia.
Ijms 22 05272 g006
Table 1. Antioxidant activity and gluthatione system in the brain.
NORASHIHHIHH+ASH
Glutathione
GSH (nmol·mg−1)1.60 ± 0.111.08 ± 0.04 **1.26 ± 0.07 *1.19 ± 0.11 *
GSSG (nmol·mg−1)0.90 ± 0.101.11 ± 0.060.88 ± 0.021.04 ± 0.12
GSH/GSSG1.63 ± 0.050.94 ± 0.10 ***1.43 ± 0.041.35 ± 0.13
Enzymes
GPx (µU·mg−1)15.4 ± 0.9313.0 ± 0.49 *8.3 ± 0.93 *** +++10.4 ± 0.62 *** ++
GR (µU·mg−1)6.47 ± 0.504.28 ± 0.45 **5.51 ± 0.28 +6.02 ± 0.53 ++
SOD (U·mg−1)1.52 ± 0.121.10 ± 0.05 *1.30 ± 0.101.45 ± 0.12
GPx, glutathione peroxidase; GSH, reduced glutathione; GSSG, oxidized glutathione; GR, glutathione reductase; SOD, superoxide dismutase. Values are means ± SEM. Statistically significant differences between groups are presented with asterisks (*, vs. NOR) or crosses (+, vs. ASH). One symbol indicates p < 0.05, two symbols p < 0.01 and three symbols p < 0.001. F-values after running one-way ANOVAs with Bonferroni’s post hoc multiple comparison tests were: F = 8.02 (GSH), F = 1.39 (GSSG), F = 11.80 (GSH/GSSG), F = 15.06 (GPx), F = 4.33 (GR) and F = 3.31 (SOD). Animal experimental groups are abbreviated as: NOR, normoxic; ASH, acute severe hypoxia; IHH, intermittent hypobaric hypoxia; IHH+ASH, intermittent hypobaric hypoxia followed by acute severe hypoxia.
Publisher’s Note: MDPI stays neutral with regard to jurisdictional claims in published maps and institutional affiliations.

