Structural Aspects and Prediction of Calmodulin-Binding Proteins


Abstract
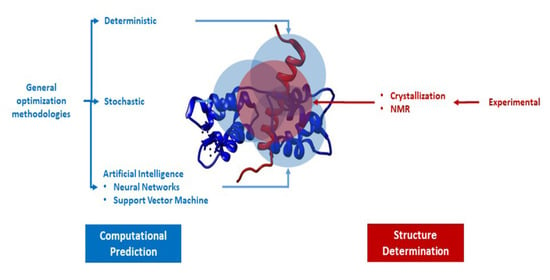
1. Introduction
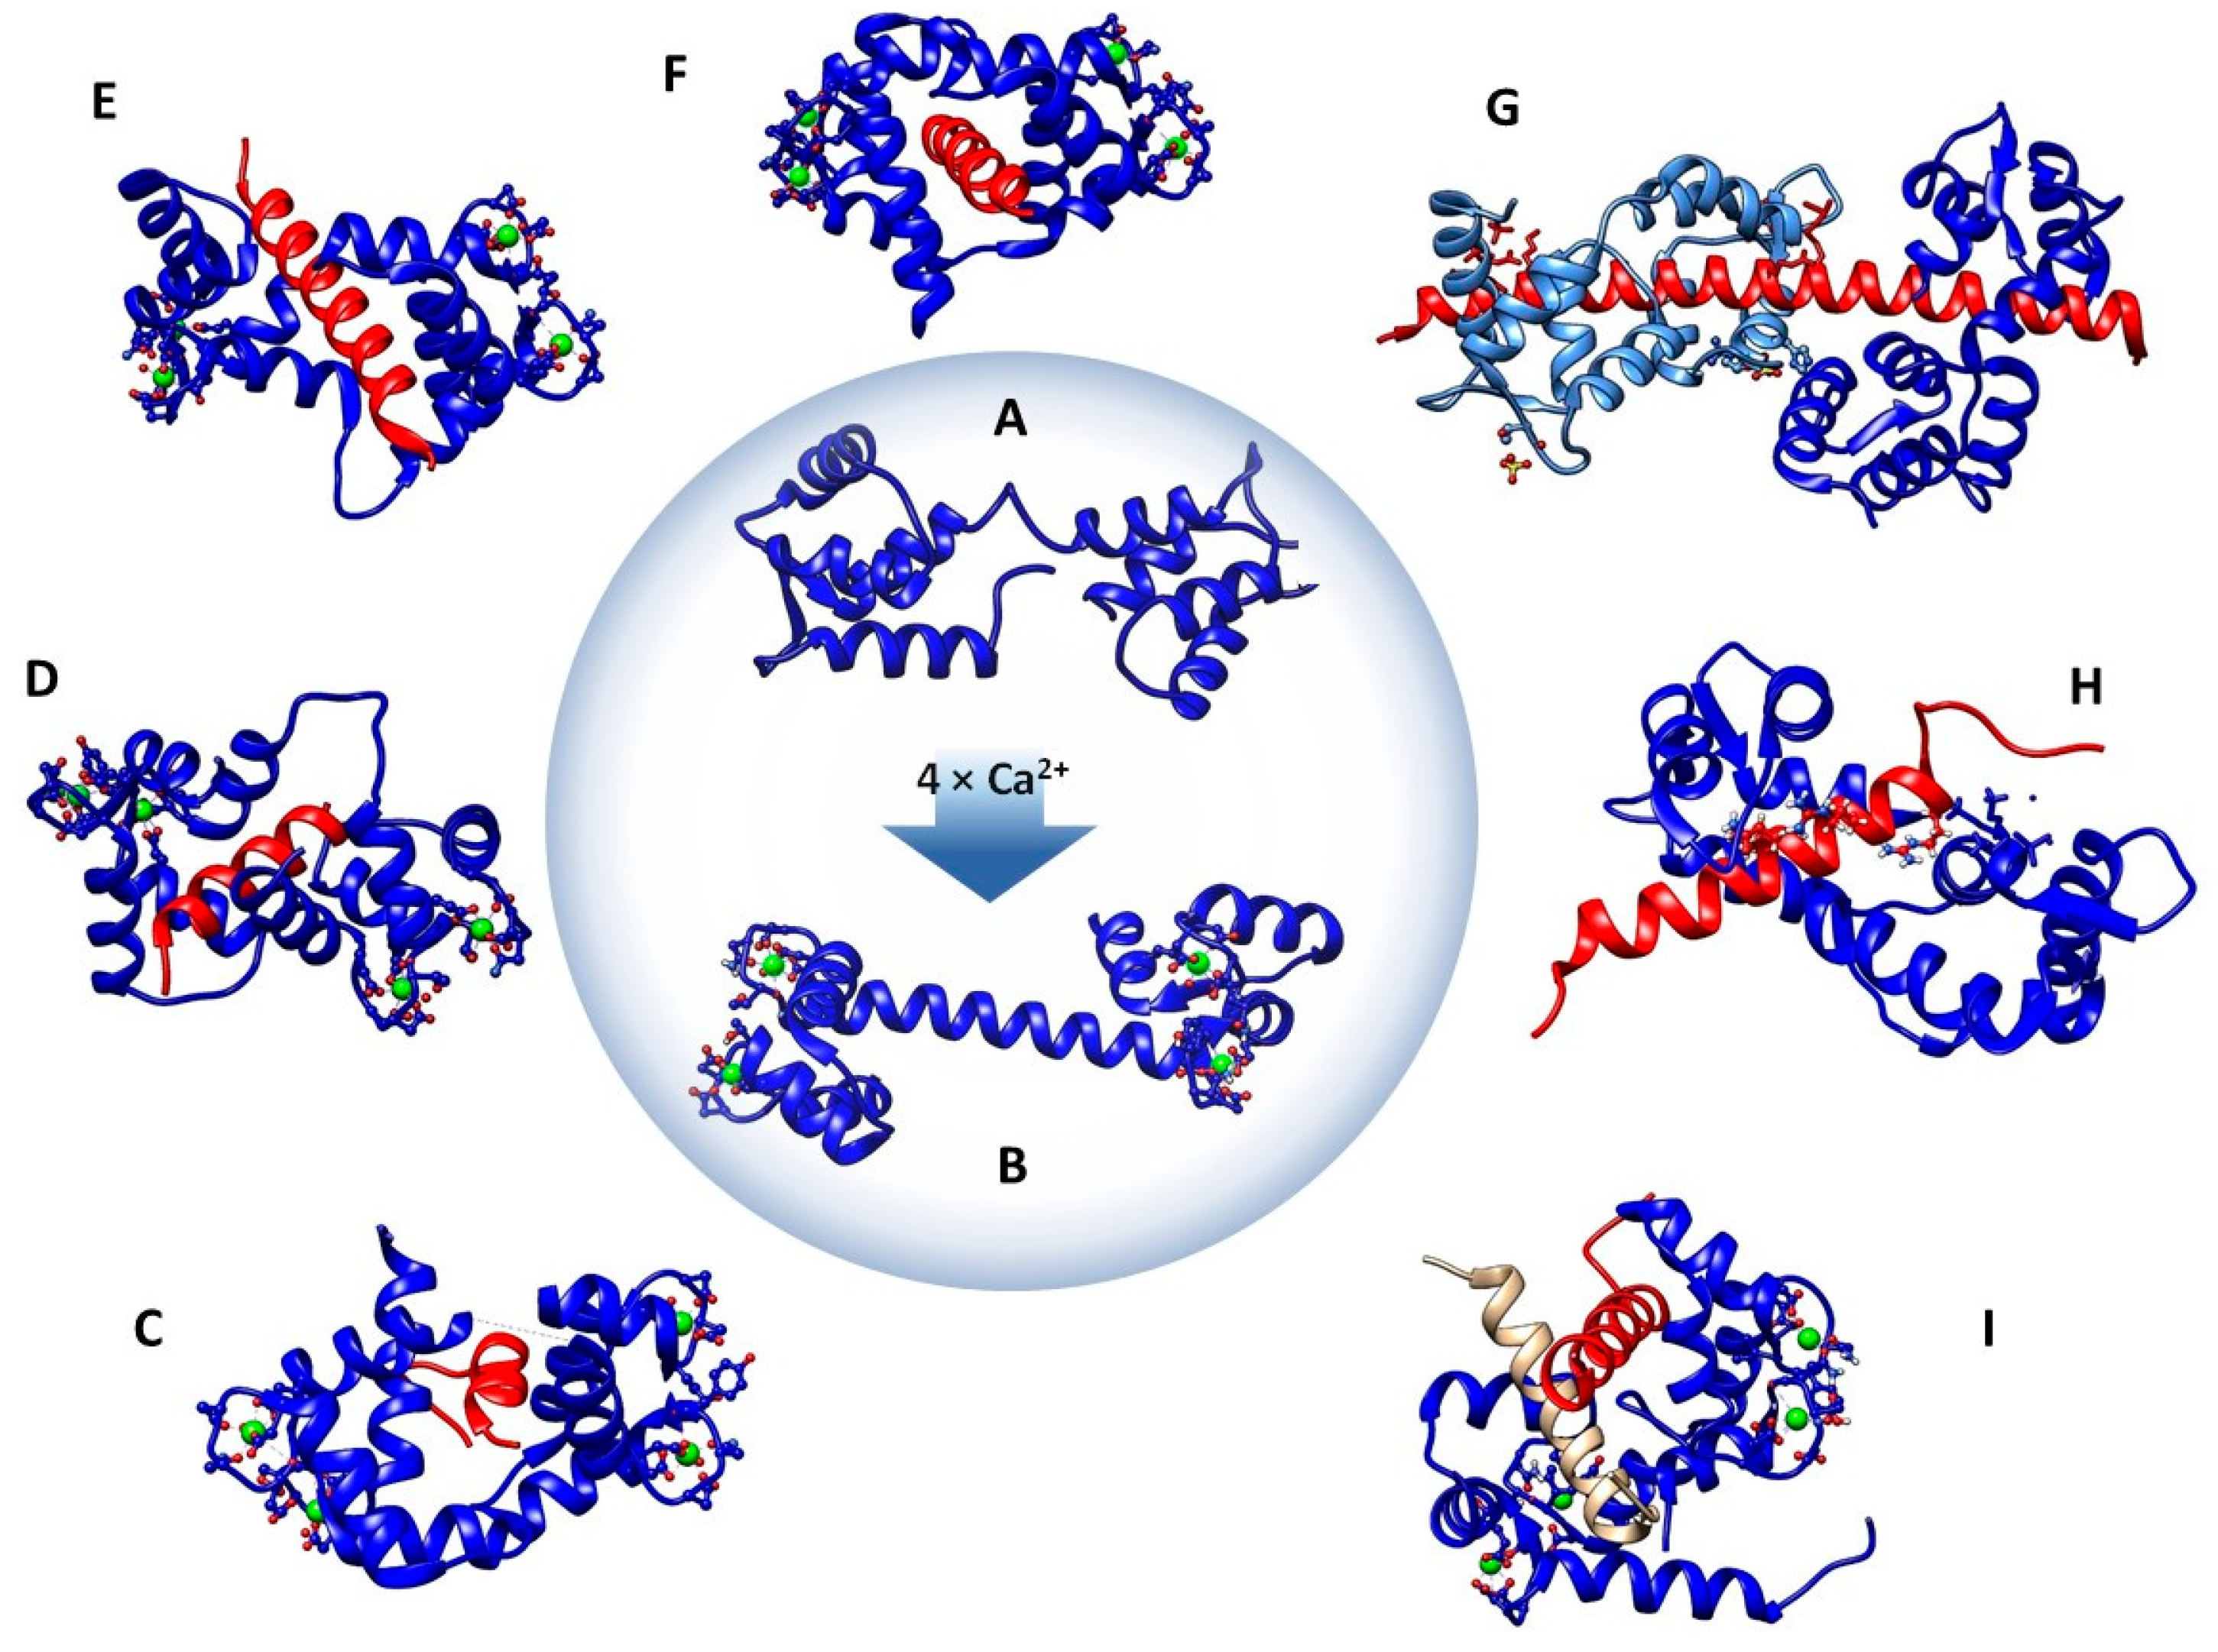
2. Structural Aspects and Binding Modes of CaM-Binding Proteins
3. Predicting CaM-Binding Proteins Using Generative Models
3.1. Introduction to Machine-Learning for Classification
3.2. Prediction Using Profile Hidden Markov Models
4. Predicting CaM-Binding Proteins Using Clustering Approaches
4.1. Brief Introduction to Supervised Versus Unsupervised Learning
4.2. Prediction Using Canonical Motif Clustering
5. Predicting CaM-Target Proteins Using Discriminative Models
5.1. CaM-Binding Protein Prediction Using Logistic Regression Classification of Disordered Proteomic Characteristics Via Neural Networks
5.2. Prediction Using Various Support Vector Machines on Arabidopsis thaliana Proteins
5.3. Prediction Using Random Forest Models and k-Nearest Neighbor
5.3.1. Classifying Short Linear Motifs (SLiMs) for CaM-Binding Protein Classification Using Various Classification Methods
5.3.2. Random Forest Modelling Hot Spot Regions from Alanine-Scanning Mutagenesis for CaM-Prediction
6. Conclusions and Perspectives
Funding
Conflicts of Interest
Abbreviations
| AUC | Area under the receiver operator curve |
| CaBP | Calcium-binding protein |
| CaM | Calmodulin |
| CaMBP | Calmodulin-binding protein |
| CaMBD | Calmodulin-binding domain |
| CaMELS | Calmodulin Interaction Learning System |
| CaMKII | Calmodulin-dependent protein kinase II |
| CaSR | Calcium-sensing receptor |
| CBP | CREB-binding protein |
| CTD | Calmodulin Target Database |
| FFNN | Feed forward neural network |
| FN | False negative |
| FNR | False negative rate |
| FP | False positive |
| FPR | False positive rate |
| HLH | Helix-loop-helix |
| HMM | Hidden Markov model |
| K-NN | K-nearest neighbor algorithm |
| LOPO | Leave-one-protein-out strategy |
| MLCK | Myosin light-chain kinase |
| PDB | Protein DataBank |
| PPV | Positive predictive value |
| PKC | Protein kinase C |
| RF | Random forest algorithm |
| ROC | Receiver operator characteristic |
| SLiMs | Short linear motifs |
| SVM | Support vector machine |
| TAD | Transcriptional activation domain |
| TN | True negative |
| TNR | True negative rate |
| TP | True positive |
| TPR | True positive rate |
References
- Halling, D.B.; Liebeskind, B.J.; Hall, A.W.; Aldrich, R.W. Conserved properties of individual Ca2+-binding sites in calmodulin. Proc. Natl. Acad. Sci. USA 2016, 113, E1216–E1225. [Google Scholar] [CrossRef] [PubMed]
- Nyegaard, M.; Overgaard, M.T.; Sondergaard, M.T.; Vranas, M.; Behr, E.R.; Hildebrandt, L.L.; Lund, J.; Hedley, P.L.; Camm, A.J.; Wettrell, G.; et al. Mutations in calmodulin cause ventricular tachycardia and sudden cardiac death. Am. J. Hum. Genet. 2012, 91, 703–712. [Google Scholar] [CrossRef] [PubMed]
- Makita, N.; Yagihara, N.; Crotti, L.; Johnson, C.N.; Beckmann, B.M.; Roh, M.S.; Shigemizu, D.; Lichtner, P.; Ishikawa, T.; Aiba, T.; et al. Novel calmodulin mutations associated with congenital arrhythmia susceptibility. Circ. Cardiovasc. Genet. 2014, 7, 466–474. [Google Scholar] [CrossRef] [PubMed]
- Reed, G.J.; Boczek, N.J.; Etheridge, S.P.; Ackerman, M.J. CALM3 mutation associated with long QT syndrome. Heart Rhythm 2015, 12, 419–422. [Google Scholar] [CrossRef] [PubMed]
- Kawasaki, H.; Nakayama, S.; Kretsinger, R.H. Classification and evolution of EF-hand proteins. Biometals Int. J. Role Met. Ions Biol. Biochem. Med. 1998, 11, 277–295. [Google Scholar]
- Kretsinger, R.H.; Nockolds, C.E. Carp muscle calcium-binding protein. II. Structure determination and general description. J. Biol. Chem. 1973, 248, 3313–3326. [Google Scholar]
- Chattopadhyaya, R.; Meador, W.E.; Means, A.R.; Quiocho, F.A. Calmodulin structure refined at 1.7 A resolution. J. Mol. Biol. 1992, 228, 1177–1192. [Google Scholar] [CrossRef]
- Kirberger, M.; Wong, H.C.; Jiang, J.; Yang, J.J. Metal toxicity and opportunistic binding of Pb(2+) in proteins. J. Inorg. Biochem. 2013, 125, 40–49. [Google Scholar] [CrossRef]
- Wright, P.E.; Dyson, H.J. Intrinsically unstructured proteins: Re-assessing the protein structure-function paradigm. J. Mol. Biol. 1999, 293, 321–331. [Google Scholar] [CrossRef]
- Yamauchi, E.; Nakatsu, T.; Matsubara, M.; Kato, H.; Taniguchi, H. Crystal structure of a MARCKS peptide containing the calmodulin-binding domain in complex with Ca2+-calmodulin. Nat. Struct. Biol. 2003, 10, 226–231. [Google Scholar] [CrossRef]
- Wall, M.E.; Clarage, J.B.; Phillips, G.N. Motions of calmodulin characterized using both Bragg and diffuse X-ray scattering. Structure 1997, 5, 1599–1612. [Google Scholar] [CrossRef]
- Maximciuc, A.A.; Putkey, J.A.; Shamoo, Y.; Mackenzie, K.R. Complex of calmodulin with a ryanodine receptor target reveals a novel, flexible binding mode. Structure 2006, 14, 1547–1556. [Google Scholar] [CrossRef] [PubMed]
- Meador, W.E.; Means, A.R.; Quiocho, F.A. Target enzyme recognition by calmodulin: 2.4 A structure of a calmodulin-peptide complex. Science 1992, 257, 1251–1255. [Google Scholar] [CrossRef] [PubMed]
- Houdusse, A.; Gaucher, J.F.; Krementsova, E.; Mui, S.; Trybus, K.M.; Cohen, C. Crystal structure of apo-calmodulin bound to the first two IQ motifs of myosin V reveals essential recognition features. Proc. Natl. Acad. Sci. USA 2006, 103, 19326–19331. [Google Scholar] [CrossRef] [PubMed]
- Chen, L.T.; Liang, W.X.; Chen, S.; Li, R.K.; Tan, J.L.; Xu, P.F.; Luo, L.F.; Wang, L.; Yu, S.H.; Meng, G.; et al. Functional and molecular features of the calmodulin-interacting protein IQCG required for haematopoiesis in zebrafish. Nat. Commun. 2014, 5, 3811. [Google Scholar] [CrossRef] [PubMed]
- Yap, K.L.; Yuan, T.; Mal, T.K.; Vogel, H.J.; Ikura, M. Structural basis for simultaneous binding of two carboxy-terminal peptides of plant glutamate decarboxylase to calmodulin. J. Mol. Biol. 2003, 328, 193–204. [Google Scholar] [CrossRef]
- Ye, Y.; Lee, H.W.; Yang, W.; Shealy, S.; Yang, J.J. Probing site-specific calmodulin calcium and lanthanide affinity by grafting. J. Am. Chem. Soc. 2005, 127, 3743–3750. [Google Scholar] [CrossRef]
- Chazin, W.J. Relating form and function of EF-hand calcium binding proteins. Acc. Chem. Res. 2011, 44, 171–179. [Google Scholar] [CrossRef]
- Bagur, R.; Hajnoczky, G. Intracellular Ca2+ Sensing: Its Role in Calcium Homeostasis and Signaling. Mol. Cell 2017, 66, 780–788. [Google Scholar] [CrossRef]
- Chagot, B.; Chazin, W.J. Solution NMR structure of Apo-calmodulin in complex with the IQ motif of human cardiac sodium channel NaV1.5. J. Mol. Biol. 2011, 406, 106–119. [Google Scholar] [CrossRef]
- Feldkamp, M.D.; Yu, L.; Shea, M.A. Structural and energetic determinants of apo calmodulin binding to the IQ motif of the Na(V)1.2 voltage-dependent sodium channel. Structure 2011, 19, 733–747. [Google Scholar] [CrossRef] [PubMed]
- Ikura, M.; Ames, J.B. Genetic polymorphism and protein conformational plasticity in the calmodulin superfamily: Two ways to promote multifunctionality. Proc. Natl. Acad. Sci. USA 2006, 103, 1159–1164. [Google Scholar] [CrossRef] [PubMed]
- Nguyen, P.V.; Abel, T.; Kandel, E.R. Requirement of a critical period of transcription for induction of a late phase of LTP. Science 1994, 265, 1104–1107. [Google Scholar] [CrossRef] [PubMed]
- Van Lierop, J.E.; Wilson, D.P.; Davis, J.P.; Tikunova, S.; Sutherland, C.; Walsh, M.P.; Johnson, J.D. Activation of smooth muscle myosin light chain kinase by calmodulin. Role of LYS(30) and GLY(40). J. Biol. Chem. 2002, 277, 6550–6558. [Google Scholar] [CrossRef]
- Cheung, W.Y. Calmodulin plays a pivotal role in cellular regulation. Science 1980, 207, 19–27. [Google Scholar] [CrossRef]
- Tominaga, M.; Kojima, H.; Yokota, E.; Nakamori, R.; Anson, M.; Shimmen, T.; Oiwa, K. Calcium-induced mechanical change in the neck domain alters the activity of plant myosin XI. J. Biol. Chem. 2012, 287, 30711–30718. [Google Scholar] [CrossRef]
- Rumi-Masante, J.; Rusinga, F.I.; Lester, T.E.; Dunlap, T.B.; Williams, T.D.; Dunker, A.K.; Weis, D.D.; Creamer, T.P. Structural basis for activation of calcineurin by calmodulin. J. Mol. Biol. 2012, 415, 307–317. [Google Scholar] [CrossRef]
- Hoffman, L.; Farley, M.M.; Waxham, M.N. Calcium-calmodulin-dependent protein kinase II isoforms differentially impact the dynamics and structure of the actin cytoskeleton. Biochemistry 2013, 52, 1198–1207. [Google Scholar] [CrossRef]
- Turvey, M.R.; Laude, A.J.; Ives, E.O.; Seager, W.H.; Taylor, C.W.; Thorn, P. Modulation of IP(3)-sensitive Ca2+ release by 2,3-butanedione monoxime. Pflug. Arch. Eur. J. Physiol. 2003, 445, 614–621. [Google Scholar] [CrossRef]
- Zou, J.; Salarian, M.; Chen, Y.; Zhuo, Y.; Brown, N.E.; Hepler, J.R.; Yang, J.J. Direct visualization of interaction between calmodulin and connexin45. Biochem. J. 2017, 474, 4035–4051. [Google Scholar] [CrossRef]
- Barbato, G.; Ikura, M.; Kay, L.E.; Pastor, R.W.; Bax, A. Backbone dynamics of calmodulin studied by 15N relaxation using inverse detected two-dimensional NMR spectroscopy: The central helix is flexible. Biochemistry 1992, 31, 5269–5278. [Google Scholar] [CrossRef]
- Albrecht, K.; Hart, J.; Shaw, A.; Dunker, A.K. Quaternion contact ribbons: A new tool for visualizing intra- and intermolecular interactions in proteins. Pac. Symp. Biocomput. 1996, 1, 41–52. [Google Scholar]
- Westerlund, A.M.; Delemotte, L. Effect of Ca2+ on the promiscuous target-protein binding of calmodulin. Plos Comput. Biol. 2018, 14, e1006072. [Google Scholar] [CrossRef] [PubMed]
- O’Day, D.H.; Taylor, R.J.; Myre, M.A. Calmodulin and Calmodulin Binding Proteins in Dictyostelium: A Primer. Int. J. Mol. Sci. 2020, 21, 1210. [Google Scholar] [CrossRef] [PubMed]
- Urrutia, J.; Aguado, A.; Muguruza-Montero, A.; Nunez, E.; Malo, C.; Casis, O.; Villarroel, A. The Crossroad of Ion Channels and Calmodulin in Disease. Int. J. Mol. Sci. 2019, 20, 400. [Google Scholar] [CrossRef] [PubMed]
- O’Neil, K.T.; DeGrado, W.F. How calmodulin binds its targets: Sequence independent recognition of amphiphilic alpha-helices. Trends Biochem. Sci. 1990, 15, 59–64. [Google Scholar] [CrossRef]
- Choi, S. Encyclopedia of Signaling Molecules; Springer International Publishing: Cham, Switzerland, 2018. [Google Scholar]
- Osawa, M.; Tokumitsu, H.; Swindells, M.B.; Kurihara, H.; Orita, M.; Shibanuma, T.; Furuya, T.; Ikura, M. A novel target recognition revealed by calmodulin in complex with Ca2+-calmodulin-dependent kinase kinase. Nat. Struct. Biol. 1999, 6, 819–824. [Google Scholar]
- Gifford, J.L.; Walsh, M.P.; Vogel, H.J. Structures and metal-ion-binding properties of the Ca2+-binding helix-loop-helix EF-hand motifs. Biochem. J. 2007, 405, 199–221. [Google Scholar] [CrossRef]
- Tidow, H.; Nissen, P. Structural diversity of calmodulin binding to its target sites. FEBS J. 2013, 280, 5551–5565. [Google Scholar] [CrossRef]
- Zou, J.; Salarian, M.; Chen, Y.; Veenstra, R.; Louis, C.F.; Yang, J.J. Gap junction regulation by calmodulin. FEBS Lett. 2014, 588, 1430–1438. [Google Scholar] [CrossRef]
- Chen, Y.; Zhou, Y.; Lin, X.; Wong, H.C.; Xu, Q.; Jiang, J.; Wang, S.; Lurtz, M.M.; Louis, C.F.; Veenstra, R.D.; et al. Molecular interaction and functional regulation of connexin50 gap junctions by calmodulin. Biochem. J. 2011, 435, 711–722. [Google Scholar] [CrossRef]
- Rhoads, A.R.; Friedberg, F. Sequence motifs for calmodulin recognition. FASEB J. Off. Publ. Fed. Am. Soc. Exp. Biol. 1997, 11, 331–340. [Google Scholar] [CrossRef]
- Mruk, K.; Farley, B.M.; Ritacco, A.W.; Kobertz, W.R. Calmodulation meta-analysis: Predicting calmodulin binding via canonical motif clustering. J. Gen. Physiol. 2014, 144, 105–114. [Google Scholar] [CrossRef]
- Rodney, G.G.; Krol, J.; Williams, B.; Beckingham, K.; Hamilton, S.L. The carboxy-terminal calcium binding sites of calmodulin control calmodulin’s switch from an activator to an inhibitor of RYR1. Biochemistry 2001, 40, 12430–12435. [Google Scholar] [CrossRef]
- Rodney, G.G.; Moore, C.P.; Williams, B.Y.; Zhang, J.Z.; Krol, J.; Pedersen, S.E.; Hamilton, S.L. Calcium binding to calmodulin leads to an N-terminal shift in its binding site on the ryanodine Receptor. J. Biol. Chem. 2001, 276, 2069–2074. [Google Scholar] [CrossRef] [PubMed]
- Xiong, L.W.; Newman, R.A.; Rodney, G.G.; Thomas, O.; Zhang, J.Z.; Persechini, A.; Shea, M.A.; Hamilton, S.L. Lobe-dependent regulation of ryanodine receptor type 1 by calmodulin. J. Biol. Chem. 2002, 277, 40862–40870. [Google Scholar] [CrossRef] [PubMed]
- Brohus, M.; Sondergaard, M.T.; Wayne Chen, S.R.; van Petegem, F.; Overgaard, M.T. Ca2+-dependent calmodulin binding to cardiac ryanodine receptor (RyR2) calmodulin-binding domains. Biochem. J. 2019, 476, 193–209. [Google Scholar] [CrossRef] [PubMed]
- Zhou, Y.; Yang, W.; Lurtz, M.M.; Ye, Y.; Huang, Y.; Lee, H.W.; Chen, Y.; Louis, C.F.; Yang, J.J. Identification of the calmodulin binding domain of connexin 43. J. Biol. Chem. 2007, 282, 35005–35017. [Google Scholar] [CrossRef]
- Zhou, Y.; Yang, W.; Lurtz, M.M.; Chen, Y.; Jiang, J.; Huang, Y.; Louis, C.F.; Yang, J.J. Calmodulin mediates the Ca2+-dependent regulation of Cx44 gap junctions. Biophys. J. 2009, 96, 2832–2848. [Google Scholar] [CrossRef]
- Chapman, P.F.; Frenguelli, B.G.; Smith, A.; Chen, C.M.; Silva, A.J. The alpha-Ca2+/calmodulin kinase II: A bidirectional modulator of presynaptic plasticity. Neuron 1995, 14, 591–597. [Google Scholar] [CrossRef]
- Xia, X.M.; Fakler, B.; Rivard, A.; Wayman, G.; Johnson-Pais, T.; Keen, J.E.; Ishii, T.; Hirschberg, B.; Bond, C.T.; Lutsenko, S.; et al. Mechanism of calcium gating in small-conductance calcium-activated potassium channels. Nature 1998, 395, 503–507. [Google Scholar] [CrossRef] [PubMed]
- Minakami, R.; Jinnai, N.; Sugiyama, H. Phosphorylation and calmodulin binding of the metabotropic glutamate receptor subtype 5 (mGluR5) are antagonistic in vitro. J. Biol. Chem. 1997, 272, 20291–20298. [Google Scholar] [CrossRef] [PubMed]
- O’Connor, V.; El Far, O.; Bofill-Cardona, E.; Nanoff, C.; Freissmuth, M.; Karschin, A.; Airas, J.M.; Betz, H.; Boehm, S. Calmodulin dependence of presynaptic metabotropic glutamate receptor signaling. Science 1999, 286, 1180–1184. [Google Scholar] [CrossRef] [PubMed]
- Huang, Y.; Zhou, Y.; Wong, H.C.; Castiblanco, A.; Chen, Y.; Brown, E.M.; Yang, J.J. Calmodulin regulates Ca2+-sensing receptor-mediated Ca2+ signaling and its cell surface expression. J. Biol. Chem. 2010, 285, 35919–35931. [Google Scholar] [CrossRef] [PubMed]
- Yap, K.L.; Kim, J.; Truong, K.; Sherman, M.; Yuan, T.; Ikura, M. Calmodulin target database. J. Struct. Funct. Genom. 2000, 1, 8–14. [Google Scholar] [CrossRef] [PubMed]
- Li, Y.; Maleki, M.; Carruthers, N.J.; Rueda, L.; Stemmer, P.M.; Ngom, A. Prediction of Calmodulin-Binding Proteins Using Short-Linear Motifs; Springer: Cham, Switzerland, 2017; pp. 107–117. [Google Scholar]
- Minhas, F.; Ben-Hur, A. Multiple instance learning of Calmodulin binding sites. Bioinformatics 2012, 28, i416–i422. [Google Scholar] [CrossRef] [PubMed]
- Eddy, S.R. Profile hidden Markov models. Bioinformatics 1998, 14, 755–763. [Google Scholar] [CrossRef]
- Needleman, S.B.; Wunsch, C.D. A general method applicable to the search for similarities in the amino acid sequence of two proteins. J. Mol. Biol. 1970, 48, 443–453. [Google Scholar] [CrossRef]
- Bork, P.; Gibson, T.J. Applying motif and profile searches. Methods Enzymol. 1996, 266, 162–184. [Google Scholar]
- Mount, S.M. Genomic sequence, splicing, and gene annotation. Am. J. Hum. Genet. 2000, 67, 788–792. [Google Scholar] [CrossRef]
- Schultz, J.; Milpetz, F.; Bork, P.; Ponting, C.P. SMART, a simple modular architecture research tool: Identification of signaling domains. Proc. Natl. Acad. Sci. USA 1998, 95, 5857–5864. [Google Scholar] [CrossRef] [PubMed]
- Reddy, A.S.; Ben-Hur, A.; Day, I.S. Experimental and computational approaches for the study of calmodulin interactions. Phytochemistry 2011, 72, 1007–1019. [Google Scholar] [CrossRef] [PubMed]
- Loewenstein, Y.; Raimondo, D.; Redfern, O.C.; Watson, J.; Frishman, D.; Linial, M.; Orengo, C.; Thornton, J.; Tramontano, A. Protein function annotation by homology-based inference. Genome Biol. 2009, 10, 207. [Google Scholar] [CrossRef]
- Ikura, M.; Barbato, G.; Klee, C.B.; Bax, A. Solution structure of calmodulin and its complex with a myosin light chain kinase fragment. Cell Calcium 1992, 13, 391–400. [Google Scholar] [CrossRef]
- Meador, W.E.; Means, A.R.; Quiocho, F.A. Modulation of calmodulin plasticity in molecular recognition on the basis of x-ray structures. Science 1993, 262, 1718–1721. [Google Scholar] [CrossRef] [PubMed]
- Elshorst, B.; Hennig, M.; Forsterling, H.; Diener, A.; Maurer, M.; Schulte, P.; Schwalbe, H.; Griesinger, C.; Krebs, J.; Schmid, H.; et al. NMR solution structure of a complex of calmodulin with a binding peptide of the Ca2+ pump. Biochemistry 1999, 38, 12320–12332. [Google Scholar] [CrossRef] [PubMed]
- Kyte, J.; Doolittle, R.F. A simple method for displaying the hydropathic character of a protein. J. Mol. Biol. 1982, 157, 105–132. [Google Scholar] [CrossRef]
- Eisenberg, D.; Weiss, R.M.; Terwilliger, T.C. The helical hydrophobic moment: A measure of the amphiphilicity of a helix. Nature 1982, 299, 371–374. [Google Scholar] [CrossRef]
- Chou, P.Y.; Fasman, G.D. Prediction of protein conformation. Biochemistry 1974, 13, 222–245. [Google Scholar] [CrossRef]
- Justino, E.J.R.; Bortolozzi, F.; Sabourin, R. A comparison of SVM and HMM classifiers in the off-line signature verification. Pattern Recognit. Lett. 2005, 26, 1377–1385. [Google Scholar] [CrossRef]
- Mruk, K.; Kobertz, W.R. Discovery of a novel activator of KCNQ1-KCNE1 K channel complexes. PLoS ONE 2009, 4, e4236. [Google Scholar] [CrossRef] [PubMed]
- Radivojac, P.; Vucetic, S.; O’Connor, T.R.; Uversky, V.N.; Obradovic, Z.; Dunker, A.K. Calmodulin signaling: Analysis and prediction of a disorder-dependent molecular recognition. Proteins 2006, 63, 398–410. [Google Scholar] [CrossRef] [PubMed]
- Ben-Hur, A.; Ong, C.S.; Sonnenburg, S.; Scholkopf, B.; Ratsch, G. Support vector machines and kernels for computational biology. Plos Comput. Biol. 2008, 4, e1000173. [Google Scholar] [CrossRef] [PubMed]
- Hamilton, M.; Reddy, A.S.N.; Ben-Hur, A. Kernel methods for Calmodulin binding and binding site prediction. In Proceedings of the 2nd ACM Conference on Bioinformatics, Computational Biology and Biomedicine, Chicago, IL, USA, 31 July–3 August 2011; pp. 381–386. [Google Scholar]
- Ghosh, S.; Dasgupta, A.; Swetapadma, A. A Study on Support Vector Machine based Linear and Non-Linear Pattern Classification. In Proceedings of the 2019 International Conference on Intelligent Sustainable Systems (ICISS), Tirupur, India, 21–22 February 2019; pp. 24–28. [Google Scholar]
- Abbasi, W.A.; Asif, A.; Andleeb, S.; Minhas, F. CaMELS: In silico prediction of calmodulin binding proteins and their binding sites. Proteins 2017, 85, 1724–1740. [Google Scholar] [CrossRef] [PubMed]
- Abbasi, W.A.; Minhas, F.U.A.A. Investigating Machine Learning Based Prediction of Protein Interactions. Ph.D. Thesis, Pakistan Institute of Engineering and Applied Sciences, Islamabad, Pakistan, 2019. [Google Scholar]
- Li, Y.; Maleki, M.; Carruthers, N.J.; Stemmer, P.M.; Ngom, A.; Rueda, L. The predictive performance of short-linear motif features in the prediction of calmodulin-binding proteins. Bmc Bioinform. 2018, 19, 410. [Google Scholar] [CrossRef] [PubMed]
- Anava, O.; Levy, K.Y. k*-Nearest Neighbors: From Global to Local. In Proceedings of the 30th Conference on Neural Information Processing Systems (NIPS 2016), Barcelona, Spain, 5–10 December 2016. [Google Scholar]
- Wang, L.; Liu, Z.P.; Zhang, X.S.; Chen, L. Prediction of hot spots in protein interfaces using a random forest model with hybrid features. Protein Eng. Des. Sel. Peds 2012, 25, 119–126. [Google Scholar] [CrossRef]
- Ben-Hur, A.; Noble, W.S. Kernel methods for predicting protein-protein interactions. Bioinformatics 2005, 21 (Suppl. 1), i38–i46. [Google Scholar] [CrossRef]
- Wright, P.E.; Dyson, H.J. Intrinsically disordered proteins in cellular signalling and regulation. Nat. Rev. Mol. Cell Biol. 2015, 16, 18–29. [Google Scholar] [CrossRef]
- Mukherjee, S.P.; Behar, M.; Birnbaum, H.A.; Hoffmann, A.; Wright, P.E.; Ghosh, G. Analysis of the RelA:CBP/p300 interaction reveals its involvement in NF-kappaB-driven transcription. PLoS Biol. 2013, 11, e1001647. [Google Scholar] [CrossRef]
- Fuxreiter, M.; Simon, I.; Friedrich, P.; Tompa, P. Preformed structural elements feature in partner recognition by intrinsically unstructured proteins. J. Mol. Biol. 2004, 338, 1015–1026. [Google Scholar] [CrossRef]
- Zhang, M.; Li, Z.; Wang, G.; Jang, H.; Sacks, D.B.; Zhang, J.; Gaponenko, V.; Nussinov, R. Calmodulin (CaM) Activates PI3Kalpha by Targeting the “Soft” CaM-Binding Motifs in Both the nSH2 and cSH2 Domains of p85alpha. J. Phys. Chem. B 2018, 122, 11137–11146. [Google Scholar] [CrossRef] [PubMed]
- Kirberger, M.; Wang, X.; Deng, H.; Yang, W.; Chen, G.; Yang, J.J. Statistical analysis of structural characteristics of protein Ca2+-binding sites. J. Biol. Inorg. Chem. JBIC 2008, 13, 1169–1181. [Google Scholar] [CrossRef] [PubMed]
- Tang, S.; Deng, X.; Jiang, J.; Kirberger, M.; Yang, J.J. Design of Calcium-Binding Proteins to Sense Calcium. Molecules 2020, 25, 2148. [Google Scholar] [CrossRef] [PubMed]
- Wang, X.; Kirberger, M.; Qiu, F.; Chen, G.; Yang, J.J. Towards predicting Ca2+-binding sites with different coordination numbers in proteins with atomic resolution. Proteins 2008, 75, 787–798. [Google Scholar] [CrossRef]
- Wang, X.; Zhao, K.; Kirberger, M.; Wong, H.; Chen, G.; Yang, J. Analysis and prediction of calcium-binding pockets from apo protein structures exhibiting calcium-induced localized conformational changes. Protein Sci. 2010, 19, 1180–1190. [Google Scholar] [CrossRef]
- Zhao, K.; Wang, X.; Wong, H.C.; Wohlhueter, R.; Kirberger, M.P.; Chen, G.; Yang, J.J. Predicting Ca2+ -binding sites using refined carbon clusters. Proteins 2012, 80, 2666–2679. [Google Scholar] [CrossRef]
- Abbasi, W.A.; Asif, A.; Ben-Hur, A.; Minhas, F. Learning protein binding affinity using privileged information. BMC Bioinform. 2018, 19, 425. [Google Scholar] [CrossRef]


| Motif. | Sequence |
|---|---|
| Ca2+ Dependent | |
| 1-10 | [FILVW]xxxxxxxx[FILVW] |
| 1-5-10 | [FILVW]xxx[FAILVW]xxxx[FILVW] |
| Basic 1-5-10 | [RK][RK][RK][FAILVW]xxx[FILV]xxxx[FILVW] |
| 1-12 | [FILVW]xxxxxxxxxx[FILVW] |
| 1-14 | [FILVW]xxxxxxxxxxxx[FILVW] |
| 1-8-14 | [FILVW]xxxxxx[FAILVW]xxxxx[FILVW] |
| Basic 1-8-14 | [RK][RK][RK][FILVW]xxxxxx[FAILVW]xxxxx[FILVW] |
| 1-16 | [FILVW]xxxxxxxxxxxxxx[FILVW] |
| Ca2+ Independent | |
| IQ | [FILV]Qxxx[RK]Gxxx[RK]xx{FILVWY] |
| IQ-like a | [FILV]Qxxx[RK]xxxxxxxx |
| IQ-2A | [IVL]QxxxRxxxx[VL][KR]xW |
| IQ-2B | [IL]QxxCxxxxKxRxW |
| IQ unconventional | [IVL]QxxxRxxxx[RK]xx[FILVWY] |
| Supervised Discriminative Classifier Models | |
| Support Vector Machine Hamilton et al. (2011), Minhas et al. (2012), Abbasi et al. (2017) | Seeks to classify sequence data by maximizing the margin between positive and negative features in a Euclidean hyperplane space through various tunable dot product kernel functions |
| k-Nearest Neighbor Li et al. (2018) | Classification is based on a vote of the closest training sequence samples in a data set that is being classified, k = 1 for Li et al. (2018); guarantees the error rate is no worse than 2× the Bayes’ error rate |
| Random Forest Classification Wang et al. (2012), Li et al. (2018) | Uses various decision trees such that each tree depends on random vector values that (1) have the same probability distribution for all trees in the forest, and (2) are sampled independently to determine the mode of both positive and negative sequence data sets |
| Neural Network/Logistic Regression Radivojac et al. (2006) | One layer sorts various features into binary classification using a regression model at an amino acid level and models the positive examples into likely regions that are compared at the second level to sequences that are known to bind to CaM to yield predictions in a binary classification logistic regression model for likely binding proteins |
| Supervised Generative Classifier Model | |
| Hidden Markov Model Yap & Ikura (2000) | Uses related instances in the data to make predictions about a sequential event in question. It is a computational method that considers all possible transition states (in this case, amino acid residue represented by N) when forming a transition probability, but only forms an emission probability based on the most likely instance. In biological terms, the residue at the N − 1 position forms 20 different, hidden transition probabilities for the amino acid residue at the N position, but only the most likely amino acid residue is emitted, which is observed by the user |
| Unsupervised Clustering Model | |
| Regular Expressions PERL Script Mruk et al. (2014) | Identifies motifs that are experimentally verified to bind to CaM using a text degenerate-pattern matching script, and adds motif scores together within a 21-residue binding to represent windows that are likely to bind to CaM based off the number of binding motifs that are observed within that scoring window |
| Method | Features | AUC | AUC0.1 | TH % | FH % |
|---|---|---|---|---|---|
| Vanilla SVM | 1-Spec | 95.5 | 53.9 | 66 | 2.6 |
| PD-1 | 95.6 | 54.5 | 64 | 2.5 | |
| Comb. | 95.9 | 55.1 | 65 | 2.1 | |
| Max. Std. | 0.16 | 0.59 | 2.2 | 0.15 | |
| MI-1 SVM | 1-Spec | 96.0 | 54.3 | 62 | 2.1 |
| PD-1 | 96.8 | 58.5 | 72 | 1.3 | |
| Comb. | 96.9 | 59.0 | 75 | 1.2 | |
| Max. Std. | 0.14 | 0.80 | 3.4 | 0.11 | |
| Gappy | 96.5 | 58.5 | 68 | 1.6 |
| Method (Author) | Features | AUC-ROC | AUC-ROC 0.1 | AUC-PR |
|---|---|---|---|---|
| 20 Feed-forward neural networks (Radivojac) | - | 0.89 | - | - |
| SVM (Hamilton) | 1-spec | 0.87 | 0.62 | - |
| psi | 0.88 | 0.61 | - | |
| gappy-pair | 0.89 | 0.61 | - | |
| MI-1 SVM (Minhas) | 1-spec | 0.96 | 0.543 | - |
| gappy | 0.965 | 0.585 | - | |
| comb | 0.969 | 0.59 | - | |
| CaMELS (Abbasi) | PD-Blosum | * 0.991 | * 0.802 | * 0.87 |
| Comb(AAC and PDC) | 0.989 | 0.776 | 0.856 | |
| PDGT | 0.99 | 0.78 | 0.854 | |
| PDC | 0.984 | 0.762 | 0.841 | |
| propy | 0.98 | 0.747 | 0.812 | |
| AAC | 0.978 | 0.723 | 0.807 | |
| Interaction prediction | ||||
| SVM (Hamilton) | 1-spec | 0.71 | - | - |
| Gappy-pair | 0.71 | - | - | |
| psi | 0.74 | - | - | |
| CaMELS (Abbasi) | Propy | * 0.867 | * 0.651 | * 0.55 |
| Blosum | 0.784 | 0.326 | 0.114 | |
| AAC | 0.747 | 0.404 | 0.268 | |
| SW | 0.784 | 0.519 | 0.402 | |
Publisher’s Note: MDPI stays neutral with regard to jurisdictional claims in published maps and institutional affiliations. |
© 2020 by the authors. Licensee MDPI, Basel, Switzerland. This article is an open access article distributed under the terms and conditions of the Creative Commons Attribution (CC BY) license (http://creativecommons.org/licenses/by/4.0/).
Share and Cite
Andrews, C.; Xu, Y.; Kirberger, M.; Yang, J.J. Structural Aspects and Prediction of Calmodulin-Binding Proteins. Int. J. Mol. Sci. 2021, 22, 308. https://doi.org/10.3390/ijms22010308
Andrews C, Xu Y, Kirberger M, Yang JJ. Structural Aspects and Prediction of Calmodulin-Binding Proteins. International Journal of Molecular Sciences. 2021; 22(1):308. https://doi.org/10.3390/ijms22010308
Chicago/Turabian StyleAndrews, Corey, Yiting Xu, Michael Kirberger, and Jenny J. Yang. 2021. "Structural Aspects and Prediction of Calmodulin-Binding Proteins" International Journal of Molecular Sciences 22, no. 1: 308. https://doi.org/10.3390/ijms22010308
APA StyleAndrews, C., Xu, Y., Kirberger, M., & Yang, J. J. (2021). Structural Aspects and Prediction of Calmodulin-Binding Proteins. International Journal of Molecular Sciences, 22(1), 308. https://doi.org/10.3390/ijms22010308