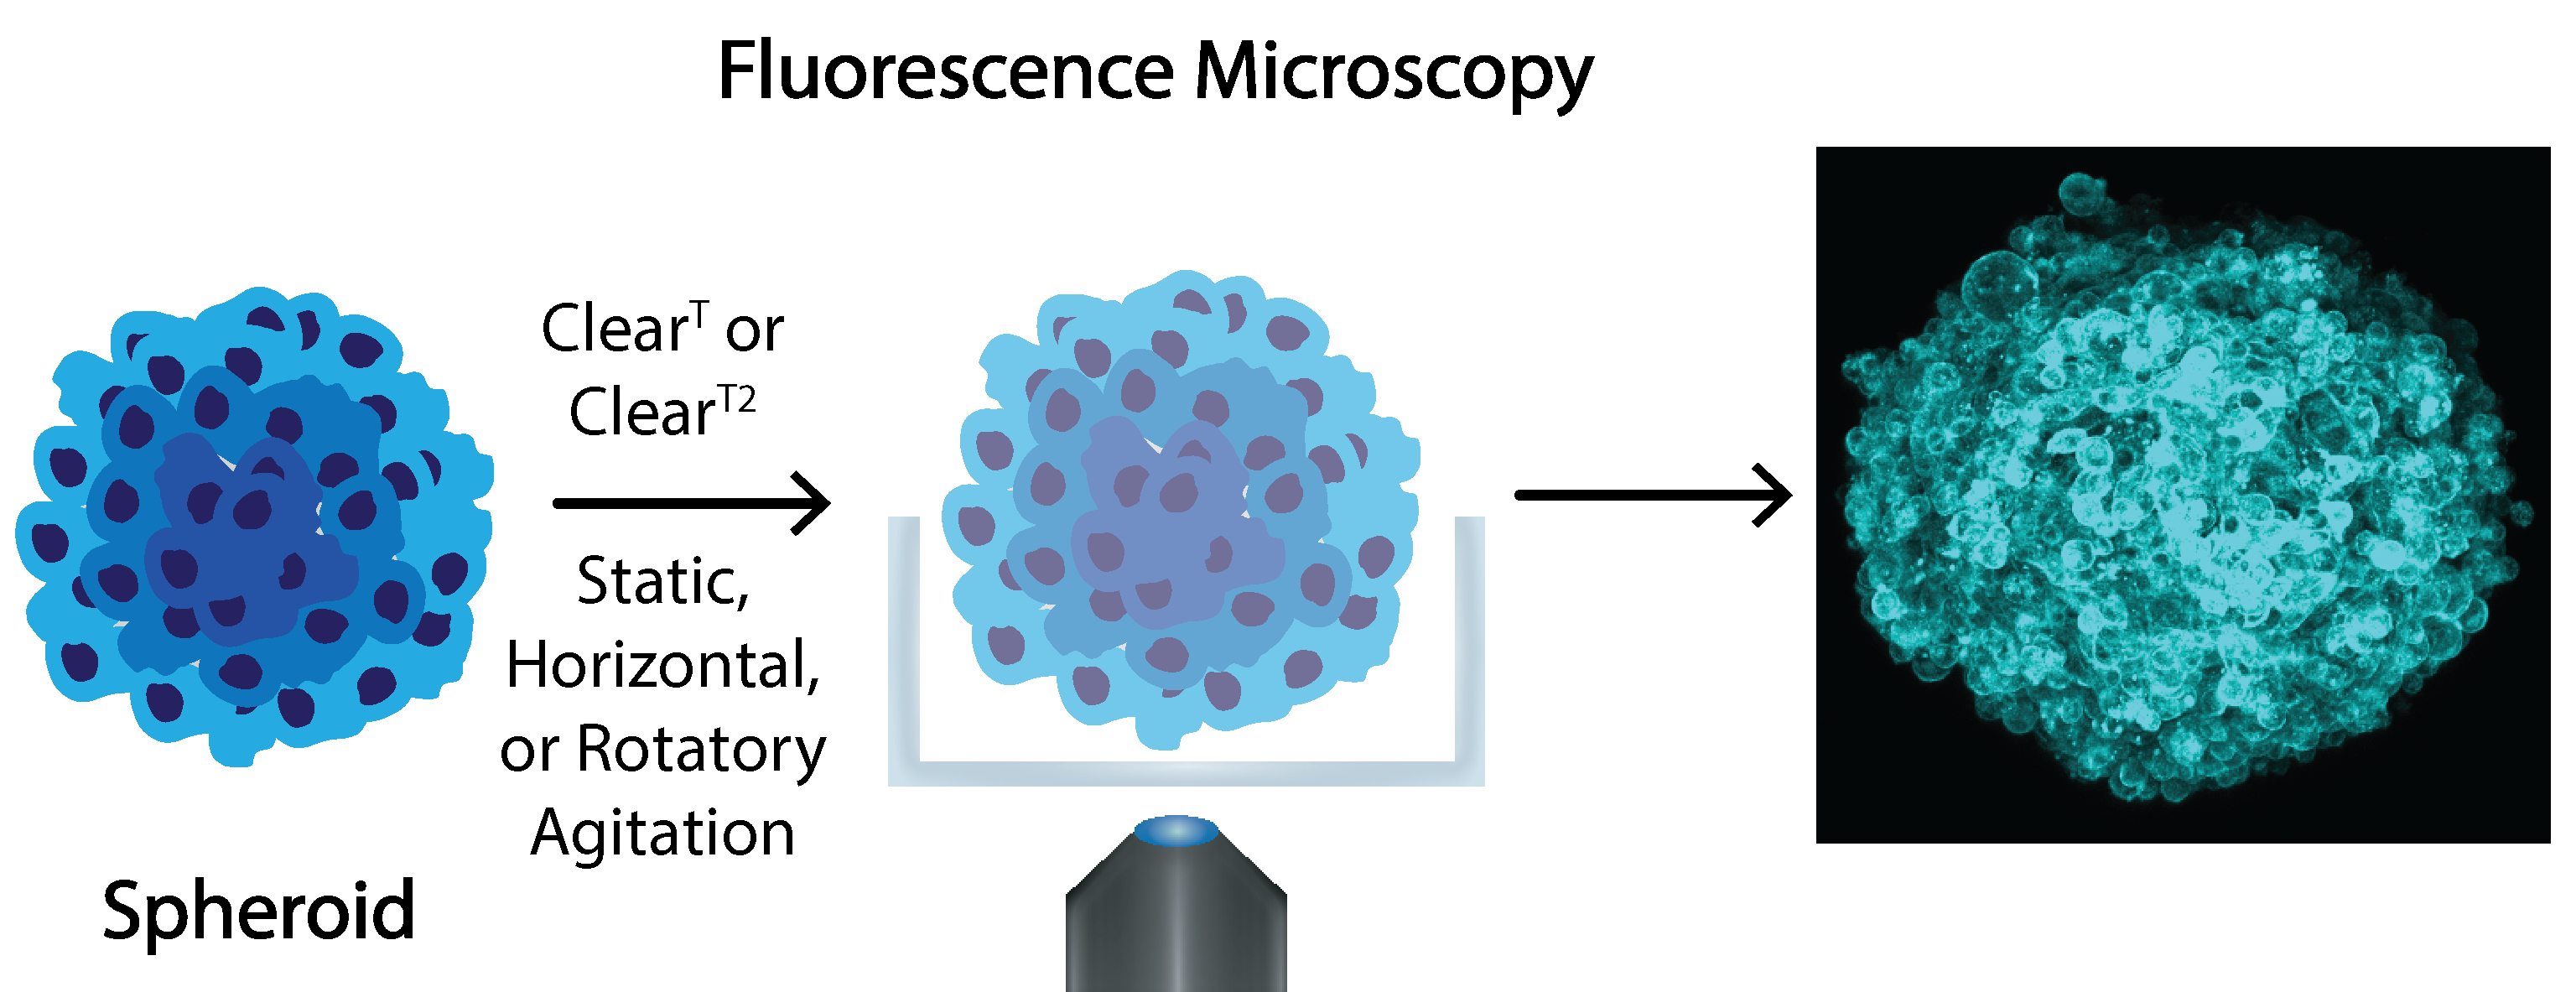
Influence of ClearT and ClearT2 Agitation Conditions in the Fluorescence Imaging of 3D Spheroids

 and
and 
Abstract
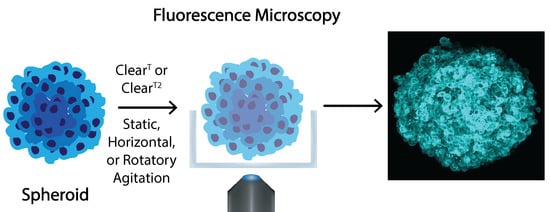
1. Introduction
2. Materials and Methods
2.1. Materials
2.2. Methods
2.2.1. Cells Maintenance and 3D HFIB Formation
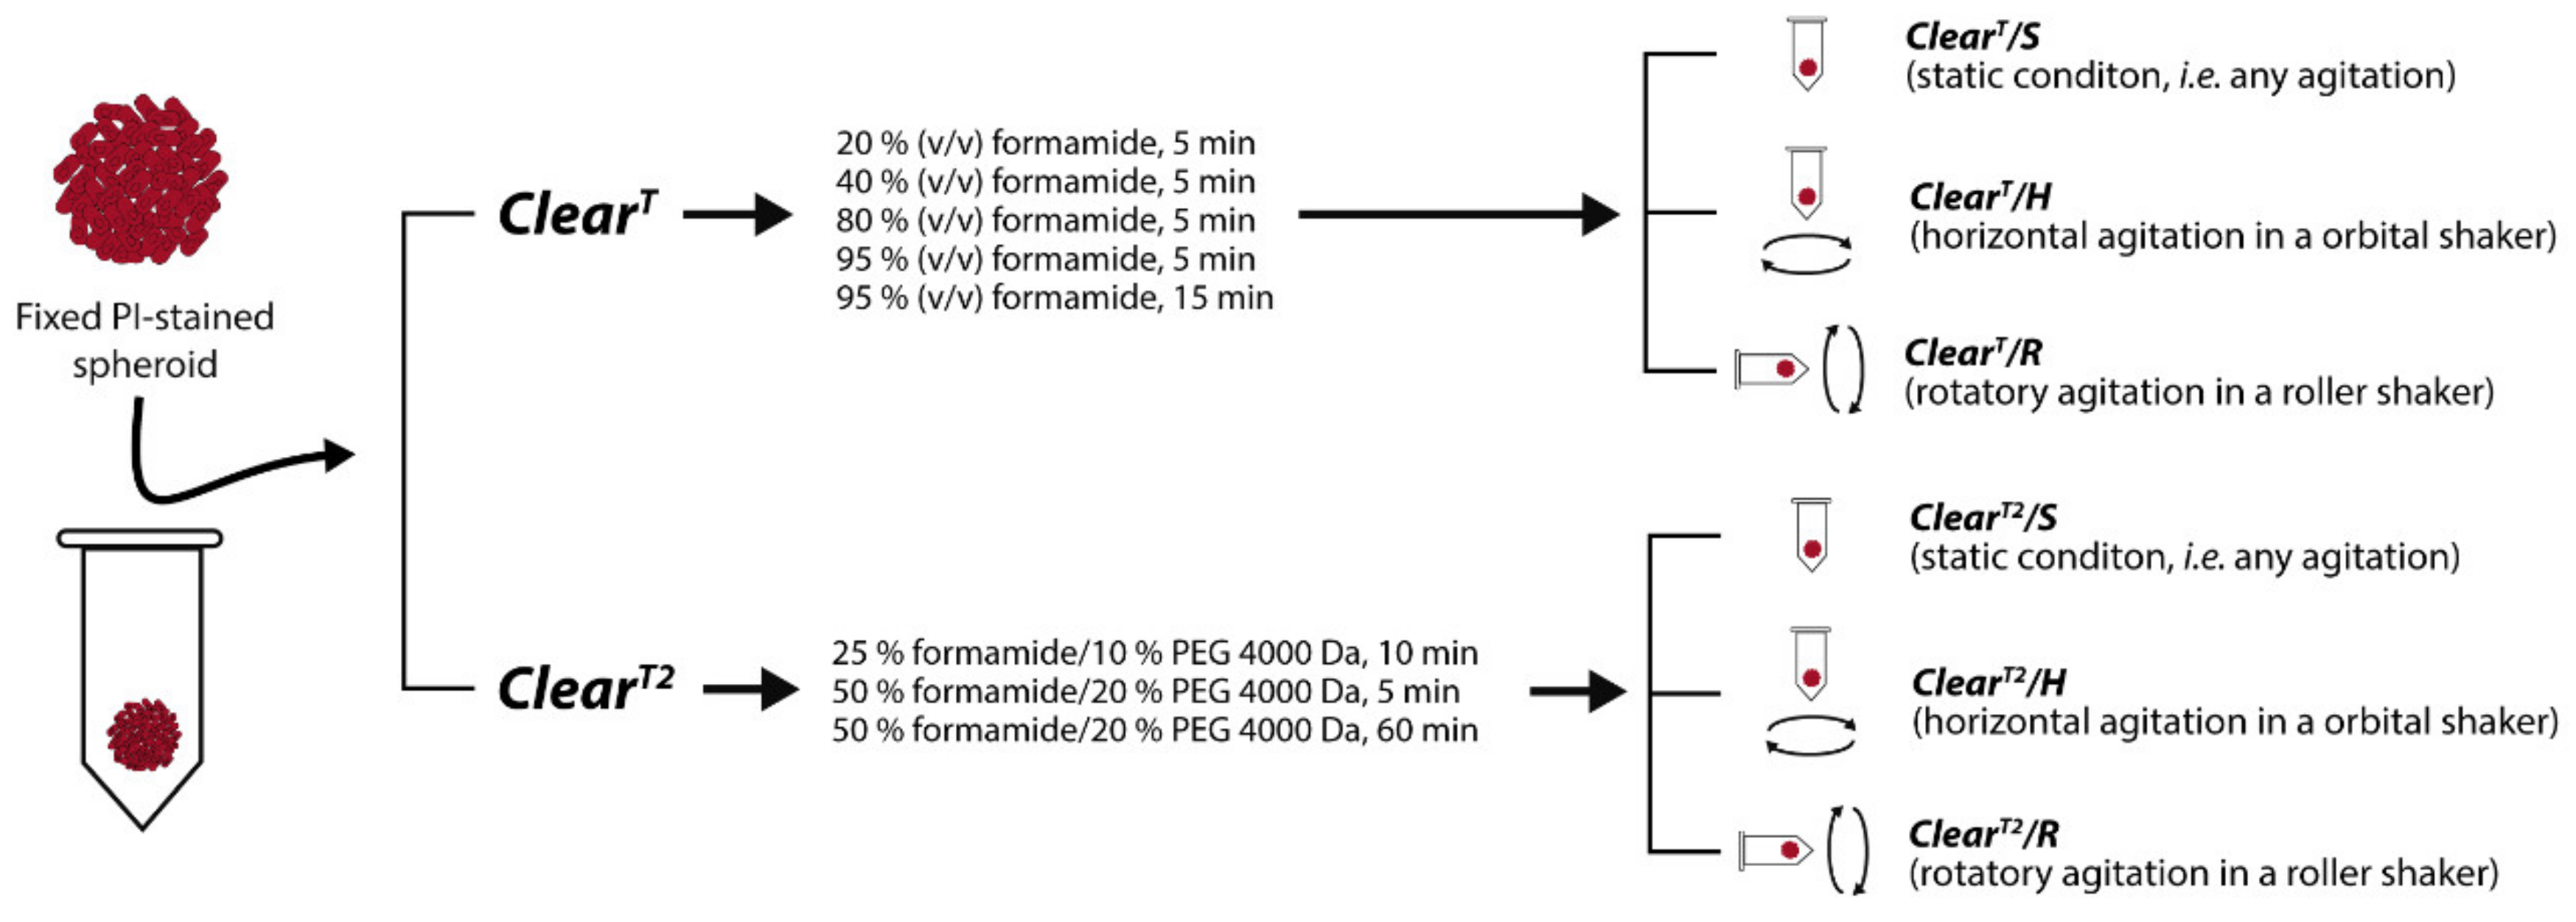
2.2.2. HFIB Spheroids Fixation and Incubation with PI
2.2.3. Spheroids Optical Clearing by ClearT
2.2.4. Spheroids Optical Clearing by ClearT2
2.2.5. Spheroids Imaging and Analysis by Optical Microscopy
2.2.6. Spheroids Imaging and Analysis by CLSM
2.2.7. Statistical Analysis
3. Results and Discussion
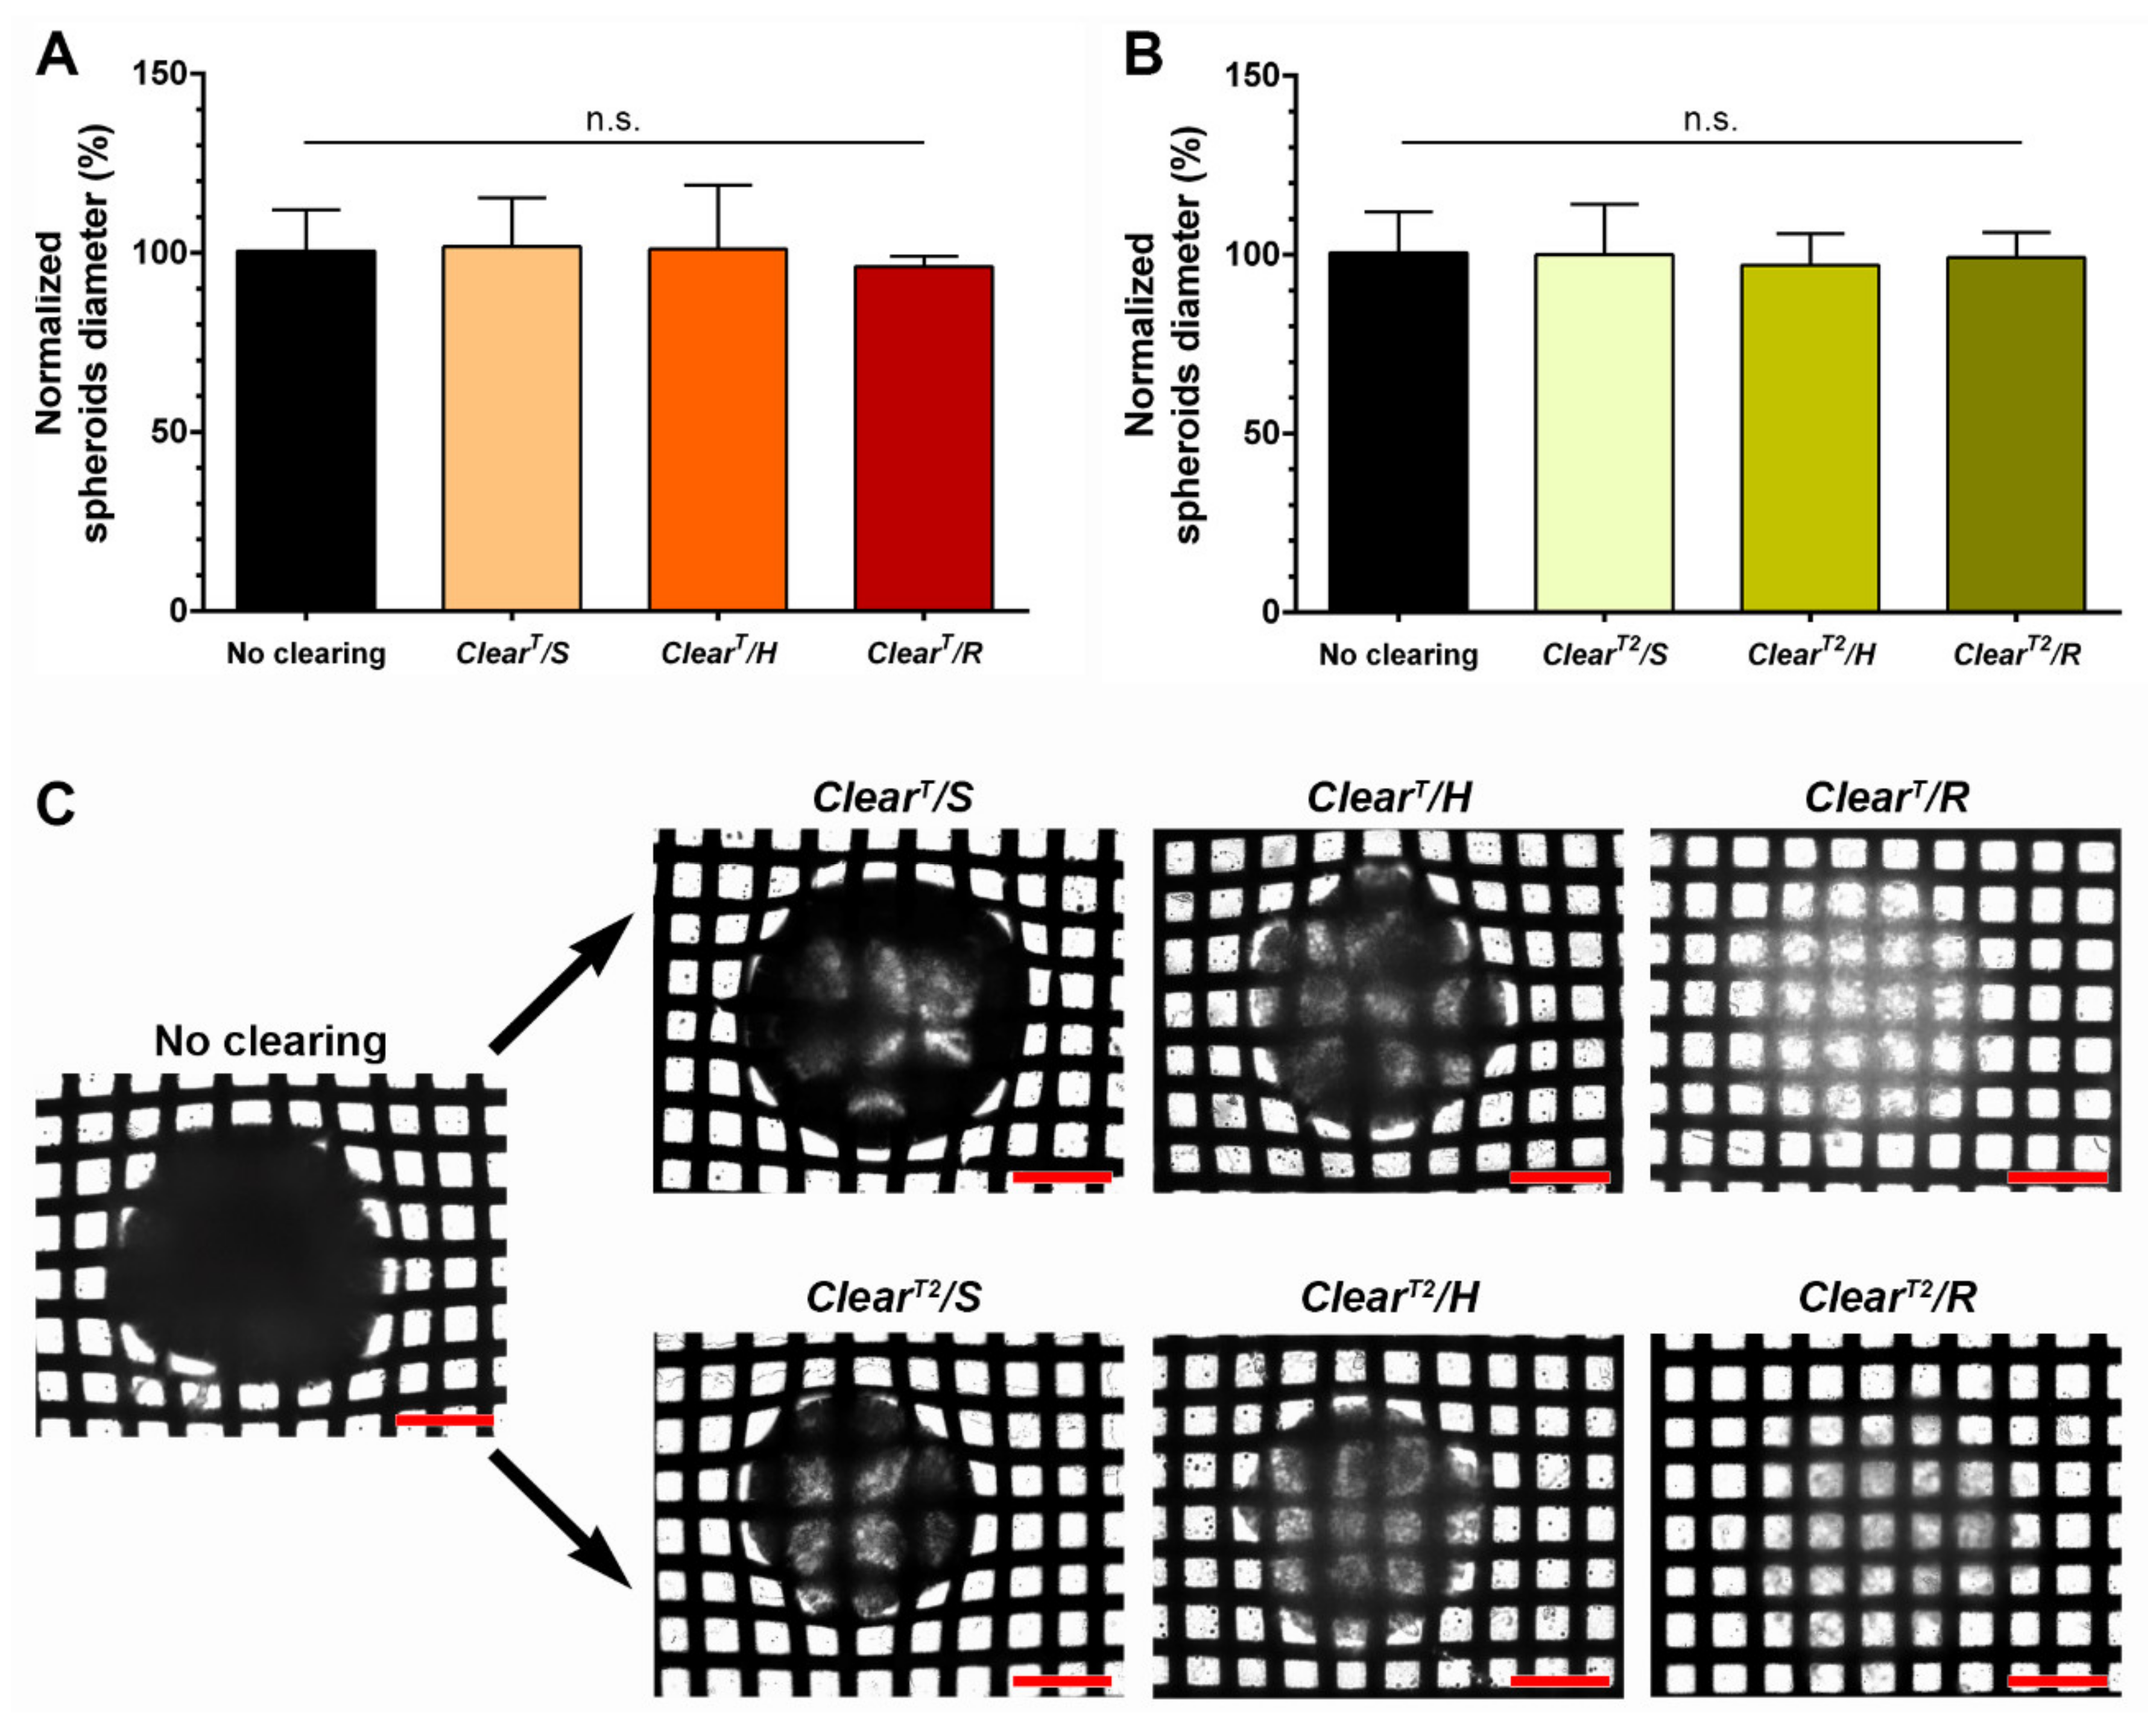
3.1. Spheroids’ Size
3.2. Spheroids’ Transparency
3.3. PI Fluorescence
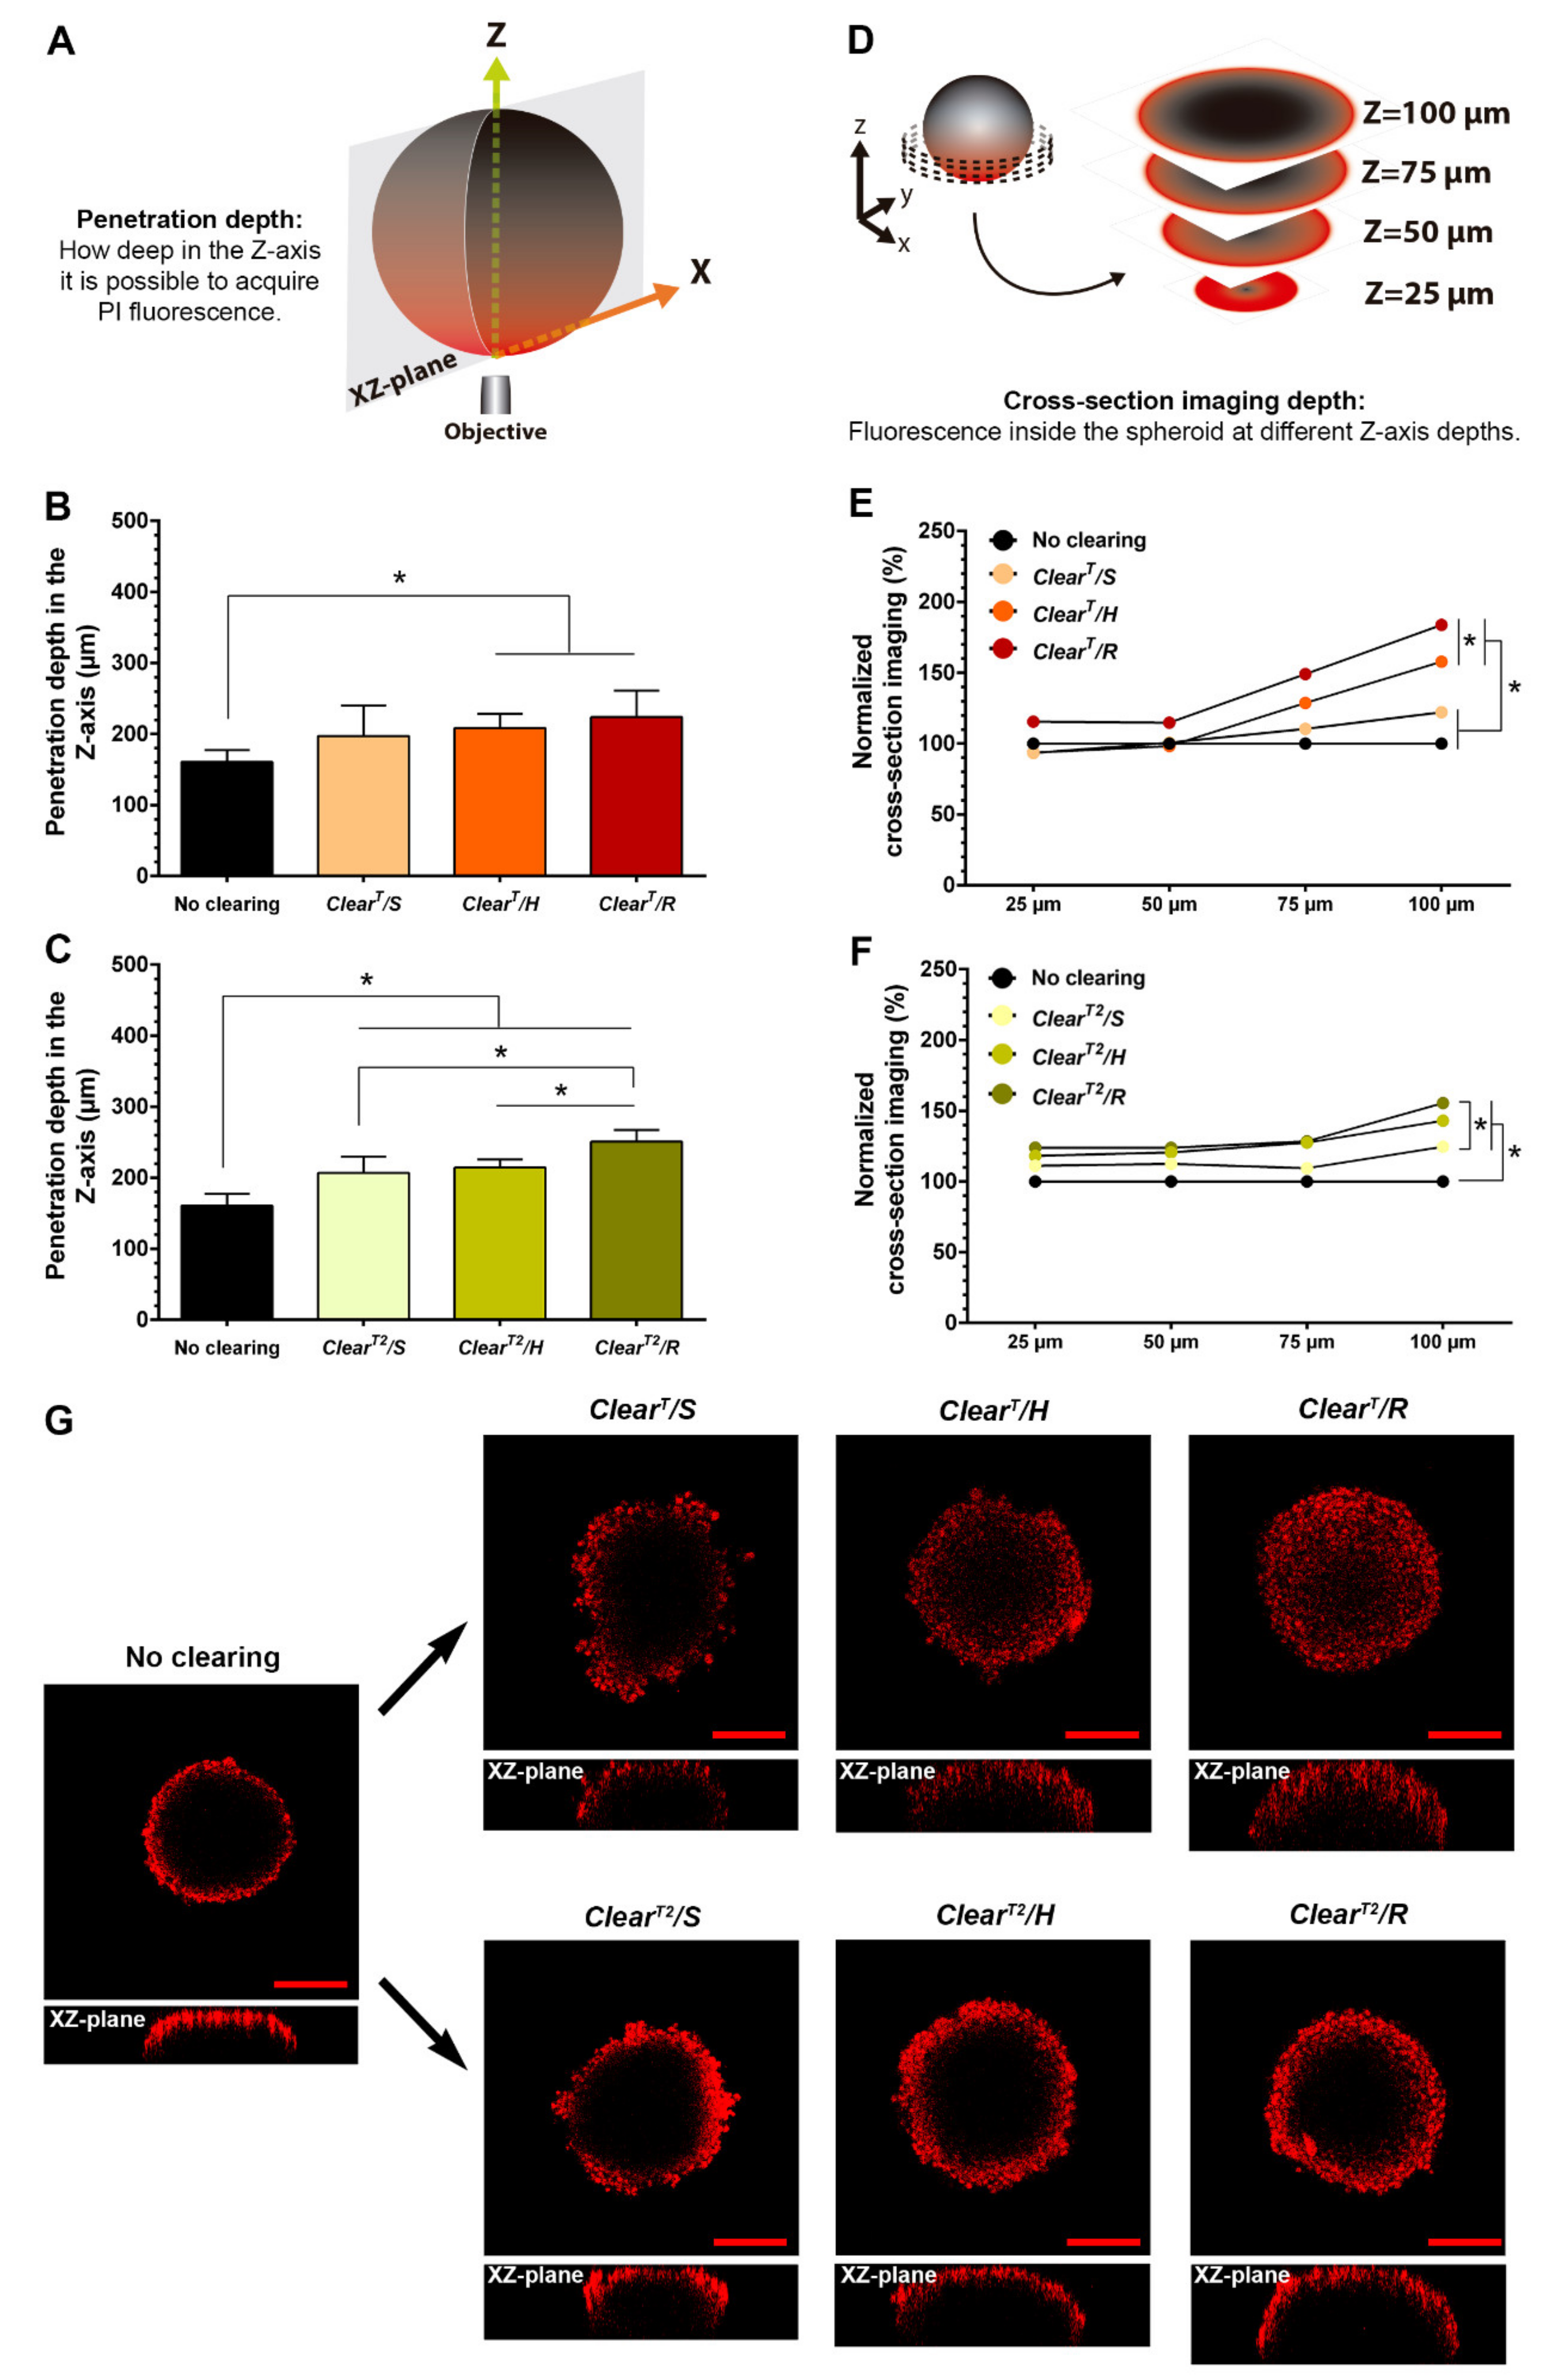
3.4. PI Fluorescence Depth in Z-Axis
3.5. Spheroids Cross-Section Imaging
4. Conclusions
Author Contributions
Funding
Institutional Review Board Statement
Informed Consent Statement
Data Availability Statement
Acknowledgments
Conflicts of Interest
References
- Kapałczyńska, M.; Kolenda, T.; Przybyła, W.; Zajączkowska, M.; Teresiak, A.; Filas, V.; Ibbs, M.; Bliźniak, R.; Łuczewski, Ł.; Lamperska, K. 2D and 3D cell cultures—A comparison of different types of cancer cell cultures. Arch. Med. Sci. 2018, 14, 910–919. [Google Scholar] [CrossRef] [PubMed]
- Duval, K.; Grover, H.; Han, L.H.; Mou, Y.; Pegoraro, A.F.; Fredberg, J.; Chen, Z. Modeling physiological events in 2D vs. 3D cell culture. Physiology 2017, 32, 266–277. [Google Scholar] [CrossRef] [PubMed]
- Fang, Y.; Eglen, R.M. Three-Dimensional cell cultures in drug discovery and development. SLAS Discov. 2017, 22, 456–472. [Google Scholar] [CrossRef] [PubMed]
- Breslin, S.; O’Driscoll, L. Three-Dimensional cell culture: The missing link in drug discovery. Drug Discov. Today 2013, 18, 240–249. [Google Scholar] [CrossRef]
- Nunes, A.S.; Barros, A.S.; Costa, E.C.; Moreira, A.F.; Correia, I.J. 3D tumor spheroids as in vitro models to mimic in vivo human solid tumors resistance to therapeutic drugs. Biotechnol. Bioeng. 2019, 116, 206–226. [Google Scholar] [CrossRef]
- Van den Brand, D.; Massuger, L.F.; Brock, R. Mimicking tumors: Toward more predictive in vitro models for peptide- and protein-conjugated drugs. Bioconjugate Chem. 2017, 28, 846–856. [Google Scholar] [CrossRef]
- Nunes, A.S.; Costa, E.C.; Barros, A.S.; de Melo-Diogo, D.; Correia, I.J. Establishment of 2D cell cultures derived from 3D MCF-7 spheroids displaying a doxorubicin resistant profile. Biotechnol. J. 2018, e1800268. [Google Scholar] [CrossRef]
- Gong, X.; Lin, C.; Cheng, J.; Su, J.; Zhao, H.; Liu, T.; Wen, X.; Zhao, P. Generation of multicellular tumor spheroids with microwell-based agarose scaffolds for drug testing. PLoS ONE 2015, 10, e0130348. [Google Scholar] [CrossRef]
- Sirenko, O.; Mitlo, T.; Hesley, J.; Luke, S.; Owens, W.; Cromwell, E.F. High-Content assays for characterizing the viability and morphology of 3D cancer spheroid cultures. Assay Drug Dev. Technol. 2015, 13, 402–414. [Google Scholar] [CrossRef]
- Oltolina, F.; Zamperone, A.; Colangelo, D.; Gregoletto, L.; Reano, S.; Pietronave, S.; Merlin, S.; Talmon, M.; Novelli, E.; Diena, M.; et al. Human cardiac progenitor spheroids exhibit enhanced engraftment potential. PLoS ONE 2015, 10, e0137999. [Google Scholar] [CrossRef]
- Neto, A.I.; Correia, C.R.; Oliveira, M.B.; Rial-Hermida, M.I.; Alvarez-Lorenzo, C.; Reis, R.L.; Mano, J.F. A novel hanging spherical drop system for the generation of cellular spheroids and high throughput combinatorial drug screening. Biomater. Sci. 2015, 3, 581–585. [Google Scholar] [CrossRef] [PubMed]
- Lu, H.; Utama, R.H.; Kitiyotsawat, U.; Babiuch, K.; Jiang, Y.; Stenzel, M.H. Enhanced transcellular penetration and drug delivery by crosslinked polymeric micelles into pancreatic multicellular tumor spheroids. Biomater. Sci. 2015, 3, 1085–1095. [Google Scholar] [CrossRef] [PubMed]
- Graf, B.W.; Boppart, S.A. Imaging and analysis of three-dimensional cell culture models. Methods Mol. Biol. 2010, 591, 211–227. [Google Scholar] [CrossRef] [PubMed]
- Grist, S.M.; Nasseri, S.S.; Poon, T.; Roskelley, C.; Cheung, K.C. On-Chip clearing of arrays of 3-D cell cultures and micro-tissues. Biomicrofluidics 2016, 10, 044107. [Google Scholar] [CrossRef]
- Richardson, D.S.; Lichtman, J.W. Clarifying tissue clearing. Cell 2015, 162, 246–257. [Google Scholar] [CrossRef]
- Kunz-Schughart, L.A.; Freyer, J.P.; Hofstaedter, F.; Ebner, R. The use of 3-D cultures for high-throughput screening: The multicellular spheroid model. J. Biomol. Screen. 2004, 9, 273–285. [Google Scholar] [CrossRef]
- Costa, E.C.; Moreira, A.F.; de Melo-Diogo, D.; Gaspar, V.M.; Carvalho, M.P.; Correia, I.J. 3D tumor spheroids: An overview on the tools and techniques used for their analysis. Biotechnol. Adv. 2016, 34, 1427–1441. [Google Scholar] [CrossRef]
- Boutin, M.E.; Hoffman-Kim, D. Application and assessment of optical clearing methods for imaging of tissue-engineered neural stem cell spheres. Tissue Eng. 2015, 21, 292–302. [Google Scholar] [CrossRef]
- Costa, E.C.; Moreira, A.F.; de Melo-Diogo, D.; Correia, I.J. ClearT immersion optical clearing method for intact 3D spheroids imaging through confocal laser scanning microscopy. Opt. Laser Technol. 2018, 106, 94–99. [Google Scholar] [CrossRef]
- Kabadi, P.K.; Vantangoli, M.M.; Rodd, A.L.; Leary, E.; Madnick, S.J.; Morgan, J.R.; Kane, A.; Boekelheide, K. Into the depths: Techniques for in vitro three-dimensional microtissue visualization. Biotechniques 2015, 59, 279–286. [Google Scholar] [CrossRef]
- Costa, E.C.; Moreira, A.F.; de Melo-Diogo, D.; Correia, I.J. Polyethylene glycol molecular weight influences the Clear T2 optical clearing method for spheroids imaging by confocal laser scanning microscopy. J. Biomed. Opt. 2018, 23, 055003. [Google Scholar] [CrossRef]
- Chen, Y.; Tsai, Y.-H.; Liu, Y.-A.; Lee, S.-H.; Tseng, S.-H.; Tang, S.-C. Application of three-dimensional imaging to the intestinal crypt organoids and biopsied intestinal tissues. Sci. World J. 2013, 2013, 624342. [Google Scholar] [CrossRef] [PubMed]
- Yu, T.; Qi, Y.; Gong, H.; Luo, Q.; Zhu, D. Optical clearing for multiscale biological tissues. J. Biophotonics 2018, 11, 1–13. [Google Scholar] [CrossRef] [PubMed]
- Wenzel, C.; Riefke, B.; Gründemann, S.; Krebs, A.; Christian, S.; Prinz, F.; Osterland, M.; Golfier, S.; Räse, S.; Ansari, N.; et al. 3D high-content screening for the identification of compounds that target cells in dormant tumor spheroid regions. Exp. Cell Res. 2014, 323, 131–143. [Google Scholar] [CrossRef]
- Desmaison, A.; Guillaume, L.; Triclin, S.; Weiss, P.; Ducommun, B.; Lobjois, V. Impact of physical confinement on nuclei geometry and cell division dynamics in 3D spheroids. Sci. Rep. 2018, 8, 8785. [Google Scholar] [CrossRef]
- Schmitz, A.; Fischer, S.C.; Mattheyer, C.; Pampaloni, F.; Stelzer, E.H.K. Multiscale image analysis reveals structural heterogeneity of the cell microenvironment in homotypic spheroids. Sci. Rep. 2017, 7, 43693. [Google Scholar] [CrossRef]
- Smyrek, I.; Stelzer, E.H.K. Quantitative three-dimensional evaluation of immunofluorescence staining for large whole mount spheroids with light sheet microscopy. Biomed. Opt. Express 2017, 8, 484–499. [Google Scholar] [CrossRef]
- Masson, A.; Escande, P.; Frongia, C.; Clouvel, G.; Ducommun, B.; Lorenzo, C. High-Resolution in-depth imaging of optically cleared thick samples using an adaptive SPIM. Sci. Rep. 2015, 5, 16898. [Google Scholar] [CrossRef]
- Santisteban, T.S.; Rabajania, O.; Kalinina, I.; Robinson, S.; Meier, M. Rapid spheroid clearing on a microfluidic chip. Lab Chip 2018, 18, 153–161. [Google Scholar] [CrossRef]
- Chen, Y.Y.; Silva, P.N.; Syed, A.M.; Sindhwani, S.; Rocheleau, J.V.; Chan, W.C. Clarifying intact 3D tissues on a microfluidic chip for high-throughput structural analysis. Proc. Natl. Acad. Sci. USA 2016, 113, 14915–14920. [Google Scholar] [CrossRef]
- Seo, J.; Choe, M.; Kim, S.Y. Clearing and labeling techniques for large-scale biological tissues. Mol. Cells 2016, 39, 439–446. [Google Scholar] [CrossRef] [PubMed]
- Kuwajima, T.; Sitko, A.A.; Bhansali, P.; Jurgens, C.; Guido, W.; Mason, C. ClearT: A detergent- and solvent-free clearing method for neuronal and non-neuronal tissue. Development 2013, 140, 1364–1368. [Google Scholar] [CrossRef] [PubMed]
- Feuchtinger, A.; Walch, A.; Dobosz, M. Deep tissue imaging: A review from a preclinical cancer research perspective. Histochem. Cell Biol. 2016, 146, 781–806. [Google Scholar] [CrossRef] [PubMed]
- Berke, I.M.; Miola, J.P.; David, M.A.; Smith, M.K.; Price, C. Seeing through musculoskeletal tissues: Improving in situ imaging of bone and the lacunar canalicular system through optical clearing. PLoS ONE 2016, 11, e0150268. [Google Scholar] [CrossRef]
- Costa, E.C.; Gaspar, V.M.; Coutinho, P.; Correia, I.J. Optimization of liquid overlay technique to formulate heterogenic 3D co-cultures models. Biotechnol. Bioeng. 2014, 111, 1672–1685. [Google Scholar] [CrossRef]
- Rasband, W.S. Image J. Available online: http://rsbweb.nih.gov/ij/ (accessed on 11 March 2019).
- Klaka, P.; Grüdl, S.; Banowski, B.; Giesen, M.; Sättler, A.; Proksch, P.; Welss, T.; Förster, T. A novel organotypic 3D sweat gland model with physiological functionality. PLoS ONE 2017, 12, e0182752. [Google Scholar] [CrossRef]
- Yu, T.; Qi, Y.; Wang, J.; Feng, W.; Xu, J.; Zhu, J.; Yao, Y.; Gong, H.; Luo, Q.; Zhu, D. Rapid and prodium iodide-compatible optical clearing method for brain tissue based on sugar/sugar-alcohol. J. Biomed. Opt. 2016, 21, 081203. [Google Scholar] [CrossRef][Green Version]
- Ke, M.-T.; Fujimoto, S.; Imai, T. SeeDB: A simple and morphology-preserving optical clearing agent for neuronal circuit reconstruction. Nat. Neurosci. 2013, 16, 1154–1161. [Google Scholar] [CrossRef]
- Decroix, L.; Van Muylder, V.; Desender, L.; Sampaolesi, M.; Thorrez, L. Tissue clearing for confocal imaging of native and bio-artificial skeletal muscle. Biotech. Histochem. 2015, 90, 424–431. [Google Scholar] [CrossRef]
- Chubinskiy-Nadezhdin, V.I.; Negulyaev, Y.A.; Morachevskaya, E.A. Simvastatin induced actin cytoskeleton disassembly in normal and transformed fibroblasts without affecting lipid raft integrity. Cell Biol. Int. 2017, 41, 1020–1029. [Google Scholar] [CrossRef]
- Lipskaia, L.; Hadri, L.; Prince, P.L.; Esposito, B.; Atassi, F.; Liang, L.; Glorian, M.; Limon, I.; Lompre, A.M.; Lehoux, S.; et al. SERCA2a gene transfer prevents intimal proliferation in an organ culture of human internal mammary artery. Gene Ther. 2013, 20, 396–406. [Google Scholar] [CrossRef] [PubMed]
- Tainaka, K.; Kuno, A.; Kubota, S.I.; Murakami, T.; Ueda, H.R. Chemical principles in tissue clearing and staining protocols for whole-body cell profiling. Annu. Rev. Cell Dev. Biol. 2016, 32, 713–741. [Google Scholar] [CrossRef] [PubMed]
- Lee, E.; Kim, H.J.; Sun, W. See-Through technology for biological tissue: 3-Dimensional visualization of macromolecules. Int. Neurourol. J. 2016, 20, S15–S22. [Google Scholar] [CrossRef] [PubMed]
- Fuchs, J.; Dell’Atti, D.; Buhot, A.; Calemczuk, R.; Mascini, M.; Livache, T. Effects of formamide on the thermal stability of DNA duplexes on biochips. Anal. Biochem. 2010, 397, 132–134. [Google Scholar] [CrossRef]
- Olive, P.L.; Banath, J.P.; Fjell, C.D. DNA strand breakage and DNA structure influence staining with propidium iodide using the alkaline comet assay. Cytometry 1994, 16, 305–312. [Google Scholar] [CrossRef]
- Lasagni, A.; Yuan, D.; Shao, P.; Das, S. Rapid fabrication of biocompatible hydrogels microdevices using laser interference lithography. In Proceedings of the Bioengineered and Bioinspired Systems IV, Dresden, Germany, 20 May 2009; p. 73650I. [Google Scholar]
- Jayaramudu, T.; Raghavendra, G.M.; Varaprasad, K.; Reddy, G.V.S.; Reddy, A.B.; Sudhakar, K.; Sadiku, E.R. Preparation and characterization of poly(ethylene glycol) stabilized nano silver particles by a mechanochemical assisted ball mill process. J. Appl. Polym. Sci. 2016, 133. [Google Scholar] [CrossRef]
- Nguyen, H.N.; Ha, P.T.; Nguyen, A.S.; Nguyen, D.T.; Do, H.D.; Thi, Q.N.; Thi, M.N.H. Curcumin as fluorescent probe for directly monitoring in vitro uptake of curcumin combined paclitaxel loaded PLA-TPGS nanoparticles. Adv. Nat. Sci. Nanosci. Nanotechnol. 2016, 7, 025001. [Google Scholar] [CrossRef]
- Dias, D.R.; Moreira, A.F.; Correia, I.J. The effect of the shape of gold core–mesoporous silica shell nanoparticles on the cellular behavior and tumor spheroid penetration. J. Mater. Chem. 2016, 4, 7630–7640. [Google Scholar] [CrossRef]
- Alves, C.G.; de Melo-Diogo, D.; Lima-Sousa, R.; Costa, E.C.; Correia, I.J. Hyaluronic acid functionalized nanoparticles loaded with IR780 and DOX for cancer chemo-photothermal therapy. Eur. J. Pharm. Biopharm. 2019, 137, 86–94. [Google Scholar] [CrossRef]
- De Sampaio, P.C.; Auslaender, D.; Krubasik, D.; Failla, A.V.; Skepper, J.N.; Murphy, G.; English, W.R. A heterogeneous in vitro three dimensional model of tumour-stroma interactions regulating sprouting angiogenesis. PLoS ONE 2012, 7, e30753. [Google Scholar] [CrossRef]
- Wei, B.; Han, X.-Y.; Qi, C.-L.; Zhang, S.; Zheng, Z.-H.; Huang, Y.; Chen, T.-F.; Wei, H.-B. Coaction of spheroid-derived stem-like cells and endothelial progenitor cells promotes development of colon cancer. PLoS ONE 2012, 7, e39069. [Google Scholar] [CrossRef] [PubMed]
- Barros, A.S.; Costa, E.C.; Nunes, A.S.; de Melo-Diogo, D.; Correia, I.J. Comparative study of the therapeutic effect of Doxorubicin and Resveratrol combination on 2D and 3D (spheroids) cell culture models. Int. J. Pharm. 2018, 551, 76–83. [Google Scholar] [CrossRef] [PubMed]


| Spheroid’s Analysis | No Clearing | ClearT | ClearT2 | ||||
|---|---|---|---|---|---|---|---|
| Static | Horizontal Agitation | Rotatory Agitation | Static | Horizontal Agitation | Rotatory Agitation | ||
| Spheroids’ size (µm) | 399.04 ± 39.26 | 473.23 ± 63.24 | 469.90 ± 83.18 | 447.21 ± 13.71 | 478.91 ± 67.10 | 464.77 ± 42.24 | 474.91 ± 33.43 |
| Spheroids’ transparency | None | Moderate | High | Very high | Moderate | High | Very High |
| PI fluorescence (%) a | 100 ± 22.94 | 104.86 ± 39.14 | 81.71 ± 47.79 | 59.26 ± 10.38 | 92.,65 ± 52.56 | 152.12 ± 33.48 | 186.93 ± 64.25 |
| PI imaging depth in the Z-axis (µm) | 160.45 ± 16.80 | 197.14 ± 42.71 | 208.33 ± 19.92 | 223.89 ± 37.40 | 206.82 ± 23.05 | 214.38 ± 11.48 | 250.77 ± 16.69 |
| PI cross-imaging depth at 100 µm in the Z-axis (%) a | 100.00 ± 10.66 | 122.12 ± 13.48 | 157.80 ± 18.17 | 183.79 ± 40.14 | 124.58 ± 26.86 | 143.00 ± 15.32 | 155.43 ± 31.74 |
Publisher’s Note: MDPI stays neutral with regard to jurisdictional claims in published maps and institutional affiliations. |
© 2020 by the authors. Licensee MDPI, Basel, Switzerland. This article is an open access article distributed under the terms and conditions of the Creative Commons Attribution (CC BY) license (http://creativecommons.org/licenses/by/4.0/).
Share and Cite
Silva, D.N.; Costa, E.C.; Rodrigues, C.F.; de Melo-Diogo, D.; Correia, I.J.; Moreira, A.F. Influence of ClearT and ClearT2 Agitation Conditions in the Fluorescence Imaging of 3D Spheroids. Int. J. Mol. Sci. 2021, 22, 266. https://doi.org/10.3390/ijms22010266
Silva DN, Costa EC, Rodrigues CF, de Melo-Diogo D, Correia IJ, Moreira AF. Influence of ClearT and ClearT2 Agitation Conditions in the Fluorescence Imaging of 3D Spheroids. International Journal of Molecular Sciences. 2021; 22(1):266. https://doi.org/10.3390/ijms22010266
Chicago/Turabian StyleSilva, Daniel N., Elisabete C. Costa, Carolina F. Rodrigues, Duarte de Melo-Diogo, Ilídio J. Correia, and André F. Moreira. 2021. "Influence of ClearT and ClearT2 Agitation Conditions in the Fluorescence Imaging of 3D Spheroids" International Journal of Molecular Sciences 22, no. 1: 266. https://doi.org/10.3390/ijms22010266
APA StyleSilva, D. N., Costa, E. C., Rodrigues, C. F., de Melo-Diogo, D., Correia, I. J., & Moreira, A. F. (2021). Influence of ClearT and ClearT2 Agitation Conditions in the Fluorescence Imaging of 3D Spheroids. International Journal of Molecular Sciences, 22(1), 266. https://doi.org/10.3390/ijms22010266