Abstract
Hypertrophic cardiomyopathy (HCM) is an inherited disorder of the myocardium, and pathogenic mutations in the sarcomere genes myosin heavy chain 7 (MYH7) and myosin-binding protein C (MYBPC3) explain 60%–70% of observed clinical cases. The heterogeneity of phenotypes observed in HCM patients, however, suggests that novel causative genes or genetic modifiers likely exist. Here, we systemically evaluated RNA-seq data from 28 HCM patients and 9 healthy controls with pathogenic variant identification, differential expression analysis, and gene co-expression and protein–protein interaction network analyses. We identified 43 potential pathogenic variants in 19 genes in 24 HCM patients. Genes with more than one variant included the following: MYBPC3, TTN, MYH7, PSEN2, and LDB3. A total of 2538 protein-coding genes, six microRNAs (miRNAs), and 1617 long noncoding RNAs (lncRNAs) were identified differentially expressed between the groups, including several well-characterized cardiomyopathy-related genes (ANKRD1, FHL2, TGFB3, miR-30d, and miR-154). Gene enrichment analysis revealed that those genes are significantly involved in heart development and physiology. Furthermore, we highlighted four subnetworks: mtDNA-subnetwork, DSP-subnetwork, MYH7-subnetwork, and MYBPC3-subnetwork, which could play significant roles in the progression of HCM. Our findings further illustrate that HCM is a complex disease, which results from mutations in multiple protein-coding genes, modulation by non-coding RNAs and perturbations in gene networks.
1. Introduction
Hypertrophic cardiomyopathy (HCM) is a global, inherited cardiovascular disease that can lead to arrhythmia, heart failure and even sudden cardiac death [1,2]. It is characterized by ventricular hypertrophy (usually the left ventricle), small ventricular cavity, and decreased ventricular diastolic compliance. The prevalence of HCM is estimated at 0.2% of the general population by early echocardiographic studies [2]. The utilization of cardiac magnetic resonance imaging (MRI) and genetic testing has increased recognition and precise clinical diagnosis of HCM [3,4]. Genetic testing, though, has revealed that some mutation carriers do not exhibit obvious clinical symptoms of HCM. It is still possible for a carrier to later demonstrate HCM symptoms and to pass these potentially pathogenic mutations on to offspring [5]. With the use of these more sophisticated technologies, the prevalence of HCM should be modified to 0.5% or even greater [2].
Variants in sarcomere and sarcomere-associated protein genes represent the greatest genetic contributor to HCM cases. Previous studies have shown that pathogenic mutations in myosin heavy chain 7 (MYH7) and cardiac myosin-binding protein C (MYBPC3) account for 60%–70% of identified HCM cases [6]. About 1%–5% of HCM and HCM-like phenotypes can be attributed to pathogenic mutations in other sarcomere protein genes (e.g., TNNT2, TNNI3, TPM1, MYL2, MYL3, ACTC1, and TNNC1) and some non-sarcomere protein genes (e.g., Z-disk and calcium-handling proteins) [6,7].
HCM represents a genetically complex and heterogeneous disease [7]. High throughput sequencing technologies have greatly reduced the cost of genetic testing in familial HCM screening, and numerous disease-causing variants had been identified and archived [8,9,10]. Related individuals carrying an identical mutation in the same gene, may display different HCM phenotypes and experience different clinical outcomes [11], suggesting that novel causative or modifier genes exist or that non-coding RNAs, such as microRNA (miRNA) and long noncoding RNA (lncRNA). Furthermore, the complex HCM phenotype may result, not from monogenic or even digenic perturbation, but from the synergy of a complex gene co-expression network. With our current understanding of cardiomyopathy genetics, genotype–phenotype correlation may not be obvious in HCM patients. Since the genetic modifier and pathway/co-expression perspectives are both possibilities, distinguishing pathogenic genes and variants and establishing clear genotype–phenotype correlations remain challenging.
Previously, Gu et al. [12] generated 37 myocardial RNA-seq data from HCM patients and healthy donors. Their research mainly focused on RNA-seq data quality evaluation, novel lncRNA gene prediction, and differential expression analysis. The results demonstrated that a high-quality dataset was obtained and hundreds of differentially expressed genes (DEGs) were identified between HCM patients and healthy controls. In this study, we systemically analyzed this dataset with a different perspective. This included the identification of functional variants, differentially expressed coding and noncoding genes, and interpretation of their potential functional roles associated with HCM. In addition, we also performed weighted gene co-expression network analysis (WGCNA) and protein–protein interaction (PPI) network analysis to identify a gene network that was associated with HCM clinical traits.
2. Results
2.1. Statistics of RNA-Seq Data
The myocardial RNA-seq included 28 HCM patients and 9 healthy controls. For HCM samples, MYBPC3 mutations were previously identified in 10 samples and MYH7 mutations in eight (Table 1). The other 10 remained genetically undiagnosed (Table 1). The RNA-seq data generated 4.3 billion reads with an average of 116.5 million per sample. After quality control, read mapping, variant calling, and filtering, ~0.75 million variants, including single nucleotide polymorphisms (SNPs) and insertions and deletions (Indels), on average, were identified for each sample. Approximately 34,000 variants were located in exonic regions. The summary statistics of the RNA-seq data are listed in Table 2.

Table 1.
Clinical characteristics of the studied samples [12].
Table 2.
Summary statistics of RNA-seq data.
2.2. Pathogenic Variants and Genes Prioritization
In order to identify the pathogenic variants and genes responsible for the development of HCM, we applied a series of bioinformatics filters to the exonic variants identified in the HCM patients (Figure 1). We identified over 4000 candidate variants that matched our criteria: 1) variants only existed in the HCM patients, 2) variants classified as nonsynonymous, stop-gain, stop-loss, frameshift, or splice altering, 3) variants with minor allele frequency less than 0.01 in human populations, and 4) variants predicted to be deleterious in silicon. In order to further narrow down the candidate lists, we filtered the above variants with the 73-gene HCM panel (Supplementary Data 1). This resulted in a total of 43 potential candidate variants, and 19 genes were prioritized (Figure 2 and Table 3). Therefore, our following analysis and discussions were mainly focused on those 19 genes, and the 4000 candidate variants were also listed in Supplementary Data 2 for review.
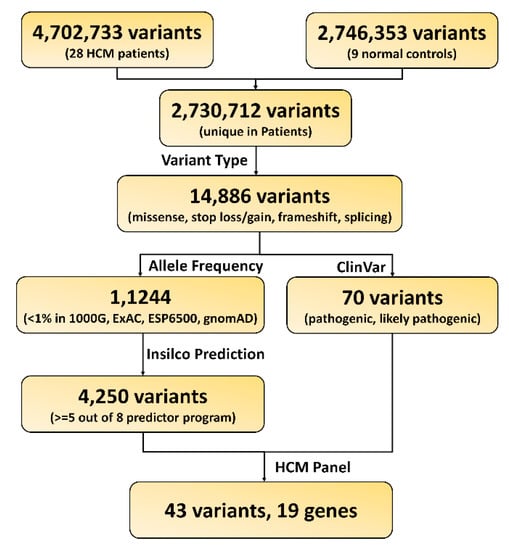
Figure 1.
Workflow for functional variants and gene prioritization.
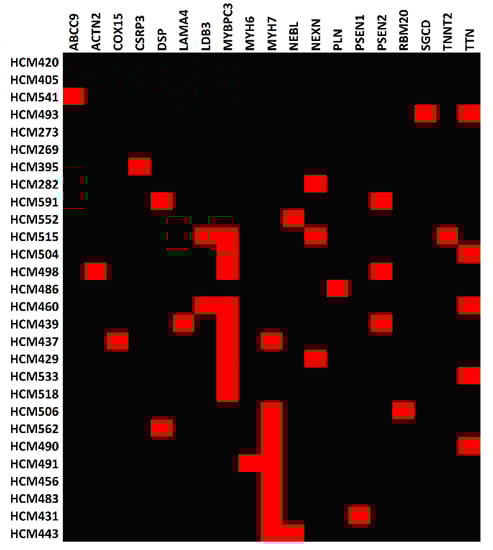
Figure 2.
Heatmap of the pathogenic genes across hypertrophic cardiomyopathy (HCM) patients. Red rectangles represent HCM patients (rows) who carry pathogenic variant(s) in the corresponding gene(s) (columns).
Table 3.
Lists of candidate variants prioritized from HCM patients.
For the 10 patients with previously identified MYBPC3 functional mutations, we found nine MYBPC3 variants (five frameshift variants, three stop-gain variants, and one splicing variant) in nine patients (Figure 2 and Table 3). HCM518 had a MYBPC3 mutation in isolation, and MYBPC3, NEXN, LDB3, and TNNT2 variants were identified in HCM515. For the remaining MYBPC3 HCM samples, variants were also found in the following other cardiomyopathy genes: ACTN2, LAMA4, LDB3, NEXN, PSEN2, TNNT2, and TTN. The remaining patient, HCM486, did not have an identifiable MYBPC3 variant, but an unreported mutation (c.T106C:p.C36R) was found in PLN.
Seven missense MYH7 variants were found in nine samples (Figure 2 and Table 3), with two (HCM456 and HCM483) having a MYH7 mutation in isolation and one (HCM437) possessing MYH7, MYBPC3, and COX15 variants. For the remaining MYH7 HCM samples, variants in the following other cardiomyopathy genes were also found: DSP, MHY6, NEBL, PSEN1, RBM20, and TTN.
We identified eight candidate variants in six genetically undiagnosed patients (Figure 2 and Table 3). These variants include ABCC9 (c.T2935C:p.W979R) in HCM541, SGCD (c.A845G:p.Q282R) and TTN (c.C28730T:p.P9577L) in HCM493, CSRP3 (c.A585C:p.X195C) in HCM395, NEXN (c.C643T:p.R215C) in HCM282, DSP (c.G6119A:p.R2040Q) and PSEN2 (c.G640T:p.V214L) in HCM591, and NEBL (c.G561C:p.Q187H) in HCM552. However, we were unable to identify any variants in the remaining four genetically undiagnosed patients (Figure 2).
2.3. Identification of DEGs between HCM Patients and Healthy Controls
In order to assess the DEGs, we compared gene expression differences between HCM and normal controls by using DEseq2 software. Based on the cut-off threshold (false discovery rate (FDR) < 0.05 and fold change > 1.5), a total of 4161 genes were identified as DEGs (Figure 3A and Supplementary Data 3), of which 2538 are protein-coding genes, 6 are miRNAs, and 1617 are lncRNAs.
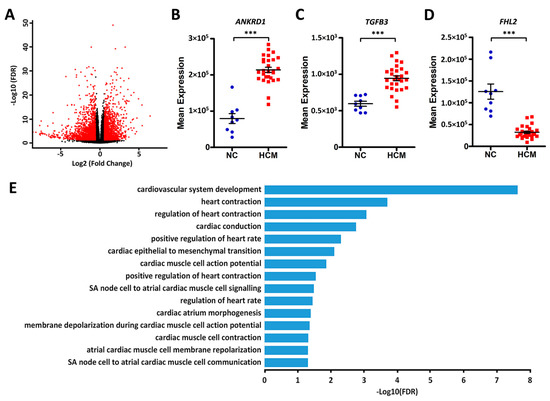
Figure 3.
Differentially expressed protein-coding genes between HCM patients and normal controls. (A) Volcano plot of the differentially expressed genes (DEGs). The x-axes show the log2 transformed fold change, and the y-axes show the log10 transformed false discovery rate (FDR). Red dots are DEGs with an FDR < 0.05 and fold change > 1.5. (B–D) Dot plots of the expression levels of ANKRD1, TGFB3, and FHL2 in normal controls (NC) and HCM patients, ***FDR < 0.001. (E) Bar plots of the significantly enriched cardiovascular-related Gene Ontology (GO) terms for the differentially expressed protein-coding genes.
We did not find any significant expression differences for MYBPC3 and MYH7 between the groups. However, several genes that have been implicated in cardiomyopathy did demonstrate large differences between normal controls and HCM patients, including ANKRD1, FHL2, and TGFB3 (Figure 3B–D). In order to interpret the differentially expressed protein-coding genes, we performed gene over-representation analysis for Gene Ontology (GO) and Kyoto Encyclopedia of Genes and Genomes (KEGG) pathways. The results demonstrated that these genes are largely involved in regulating cardiovascular system development and cardiac physiology. (Figure 3E, Supplementary Data 4). Those terms accounted for 7.6% (192 genes) of the DEGs. Pearson correlation analysis revealed that they are significantly co-expressed, even with a multiple correction threshold FDR < 0.01 (Figure 4 and Supplementary Data 5). In addition to GO biological processes, we also identified several overrepresented KEGG pathways (Supplementary Data 4), including ribosome, cytokine–cytokine receptor interaction, cyclic AMP signaling pathway, and calcium signaling pathways.
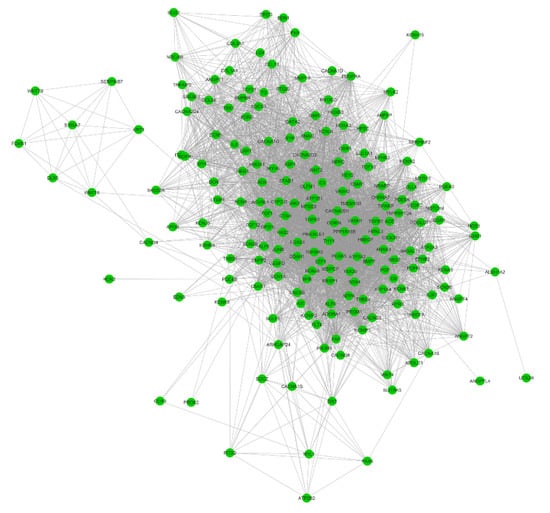
Figure 4.
Correlation networks for the cardiovascular-related differentially expressed protein-coding genes. The Pearson correlation coefficient analysis was calculated across the 192 cardiovascular-related genes. Nodes represent genes, and edges represent correlations between two genes (FDR < 0.01).
There are only six miRNAs that showed significant differences, with miR-487a, miR-654, miR-30d, miR-154, and miR-3193 being downregulated and miR-3671 being upregulated in HCM patients (Figure 5A–F). Among them, miR-30d and miR-154 have been shown to play regulatory roles in myocardial fibrosis [13,14]. Next, their targeting genes were predicted using miRWalk2. A total of 720 differentially expressed protein-coding genes (Supplementary Data 6) were targeted by the above miRNAs, with these genes demonstrating inverse expression patterns compared to their corresponding miRNAs. Among them, 75 are involved in cardiovascular system regulation (Figure 5G). In addition, we also performed the Pearson correlation analysis. The results demonstrated that the percentages of significantly correlated (p < 0.05) candidate pairs ranged from 25.5% (miR-154) to 76.5% (miR-3671).
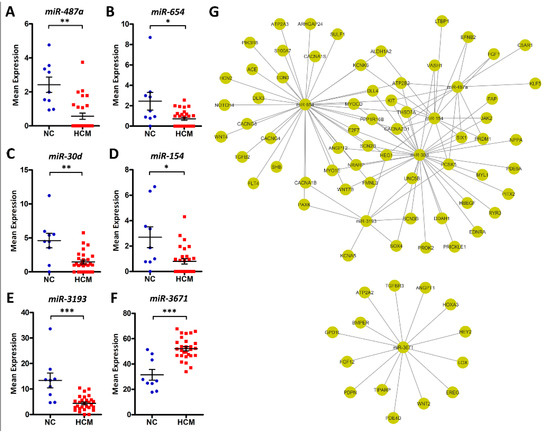
Figure 5.
Differentially expressed microRNAs (miRNAs) between HCM patients and normal controls. (A–F) Dot plots of miR-487a, miR-654, miR-30d, miR-154, miR-3193, and miR-3671 expression levels in NC and HCM patients, *FDR < 0.05, **FDR < 0.01, ***FDR < 0.001. (G) Predicted miRNA-gene pairs with miRWalk2, which implements four miRNA-gene prediction algorithms. Target pairs for which more than two algorithms had signals are included. Seventy-five cardiovascular-related DEGs were targeted by the above miRNAs, with these genes demonstrating inverse expression patterns compared to their corresponding miRNAs.
In order to dissect the functional roles of the differentially expressed lncRNAs, we retrieved a total of 1482 protein-coding genes near (< 0.5 Mb) those lncRNAs (Supplementary Data 7), including cardiomyopathy-related genes: TTN, ACTC1, TPM1, JPH2, ANKRD1, DTNA, TMPO, FHL2, CTNNA3, GATA4, LAMA2, PRDM16, POLG, etc. Further GO enrichment analysis illustrated that these genes are significantly enriched in cardiovascular-related categories (Table 4), including 95 genes involved in cardiovascular system development (GO:0072358), 75 genes related to heart development (GO:0007507), and 31 genes critical to cardiac muscle tissue development (GO:0048738).
Table 4.
GO enrichment of long noncoding RNA (lncRNA)-annotated protein-coding genes.
2.4. Co-Expression Network Analysis
To gain insight into the functional organization of the transcriptomes from myocardial tissue, we conducted gene co-expression network analysis with WGCNA. By applying data transformation and filtration according to the WGCNA pipeline (see the “Materials and Methods” section), 8417 protein-coding genes were used for constructing gene co-expression networks. With the soft-thresholding power β = 12 determined by scale-free topology (Figure 6A,B), we identified a total of 16 modules (Figure 6C). The module size ranged from 50 genes in module M11 to 2207 genes in module M8. In addition, by performing correlation analysis between the module module eigengenes (MEs) and clinical traits (Table 1), several modules were identified to be associated with HCM clinical traits (Figure 6C), including module M14 and M16, which contain MYH7 and MYBPC3, respectively.
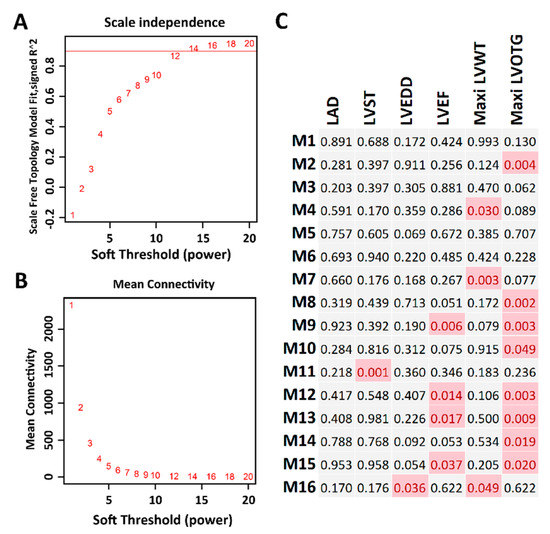
Figure 6.
Co-expression network analysis. (A) The soft thresholding index R2 (y-axis) as a function of the different thresholding power β (x-axis). (B) Mean connectivity (y-axis) as a function of the power β (x-axis). (C) Sixteen co-expression modules identified from the myocardial RNA-seq dataset. Each cell represents the correlation coefficient p-value computed from correlating the module eigengenes to the clinical traits (columns). Cells filled with red represent significant associations between modules and traits (p < 0.05).
2.5. PPI-Subnetwork Analysis for MYH7 and MYBPC3 Modules
Next, we explored the PPIs for the genes in the MHY7- and MYBPC3-involved modules (M14 and M16). By performing MCL clustering, we highlighted four subnetworks that could play significant roles in HCM, including one mtDNA-subnetwork and three cardiomyopathy-gene-centered networks: MYBPC3-, MYH7-, and DSP-subnetworks (Figure 7). Next, we performed Pearson correlation analysis for each subnetwork gene against to the HCM phenotype. This identified half of them (18 out of 39 genes), showing significant correlations (p < 0.05) with the measured phenotypes (Supplementary Data 8), including NDUFS2, DSP, JUP, TNNI1, etc. These genes could be directly associated with the phenotypes, while the rest may modulate the HCM phenotypes by interacting with those 18 genes.
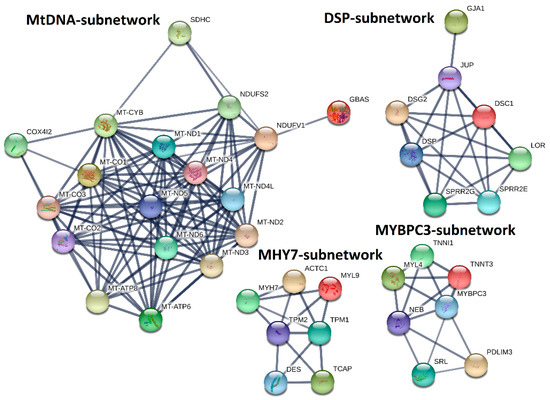
Figure 7.
MtDNA-, DSP-, MYH7-, and MYBPC3-subnetworks constructed by integrating co-expression and protein–protein interaction (PPI) network analyses. MHY7- and MYBPC3-involved co-expression modules (M14 and M16) identified by co-expression analysis were used to construct PPI-subnetworks from the STRING database (https://string-db.org/) with the Markov Cluster (MCL) clustering method, for which the inflation parameter was set to 3.
Besides the subnetwork hub genes, other genes were also found to be associated with cardiomyopathy. For instance, TPM1, and ACTC1, which are critical for the maintenance of sarcomere thickness [15,16], have been associated with familial HCM [17,18,19]. Truncating mutations in DES are associated with inherited skeletal and cardiac myopathies [20]. TCAP is required for sarcomerogenesis in striated muscles, and mutations in TCAP have been identified in patients with HCM and dilated cardiomyopathy (DCM) [21]. Patients with heterozygous mutations in JUP have been diagnosed with HCM [22,23], and reduced cardiac DSG2 levels appear to be specifically associated with arrhythmogenic right ventricular cardiomyopathy (ARVC) [24]. For the mtDNA-subnetwork, mutations of MT-ND1, MT-ND2, MT-ND3, MT-ND4, MT-ND4L, MT-ND5, MT-ND6, MT-CO1, MT-CO2, MT-CO3, MT-ATP6, MT-ATP8, and MT-CYB have been identified in cardiomyopathy patients [25,26,27,28]. Levels of NDUFV1, a component of complex I in the electron transport chain, are significantly decreased in the myocardium of DCM patients, and NDUFS2 gene mutations cause complex I deficiency with associated DCM [29,30].
3. Discussion
3.1. Pathogenic Variant Analysis and Mechanisms of Variant Synergism
In the current study, nine HCM patients were identified with pathogenic MYH7 variants and nine with pathogenic MYBPC3 variants. One patient (HCM437) had both MYH7 and MYBPC3 variants, along with one in COX15, whose function appears to be essential for cytochrome c oxidase (COX) biogenesis in the electron transport chain (ETC). Mutations in this gene are associated with Leigh syndrome and COX deficiency with infantile HCM, and the presence of this variant is interesting in the context of the enriched mitochondrial PPI-subnetwork (Figure 7) [31]. All of the MYH7 mutations were missense variants, while the MYBPC3 mutations were frameshift, nonsense, or splice variants. Missense, rather than truncating, variants in MYH7 and truncating, rather than missense, variants in MYBPC3 are well-documented to be the mutational classifications associated with HCM, instead of other cardiomyopathy subtypes [32,33].
A single variant in NEXN, MYH7, NEBL, and DSP was replicated in three, two, two, and two HCM patients, respectively. Importantly, the NEXN and DSP variants have been predominantly classified as “likely benign” within the NCBI ClinVar database; the NEBL mutation is described as a variant of uncertain significance. For patients HCM282 and HCM552, the NEXN and NEBL variants, respectively, occur in isolation, which may mean that the phenotype results from the presence of these variants in conjunction with unidentified modifier variants. The NEBL variant has been found in isolation in one Japanese patient with DCM and in conjunction with another cardiomyopathy-associated variant in a Japanese HCM patient [34].
Both of the patients with the DSP variant (HCM562 and HCM591) have another cardiomyopathy gene identified. Desmoplakin, which is encoded by DSP, is a desmosomal plaque protein, and variants in this gene are implicated in ARVC [35]. PSEN2 mutations, like the one in HCM591, have been reported in association with familial Alzheimer’s disease and DCM, but not HCM, and those associated with DCM impair calcium signaling and handling [36]. The presenilin complex proteolytically processes desmoglein-2 (DSG2), another component of the desmosome, and protein networks implicate gene–gene interactions between the presenilin components and a number of desmosomal proteins, including desmoplakin [37]. This provides a mechanism for how these variants may operate synergistically to produce HCM, and the DSP variant may be a pro-HCM modifier gene. Overall, the NEXN, NEBL, and DSP mutations may represent important modifier variants, as they are disproportionately represented in this sample population.
The remaining patients without an identified pathogenic MYBPC3 or MYH7 variant had mutations in ABCC9, SGCD, TTN, CSRP3, and PLN. Variants in ABCC9, which encodes an ATP-sensitive K+ channel, have been implicated in familial atrial fibrillation, sporadic DCM, and hypertrichotic osteochondrodysplasia. DCM variants have been described in exon 38 and likely modify a nucleotide-binding domain in the SUR2A portion of the channel, altering overall channel gating [38]. HCM541′s variant in ABCC9 is found in exon 24, which corresponds to the SunT domain of the protein (not a transmembrane region), and may represent an HCM mutational hotspot.
SGCD encodes the δ component of the sarcoglycan complex, and mutations in this gene are associated with autosomal recessive limb-girdle muscular dystrophy type VI and a mild autosomal dominant DCM phenotype [39,40]. The sarcoglycan complex interacts with the dystrophin complex, which is in turn composed of dystrophin and dystroglycan subunits. The disruption of sarcoglycan components has been linked with a reduced expression of α-dystroglycan at the sarcolemma, and overall dystroglycan knockout has been associated with disruptions in titin expression [41]. Encoded by TTN, titin maintains the structure of the sarcomeric unit in both skeletal and cardiac muscle during contraction and interacts with actin filaments and myosin [42]. While both of the variants identified in HCM493 are categorized as “likely benign”. The SGCD mutation may further disrupt titin networks that are already disorganized by the TTN variant itself and thus work synergistically to produce HCM.
CSRP3 encodes an LIM domain-containing scaffolding protein that maintains the structure of the Z-disk and the costamere and is implicated in actin remodeling and cardiomyocyte differentiation. Mutations in this gene are associated with both familial HCM and DCM [43,44]. HCM395′s unique mutation has not been reported previously. This stop-loss variant extends the protein by 33 amino acids. A similar variant that converts the termination codon to an arginine residue (rather than a cysteine residue) and promotes a 33 amino acid extension has been labeled as a variant of uncertain significance. Further studies are needed to determine if these additional residues alter protein function, structure, and/or the rate of degradation.
Produced by PLN, phospholamban is a substrate of protein kinase A (PKA), a cAMP dependent kinase, in cardiomyocytes. The phosphorylation of phospholamban by PKA relieves its inhibition of ATP2A2, a sarcoplasmic reticulum Ca2+-ATPase, allowing for the sequestration of calcium ions and cardiac muscle relaxation in diastole [45,46]. Heterozygous PLN variants, like the unreported one found in HCM486, have been identified in patients with HCM; the PLN inheritance pattern for DCM is less clear [46,47]. Interestingly, this gene participates in both cAMP and calcium signalling pathways, reflecting the significant KEGG pathway enrichment mentioned above (Supplementary Data 4).
3.2. HCM Phenotypic Variability from Multi-Gene Modification and Differential Gene Expression
While HCM has been attributed to monogenic perturbations in sarcomeric genes, like MYBPC3 and MYH7, there is often dramatic phenotypic variability, even within a single family, with some family members having other cardiomyopathy subtypes, including DCM and ARVC, or hybrid phenotypes. This variability is most likely attributable to the presence of multiple modifier variants, and hints at the concept that cardiomyopathy is a polygenic trait.
Beyond the single gene and synergistic modifier gene perspectives, pathway perspectives illustrate the idea that even single gene mutations may in turn modify other genes in a specific pathway or network. The differences in expression levels of ANKRD1, FHL2, and TGFB3 between the HCM patients and normal controls demonstrated this idea. Mutations in FHL2 have been implicated in HCM, so the reduced expression of these genes in HCM hearts mirrors actual inherited modifications or deficiencies in these proteins [48,49,50]. Other studies have demonstrated that the elevation of ANKRD1 expression in DCM heart samples correlates with the progression of heart failure, and this reflects the increased expression that we saw in the HCM patients [51]. Finally, HCM is characterized by cardiac fibrosis, and TGFB3 is an important driver of the fibrosing process [52]. This is illustrated in the elevation of TGFB3 expression in our HCM samples; likewise, missense TGFB3 mutations have loosely been associated with HCM itself [53].
3.3. HCM Modulation with Noncoding RNAs
As post-transcriptional regulators, both miRNAs and lncRNAs can interfere with gene expression [54,55]. We explored the miRNA and lncRNA expression profiles of HCM patients and healthy controls. Six miRNAs (miR-487a, miR-654, miR-30d, miR-154, miR-3193 and miR-3671) were observed to be significantly up- or down-regulated in HCM patients. Among them, Serum miR-30d has been reported to be associated with acute heart failure [56] and considered as a biomarker for diffuse myocardial fibrosis in HCM patients [13]. In addition, the expression of miR-30d-5p was decreased 1.58-fold in patients with ST-elevated myocardial infarction [57]. MiR-154 has been reported to promote myocardial fibrosis through β-catenin signaling pathways [14,58]. It is worth noting that the 75 targeted genes in the miRNA-gene network (Figure 5G) are all involved in the cardiovascular system, suggesting those miRNAs may modulate cardiac function by regulating their expression levels. For example, the target gene FGF1, known as acidic fibroblast growth factor, shares regulation by miR-487a and miR-154. A pathophysiologic role for fibroblast growth factors in idiopathic cardiomyopathy has been implicated in the past [59]. Additionally, several voltage-gated calcium channels genes (CACNA2D1, CACNA1B, CACNA1S, CACNG4, and CACNG8) are also targeted by those miRNAs. It has been reported that mutations in CACNA2D1 cause a variant of short QT syndrome, which is associated with sudden cardiac death in humans [60].
Several studies have demonstrated the importance of lncRNAs in the cardiovascular system [61,62]. We retrieved a total of 1482 protein-coding genes near the differentially expressed lncRNAs. A few lncRNAs are located in the introns of cardiomyopathy-related genes (e.g., TTN, ACTC1, TPM1, JPH2, ANKRD1, DTNA, TMPO, and FHL2) or physically close to these genes. The lncRNA-annotated protein-coding genes are enriched in the GO terms of heart development and cardiomyocyte differentiation (Table 4), while the enriched terms for the differentially expressed protein-coding genes centered more so on cardiac physiology (contractility, heart rate, and conduction; Figure 3E). This illustrates the idea that HCM can represent both an inherited defect in myocardial development (that may or may not be immediately clinically apparent) and a pathologic process of ventricular remodeling that occurs over an extended period of time due to impaired cardiac, or even renal, function.
3.4. HCM Modulation with Gene Networks
Differential expression analysis usually focuses on individual gene perturbations, which cannot dissect their potential interactions. Furthermore, genes with relatively modest expression changes may also contribute to the phenotypes of interest. However, this information was usually underestimated or missed from differential expression analysis. Network-based analysis provides an alternative way to leverage this gap by grouping a subset of tightly co-expressed genes together, which can be defined as a module or network. In this study, we performed gene co-expression network analysis with WGCNA and PPI analysis with STRING. Our results highlighted four subnetworks, mtDNA-, MYBPC3-, MYH7-, and DSP-subnetworks, that may be critical to the progression of HCM. Besides the hub genes of MYBPC3, MYH7, and DSP, these subnetworks also include several genes that have been implicated in cardiomyopathy, such as TPM1, ACTC1 [17,18,19], DES [20], TCAP [21], JUP [22,23], and DSG2 [24].
In addition, our gene network analysis also highlighted the importance of mitochondrial genes (mtDNA-subnetwork) in HCM. However, those genes are largely neglected on HCM genetic screening panels. Mutations in sarcomeric genes are associated with inefficient energy utilization [63]. When these variants are present in conjunction with heterozygous oxidative phosphorylation mutations, compensations in energy production may not be possible and may contribute to the HCM phenotypes. This will require further elucidation, but screening for these genes may aid in the identification of a genetic cause of HCM in patients with mutations not included on typical HCM panels and can supplement the landscape of genetic modifiers in HCM.
3.5. Novelty and Limitations of This Study
As the original research of this RNA-seq data [12] was reported as data descriptor, with the major findings of this dataset is to be of high quality to perform downstream analysis such as the identification of DEGs. Compared with the original findings, our research highlighted several novel findings. First, we performed a variant calling from this RNA-seq data, our results not only confirmed the MYH7 and MYBPC3 pathogenic variants that have been identified in the original research, but also discovered eight candidate variants in six genetically undiagnosed patients. In addition, we also found most of the patients carry muti-genic variants, even for the MYH7 and MYBPC3 diagnosed patients, suggesting that a heterogeneous phenotype could exist among those patients. Second, we identified thousands of differentially expressed coding and noncoding genes. For the coding genes, we performed functional enrichment analysis, which highlighted that those genes significantly involved in regulating cardiovascular system development and cardiac physiology (192 genes, Figure 4). We found six differentially expressed miRNAs (Figure 5A–F) that could regulate HCM progression by targeting 75 cardiovascular-function-related genes (Figure 5G). Additionally, by co-locating the differentially expressed lncRNAs and protein-coding genes, we highlighted that several lncRNAs could relate to cardiac function, since they are co-located with the well-known cardiomyopathy-related genes (Table 3). Therefore, our analysis not only identified the DEGs, but also reduced the candidates from thousands of DEGs to a few dozen by integrating no-coding gene annotation and gene function enrichment analysis. Last, we performed gene network analysis based on WGCNA and PPI. This resulted in four subnetworks that are strongly correlated to the HCM clinical traits (Figure 6 and Figure 7). Those subnetworks not only include known genes implicated in HCM, but also highlighted several genes with an unknown function in HCM that need to be further deciphered (Figure 7).
There are several limitations for our studies. First, calling variants from RNA-seq is confronted with several issues, due to the complexity of the transcriptome. In order to avoid false positives/negatives, we applied SNP and Indel calling with the recommendation of the Broad Institute’s GATK best practices workflow. In addition, for the candidate variants, we also “eye” inspected the alignment to avoid false positive/negatives raised by too much complexity around the variant region. Further, our results confirmed the MYH7 and MYBPC3 pathogenic variants that have been identified in the original paper, highlighting the variant-calling pipeline and that the results are reliable. Second, the clinical measurement of the studied sample is not fully characterized (such as morphological or magnetic resonance imaging data). This limited our genotype–phenotype correlations, especially for evaluating the clinical outcome differences between the patients carry muti-genic and single gene mutation. Third, the larger sample size would be beneficial for covering broader variants’ spectrum and increase the statistical power for differential expression analysis and gene co-expression network construction.
4. Materials and Methods
4.1. RNA-Seq Data
The RNA-seq data of SRP186138 [12] were downloaded from the NCBI Sequence Read Archive database (https://www.ncbi.nlm.nih.gov/sra/SRP186138). This data set contains 28 myocardial samples from HCM patients and 9 samples from healthy donors. The detailed clinical characteristics of the studied samples are listed in Table 1.
4.2. Read Mapping and Variant Calling
The raw reads for each sample first underwent adaptor trimming and filtering with the fastp software [64], allowing for reads containing over 80% bases with a quality greater than 20 to be included. Read mapping and variant calling were done according to the Broad Institute’s GATK [65] best practices workflow for SNP and Indel calling on RNAseq data (https://software.broadinstitute.org/gatk/documentation/article.php?id=3891). Briefly, paired-end reads (PE300) were mapped onto the human reference genome (GRCh38) using the STAR 2-pass alignment method [66]. The first-pass alignment was used to generate the junction file. Then, the second-pass alignment was conducted with the junctions found in the first-pass mapping to produce the final alignments. After that, Picardtools (http://broadinstitute.github.io/picard/) was used to add read groups, sort, mark duplicates, and create index. Then, the SplitNCigarReads function, implemented in GATK, was used to split reads into exon segments. Finally, variant calling and filtering were done with HaplotypeCaller and VariantFiltration, respectively.
4.3. Functional Variants and Gene Prioritization
The variant call was first annotated with wANNOWAR [67]. Then, the following strategies were applied to identify potential functional variants and genes: 1) variants only present in the 28 HCM patients, but not in the 9 controls; 2) variants classified as nonsynonymous, stop-gain, stop-loss, frameshift, or splice altering; 3) variants with a minor allele frequency less than 0.01 in 1000G, ExAC, ESP6500, or gnomeAD data sets; 4) variants predicted to be deleterious by no less than five of the following algorithms—SIFT, Polyphen2, LRT, MutationTaster, FATHMM, PROVEAN, MetaSVM, and CADD, and 5) variants only in the 73-gene HCM panel listed in Supplementary Data 1.
4.4. Differential Expression Analysis
A comparison of HCM patients with normal controls was used to identify differentially expressed genes (DEGs). Gene-level read counts were obtained using featureCount version 0.6.1 with Ensembl annotation of the GRCh38 reference genome, which includes both coding and non-coding genes. Raw counts were analyzed with DESeq2 version 1.10.1 [68] to identify DEGs. p-values were adjusted with the false discovery rate (FDR) based on Benjamini and Hochberg’s method [69], and DEGs were defined as FDR < 0.05 and fold change > 1.5.
4.5. MiRNA Target Prediction
MiRNAs are a class of non-coding small RNAs (~22 nucleotides), which are widely found in plant and animal cells. Cleavage of mRNA transcripts or the inhibition of translation initiation is achieved by inaccurate complementary base pairing with the target gene [70]. To date, several algorithms have been proposed and applied to predict miRNAs targets [71]. In this study, we used miRWalk 2 [72], which implements the four miRNA-gene prediction programs “miRWalk,” “miRanda”, “RNA22”, and “Targetscan” to predict miRNA gene targets. We considered the positive target pairs for which more than two algorithms had signals.
4.6. LncRNA Annotation
LncRNAs are a class of non-coding RNAs that are greater than 200 nucleotides in length [73]. Although most of them have not been functionally characterized, studies have shown that they play significant roles in gene expression regulation, especially for neighboring genes, at various levels, such as transcriptional and post-transcriptional regulation [73,74]. In order to interpret the potential functional roles of the differentially expressed lncRNAs, their neighbor genes (< 0.5 Mb) were extracted using bedtools [75] and further explored by performing gene set enrichment analysis.
4.7. Co-Expression Network Analysis
Gene co-expression networks was constructed using the WGCNA package in R [76], according to the tutorials written by Peter Langfelder and Steve Horvath (https://horvath.genetics.ucla.edu/html/CoexpressionNetwork/Rpackages/WGCNA/Tutorials/). We first normalized the raw read count with the Transcripts Per Million (TPM) method and then removed genes whose expression was consistently low (TPM < 10 in more than 90% of the samples). The filtered data was log-transformed with log2(x+1), which was used as input for WGCNA analysis. Based on the scale-free topology, threshold power β = 5 was used for constructing the adjacency matrix and the Topological Overlap Matrix. Then, genes were aggregated into modules with hierarchical clustering and further refined using the dynamic tree cut algorithm. In order to identify the clinical-trait-associated modules, we performed Pearson’s correlation coefficient analysis between the traits and MEs, which are defined as the first principal component of a given module.
4.8. PPI Network Analysis
The PPI network analysis of module genes was based on the protein interaction information retrieved from the online database STRING (https://string-db.org/) [77]. To define subnetworks, we first only selected genes with a high confidence interaction score (> 0.7). Those highly confident interactions were further clustered into subnetworks with the MCL clustering method, for which the inflation parameter was set to 3.
4.9. Gene Over-Representation Analysis
Gene overrepresentation analysis for GO (biological process) and KEGG pathway was analyzed with WebGestalt (http://www.webgestalt.org/) with default parameters [78]. The human genome was used as a reference gene set, and the minimum number of genes for a category was set to 5 for both analyses. The Benjamini and Hochberg correction [69] was used for multiple test correcting. A threshold of FDR < 0.05 was used to determine the significantly enriched terms.
4.10. Data Statement
Raw RNA-seq data had been deposited in the NCBI Sequence Read Archive database (SRA; https://www.ncbi.nlm.nih.gov/sra/) under the accession number SRP186138 [12].
5. Conclusions
In summary, by analyzing myocardial RNA-seq data from HCM and control patients, we provide evidence that HCM is a complex genetic disorder, with pathogenic and modifier protein-coding mutations, differential gene expression, and non-coding RNA modulation contributing to extensive phenotypic variability. In addition, this work highlights the importance of integrative analysis with gene co-expression and protein–protein interaction networks for the further identification of functional HCM genes within gene subnetworks. Further elucidation of HCM genes, whether at the level of the single protein-coding gene or the gene network, will lead to improvements in genetic screening for HCM patients without an identified genetic cause and to the development of new, personalized therapeutics.
Supplementary Materials
Supplementary Materials can be found at https://www.mdpi.com/1422-0067/21/9/3040/s1.
Author Contributions
F.X. conceived the study. J.G. and F.X. performed data analysis. J.G., J.C., M.W., F.S. and F.X. wrote and edited the manuscript. All authors have read and agreed to the published version of the manuscript.
Funding
This research received no external funding.
Conflicts of Interest
The authors declare no conflict of interest.
Abbreviations
| ARVC | arrhythmogenic right ventricular cardiomyopathy |
| DCM | dilated cardiomyopathy |
| DEG | differentially expressed gene |
| FDR | false discovery rate |
| GO | Gene Ontology |
| HCM | hypertrophic cardiomyopathy |
| Indel | insertion and deletion |
| KEGG | Kyoto Encyclopedia of Genes and Genomes |
| LncRNA | long noncoding RNA |
| MEs | module eigengenes |
| MiRNA | microRNA |
| NC | Normal control |
| PPI | protein-protein interaction |
| SNP | single nucleotide polymorphism |
| TPM | transcripts per million |
| WGCNA | weighted gene co-expression network analysis. |
References
- Maron, B.J.; Maron, M.S. Hypertrophic cardiomyopathy. Lancet 2013, 381, 242–255. [Google Scholar] [CrossRef]
- Semsarian, C.; Ingles, J.; Maron, M.S.; Maron, B.J. New perspectives on the prevalence of hypertrophic cardiomyopathy. J. Am. Coll. Cardiol. 2015, 65, 1249–1254. [Google Scholar] [CrossRef] [PubMed]
- Maron, M.S. Clinical utility of cardiovascular magnetic resonance in hypertrophic cardiomyopathy. J. Cardiovasc. Magn. Reson. 2012, 14, 13. [Google Scholar] [CrossRef] [PubMed]
- Lopes, L.R.; Rahman, M.S.; Elliott, P.M. A systematic review and meta-analysis of genotype–phenotype associations in patients with hypertrophic cardiomyopathy caused by sarcomeric protein mutations. Heart 2013, 99, 1800–1811. [Google Scholar] [CrossRef]
- Jensen, M.K.; Havndrup, O.; Christiansen, M.; Andersen, P.S.; Diness, B.; Axelsson, A.; Skovby, F.; Køber, L.; Bundgaard, H. Penetrance of hypertrophic cardiomyopathy in children and adolescents: A 12-year follow-up study of clinical screening and predictive genetic testing. Circulation 2013, 127, 48–54. [Google Scholar] [CrossRef]
- Akhtar, M.; Elliott, P. The genetics of hypertrophic cardiomyopathy. Glob. Cardiol. Sci. Pract. 2018, 36, 1–9. [Google Scholar]
- Sabater-Molina, M.; Pérez-Sánchez, I.; Hernández del Rincón, J.; Gimeno, J. Genetics of hypertrophic cardiomyopathy: A review of current state. Clin. Genet. 2018, 93, 3–14. [Google Scholar] [CrossRef]
- Lopes, L.R.; Syrris, P.; Guttmann, O.P.; O’Mahony, C.; Tang, H.C.; Dalageorgou, C.; Jenkins, S.; Hubank, M.; Monserrat, L.; McKenna, W.J. Novel genotype–phenotype associations demonstrated by high-throughput sequencing in patients with hypertrophic cardiomyopathy. Heart 2015, 101, 294–301. [Google Scholar] [CrossRef]
- Forleo, C.; D’Erchia, A.M.; Sorrentino, S.; Manzari, C.; Chiara, M.; Iacoviello, M.; Guaricci, A.I.; De Santis, D.; Musci, R.L.; La Spada, A. Targeted next-generation sequencing detects novel gene–phenotype associations and expands the mutational spectrum in cardiomyopathies. PLoS ONE 2017, 12, e0181842. [Google Scholar] [CrossRef]
- Burns, C.; Bagnall, R.D.; Lam, L.; Semsarian, C.; Ingles, J. Multiple gene variants in hypertrophic cardiomyopathy in the era of next-generation sequencing. Circ. Cardiovasc. Genet. 2017, 10, e001666. [Google Scholar] [CrossRef]
- Jacoby, D.; McKenna, W.J. Genetics of inherited cardiomyopathy. Eur. Heart J. 2012, 33, 296–304. [Google Scholar] [CrossRef] [PubMed]
- Liu, X.; Ma, Y.; Yin, K.; Li, W.; Chen, W.; Zhang, Y.; Zhu, C.; Li, T.; Han, B.; Liu, X. Long non-coding and coding RNA profiling using strand-specific RNA-seq in human hypertrophic cardiomyopathy. Sci. Data 2019, 6, 1–7. [Google Scholar] [CrossRef] [PubMed]
- Fang, L.; Ellims, A.H.; Moore, X.-l.; White, D.A.; Taylor, A.J.; Chin-Dusting, J.; Dart, A.M. Circulating microRNAs as biomarkers for diffuse myocardial fibrosis in patients with hypertrophic cardiomyopathy. J. Transl. Med. 2015, 13, 314. [Google Scholar] [CrossRef] [PubMed]
- Dong, P.; Liu, W.; Wang, Z. MiR-154 promotes myocardial fibrosis through beta-catenin signaling pathway. Eur. Rev. Med Pharmacol. Sci. 2018, 22, 2052–2060. [Google Scholar] [PubMed]
- Bos, J.M.; Poley, R.N.; Ny, M.; Tester, D.J.; Xu, X.; Vatta, M.; Towbin, J.A.; Gersh, B.J.; Ommen, S.R.; Ackerman, M.J. Genotype–phenotype relationships involving hypertrophic cardiomyopathy-associated mutations in titin, muscle LIM protein, and telethonin. Mol. Genet. Metab. 2006, 88, 78–85. [Google Scholar] [CrossRef] [PubMed]
- Ramirez, C.; Padron, R. Familial hypertrophic cardiomyopathy: Genes, mutations and animal models. A Review. Investig. Clin. 2004, 45, 69–99. [Google Scholar]
- Richard, P.; Charron, P.; Carrier, L.; Ledeuil, C.; Cheav, T.; Pichereau, C.; Benaiche, A.; Isnard, R.; Dubourg, O.; Burban, M. Hypertrophic cardiomyopathy: Distribution of disease genes, spectrum of mutations, and implications for a molecular diagnosis strategy. Circulation 2003, 107, 2227–2232. [Google Scholar] [CrossRef]
- Morita, H.; Rehm, H.L.; Menesses, A.; McDonough, B.; Roberts, A.E.; Kucherlapati, R.; Towbin, J.A.; Seidman, J.; Seidman, C.E. Shared genetic causes of cardiac hypertrophy in children and adults. N. Engl. J. Med. 2008, 358, 1899–1908. [Google Scholar] [CrossRef]
- Gupte, T.M.; Haque, F.; Gangadharan, B.; Sunitha, M.S.; Mukherjee, S.; Anandhan, S.; Rani, D.S.; Mukundan, N.; Jambekar, A.; Thangaraj, K. Mechanistic heterogeneity in contractile properties of α-tropomyosin (TPM1) mutants associated with inherited cardiomyopathies. J. Biol. Chem. 2015, 290, 7003–7015. [Google Scholar] [CrossRef]
- He, Y.; Zhang, Z.; Hong, D.; Dai, Q.; Jiang, T. Myocardial fibrosis in desmin-related hypertrophic cardiomyopathy. J. Cardiovasc. Magn. Reson. 2010, 12, 68. [Google Scholar] [CrossRef]
- Hayashi, T.; Arimura, T.; Itoh-Satoh, M.; Ueda, K.; Hohda, S.; Inagaki, N.; Takahashi, M.; Hori, H.; Yasunami, M.; Nishi, H. Tcap gene mutations in hypertrophic cardiomyopathy and dilated cardiomyopathy. J. Am. Coll. Cardiol. 2004, 44, 2192–2201. [Google Scholar] [CrossRef] [PubMed]
- De Bortoli, M.; Calore, C.; Lorenzon, A.; Calore, M.; Poloni, G.; Mazzotti, E.; Rigato, I.; Marra, M.P.; Melacini, P.; Iliceto, S. Co-inheritance of mutations associated with arrhythmogenic cardiomyopathy and hypertrophic cardiomyopathy. Eur. J. Hum. Genet. 2017, 25, 1165–1169. [Google Scholar] [CrossRef] [PubMed]
- Xu, T.; Yang, Z.; Vatta, M.; Rampazzo, A.; Beffagna, G.; Pillichou, K.; Scherer, S.E.; Saffitz, J.; Kravitz, J.; Zareba, W. Compound and digenic heterozygosity contributes to arrhythmogenic right ventricular cardiomyopathy. J. Am. Coll. Cardiol. 2010, 55, 587–597. [Google Scholar] [CrossRef]
- Vite, A.; Gandjbakhch, E.; Prost, C.; Fressart, V.; Fouret, P.; Neyroud, N.; Gary, F.; Donal, E.; Varnous, S.; Fontaine, G. Desmosomal cadherins are decreased in explanted arrhythmogenic right ventricular dysplasia/cardiomyopathy patient hearts. PLoS ONE 2013, 8, e75082. [Google Scholar] [CrossRef]
- Alila-Fersi, O.; Chamkha, I.; Majdoub, I.; Gargouri, L.; Mkaouar-Rebai, E.; Tabebi, M.; Tlili, A.; Keskes, L.; Mahfoudh, A.; Fakhfakh, F. Co segregation of the m. 1555A> G mutation in the MT-RNR1 gene and mutations in MT-ATP6 gene in a family with dilated mitochondrial cardiomyopathy and hearing loss: A whole mitochondrial genome screening. Biochem. Biophys. Res. Commun. 2017, 484, 71–78. [Google Scholar] [CrossRef]
- Li, Y.Y.; Maisch, B.; Rose, M.L.; Hengstenberg, C. Point mutations in mitochondrial DNA of patients with dilated cardiomyopathy. J. Mol. Cell. Cardiol. 1997, 29, 2699–2709. [Google Scholar] [CrossRef]
- Pacheu-Grau, D.; Bareth, B.; Dudek, J.; Juris, L.; Vögtle, F.-N.; Wissel, M.; Leary, S.C.; Dennerlein, S.; Rehling, P.; Deckers, M. Cooperation between COA6 and SCO2 in COX2 maturation during cytochrome c oxidase assembly links two mitochondrial cardiomyopathies. Cell Metab. 2015, 21, 823–833. [Google Scholar] [CrossRef]
- Mimaki, M.; Ikota, A.; Sato, A.; Komaki, H.; Akanuma, J.; Nonaka, I.; Goto, Y.-I. A double mutation (G11778A and G12192A) in mitochondrial DNA associated with Leber’s hereditary optic neuropathy and cardiomyopathy. J. Hum. Genet. 2003, 48, 0047–0050. [Google Scholar] [CrossRef][Green Version]
- Ono, H.; Nakamura, H.; Matsuzaki, M. A NADH dehydrogenase ubiquinone flavoprotein is decreased in patients with dilated cardiomyopathy. Intern. Med. 2010, 49, 2039–2042. [Google Scholar] [CrossRef]
- Loeffen, J.; Elpeleg, O.; Smeitink, J.; Smeets, R.; Stöckler-Ipsiroglu, S.; Mandel, H.; Sengers, R.; Trijbels, F.; Van Den Heuvel, L. Mutations in the complex I NDUFS2 gene of patients with cardiomyopathy and encephalomyopathy. Ann. Neurol. Off. J. Am. Neurol. Assoc. Child Neurol. Soc. 2001, 49, 195–201. [Google Scholar]
- Antonicka, H.; Mattman, A.; Carlson, C.G.; Glerum, D.M.; Hoffbuhr, K.C.; Leary, S.C.; Kennaway, N.G.; Shoubridge, E.A. Mutations in COX15 produce a defect in the mitochondrial heme biosynthetic pathway, causing early-onset fatal hypertrophic cardiomyopathy. Am. J. Hum. Genet. 2003, 72, 101–114. [Google Scholar] [CrossRef] [PubMed]
- Bonne, G.; Carrier, L.; Richard, P.; Hainque, B.; Schwartz, K. Familial hypertrophic cardiomyopathy: From mutations to functional defects. Circ. Res. 1998, 83, 580–593. [Google Scholar] [CrossRef] [PubMed]
- Toepfer, C.N.; Wakimoto, H.; Garfinkel, A.C.; McDonough, B.; Liao, D.; Jiang, J.; Tai, A.C.; Gorham, J.M.; Lunde, I.G.; Lun, M. Hypertrophic cardiomyopathy mutations in MYBPC3 dysregulate myosin. Sci. Transl. Med. 2019, 11, eaat1199. [Google Scholar] [CrossRef] [PubMed]
- Arimura, T.; Nakamura, T.; Hiroi, S.; Satoh, M.; Takahashi, M.; Ohbuchi, N.; Ueda, K.; Nouchi, T.; Yamaguchi, N.; Akai, J. Characterization of the human nebulette gene: A polymorphism in an actin-binding motif is associated with nonfamilial idiopathic dilated cardiomyopathy. Hum. Genet. 2000, 107, 440–451. [Google Scholar] [CrossRef]
- Rampazzo, A.; Nava, A.; Malacrida, S.; Beffagna, G.; Bauce, B.; Rossi, V.; Zimbello, R.; Simionati, B.; Basso, C.; Thiene, G. Mutation in human desmoplakin domain binding to plakoglobin causes a dominant form of arrhythmogenic right ventricular cardiomyopathy. Am. J. Hum. Genet. 2002, 71, 1200–1206. [Google Scholar] [CrossRef]
- Li, D.; Parks, S.B.; Kushner, J.D.; Nauman, D.; Burgess, D.; Ludwigsen, S.; Partain, J.; Nixon, R.R.; Allen, C.N.; Irwin, R.P. Mutations of presenilin genes in dilated cardiomyopathy and heart failure. Am. J. Hum. Genet. 2006, 79, 1030–1039. [Google Scholar] [CrossRef]
- Haapasalo, A.; Kovacs, D.M. The many substrates of presenilin/γ-secretase. J. Alzheimer’s Dis. 2011, 25, 3–28. [Google Scholar] [CrossRef]
- Bienengraeber, M.; Olson, T.M.; Selivanov, V.A.; Kathmann, E.C.; O’Cochlain, F.; Gao, F.; Karger, A.B.; Ballew, J.D.; Hodgson, D.M.; Zingman, L.V. ABCC9 mutations identified in human dilated cardiomyopathy disrupt catalytic K ATP channel gating. Nat. Genet. 2004, 36, 382–387. [Google Scholar] [CrossRef]
- Duggan, D.J.; Manchester, D.; Stears, K.P.; Mathews, D.J.; Hart, C.; Hoffman, E.P. Mutations in the δ-sarcoglycan gene are a rare cause of autosomal recessive limb-girdle muscular dystrophy (LGMD2). Neurogenetics 1997, 1, 49–58. [Google Scholar] [CrossRef]
- Tsubata, S.; Bowles, K.R.; Vatta, M.; Zintz, C.; Titus, J.; Muhonen, L.; Bowles, N.E.; Towbin, J.A. Mutations in the human δ-sarcoglycan gene in familial and sporadic dilated cardiomyopathy. J. Clin. Investig. 2000, 106, 655–662. [Google Scholar] [CrossRef]
- Rader, E.P.; Turk, R.; Willer, T.; Beltrán, D.; Inamori, K.-i.; Peterson, T.A.; Engle, J.; Prouty, S.; Matsumura, K.; Saito, F. Role of dystroglycan in limiting contraction-induced injury to the sarcomeric cytoskeleton of mature skeletal muscle. Proc. Natl. Acad. Sci. USA 2016, 113, 10992–10997. [Google Scholar] [CrossRef] [PubMed]
- Itoh-Satoh, M.; Hayashi, T.; Nishi, H.; Koga, Y.; Arimura, T.; Koyanagi, T.; Takahashi, M.; Hohda, S.; Ueda, K.; Nouchi, T. Titin mutations as the molecular basis for dilated cardiomyopathy. Biochem. Biophys. Res. Commun. 2002, 291, 385–393. [Google Scholar] [CrossRef] [PubMed]
- Mohapatra, B.; Jimenez, S.; Lin, J.H.; Bowles, K.R.; Coveler, K.J.; Marx, J.G.; Chrisco, M.A.; Murphy, R.T.; Lurie, P.R.; Schwartz, R.J. Mutations in the muscle LIM protein and α-actinin-2 genes in dilated cardiomyopathy and endocardial fibroelastosis. Mol. Genet. Metab. 2003, 80, 207–215. [Google Scholar] [CrossRef]
- Geier, C.; Gehmlich, K.; Ehler, E.; Hassfeld, S.; Perrot, A.; Hayess, K.; Cardim, N.; Wenzel, K.; Erdmann, B.; Krackhardt, F. Beyond the sarcomere: CSRP3 mutations cause hypertrophic cardiomyopathy. Hum. Mol. Genet. 2008, 17, 2753–2765. [Google Scholar] [CrossRef]
- Fujii, J.; Zarain-Herzberg, A.; Willard, H.F.; Tada, M.; MacLennan, D. Structure of the rabbit phospholamban gene, cloning of the human cDNA, and assignment of the gene to human chromosome 6. J. Biol. Chem. 1991, 266, 11669–11675. [Google Scholar]
- Ha, K.N.; Masterson, L.R.; Hou, Z.; Verardi, R.; Walsh, N.; Veglia, G.; Robia, S.L. Lethal Arg9Cys phospholamban mutation hinders Ca2+-ATPase regulation and phosphorylation by protein kinase A. Proc. Natl. Acad. Sci. USA 2011, 108, 2735–2740. [Google Scholar] [CrossRef]
- Minamisawa, S.; Sato, Y.; Tatsuguchi, Y.; Fujino, T.; Imamura, S.-i.; Uetsuka, Y.; Nakazawa, M.; Matsuoka, R. Mutation of the phospholamban promoter associated with hypertrophic cardiomyopathy. Biochem. Biophys. Res. Commun. 2003, 304, 1–4. [Google Scholar] [CrossRef]
- Carniel, E.; Taylor, M.R.; Sinagra, G.; Di Lenarda, A.; Ku, L.; Fain, P.R.; Boucek, M.M.; Cavanaugh, J.; Miocic, S.; Slavov, D. α-Myosin heavy chain: A sarcomeric gene associated with dilated and hypertrophic phenotypes of cardiomyopathy. Circulation 2005, 112, 54–59. [Google Scholar] [CrossRef]
- Davis, J.S.; Hassanzadeh, S.; Winitsky, S.; Lin, H.; Satorius, C.; Vemuri, R.; Aletras, A.H.; Wen, H.; Epstein, N.D. The overall pattern of cardiac contraction depends on a spatial gradient of myosin regulatory light chain phosphorylation. Cell 2001, 107, 631–641. [Google Scholar] [CrossRef]
- Friedrich, F.W.; Reischmann, S.; Schwalm, A.; Unger, A.; Ramanujam, D.; Münch, J.; Müller, O.J.; Hengstenberg, C.; Galve, E.; Charron, P. FHL2 expression and variants in hypertrophic cardiomyopathy. Basic Res. Cardiol. 2014, 109, 451. [Google Scholar] [CrossRef]
- Song, Y.; Xu, J.; Li, Y.; Jia, C.; Ma, X.; Zhang, L.; Xie, X.; Zhang, Y.; Gao, X.; Zhang, Y. Cardiac ankyrin repeat protein attenuates cardiac hypertrophy by inhibition of ERK1/2 and TGF-β signaling pathways. PLoS ONE 2012, 7, e50436. [Google Scholar] [CrossRef] [PubMed]
- Bhandary, B.; Meng, Q.; James, J.; Osinska, H.; Gulick, J.; Valiente-Alandi, I.; Sargent, M.A.; Bhuiyan, M.S.; Blaxall, B.C.; Molkentin, J.D. Cardiac fibrosis in proteotoxic cardiac disease is dependent upon myofibroblast TGF-β signaling. J. Am. Heart Assoc. 2018, 7, e010013. [Google Scholar] [CrossRef] [PubMed]
- Beffagna, G.; Occhi, G.; Nava, A.; Vitiello, L.; Ditadi, A.; Basso, C.; Bauce, B.; Carraro, G.; Thiene, G.; Towbin, J.A. Regulatory mutations in transforming growth factor-β3 gene cause arrhythmogenic right ventricular cardiomyopathy type 1. Cardiovasc. Res. 2005, 65, 366–373. [Google Scholar] [CrossRef] [PubMed]
- Huang, Y.; Shen, X.J.; Zou, Q.; Wang, S.P.; Tang, S.M.; Zhang, G.Z. Biological functions of microRNAs: A review. J. Physiol. Biochem. 2011, 67, 129–139. [Google Scholar] [CrossRef]
- Schmitz, S.U.; Grote, P.; Herrmann, B.G. Mechanisms of long noncoding RNA function in development and disease. Cell. Mol. Life Sci. 2016, 73, 2491–2509. [Google Scholar] [CrossRef]
- Xiao, J.; Gao, R.; Bei, Y.; Zhou, Q.; Zhou, Y.; Zhang, H.; Jin, M.; Wei, S.; Wang, K.; Xu, X. Circulating miR-30d predicts survival in patients with acute heart failure. Cell. Physiol. Biochem. 2017, 41, 865–874. [Google Scholar] [CrossRef]
- Bukauskas, T.; Mickus, R.; Cereskevicius, D.; Macas, A. Value of serum miR-23a, miR-30d, and miR-146a biomarkers in ST-elevation myocardial infarction. Med. Sci. Monit. Int. Med. J. Exp. Clin. Res. 2019, 25, 3925. [Google Scholar] [CrossRef]
- Bernardo, B.C.; Nguyen, S.S.; Gao, X.-M.; Tham, Y.K.; Ooi, J.Y.; Patterson, N.L.; Kiriazis, H.; Su, Y.; Thomas, C.J.; Lin, R.C. Inhibition of miR-154 protects against cardiac dysfunction and fibrosis in a mouse model of pressure overload. Sci. Rep. 2016, 6, 22442. [Google Scholar] [CrossRef]
- Tomita, Y.; Kusama, Y.; Seino, Y.; Munakata, K.; Kishida, H.; Hayakawa, H. Increased accumulation of acidic fibroblast growth factor in left ventricular myocytes of patients with idiopathic cardiomyopathy. Am. Heart J. 1997, 134, 779–786. [Google Scholar] [CrossRef]
- Templin, C.; Ghadri, J.-R.; Rougier, J.-S.; Baumer, A.; Kaplan, V.; Albesa, M.; Sticht, H.; Rauch, A.; Puleo, C.; Hu, D. Identification of a novel loss-of-function calcium channel gene mutation in short QT syndrome (SQTS6). Eur. Heart J. 2011, 32, 1077–1088. [Google Scholar] [CrossRef]
- Uchida, S.; Dimmeler, S. Long noncoding RNAs in cardiovascular diseases. Circ. Res. 2015, 116, 737–750. [Google Scholar] [CrossRef] [PubMed]
- Hobuß, L.; Bär, C.; Thum, T. Long non-coding RNAs: At the heart of cardiac dysfunction? Front. Physiol. 2019, 10, 30. [Google Scholar] [CrossRef] [PubMed]
- Verdonschot, J.A.; Hazebroek, M.R.; Derks, K.W.; Barandiarán Aizpurua, A.; Merken, J.J.; Wang, P.; Bierau, J.; van den Wijngaard, A.; Schalla, S.M.; Abdul Hamid, M.A. Titin cardiomyopathy leads to altered mitochondrial energetics, increased fibrosis and long-term life-threatening arrhythmias. Eur. Heart J. 2018, 39, 864–873. [Google Scholar] [CrossRef] [PubMed]
- Chen, S.; Zhou, Y.; Chen, Y.; Gu, J. fastp: An ultra-fast all-in-one FASTQ preprocessor. Bioinformatics 2018, 34, i884–i890. [Google Scholar] [CrossRef]
- McKenna, A.; Hanna, M.; Banks, E.; Sivachenko, A.; Cibulskis, K.; Kernytsky, A.; Garimella, K.; Altshuler, D.; Gabriel, S.; Daly, M. The Genome Analysis Toolkit: A MapReduce framework for analyzing next-generation DNA sequencing data. Genome Res. 2010, 20, 1297–1303. [Google Scholar] [CrossRef]
- Dobin, A.; Davis, C.A.; Schlesinger, F.; Drenkow, J.; Zaleski, C.; Jha, S.; Batut, P.; Chaisson, M.; Gingeras, T.R. STAR: Ultrafast universal RNA-seq aligner. Bioinformatics 2013, 29, 15–21. [Google Scholar] [CrossRef]
- Yang, H.; Wang, K. Genomic variant annotation and prioritization with ANNOVAR and wANNOVAR. Nat. Protoc. 2015, 10, 1556. [Google Scholar] [CrossRef]
- Love, M.I.; Huber, W.; Anders, S. Moderated estimation of fold change and dispersion for RNA-seq data with DESeq2. Genome Biol. 2014, 15, 550. [Google Scholar] [CrossRef]
- Benjamini, Y.; Hochberg, Y. Controlling the false discovery rate: A practical and powerful approach to multiple testing. J. R. Stat. Soc. Ser. B (Methodol. ) 1995, 57, 289–300. [Google Scholar] [CrossRef]
- Wahid, F.; Shehzad, A.; Khan, T.; Kim, Y.Y. MicroRNAs: Synthesis, mechanism, function, and recent clinical trials. Biochim. Et Biophys. Acta (BBA)-Mol. Cell Res. 2010, 1803, 1231–1243. [Google Scholar] [CrossRef]
- Rajewsky, N. microRNA target predictions in animals. Nat. Genet. 2006, 38, S8–S13. [Google Scholar] [CrossRef] [PubMed]
- Dweep, H.; Sticht, C.; Pandey, P.; Gretz, N. miRWalk–database: Prediction of possible miRNA binding sites by “walking” the genes of three genomes. J. Biomed. Inform. 2011, 44, 839–847. [Google Scholar] [CrossRef] [PubMed]
- Marchese, F.P.; Raimondi, I.; Huarte, M. The multidimensional mechanisms of long noncoding RNA function. Genome Biol. 2017, 18, 206. [Google Scholar] [CrossRef] [PubMed]
- Ransohoff, J.D.; Wei, Y.; Khavari, P.A. The functions and unique features of long intergenic non-coding RNA. Nat. Rev. Mol. Cell Biol. 2018, 19, 143. [Google Scholar] [CrossRef] [PubMed]
- Quinlan, A.R.; Hall, I.M. BEDTools: A flexible suite of utilities for comparing genomic features. Bioinformatics 2010, 26, 841–842. [Google Scholar] [CrossRef]
- Langfelder, P.; Horvath, S. WGCNA: An R package for weighted correlation network analysis. BMC Bioinform. 2008, 9, 559. [Google Scholar] [CrossRef]
- Szklarczyk, D.; Gable, A.L.; Lyon, D.; Junge, A.; Wyder, S.; Huerta-Cepas, J.; Simonovic, M.; Doncheva, N.T.; Morris, J.H.; Bork, P. STRING v11: Protein–protein association networks with increased coverage, supporting functional discovery in genome-wide experimental datasets. Nucleic Acids Res. 2019, 47, D607–D613. [Google Scholar] [CrossRef]
- Wang, J.; Vasaikar, S.; Shi, Z.; Greer, M.; Zhang, B. WebGestalt 2017: A more comprehensive, powerful, flexible and interactive gene set enrichment analysis toolkit. Nucleic Acids Res. 2017, 45, W130–W137. [Google Scholar] [CrossRef]


© 2020 by the authors. Licensee MDPI, Basel, Switzerland. This article is an open access article distributed under the terms and conditions of the Creative Commons Attribution (CC BY) license (http://creativecommons.org/licenses/by/4.0/).