Modified DNA Aptamers for C-Reactive Protein and Lactate Dehydrogenase-5 with Sub-Nanomolar Affinities

 ,
,
Abstract
1. Introduction
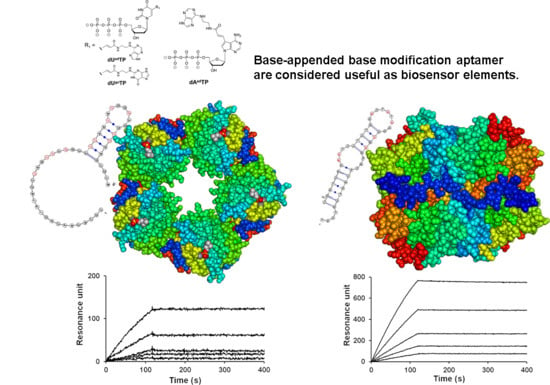
2. Results
3. Discussion
4. Materials and Methods
4.1. Materials
4.2. SELEX
4.3. Surface Plasmon Resonance (SPR) Assay
4.4. Pull-Down Assay
5. Conclusions
Author Contributions
Funding
Conflicts of Interest
Abbreviations
| CRP | C-reactive protein |
| LDH | Lactate dehydrogenase |
| SELEX | Systematic evolution of ligands by exponential enrichment |
| BAB | Base-appended base |
| SB | Selection buffer |
| SIgA | Secretory immunoglobulin A |
| Fw | Forward |
| Rv | Reverse |
| SPR | Surface plasmon resonance |
Appendix A

| Clone Name | Sequence Ratio (a) | Random Region Sequence (b) | Clone Name | Sequence Ratio (a) | Random Region Sequence (b) |
|---|---|---|---|---|---|
| CRP-Uad1 | 27.5% | CGGttACAGAtGAtCAGGCtCAAACAGAtt | LDH-Uad1 | 8.4% | CACCCtCCAGACtAtAttCtAGGCAACCGA |
| CRP-Uad2 | 24.6% | AACtGGGtCGAACGCGGttACAGAtGAtCAG | LDH-Uad2 | 7.5% | tGtGtCGAtCAGAtGCGttACtAAAtCtCA |
| CRP-Uad3 | 17.4% | CCttCAAGAAttGCGGttACAGAtGAtCAG | LDH-Uad3 | 6.9% | AGGCCtCCCtCCtAtAttCtAGGCGACCGA |
| CRP-Uad4 | 11.9% | CCtCGtAtAAGACGGttACAGAtGAtCAGG | LDH-Uad4 | 6.2% | CCGGtAACACtAAtGtGAAtCtGACtAtAt |
| CRP-Uad5 | 10.7% | tGAtAAAAGCCCGGttACAGAtGAtCAGGG | LDH-Uad5 | 5.3% | CAtCCACtACGCCtAtAttCtAGGCGACCGA |
| CRP-Uad6 | 7.3% | ACCGGttACAGAtGAtCAGGGGCAAAGAAC | LDH-Uad6 | 4.5% | tGGGCtAtGGtACtAGACtGGCtCGGttGC |
| CRP-Uad7 | 0.13% | AtCGAAttGCtGGttACGGCAtCGAtCAGA | LDH-Uad7 | 2.7% | GtAACACtAAtCtCCCACCtCCCGtAtAtC |
| CRP-Uad8 | 0.04% | ACCGGttACAGAtGAtCAGGG | LDH-Uad8 | 2.5% | GtCGGttttCGCGtGGAGGtCCGtGAtCGG |
| CRP-Uad9 | 0.01% | AttGCtttAtGCCGGttACtGAtGAtCAGG | LDH-Uad9 | 2.4% | GGGtAttGGtCtCGACCACCGCtCGGAACC |
| CRP-Uad10 | 0.01% | AAtACGCtAtCCGtGtGCAGtCCGAAtGAt | LDH-Uad10 | 2.2% | tGtGtCGAtCAGAtGCGttACtAAtCtCA |
| CRP-Ugu1 | 27.9% | CAtGAAtGCGtGtGGttAtAGtAttGAACt | LDH-Ugu1 | 24.3% | CCtCCGCttGtGGAtACGAtGGACtAGtGG |
| CRP-Ugu2 | 14.3% | GtCtGAAAtCGCtttCCGGAtCGGACttAA | LDH-Ugu2 | 12.0% | ACCttAGACACGGtACttACCGACACtAAA |
| CRP-Ugu3 | 9.6% | GACGtCCCACGGtttGAtCAAACGtACAtA | LDH-Ugu3 | 8.9% | ttAGAtACttGGCtCtACttAttGACAAtC |
| CRP-Ugu4 | 6.5% | CtAGttCtGCCttAAtAtGGtCGGttAAGC | LDH-Ugu4 | 7.3% | CACtCCtGAttGCttAAGAtCttAGttCGA |
| CRP-Ugu5 | 5.9% | ACtCAAGttAtGCtGGACttCtttACAAAC | LDH-Ugu5 | 3.2% | tGtCttGGACACGGtACttACCtCACACtA |
| CRP-Ugu6 | 5.2% | GCAtACAACtCCCtAGtCAAACtGACAttA | LDH-Ugu6 | 2.5% | AtGtCCCttGGCtAtAGttCAAGtttAGAA |
| CRP-Ugu7 | 3.9% | GtCtGAAAtCAAtCtCGAttCGGAAttAtG | LDH-Ugu7 | 2.5% | GACACAtACttGGCtCtACAtAttGAGAGA |
| CRP-Ugu8 | 3.5% | AGAttCAGACCCCGAGGtAAtGCCGACtGt | LDH-Ugu8 | 1.6% | GGAGAtACttGGCtCtACttAttGACAAtC |
| CRP-Ugu9 | 3.6% | GAtGCGGtCtGAAAtCAAtCtAAAttCGCG | LDH-Ugu9 | 1.3% | ACCttCGACACGGtACttACCGACACtAAA |
| CRP-Ugu10 | 2.6% | GAACGGCtGCAtCCCCtAGtGGtGtAGGCA | LDH-Ugu10 | 1.2% | tAAGAtACttGGCtCtACttAttGACAAtC |
| CRP-Aad1 | 39.2% | aaCaTTGaGTGCCaTGCCCTTCGTaGaCa | LDH-Aad1 | 55.8% | CTGCTGGCTCGTGaGaCGGaTaTCaGGTCT |
| CRP-Aad2 | 19.5% | TTTaCCGaaTGCCaTGCCCGaGaGTaGaCa | LDH-Aad2 | 14.9% | aGaGGGaGaTCaTCTCTCTGGCGGaCaCaa |
| CRP-Aad3 | 10.0% | TCGaaCGCCaTGCCaCTGCCCGGTTaGaCa | LDH-Aad3 | 1.9% | CTGCTGGTTCGTGaGaCGGaTaTCaGGTCT |
| CRP-Aad4 | 5.1% | aCGTaGCaTaGTGTaaGGaGCGCCCaCTaT | LDH-Aad4 | 1.9% | CTaCTGGCTCGTGaGaCGGaTaTCaGGTCT |
| CRP-Aad5 | 4.2% | CaGCCGCCTGCCaTGCCCCCGCGGTaGaCa | LDH-Aad5 | 1.8% | CCGaCTCTaTGTGaGaGGGaGaTCaGCTCT |
| CRP-Aad6 | 3.5% | CaaaGTTaGGTGCTCCGTaCaCCaCTCTGC | LDH-Aad6 | 1.2% | CTGCTGGCTTGTGaGaCGGaTaTCaGGTCT |
| CRP-Aad7 | 3.3% | aaGaCaaTTGCCaTGCCCCCGTaGTaGaCa | LDH-Aad7 | 0.9% | CTGCTaGCTCGTGaGaCGGaTaTCaGGTCT |
| CRP-Aad8 | 2.9% | CaTGGCCaTGTCCCCCGGTaGaCaGCCGaT | LDH-Aad8 | 0.7% | aGaGGGaGaTCaTCTCTCTGGCGGaCaTaa |
| CRP-Aad9 | 2.3% | aaCCaaaTGCCaTGCCCCTCaGGTaGaCa | LDH-Aad9 | 0.7% | aGaCGGaTaGCaTGTCTCTGGCTGTGaTGT |
| CRP-Aad10 | 1.6% | TaTGTCGTaTGCCaTGCCCTGGaGTaGaCa | LDH-Aad10 | 0.7% | CTGCTGaCTCGTGaGaCGGaTaTCaGGTCT |


References
- Ellington, A.D.; Szostak, J.W. In vitro selection of RNA molecules that bind specific ligands. Nature 1990, 346, 818–822. [Google Scholar] [CrossRef] [PubMed]
- Tuerk, C.; Gold, L. Systematic evolution of ligands by exponential enrichment: RNA ligands to bacteriophage T4 DNA polymerase. Science 1990, 249, 505–510. [Google Scholar] [CrossRef] [PubMed]
- Odeh, F.; Nsairat, H.; Alshaer, W.; Ismail, M.A.; Esawi, E.; Qaqish, B.; Bawab, A.A.; Ismail, S.I. Aptamers chemistry: Chemical modifications and conjugation strategies. Molecules 2020, 25, 3. [Google Scholar] [CrossRef] [PubMed]
- Crivianu-Gaita, V.; Thompson, M. Aptamers, antibody scFv, and antibody Fab’ fragments: An overview and comparison of three of the most versatile biosensor biorecognition elements. Biosens. Bioelectron. 2016, 85, 32–45. [Google Scholar] [CrossRef]
- Chen, A.; Yang, S. Replacing antibodies with aptamers in lateral flow immunoassay. Biosens. Bioelectron. 2015, 71, 230–242. [Google Scholar] [CrossRef]
- Nimjee, S.M.; White, R.R.; Becker, R.C.; Sullenger, B.A. Aptamers as therapeutics. Annu. Rev. Pharmacol. Toxicol. 2017, 57, 61–79. [Google Scholar] [CrossRef]
- Ilgu, M.; Nilsen-Hamilton, M. Aptamers in analytics. Analyst 2016, 141, 1551–1568. [Google Scholar] [CrossRef]
- Komarova, N.; Kuznetsov, A. Inside the black box: What makes SELEX better? Molecules 2019, 24, 3598. [Google Scholar] [CrossRef]
- Blind, M.; Blank, M. Aptamer selection technology and recent advances. Mol. Ther.–Nucleic Acids 2015, 4, e223. [Google Scholar] [CrossRef]
- Sun, H.; Zu, Y. A highlight of recent advances in aptamer technology and its application. Molecules 2015, 20, 11959–11980. [Google Scholar] [CrossRef]
- Adachi, T.; Nakamura, Y. Aptamers: A review of their chemical properties and modifications for therapeutic application. Molecules 2019, 24, 4229. [Google Scholar] [CrossRef] [PubMed]
- Gold, L.; Ayers, D.; Bertino, J.; Bock, C.; Bock, A.; Brody, E.N.; Carter, J.; Dalby, A.B.; Eaton, B.E.; Fitzwater, T.; et al. Aptamer-based multiplexed proteomic technology for biomarker discovery. PLoS ONE 2010, 5, e15004. [Google Scholar] [CrossRef] [PubMed]
- Kimoto, M.; Yamashige, R.; Matsunaga, K.; Yokoyama, S.; Hirao, I. Generation of high-affinity DNA aptamers using an expanded genetic alphabet. Nat. Biotechnol. 2013, 31, 453–457. [Google Scholar] [CrossRef]
- Imaizumi, Y.; Kasahara, Y.; Fujita, H.; Kitadume, S.; Ozaki, H.; Endoh, T.; Kuwahara, M.; Sugimoto, N. Efficacy of base-modification on target binding of small molecule DNA aptamers. J. Am. Chem. Soc. 2013, 135, 9412–9419. [Google Scholar] [CrossRef]
- Kuwahara, M.; Fujita, H.; Kataoka, Y.; Nakajima, Y.; Yamada, M.; Sugimoto, N. In situ condensation of an anti-cancer drug into fibrin gel enabling effective inhibition of tumor cell growth. Chem. Commun. 2019, 55, 11679–11682. [Google Scholar] [CrossRef] [PubMed]
- Minagawa, H.; Onodera, K.; Fujita, H.; Sakamoto, T.; Akitomi, J.; Kaneko, N.; Shiratori, I.; Kuwahara, M.; Horii, K.; Waga, I. Selection, characterization and application of artificial DNA aptamer containing appended bases with sub-nanomolar affinity for a salivary biomarker. Sci. Rep. 2017, 7, 42716. [Google Scholar] [CrossRef]
- Minagawa, H.; Shimizu, A.; Kataoka, Y.; Kuwahara, M.; Kato, S.; Horiii, K.; Shiratori, I.; Waga, I. Fluorescence polarization-based rapid detection system for salivary biomarkers using modified DNA aptamers containing base-appended bases. Anal. Chem. 2020, 92, 1780–1787. [Google Scholar] [CrossRef] [PubMed]
- Kushner, I. The phenomenon of the acute phase response. Ann. N. Y. Acad. Sci. 1982, 389, 39–48. [Google Scholar] [CrossRef]
- Pathak, A.; Agrawal, A. Evolution of C-reactive protein. Front. Immunol. 2019, 10, 943. [Google Scholar] [CrossRef]
- Ouellet-Morin, I.; Danese, A.; Williams, B.; Arseneault, L. Validation of a high-sensitivity assay for C-reactive protein in human saliva. Brain Behav. Immun. 2011, 25, 640–646. [Google Scholar] [CrossRef]
- La Fratta, I.; Tatangelo, R.; Campagna, G.; Rizzuto, A.; Franceschelli, S.; Ferrone, A.; Patruno, A.; Speranza, L.; De Lutiis, M.A.; Felaco, M.; et al. The plasmatic and salivary levels of IL-1β, IL-18 and IL-6 are associated to emotional difference during stress in young male. Sci. Rep. 2018, 8, 3031. [Google Scholar] [CrossRef] [PubMed]
- Gohel, V.; Jones, J.A.; Wehler, C.J. Salivary biomarkers and cardiovascular disease: A systematic review. Clin. Chem. Lab. Med. 2018, 56, 1432–1442. [Google Scholar] [CrossRef] [PubMed]
- Dekker, R.L.; Lennie, T.A.; Moser, D.K.; Miller, C.S.; Ebersole, J.L.; Chung, M.L.; Campbell, C.L.; Bailey, A.; Tovar, E.G. Salivary biomarkers, oral inflammation, and functional status in patients with heart failure. Biol. Res. Nurs. 2017, 19, 153–161. [Google Scholar] [CrossRef] [PubMed]
- Omran, A.; Ali, M.; Saleh, M.H.; Zekry, O. Salivary C-reactive protein and mean platelet volume in diagnosis of late-onset neonatal pneumonia. Clin. Respir. J. 2018, 12, 1644–1650. [Google Scholar] [CrossRef]
- Wang, W.; Mai, Z.; Chen, Y.; Wang, J.; Li, L.; Su, Q.; Li, X.; Hong, X. A label-free fiber optic SPR biosensor for specific detection of C-reactive protein. Sci. Rep. 2017, 7, 16904. [Google Scholar] [CrossRef]
- Castro, A.R.; Silva, S.O.; Soares, S.C. The use of high sensitivity C-reactive protein in cardiovascular disease detection. J. Pharm. Pharm. Sci. 2018, 21, 496–503. [Google Scholar] [CrossRef]
- Liaw, C.C.; Wang, C.H.; Huang, J.S.; Kiu, M.C.; Chen, J.S.; Chang, H.K. Serum lactate dehydrogenase level in patients with nasopharyngeal carcinoma. Acta Oncol. 1997, 36, 159–164. [Google Scholar] [CrossRef]
- Lokesh, K.; Kannabiran, J.; Rao, M.D. Salivary lactate dehydrogenase (LDH)—A novel technique in oral cancer detection and diagnosis. J. Clin. Diagn. Res. 2016, 10, ZC34–ZC37. [Google Scholar] [CrossRef]
- Urbańska, K.; Orzechowski, A. Unappreciated role of LDHA and LDHB to control apoptosis and autophagy in tumor cells. Int. J. Mol. Sci. 2019, 20, 2085. [Google Scholar] [CrossRef]
- Malicka, B.; Skoskiewicz-Malinowska, K.; Kaczmarek, U. Salivary lactate dehydrogenase and aminotransferases in diabetic patients. Medicine 2016, 95, e5211. [Google Scholar] [CrossRef]
- Joshi, P.S.; Golgire, S. A study of salivary lactate dehydrogenase isoenzyme levels in patients with oral leukoplakia and squamous cell carcinoma by gel electrophoresis method. J. Oral Maxillofac. Pathol. 2014, 18, S39–S44. [Google Scholar] [CrossRef] [PubMed]
- Saluja, T.S.; Spadigam, A.; Dhupar, A.; Syed, S. Equating salivary lactate dehydrogenase (LDH) with LDH-5 expression in patients with oral squamous cell carcinoma: An insight into metabolic reprogramming of cancer cell as a predictor of aggressive phenotype. Tumor Biol. 2016, 37, 5609–5620. [Google Scholar] [CrossRef] [PubMed]
- Jurisic, V.; Radenkovic, S.; Konjevic, G. The actual role of LDH as tumor marker, biochemical and clinical aspects. Adv. Exp. Med. Biol. 2015, 867, 115–124. [Google Scholar] [PubMed]
- Nonomiya, Y.; Noguchi, K.; Katayama, K.; Sugimoto, Y. Novel pharmacological effects of poly (ADP-ribose) polymerase inhibitor rucaparib on the lactate dehydrogenase pathway. Biochem. Biophys. Res. Commun. 2019, 510, 501–507. [Google Scholar] [CrossRef]
- Shangguan, D.; Tang, Z.; Mallikaratchy, P.; Xiao, Z.; Tan, W. Optimization and modifications of aptamers selected from live cancer cell lines. Chembiochem 2007, 8, 603–606. [Google Scholar] [CrossRef]
- He, X.; Guo, L.; He, J.; Xu, H.; Xie, J. Stepping library-based post-SELEX strategy approaching to the minimized aptamer in SPR. Anal. Chem. 2017, 89, 6559–6566. [Google Scholar] [CrossRef]
- Akitomi, J.; Kato, S.; Yoshida, Y.; Horii, K.; Furuichi, M.; Waga, I. Valfold: Program for the aptamer truncation process. Bioinformation 2011, 7, 38–40. [Google Scholar] [CrossRef]
- SantaLucia, J. A unified view of polymer, dumbbell, and oligonucleotide DNA nearest-neighbor thermodynamics. Proc. Natl. Acad. Sci. USA 1998, 95, 1460–1465. [Google Scholar] [CrossRef]
- Huang, C.J.; Lin, H.I.; Shiesh, S.C.; Lee, G.B. Integrated microfluidic system for rapid screening of CRP aptamers utilizing systematic evolution of ligands by exponential enrichment (SELEX). Biosens. Bioelectron. 2010, 25, 1761–1766. [Google Scholar] [CrossRef]
- Wang, M.S.; Black, J.C.; Knowles, M.K.; Reed, S.M. C-reactive protein (CRP) aptamer binds to monomeric but not pentameric form of CRP. Anal. Bioanal. Chem. 2011, 401, 1309–1318. [Google Scholar] [CrossRef]
- Tsao, S.M.; Lai, J.C.; Horng, H.E.; Liu, T.C.; Hong, C.Y. Generation of aptamers from a primer-free randomized ssDNA library using magnetic-assisted rapid aptamer selection. Sci. Rep. 2017, 7, 45478. [Google Scholar] [CrossRef] [PubMed]
- Eid, C.; Palko, J.W.; Katilius, E.; Santiago, J.G. Rapid slow off-rate modified aptamer (SOMAmer)-based detection of C-reactive protein using isotachophoresis and an ionic spacer. Anal. Chem. 2015, 87, 6736–6743. [Google Scholar] [CrossRef] [PubMed]
- Thompson, D.; Pepys, M.B.; Wood, S.P. The physiological structure of human C-reactive protein and its complex with phosphocholine. Structure 1999, 7, 169–177. [Google Scholar] [CrossRef]
- Poli, G.; Granchi, C.; Aissaoui, M.; Minutolo, F.; Tuccinardi, T. Three-dimensional analysis of the interactions between hLDH5 and its inhibitors. Molecules 2017, 22, 2217. [Google Scholar] [CrossRef] [PubMed]
- Webber, J.; Stone, T.C.; Katilius, E.; Smith, B.C.; Gordon, B.; Mason, M.D.; Tabi, Z.; Brewis, I.A.; Clayton, A. Proteomics analysis of cancer exosomes using a novel modified aptamer-based array (SOMAscan™) platform. Mol. Cell. Proteom. 2014, 13, 1050–1064. [Google Scholar] [CrossRef] [PubMed]
- Mafessoni, T.P.; Mazur, C.E.; Amenábar, J.M. Salivary lactate dehydrogenase (LDH) as a tool for early diagnosis of oral cancer in individuals with Fanconi anemia. Med. Hypotheses 2018, 119, 29–31. [Google Scholar] [CrossRef]
- Idili, A.; Arroyo-Currás, N.; Ploense, K.L.; Csordas, A.T.; Kuwahara, M.; Kippin, T.E.; Plaxco, K.W. Seconds-resolved pharmacokinetic measurements of the chemotherapeutic irinotecan in situ in the living body. Chem. Sci. 2019, 10, 8164–8170. [Google Scholar] [CrossRef]
- Peeters, M.; Jiménez-Monroy, K.L.; Libert, C.; Eurlings, Y.; Cuypers, W.; Wackers, G.; Duchateau, S.; Robaeys, P.; Nesladek, M.; Van Grinsven, B.; et al. Real-time monitoring of aptamer functionalization and detection of Ara H1 by electrochemical impedance spectroscopy and dissipation-mode quartz crystal microbalance. J. Biosens. Bioelectron. 2014, 5, 155. [Google Scholar]
- Van Grinsven, B.; Eersels, K.; Peeters, M.; Losada-Pérez, P.; Vandenryt, T.; Cleij, T.J.; Wagner, P. The heat-transfer method: A versatile low-cost, label-free, fast, and user-friendly readout platform for biosensor applications. ACS Appl. Mater. Interfaces 2014, 6, 13309–13318. [Google Scholar] [CrossRef]
- Li, H.; Somerson, J.; Xia, F.; Plaxco, K.W. Electrochemical DNA-based sensors for molecular quality control: Continuous, real-time melamine detection in flowing whole milk. Anal. Chem. 2018, 90, 10641–10645. [Google Scholar] [CrossRef]
- Idili, A.; Parolo, C.; Ortega, G.; Plaxco, K.W. Calibration-free measurement of phenylalanine levels in the blood using an electrochemical aptamer-based sensor suitable for point-of-care applications. ACS Sens. 2019, 4, 3227–3233. [Google Scholar] [CrossRef] [PubMed]
- Kasahara, Y.; Irisawa, Y.; Fujita, H.; Yahara, A.; Ozaki, H.; Obika, S.; Kuwahara, M. Capillary electrophoresis-systematic evolution of ligands by exponential enrichment selection of base- and sugar-modified DNA aptamers: Target binding dominated by 2′-O,4′-C-methylene-bridged/locked nucleic acid primer. Anal. Chem. 2013, 85, 4961–4967. [Google Scholar] [CrossRef] [PubMed]
- Minagawa, H.; Kataoka, Y.; Kuwahara, M.; Horii, K.; Shiratori, I.; Waga, I. A high affinity modified DNA aptamer containing base-appended bases for human β-defensin. Anal. Biochem. 2020, 594, 113627. [Google Scholar] [CrossRef] [PubMed]


| Clone Name | Sequence Ratio (a) | Random Region Sequence (b) | Average Resonance Unit (c) for 400 nM Target |
|---|---|---|---|
| CRP-Uad1 | 27.5% | CGGttACAGAtGAtCAGGCtCAAACAGAtt | 341 |
| CRP-Uad2 | 24.6% | AACtGGGtCGAACGCGGttACAGAtGAtCAG | 427 |
| CRP-Uad3 | 17.4% | CCttCAAGAAttGCGGttACAGAtGAtCAG | 236 |
| CRP-Uad4 | 11.9% | CCtCGtAtAAGACGGttACAGAtGAtCAGG | 396 |
| CRP-Uad5 | 10.7% | tGAtAAAAGCCCGGttACAGAtGAtCAGGG | 479 |
| CRP-Uad6 | 7.3% | ACCGGttACAGAtGAtCAGGGGCAAAGAAC | 249 |
| CRP-Ugu1 | 27.9% | CAtGAAtGCGtGtGGttAtAGtAttGAACt | 157 |
| CRP-Ugu2 | 14.3% | GtCtGAAAtCGCtttCCGGAtCGGACttAA | 435 |
| CRP-Ugu3 | 9.6% | GACGtCCCACGGtttGAtCAAACGtACAtA | 18 |
| CRP-Ugu4 | 6.5% | CtAGttCtGCCttAAtAtGGtCGGttAAGC | 362 |
| CRP-Ugu5 | 5.9% | ACtCAAGttAtGCtGGACttCtttACAAAC | 101 |
| CRP-Ugu6 | 5.2% | GCAtACAACtCCCtAGtCAAACtGACAttA | 93 |
| CRP-Aad1 | 39.2% | aaCaTTGaGTGCCaTGCCCTTCGTaGaCa | –53 |
| CRP-Aad2 | 19.5% | TTTaCCGaaTGCCaTGCCCGaGaGTaGaCa | –15 |
| CRP-Aad3 | 10.0% | TCGaaCGCCaTGCCaCTGCCCGGTTaGaCa | –13 |
| CRP-Aad4 | 5.1% | aCGTaGCaTaGTGTaaGGaGCGCCCaCTaT | –12 |
| LDH-Uad1 | 8.4% | CACCCtCCAGACtAtAttCtAGGCAACCGA | 1583 |
| LDH-Uad2 | 7.5% | tGtGtCGAtCAGAtGCGttACtAAAtCtCA | 1441 |
| LDH-Uad6 | 4.5% | tGGGCtAtGGtACtAGACtGGCtCGGttGC | 829 |
| LDH-Ugu1 | 24.3% | CCtCCGCttGtGGAtACGAtGGACtAGtGG | 1011 |
| LDH-Ugu2 | 12.0% | ACCttAGACACGGtACttACCGACACtAAA | 862 |
| LDH-Ugu3 | 8.9% | ttAGAtACttGGCtCtACttAttGACAAtC | 1255 |
| LDH-Ugu4 | 7.3% | CACtCCtGAttGCttAAGAtCttAGttCGA | 705 |
| LDH-Aad1 | 55.8% | CTGCTGGCTCGTGaGaCGGaTaTCaGGTCT | 1415 |
| LDH-Aad2 | 14.9% | aGaGGGaGaTCaTCTCTCTGGCGGaCaCaa | 518 |
© 2020 by the authors. Licensee MDPI, Basel, Switzerland. This article is an open access article distributed under the terms and conditions of the Creative Commons Attribution (CC BY) license (http://creativecommons.org/licenses/by/4.0/).
Share and Cite
Minagawa, H.; Kataoka, Y.; Fujita, H.; Kuwahara, M.; Horii, K.; Shiratori, I.; Waga, I. Modified DNA Aptamers for C-Reactive Protein and Lactate Dehydrogenase-5 with Sub-Nanomolar Affinities. Int. J. Mol. Sci. 2020, 21, 2683. https://doi.org/10.3390/ijms21082683
Minagawa H, Kataoka Y, Fujita H, Kuwahara M, Horii K, Shiratori I, Waga I. Modified DNA Aptamers for C-Reactive Protein and Lactate Dehydrogenase-5 with Sub-Nanomolar Affinities. International Journal of Molecular Sciences. 2020; 21(8):2683. https://doi.org/10.3390/ijms21082683
Chicago/Turabian StyleMinagawa, Hirotaka, Yuka Kataoka, Hiroto Fujita, Masayasu Kuwahara, Katsunori Horii, Ikuo Shiratori, and Iwao Waga. 2020. "Modified DNA Aptamers for C-Reactive Protein and Lactate Dehydrogenase-5 with Sub-Nanomolar Affinities" International Journal of Molecular Sciences 21, no. 8: 2683. https://doi.org/10.3390/ijms21082683
APA StyleMinagawa, H., Kataoka, Y., Fujita, H., Kuwahara, M., Horii, K., Shiratori, I., & Waga, I. (2020). Modified DNA Aptamers for C-Reactive Protein and Lactate Dehydrogenase-5 with Sub-Nanomolar Affinities. International Journal of Molecular Sciences, 21(8), 2683. https://doi.org/10.3390/ijms21082683