Abstract
Long-chain fatty acyl-CoA synthetase (ACSLs) is an essential enzyme for the synthesis of fatty acyl-CoA. ACSL1 plays a key role in the synthesis of triglycerides, phospholipids, and cholesterol esters. Background: In the current study, triglyceride content did not increase after overexpression of the ACSL1 gene. Methods: RNA-seq and lipid metabolome profiling were performed to determine why triglyceride levels did not change with ACSL1 overexpression. Results: Fatty acyl-CoA produced by ACSL1 was determined to be involved in the diglyceride synthesis pathway, and diglyceride content significantly increased when ACSL1 was overexpressed. Moreover, the arachidonic acid (AA) content in sheep adipocytes significantly increased, and the level of cyclooxygenase 2 (COX2) expression, the downstream metabolic gene, was significantly downregulated. Knocking down the ACSL1 gene was associated with an increase in COX2 mRNA expression, as well as an increase in prostaglandin content, which is the downstream metabolite of AA. Conclusions: The overexpression of the ACSL1 gene promotes the production of AA via downregulation of COX2 gene expression.
1. Introduction
Long-chain fatty acyl-CoA synthetases (ACSLs) are essential for fatty acid (FA) activation and catalysis. ACSL1 converts long-chain FAs to fatty acyl-CoA. Studies have shown that ACSLs play key roles in the synthesis of triglycerides, phospholipids, and cholesterol esters, as well as in the metabolism of FA [1]. The ACSL1 gene encodes a synthetase that is involved in lipid metabolism and mainly expressed in adipose tissues and the inner membrane of the liver [2]. ACSL1 is also involved in the synthesis of triglycerides from fatty acyl-CoA, promotes the deposition of FAs [3], activates FA, and enters the β-oxidation pathway [4].
Previous studies have shown that the ACSL1 gene affects FA composition by adjusting the total fat content of skeletal muscle [5]. In addition, ACSL1 was also found to influence the relative content of different fractions of unsaturated FAs, omega-3 FAs, polyunsaturated FAs, long-chain omega-3 FAs, and docosapentaenoic acid [6]. ACSL1 is a major subtype that promotes triglyceride synthesis in 3T3-L1 adipocytes [2]. In mice, which was specifically overexpressed with the ACSL1 gene, triglyceride levels increased 12-fold, and choline glycerophospholipids increased 1.5-fold [7]. Carlos et al. reported that ACSL1 gene expression gradually increases as individuals grow and reaches the maximum level after adulthood [8]. Suzuki et al. found that high-carbohydrate foods and high-fat diets affect the expression of ACSL1 in the liver [9]. Loss of ACSL1 causes changes in the expression of pro-inflammatory chemokines and downregulates the amount of cellular lipids and glucose uptake [10]. ACSL1 promotes differentiation of brown adipocytes, and ACSL1 deficiency in brown adipocytes reduces body weight in mice fed a high-fat diet [11]. FA oxidation levels in white adipocytes decrease, and cold tolerance is low in ACSL1 knockout mice, indicating that ACSL1 plays an important role in the activation of FA oxidation [12]. These studies suggest that the level of ACSL1 in tissues may be related to FA metabolism.
The quality, texture, and taste of meat are related to intramuscular adipocytes [13]. Unsaturated FAs in mutton not only affect taste but are also essential nutrients for humans [14]. In an initial experiment, Du Han sheep (Duper sheep × Small-Tailed Han sheep cross F1 generation) and Small-Tailed Han sheep were studied. First, a comparative analysis of production performance was conducted. The results showed that the mean carcass weight of the crossbred sheep was significantly higher than that of the Small-Tailed Han sheep. Genome-wide methylation sequencing was performed using methylated DNA immunoprecipitation sequencing on two populations of Duhan sheep and Small-Tailed Han sheep and showed that the expression level of ACSL1 was significantly different between the two groups (p < 0.05) and that the ACSL1 gene is regulated by methylation thereby affecting lipid metabolism and meat quality [15]. The current study explored the regulatory mechanism of the ACSL1 gene on intramuscular fat deposition in sheep adipocytes to provide a theoretical and scientific basis for breeding. In this study, the coding sequence (CDS) region of ACSL1 was cloned and transfected into sheep preadipocytes. After the cells were allowed to differentiate for eight days, and cellular triglyceride content was measured, the triglyceride content in the treated cells did not significantly differ from the control cells. This result is in contrast to what was previously known about the role of the ACSL1 gene in lipid metabolism [1,2,7]. To further determine the effect of ACSL1 on sheep adipocytes, a combined transcriptome and metabolome analysis was performed.
2. Results
2.1. Overexpression of Sheep ACSL1 Gene in Sheep Adipocytes
The CDS region of the ACSL1 gene was cloned, and the fragment ligated into the pcDNA3.1(+) vector (Figure 1a) via BamHI and EcoRI digestion. The vectors were transfected into sheep preadipocytes. The expression of ACSL1 mRNA in sheep adipocytes significantly increased during the process of inducing differentiation on days 0, 4, and 8 (Figure 1b), and protein expression also significantly increased on day 8 (Figure 1c). On the 8th day after induction of differentiation, the transfected cells developed into mature adipocytes. Large lipid droplets were observed, which is consistent with the form of fat in the body (Figure 1e). These findings demonstrate that ACSL1-overexpressing preadipocytes were successfully generated. However, the triglyceride content comparing the overexpressing adipocytes with control adipocytes did not significantly differ (Figure 1d).
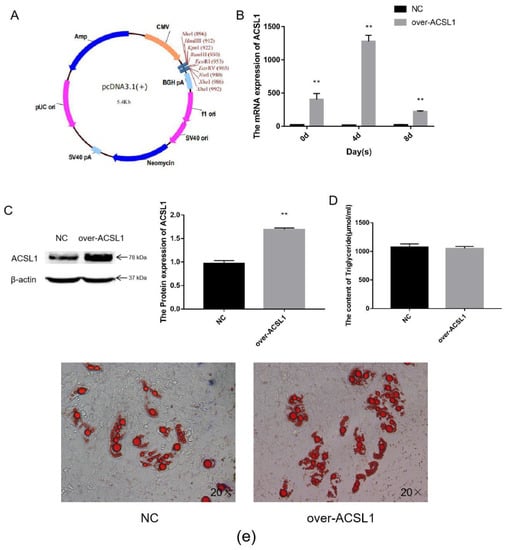
Figure 1.
Overexpression of the ACSL1 gene in sheep preadipocytes: (a) the pcDNA3.1(+) vector; (b) mRNA expression of the ACSL1 gene on days 0, 4, and 8 of differentiation (* p < 0.05, ** p < 0.01); (c) the protein expression of the ACSL1 gene on day 8 of differentiation; (d) the detection of intracellular triglyceride content; (e) oil red staining of adipocytes after induced differentiation on day 8 (Left: control; Right: overexpression ACSL1). NC: Adipocytes transfected with pcDNA3.1(+) vector for control. Over-ACSL1: Adipocytes transfected with pcDNA3.1(+) vector with ACSL1 CDS.
2.2. RNA-seq and Lipid Metabolome Analyses
RNA-seq and lipid metabolome profiling were used to sequence sheep adipocytes overexpressing the ACSL1 gene. Twenty-three differentially expressed genes (DEGs) were screened using RNA-seq, of which 14 DEGs were upregulated, and 9 genes were downregulated (Figure 2a,b). The DEGs were mainly related to the IL-17 signaling pathway, arachidonic acid (AA) metabolism, and the nucleotide-binding oligomerization domain-like receptors signaling pathway (Figure 2c). RT-PCR verified that the differential gene expression results coincided with the sequencing findings. Growth-regulated alpha protein precursor (CXCL1), interleukin-8 precursor (CXCL8), NF-kappa-B inhibitor alpha (NFKBIA), and cyclooxygenase 2 (COX2) were all significantly downregulated, and histone H1.3 (LOC101109397) was significantly upregulated (Figure 2d) in the overexpressing adipocytes compared to the controls. A total of 469 metabolites were detected in the metabolome. There were 20 differential metabolites, of which 19 were upregulated and 1 was downregulated (Figure 3a,b). The differential metabolites were mainly associated with the classification of eicosanoids, free FAs, lysophosphatidylcholine, acylcarnitine, ceramide, diglyceride, phosphatidylserine, and triglycerides (Figure 3c, Table 1). FFA(20:3) are activated to promote the synthesis of acly-CoA, generating acyl-CoA into the diglyceride, triglyceride synthesis pathway. All the indicators of diglycerides were increased in the metabolome sequencing, but the difference was not significant. Furthermore, total diglyceride content of the differentiated adipocytes was measured. The diglyceride content in the overexpressing ACSL1 adipocytes was higher than in the controls (Figure 3d). This result is consistent with the lipid metabolome sequencing findings.
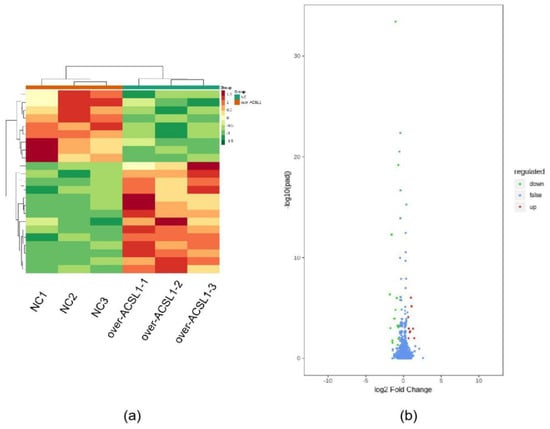
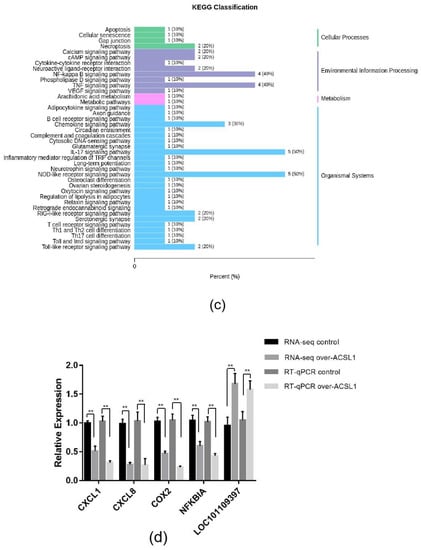
Figure 2.
Transcriptome sequencing: (a) heat map; (b) volcano plots; (c) KEGG analysis; (d) RNA-seq data and qRT-PCR of sheep adipocytes (* p < 0.05). NC: Adipocytes transfected with pcDNA3.1(+) vector as control. Over-ACSL1: Adipocytes transfected with pcDNA3.1(+) vector with ACSL1 CDS.
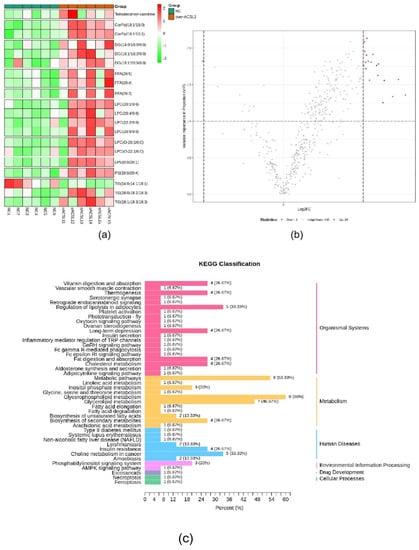
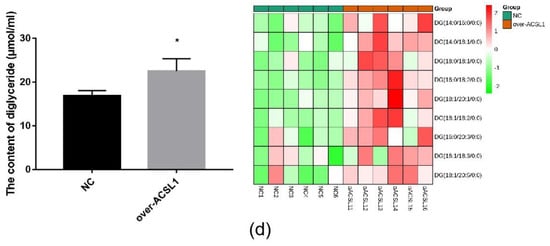
Figure 3.
Lipid metabolome sequencing: (a) heat map; (b) volcano plots; (c) KEGG analysis; (d) the detection of intracellular diglyceride content (* p < 0.05). NC: Adipocytes transfected with pcDNA3.1(+) vector as control. Over-ACSL1: Adipocytes transfected with pcDNA3.1(+) vector with ACSL1 CDS.

Table 1.
The differential metabolites in adipocytes overexpressing the ACSL1 gene compared with the controls.
2.3. Effect of the ACSL1 Gene on the AA Metabolic Pathway
Joint analysis revealed a correlation between DEGs and differential metabolites. These partly clustered the same signaling pathway (Figure 4a), and correlations between DEGs and differential metabolites were mapped (Figure 4b). Differential metabolites of AA and the DEG COX2 were found in the AA metabolic pathway. AA is an omega-6 polyunsaturated FA, which is a relative of saturated peanut acid in peanut oil. COX is an important enzyme in the metabolism of AA, and the metabolite of COX is prostaglandin (PG). In the lipid metabolome assay, the AA content [FFA (20:4) in Table 1] in the overexpression group was significantly higher than that in the control group. The mRNA expression of the COX2 gene, which is an important metabolism-related gene downstream of AA, was significantly lower in the overexpression group compared to the control group as shown by RNA-seq. Both RT-PCR and Western blotting verified this result (Figure 5a,b). Similarly, the expression trends of the ACSL1 and COX2 genes were found to be opposite during the differentiation of sheep adipocytes (Figure 5c–e).
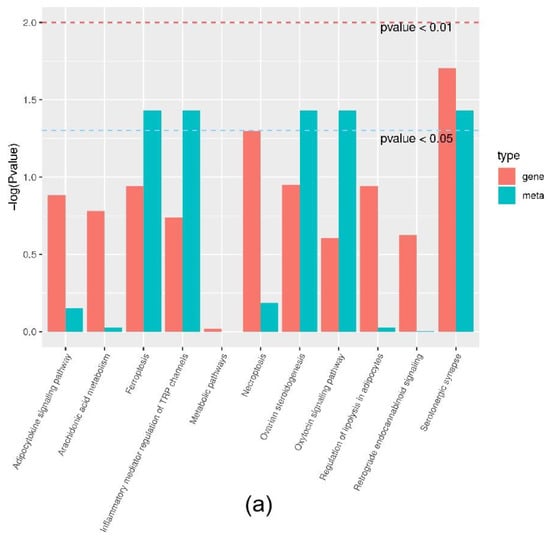
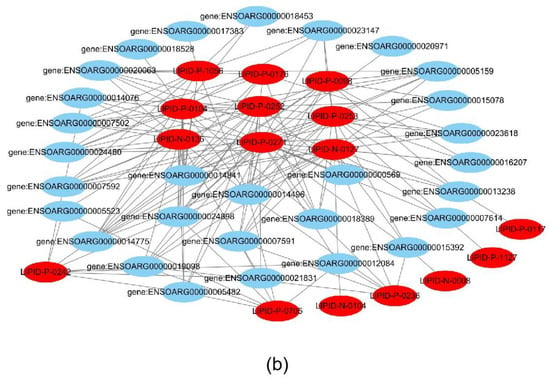
Figure 4.
Joint analysis results: (a) the classification histogram of pathways in which differentially expressed genes and differential metabolites were enriched in KEGG analysis; (b) correlation network diagram of differentially expressed genes and differential metabolites. Red: differential metabolites; Blue: differentially expressed genes.
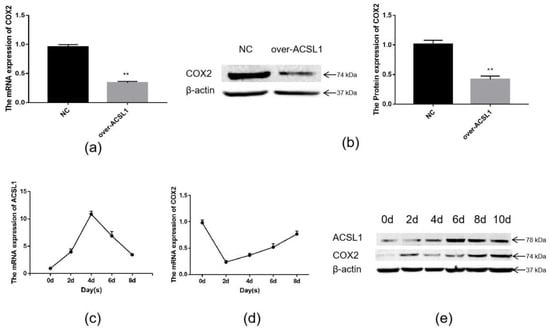
Figure 5.
The expression of ACSL1 and COX2: (a) (b) the mRNA and protein expression of COX2 in adipocytes with overexpression of the ACSL1 gene on day 8 after differentiation; (c) the mRNA expression of the ACSL1 in different stages of differentiation; (d) the mRNA expression of the COX2 gene in different stages of differentiation; (e) the protein expression of the ACSL1 and COX2 genes in different stages of differentiation; (* p < 0.05, ** p < 0.01). NC: Adipocytes transfected with the pcDNA3.1(+) vector as control. Over-ACSL1: Adipocytes transfected with the pcDNA3.1(+) vector with ACSL1 CDS.
To further verify the effect of the ACSL1 gene on AA metabolism, an ACSL1 shRNA inference vector was constructed. ShACSL1-1928 was transfected into preadipocytes, and cells were collected on day 8 after induction of differentiation. The mRNA expression of the ACSL1 gene was knocked down in the adipocytes (Figure 6b). The results showed that the mRNA expression of the COX2 gene significantly increased when the mRNA expression of the ACSL1 gene was decreased (Figure 6c). The results of Western blot were similar. The protein expression of ACSL1 decreased, and the protein expression of COX2 significantly increased (Figure 6d).
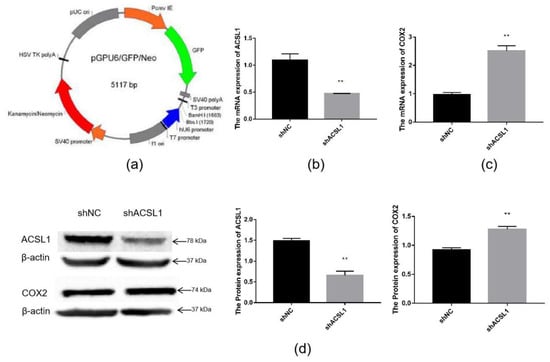
Figure 6.
Knockdown of the ACSL1 gene in sheep preadipocytes: (a) the pGPU6 vector; (b) ACSL1 mRNA expression on day 8 of differentiation (** p < 0.01); (c) COX2 mRNA expression on day 8 of differentiation (** p < 0.01); (d) ACSL1 and COX2 protein expression on day 8 of differentiation (** p < 0.01). shNC: Adipocytes transfected with shNC as control. shACSL1: Adipocytes transfected with shRNA-1928 of the ACSL1 gene.
Prostaglandins are downstream metabolites of AA, which is regulated by COX2. The AA and prostaglandin content were detected using an ELISA kit. Prostaglandin content in the overexpression group was slightly lower than the control group (Figure 7a). When ACSL1 was knocked down, AA content decreased, and prostaglandin content increased compared to the controls (Figure 7a,b).
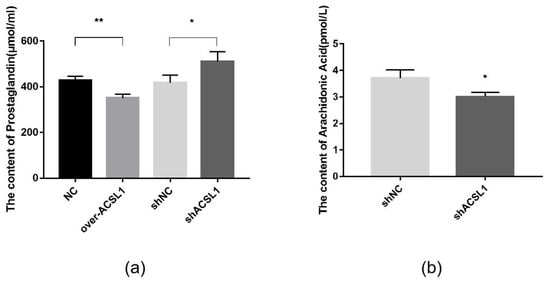
Figure 7.
(a) The detection of intracellular prostaglandin content (* p < 0.05, ** p < 0.01); (b) The detection of intracellular AA content (* p < 0.05). shNC: Adipocytes transfected with shNC as control. shACSL1: Adipocytes transfected with shRNA-1928 of the ACSL1 gene.
The combination of transcriptome and lipid metabolome analyses indicated that the differential metabolites associated with the COX2 gene were CerP (d18:1/16:0), LPC (20:1/0:0), CerP (d18:1/16:1), TG (18:0/18:2/18:3), LPC (O-20:1/0:0), LPC (O-22:1/0:0), and LPE (0:0/20:1) (Figure 8a). These findings suggest that changes in these metabolites may be caused by the overexpression of ACSL1, and there are some correlations between the expression of COX2 gene and these lipid metabolites. ShCOX2-1676 was transfected into preadipocytes, and cells were collected on day 8 after induction of differentiation. The mRNA expression of the COX2 gene was knocked down in the adipocytes (Figure 8b). The results of Western blot were similar (Figure 8c). When COX2 was knocked down, LPC content increased compared to the controls (Figure 8d).
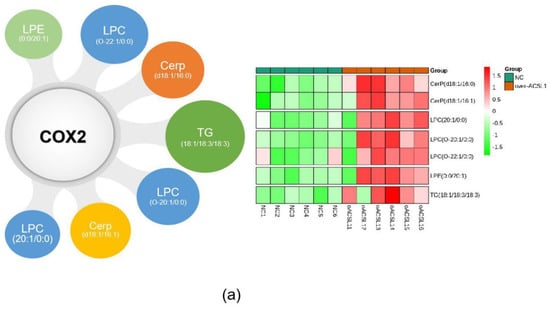
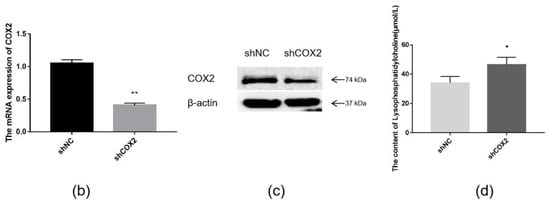
Figure 8.
(a) Joint analysis of differential metabolites associated with COX2; (b) COX2 mRNA expression on day 8 of differentiation (** p < 0.01); (c) COX2 protein expression on day 8 of differentiation; (d) the detection of intracellular LPC content (* p < 0.05). shNC: Adipocytes transfected with shNC as control. ShCOX2: Adipocytes transfected with shRNA-1676 of the COX2 gene.
2.4. Expression of Genes after Exogenous Addition of AA
Changes in the expression of the ACSL1 and COX2 genes and the effect of AA on sheep adipocytes were determined by increasing the content of AA exogenously. Adding different concentrations (50, 100, and 200 μΜ) of exogenous AA had roughly the same effect on adipocyte differentiation (Figure 9a). The expressions of ACSL1, COX2, PPARγ, and C/EBPα significantly increased in the experimental group. The mRNA expression of PPARγ upregulated almost three-fold compared to the controls. After adding AA, the expression levels of ACSL1, PPARγ, and C/EBPα in differentiating preadipocytes were significantly higher on days 0, 4, and 8 compared to the controls (Figure 9b–d). There was a significant change in PPARγ in the experimental group compared to the control group on day 4 of differentiation (Figure 9d). The expression level of COX2 in the AA group was significantly lower than the control group during the early stage of differentiation, whereas COX2 expression was higher than the control group after differentiation (Figure 9c).
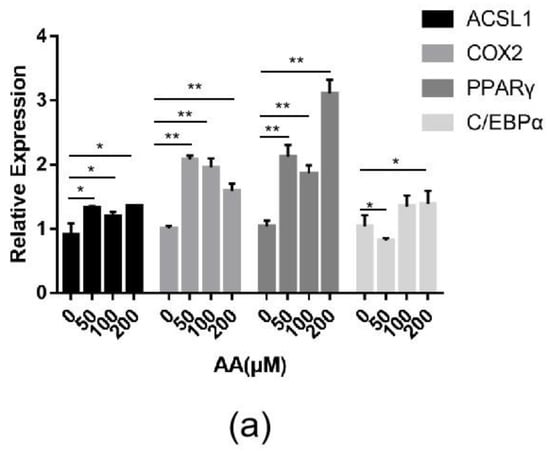
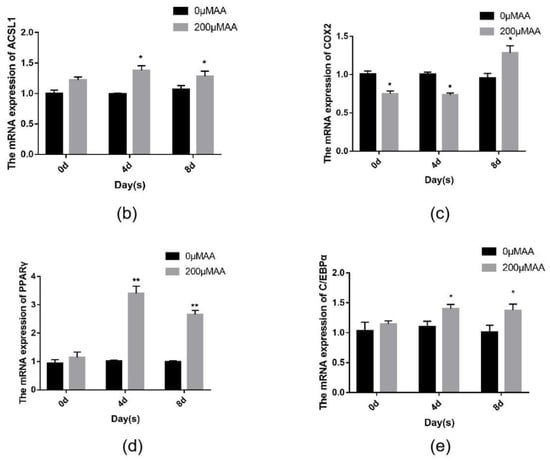
Figure 9.
(a) ACSL1, COX2, PPARγ, and C/EBPα mRNA expression levels in sheep adipocytes with different concentrations (50, 100, and 200 μΜ) of AA on the 9th day of differentiation; (b–e) ACSL1, COX2, PPARγ and C/EBPα mRNA expression levels in sheep adipocytes during different stages of differentiation (* p < 0.05, ** p < 0.01).
3. Discussion
Many lipid metabolism-related genes have been verified to be related to mutton quality, which is important for promoting the mutton sheep breeding industry. Molecular breeding has been widely used in the sheep industry, such as multi-fetal sheep breeding. The polymorphism of FecB, BMPR-IB, and BMP-15, which is a multiple breeding marker gene, plays an important role in multiple breeding [16,17]. Similarly, sheep can be used as a model to study disease. For example, sheep have been used as a model to demonstrate that maternal malnutrition can induce fetal lipid metabolism disorder and inhibit fetal metabolic development [18].
In the current study, the transcript of the ACSL1 gene in sheep adipocytes was obtained by rapid amplification of cDNA ends. The transcript used in this study contains a 3’UTR of 1570 bp. It has been previously shown that genes with longer 3’UTRs are more stable and less susceptible to activation [19,20], which may explain why the effect of this transcript on lipid metabolism-related genes in sheep adipocytes was not particularly significant. The 3’UTR may bind to microRNAs such as miR-205, which affects the expression of the ACSL1 gene [21]. In this study, overexpression of the ACSL1 gene caused changes in the expression of many genes that are involved in inflammation and immune-related metabolic pathways. Many inflammatory factors are also associated with muscle growth. Interleukin/chemokine receptors, Toll-like receptor members, and tumor necrosis factor receptor family members are all associated with Akt-mediated muscle growth [22]. RNA-seq showed that overexpression of ACSL1 causes some changes in genes involved in the immune pathway, suggesting that the ACSL1 gene may play an important role in some immune diseases such as lipid metabolism-related diseases and thus requires further investigation. Wang et al. found that the expression level of ACSL1 is significantly associated with the levels of various acyl-CoAs including C16:0-, C18:0-, C18:1-, and C18:2-CoA, triglycerides, and lipids in cancer cells and is elevated in prostate tumors [23]. They also found that the ACSL1 gene is highly expressed in breast cancer tissues and that the oncoprotein, HBXIP, can upregulate ACSL1 via the transcription factor, SP1 [24]. Aspirin inhibits abnormal lipid metabolism in HCC cells by disrupting NFκB-ACSL1 signaling [25]. These studies suggest that the ACSL1 gene may affect disease through lipid metabolism.
Metabolome profiling can detect all of the endogenous small molecules involved in metabolism and in maintaining the normal function and growth of the organism, especially small molecular substances with a molecular mass under 1000 kD. The lipid metabolome is a branch of the metabolome, which is an important part of animal and plant metabolism. The main role of the ACSL1 gene is to activate FAs to promote the synthesis of FA-CoA, while ester acyl-CoA is involved in the synthesis of diglycerides, triglycerides, glycerophospholipids, and beta oxidation of FAs. In the current study, the lipid metabolome profiling showed that FFA(20:3) is an important substrate for ACSL1 was activated and the diglyceride content was significantly upregulated. The results also showed the TG(18:1/18:3/18:3) and TG(18:0/18:2/18:3) triglyceride contents increased, whereas the TG(14:0/14:1/18:1) triglyceride content decreased. Thus, the total amount of triglycerides did not change. Similarly, the current study found that up-regulation of glycerophospholipids suggesting that the ACSL1 gene may play an important role in the synthesis of glycerophospholipids. Triglyceride synthesis in fat and liver tissues is mainly via the diglyceride pathway [26]. Diglyceride is also an important intermediate product of glycerophospholipids [27]. Triglycerides and glycerophospholipids can be synthesized by the diglyceride pathway, which indicates that the FA-CoA produced by the transcript of the ACSL1 gene is involved in the diglyceride synthesis pathway. Hepatocytes and adipocytes usually synthesize triglycerides via the diglyceride pathway [28]. Li et al. showed that overexpression of the ACSL1 gene can activate FA and transport FA to diglyceride and phospholipid synthesis but away from cholesterol ester synthesis [29]. ACSL1 promotes the transport of n-3 and n-6 FA in glycerophospholipids [30]. These studies indicate that the ACSL1 gene plays an important role in the activation of FFA and the synthesis of triglycerides, diglycerides, and glycerophospholipids.
In the lipid metabolome, the content of AA increased in the ACSL1 overexpression group. RNA-seq showed that the mRNA expression of COX2 was significantly lower in the overexpression group than the control group. It has been shown that AA inhibits the differentiation of preadipocytes via increases in COX1 and COX2 [31]. However, the relationship among ACSL1, COX2, and AA is not clear. Many studies have shown that the COX2 gene is involved in the differentiation of adipocytes. Both COX subtypes are involved in the negative regulation of adipocyte differentiation [32]. The products of COX, PGE2, and PGF2 inhibit adipocyte differentiation. In the presence of indomethacin, a COX inhibitor, intracellular TG content was found to be significantly higher than in controls [31]. Tumor necrosis factor has also been found to upregulate the expression of COX2 in differentiating 3T3-L1 adipocytes. Inhibition of COX2 activity restores TNF-inhibited differentiation, suggesting that COX2 plays an important role in adipocyte differentiation that can mediate TNF signaling [33]. However, some studies have shown that 3T3-L1 cells cannot differentiate normally after the addition of COX2 inhibitors, and COX2 may play an important role in the early stage of cell differentiation [34]. When COX2 was knocked down, intracellular LPC content increased compared to the controls. The down-regulation of the COX2 gene may have a role in the process of up-regulation of LPC. Studies have shown that LPC is regulated by COX2 expression in vascular endothelial cells [35]. Moreover, ceramide-induced increase in COX2 transcription is mediated through higher NF-κB activation [36]. Therefore, COX2 gene plays an important role in lipid metabolism.
AA plays a major role in regulating lipid metabolism-related genes [37]. AA is widely distributed in the animal kingdom, a small amount in glycerides and also in glycerophospholipids [18]. In previous studies, ACSL4, which is a member of the ACSL family, was thought to be involved in AA metabolism [38,39]. In the current study, the expression of the cell fat marker gene PPARγ significantly increased after the addition of exogenous AA, suggesting that exogenous AA may promote lipogenesis. Dervishi found that changes in FAs during the feeding process affected changes in mRNAs of the lipid metabolism-related genes, which affected the intramuscular FA content [40]. The content of spirulina in the feed can alter intramuscular fat accumulation in sheep. At the same time, it changed the expression levels of BTG2, ADRB3, and FASN in adipose tissues [41]. According to the above research, AA promotes the formation of intermuscular fat, and thus AA may be added to the feed.
The content of AA increased, and the expression of COX2 was significantly lower in the ACSL1 overexpression group. The current study also observed a decrease in prostaglandin content, which is the AA downstream metabolite, indicating that the COX2 metabolic pathway was inhibited and affected the metabolism of AA. This indicates that the increase in AA content is due to the accumulation of blocked metabolites caused by ACSL1 and COX2. At the same time, ACSL1 gene interference vector was constructed to verify the results of overexpression of ACSL1 gene. All results prove that the increase in AA content is because the overexpression of ACSL1 gene reduces the expression of COX2 and the AA metabolic pathway is blocked. According to the above results, the main role of the ACSL1 gene is to activate FAs to promote the synthesis of acyl-CoA, while acyl-CoA is involved in the synthesis of diglycerides, triglycerides, and glycerophospholipids, and ACSL1 regulates the content of AA in adipocytes through COX2. It is not clear how the acly-CoA generated by ACSL1 enters the specific pathway, which is worth further study.
4. Materials and Methods
4.1. Cell Culture and Sheep Preadipocyte Differentiation
Sheep preadipocytes were separated from the adipose tissues of a 40-day-old sheep. Adipose tissues were collected from the alar of the sheep. The tissues were washed and dissociated using 4% collagenase II (Sigma, St. Louis, MO, USA). All cells were maintained at 37 °C with 5% CO2 in DMEM supplemented with 10% FBS and 1% penicillin-streptomycin.
The sheep preadipocytes were induced using the classic cocktail method. When the cells reached confluency (Day 0), these were induced with 10 μg/mL insulin (Sigma), 0.5 mM IBMX (Sigma), and 1 mM Dex (Sigma) for 48 h. The medium was then replaced with inducing medium II, a complete medium with 10 μg/mL insulin. After 48 h, the medium was changed to complete medium and then replaced every 48 h until the cells fully differentiated into mature adipocytes.
4.2. Construction of ACSL1 Gene Vector
ORF Finder was used to find the ORF region of a known sequence, and then these were submitted to NEBcutter V2.0 for analysis. Primers were designed for the restriction sites BamHI and EcoRI using the following sequences: F: 5’-GAGGATCCAGCCATGATGCAAGCCCACGAGCTGTT-3’, R: 5’-GTAGAATTCTTAGACTTTGATGGTGGAGTAAAGC-3’ at the two ends of the ORF region, and the corresponding sequences were added for primer synthesis. T4 ligase was used to ligate the target fragment to the pcDNA3.1(+) vector and sequence.
The ShRNA vector of shACSL1-1928: GGAAGGAGTCTGGCCTGAAAC and shCOX2-1676: GCTGTCCCTTTACCTCATTCA was synthesized by a biological company and ligated to the pGPU6 vector and sequence.
4.3. Cell Transfection and Sample Collection
The overexpression vector (1 μg) of ACSL1 was transfected into 1 × 10⁶ preadipocytes by Fugene (Promega, WI, USA). The ratio of vector to transfection reagent is 1:3. Stand for 10 min after mixing, add to the cells gently, and change the medium after 24 h. When the cells had fully differentiated into mature adipocytes on day 8, these were immediately washed with PBS. One milliliter of TRIzol (Thermo Scientific, Waltham, MA, USA) was added to six-well plates and pipetted repeatedly. The cells were then transferred to a 1.5-mL RNase-free centrifuge tube and flash-frozen in liquid nitrogen for subsequent RNA-seq.
At least 107 cells were used in lipid metabolome analysis. The cells were trypsinized or scraped off the plate and then transferred into an EP tube. The supernatant was aspirated out, and the collected cells were washed with pre-cooled PBS and stored at −80 °C.
ShRNA vector (1 μg) of ACSL1 and shRNA vector (1 μg) of COX2 was transfected into 1 × 10⁶ preadipocytes by Fugene. Transfection method is the same as the overexpression vector. The cells were collected when these had fully differentiated into mature adipocytes on day 8.
4.4. Sequencing and Data Analysis
A total amount of 3 µg RNA per sample was used as input material for the RNA-seq sample preparations. In the CBOT cluster generation system, the truseq PE cluster toolkit v3-cbot-hs is used to cluster the index coding samples. After the cluster generation, the library preparation is sequenced on the Illumina hiseq platform to generate 125 bp/150 bp paired end reading.
Extraction of intracellular lipids for Metabonomic sequencing. The sample extracts were analyzed using a liquid chromatography-mass spectrometry (LC-MS) system [42].
All data analysis was based on the self-built database MWDB (Metware Biotechnology Co., Ltd. Wuhan, China).
Differential gene expression analysis of two groups (two biological replicates per condition) was performed using the DESeq R package (1.18.0). Genes with an adjusted p-value < 0.05 found by DESeq were assigned as differentially expressed.
The results of hierarchical cluster analysis (HCA) of the samples and metabolites were presented as heat maps with dendrograms, whereas Pearson correlation coefficients (PCC) between samples were calculated using the cor function in R and presented as heat maps. Both HCA and PCC were conducted using R package pheatmap. For HCA, normalized signal intensities of metabolites (unit variance scaling) are visualized as a color spectrum.
LC-MS analyses were performed as previously described. Metabolites with a variable important in projection (VIP) ≥1 and fold change ≥1.4 or ≤−1.4 were considered statistically significantly different. VIP values were extracted from the OPLS-DA results, which also contain score plots and permutation plots, and generated using the R package MetaboAnalystR.
Identified genes and metabolites were annotated using KEGG Compound database (http://www.kegg.jp/kegg/compound/); annotated genes and metabolites were then mapped to the KEGG Pathway database (http://www.kegg.jp/kegg/pathway.html). Pathways with significantly regulated genes and metabolites were then fed into metabolite set enrichment analysis (MSEA), and their significance was determined by the hypergeometric test’s p-values.
For joint analysis, we selected DEGs and differential metabolites enriched in metabolic pathways with Pearson coefficients (PCCs) ≥0.8.
4.5. Detection of Triglyceride Content
The differentiated adipocytes were collected on day 8, and 100 μL of the cell lysate per 1 × 10⁶ cells were added. Intracellular triglyceride content was determined using the triglyceride kit (Beyotime, Beijing, China), and the OD value was measured at a wavelength of 450 nm. The standard curve was used to calculate intracellular triglyceride content.
4.6. Oil Red O Staining
The mature adipocytes were washed three times with PBS, fixed in 4% paraformaldehyde and stained with 60% Oil red O solution (Oil red O: isopropanol 3:2, Sigma).
4.7. Quantitative Real-Time PCR Analysis
Total RNA of the overexpression and control groups was extracted using TRIzol and reverse transcribed into cDNA (Takara, Tokyo, Japan). Quantitative real-time PCR (qRT-PCR) amplification was performed with SYBR Premix Ex Taq using a Roche 480 LightCycler for analysis of gene expression. The expression of genetic mRNA was analyzed using the 2−ΔΔCt method and normalized to β-actin. Primers are shown in Table 2.

Table 2.
Primers for quantitative real-time polymerase chain reaction.
4.8. Western Blotting
The cells were collected using protein lysis buffer (RIPA, Thermo Scientific), and total protein concentrations were determined using an Enhanced BCA Protein Assay Kit (Beyotime, Beijing, China). The protein samples were denatured at 95 °C for 10 min, separated in a 12% SDS-PAGE gel and transferred to a polyvinylidene difluoride (PVDF) membrane for 90 min at 200 mA. The membranes were washed thrice with TBST and then blocked using 5% skimmed milk at room temperature for 2 h. The samples were incubated with a primary antibody (ACSL1, Bioss, 1:1,000; COX2, Abcam, 1:500) overnight at 4 °C and with the corresponding secondary antibody (β-actin, CST, 1:2,000) for 1.5 h at room temperature. Membranes were washed thrice with TBST and luminescence treated using the ECL-Plus Kit (Beyotime).
4.9. ELISA
An ELISA kit (mlbio, Shanghai, China) was used to determine the total PGs, AA, LPC, and diglyceride content. The kit assesses sheep PG (AA, LPC, Diglyceride) levels in the sample using purified sheep PG (AA, LPC, Diglyceride) antibodies to coat the microtiter plate wells to generate solid-phase antibodies. Then, PG (AA, LPC, Diglyceride) was added to the wells, and the combined PG (AA, LPC, Diglyceride) antibody was HRP-labeled to form an antibody-antigen-enzyme-antibody complex. After washing completely, a TMB substrate solution was added. The TMB substrate became blue in color via HRP enzyme catalysis, and the reaction was terminated by the addition of a sulphuric acid solution; the color change was measured spectrophotometrically at a wavelength of 450 nm. The concentration of sheep PG (AA, LPC, Diglyceride) in the samples was then determined by comparing the OD of the samples to the standard curve. All data are reported as the mean by comparing the OD of the sample to the standard curve. Differences with p < 0.05 were considered to be statistically significant.
4.10. Differentiation of Sheep Preadipocytes with Arachidonic Acid
Different concentrations of AA (Abcam) (50, 100, and 200 μM) were added before the cells were induced. AA was added with complete medium during the entire induction process, DMSO was added as control, and the cells were collected when fully differentiated into mature adipocytes.
Approximately 200 μM AA were added 48 h before the cells were induced; the cells were then collected on days 0, 4, and 8 of induction.
4.11. Statistical Analyses
Three independent biological experiments were conducted and measured, and the corresponding means were calculated. All data are reported as the mean ± SEM, and all statistical analyses were performed using the Student’s t test. Differences with a value of p < 0.05 were considered statistically significant.
5. Conclusions
In this study, triglyceride content did not increase after overexpression of the ACSL1 gene. However, the content of diglyceride, which is involved in the overexpression of ACSL1-induced synthesis of fatty acyl-CoA, significantly increased. Changes in the ACSL1 gene affected COX2 gene expression, thereby influencing AA metabolism.
Author Contributions
Y.C. and Z.L. designed the experiments. Y.C., H.M., Y.W., X.L., and C.X. performed the study. S.L. analyzed the data. Y.C. and S.W. wrote the paper. H.J. edited and revised the manuscript. All authors have read and agreed to the published version of the manuscript.
Acknowledgments
The research was supported by the National Natural Science Foundation of Jilin province (20190201161JC), National Transgenic Creature Breeding Grand Project (2016ZX08008-003) and China Agriculture Reach System of Mutton Sheep (CARS38). We thank LetPub (www.letpub.com) for its linguistic assistance during the preparation of this manuscript.
Conflicts of Interest
The authors declare that they have no competing interests.
References
- Paul, D.S.; Grevengoed, T.J.; Pascual, F.; Ellisa, J.M.; Willis, M.S.; Coleman, R.A. Deficiency of cardiac Acyl-CoA synthetase-1 induces diastolic dysfunction, but pathologic hypertrophy is reversed by rapamycin. Biochim. Et Biophys. Acta (Bba)-Mol. Cell Biol. Lipids 2014, 1841, 880–887. [Google Scholar] [CrossRef]
- Pan, Z.; Lu, J.; Lu, L.; Wang, J. Cloning of Goose ACSL1 Gene and Its Role in the Formation of Goose Fatty Liver. Journal of Animal Husbandry and Veterinary Medicine 2010, 11, 1407–1413. [Google Scholar]
- Yue, B. Correlation Analysis between ACSL1 Gene Polymorphism and Liver Performance in Landes Goose; Shihezi University: Xinjiang, China, 2013. [Google Scholar]
- Ellis, J.M.; Li, L.O.; Wu, P.C.; Koves, T.R.; Ilkayeva, O.; Stevens, R.D.; Watkins, S.M.; Muoio, D.M.; Coleman, R.A. Adipose acyl-CoA synthetase-1 directs fatty acids toward β-oxidation and is required for cold thermogenesis. Cell Metab. 2010, 12, 53–64. [Google Scholar] [CrossRef]
- Mashek, D.G.; Li, L.O.; Coleman, R.A. Long-chain acyl-CoA synthetases and fatty acid channeling. Future Lipidol. 2007, 2, 465–476. [Google Scholar] [CrossRef]
- Widmann, P.; Nuernberg, K.; Kuehn, C.; Weikard, R. Association of an ACSL1 gene variant with polyunsaturated fatty acids in bovine skeletal muscle. BMC Genet. 2011, 12, 96. [Google Scholar] [CrossRef]
- Chiu, H.C.; Kovacs, A.; Ford, D.A.; Hsu, F.F.; Garcia, R.; Herrero, P.; Saffitz, J.E.; Schaffer, J.E. A novel mouse model of lipotoxic cardiomyopathy. J. Clin. Investig. 2001, 107, 813–822. [Google Scholar] [CrossRef]
- Marra, C.A.; de Alaniz, M.J.T. Acyl-CoA synthetase activity in liver microsomes from calcium-deficient rats. Lipids 1999, 34, 343–354. [Google Scholar] [CrossRef]
- Suzuki, H.; Kawarabayasi, Y.; Kondo, J.; Abe, T.; Nishikawa, T.; Kimura, S.; Hashimoto, T.; Yamamoto, T. Structure and Regulation of Rat Long-chain Acyl-CoA Synthetase. J. Biol. Chem. 1990, 265, 8681–8685. [Google Scholar]
- Joseph, R.; Poschmann, J.; Sukarieh, R.; Too, P.G.; Julien, S.G.; Xu, F.; Teh, A.L.; Holbrook, J.D.; Ng, K.L.; Chong, Y.S.; et al. ACSL1 is associated with fetal programming of insulin sensitivity and cellular lipid content. Mol. Endocrinol. 2015, 29, 909–920. [Google Scholar] [CrossRef]
- Ren, G.; Kim, J. 1786-P: ACSL1 Contributes to Thermogenesis and Differentiation of Brown Adipose Tissue. Diabetes 2019, 68. [Google Scholar] [CrossRef]
- Ellis, J.M.; Wu, P.C.; Li, L.; Coleman, R.A. Acyl-CoA Synthetase-isoform 1 (ACSL1) is essential for FA oxidation in adipose tissue: Lessons from adipose-specific knockout of ACSL1. Nutrition 2009, 23, 343. [Google Scholar]
- Simopoulos, A.P. An increase in the omega-6/omega-3 fatty acid ratio increases the risk for obesity. Nutrients 2016, 8, 128. [Google Scholar] [CrossRef] [PubMed]
- Farmer, L.J. The role of nutrients in meat flavour formation. Proc. Nutr. Soc. 1994, 53, 327–333. [Google Scholar] [CrossRef] [PubMed]
- Cao, Y.; Jin, H.G.; Ma, H.H.; Zhao, Z. Comparative analysis on genome-wide DNA methylation in longissimus dorsi muscle between Small Tailed Han and Dorper× Small Tailed Han crossbred sheep. Asian-Australas. J. Anim. Sci. 2017, 30, 1529–1539. [Google Scholar] [CrossRef]
- Chu, M.X.; Liu, Z.H.; Jiao, C.L.; He, Y.Q.; Fang, L.; Ye, S.C.; Chen, Y.G.; Wang, Y.G. Mutations in BMPR-IB and BMP-15 genes are associated with litter size in Small Tailed Han sheep (Ovis aries)1. Journal of Animal Science 2007, 85, 598–603. [Google Scholar] [CrossRef]
- Amr AEL-Hanafy, M.A. El-Saadani. Fingerprinting of Fecb Gene in Five Egyptian Sheep Breeds. Biotechnol. Anim. Husb. 2009, 25, 205–212. [Google Scholar]
- Xue, Y.; Guo, C.; Hu, F.; Zhu, W.; Mao, S. Maternal undernutrition induces fetal hepatic lipid metabolism disorder and affects the development of fetal liver in a sheep model. FASEB J. 2019, 33, 9990–10004. [Google Scholar] [CrossRef]
- Mayr, C.; Bartel, D.P. Widespread shortening of 3’UTRs by alternative cleavage and polyadenylation activates oncogenes in cancer cells. Cell 2009, 138, 673–684. [Google Scholar] [CrossRef]
- Vargas, T.; Moreno-Rubio, J.; Herranz, J.; Cejas, P.; Molina, S.; Mendiola, M.; Burgos, E.; Custodio, A.B.; De Miguel, M.; Martin-Hernandez, R.; et al. 3′UTR polymorphism in ACSL1 gene correlates with expression levels and poor clinical outcome in colon cancer patients. PLoS ONE 2016, 11, e0168423. [Google Scholar] [CrossRef]
- Cui, M.; Wang, Y.; Sun, B.; Xiao, Z.; Ye, L.; Zhang, X. MiR-205 modulates abnormal lipid metabolism of hepatoma cells via targeting acyl-CoA synthetase long-chain family member 1 (ACSL1) mRNA. Biochem. Biophys. Res. Commun. 2014, 444, 270–275. [Google Scholar] [CrossRef]
- Wu, C.L.; Satomi, Y.; Walsh, K. RNA-seq and metabolomic analyses of Akt1-mediated muscle growth reveals regulation of regenerative pathways and changes in the muscle secretome. Bmc Genom. 2017, 18, 181. [Google Scholar] [CrossRef] [PubMed]
- Wang, Y.; Ma, S.; Ruzzo, W.L. Spatial modeling of prostate cancer metabolism reveals extensive heterogeneity and selective vulnerabilities. BioRxiv 2019, 719294. [Google Scholar] [CrossRef]
- Wang, Y.; Cai, X.; Zhang, S.; Cui, M.; Liu, F.; Sun, B.; Zhang, W.; Zhang, X.; Ye, L. HBXIP up-regulates ACSL1 through activating transcriptional factor Sp1 in breast cancer. Biochem. Biophys. Res. Commun. 2017, 484, 565–571. [Google Scholar] [CrossRef] [PubMed]
- Yang, G.; Wang, Y.; Feng, J.; Liu, Y.; Wang, T.; Zhao, M.; Ye, L.; Zhang, X. Aspirin suppresses the abnormal lipid metabolism in liver cancer cells via disrupting an NFκB-ACSL1 signaling. Biochem. Biophys. Res. Commun. 2017, 486, 827–832. [Google Scholar] [CrossRef]
- Choi, S.S.; Diehl, A.M. Hepatic triglyceride synthesis and nonalcoholic fatty liver disease. Curr. Opin. Lipidol. 2008, 19, 295. [Google Scholar] [CrossRef]
- Roberti, R.; Binaglia, L.; Porcellati, G. Synthesis of molecular species of glycerophospholipids from diglyceride-labeled brain microsomes. J. Lipid Res. 1980, 21, 449–454. [Google Scholar]
- Gluchowski, N.L.; Becuwe, M.; Walther, T.C.; Farese, R.V. Lipid droplets and liver disease: From basic biology to clinical implications. Nat. Rev. Gastroenterol. Hepatol. 2017, 14, 343. [Google Scholar] [CrossRef]
- Li, L.O.; Mashek, D.G.; An, J.; Doughman, S.D.; Newgard, C.B.; Coleman, R.A. Overexpression of rat long chain acyl-CoA synthetase 1 alters fatty acid metabolism in rat primary hepatocytes. J. Biol. Chem. 2006, 281, 37246–37255. [Google Scholar] [CrossRef]
- Farooqui, A.A. Transport, synthesis, and incorporation of n–3 and n–6 fatty acids in brain glycerophospholipids. In Beneficial Effects of Fish Oil on Human Brain; Springer: New York, NY, USA, 2009; pp. 47–78. [Google Scholar]
- Petersen, R.K.; Jørgensen, C.; Rustan, A.C.; Frøyland, L.; Muller-Decker, K.; Furstenberger, G.; Berge, R.K.; Kristiansen, K.; Madsen, L. Arachidonic acid-dependent inhibition of adipocyte differentiation requires PKA activity and is associated with sustained expression of cyclooxygenases. J. Lipid Res. 2003, 44, 2320–2330. [Google Scholar] [CrossRef]
- Inazumi, T.; Shirata, N.; Morimoto, K.; Takano, H.; Segi-Nishida, E.; Sugimoto, Y. Prostaglandin E2-EP4 signaling suppresses adipocyte differentiation in mouse embryonic fibroblasts via an autocrine mechanism. J. Lipid Res. 2011, 52, 1500–1508. [Google Scholar] [CrossRef]
- Fajas, L.; Miard, S.; Briggs, M.R.; Auwerx, J. Selective cyclo-oxygenase-2 inhibitors impair adipocyte differentiation through inhibition of the clonal expansion phase. J. Lipid Res. 2003, 44, 1652–1659. [Google Scholar] [CrossRef] [PubMed]
- Yan, H.; Kermouni, A.; Abdel-Hafez, M.; Lau, D.C.W. Role of cyclooxygenases COX-1 and COX-2 in modulating adipogenesis in 3T3-L1 cells. J. Lipid Res. 2003, 44, 424–429. [Google Scholar] [CrossRef] [PubMed]
- Brkić, L.; Riederer, M.; Graier, W.F.; Malli, R.; Frank, S. Acyl chain-dependent effect of lysophosphatidylcholine on cyclooxygenase (COX)-2 expression in endothelial cells. Atherosclerosis 2012, 224, 348–354. [Google Scholar] [CrossRef] [PubMed]
- Wu, D.; Marko, M.; Claycombe, K.; Meydani, S.N. Ceramide-induced and age-associated increase in macrophage COX-2 expression is mediated through up-regulation of NF-κB activity. J. Biol. Chem. 2003, 278, 10983–10992. [Google Scholar] [CrossRef]
- Vaidya, H.; Cheema, S.K. Arachidonic acid has a dominant effect to regulate lipogenic genes in 3T3-L1 adipocytes compared to omega-3 fatty acids. Food Nutr. Res. 2015, 59, 25866. [Google Scholar] [CrossRef]
- Kan, C.F.K.; Singh, A.B.; Stafforini, D.M.; Azhar, S.; Liu, J. Arachidonic acid downregulates acyl-CoA synthetase 4 expression by promoting its ubiquitination and proteasomal degradation. J. Lipid Res. 2014, 55, 1657–1667. [Google Scholar] [CrossRef]
- Kuwata, H.; Hara, S. Role of acyl-CoA synthetase ACSL4 in arachidonic acid metabolism. Prostaglandins Other Lipid Mediat. 2019, 144, 106363. [Google Scholar] [CrossRef]
- Dervishi, E.; Serrano, C.; Joy, M.; Serrano, M.; Calvo, J.H. The effect of feeding system in the expression of genes related with fat metabolism in semitendinous muscle in sheep. Meat Sci. 2011, 89, 91–97. [Google Scholar] [CrossRef]
- Kashani, A.; Holman BW, B.; Nichols, P.D.; Malau, A.E.O. Effect of dietary supplementation with Spirulina on the expressions of AANAT, ADRB3, BTG2 and FASN genes in the subcutaneous adipose and Longissimus dorsi muscle tissues of purebred and crossbred Australian sheep. J. Anim. Sci. Technol. 2015, 57, 8. [Google Scholar] [CrossRef]
- Chen, Y.; Zhang, R.; Song, Y.; He, J.; Sun, J.; Bai, J.; An, Z.; Dong, L.; Zhan, Q.; Abliz, Z. RRLC-MS/MS-based metabonomics combined with in-depth analysis of metabolic correlation network: Finding potential biomarkers for breast cancer. Analyst 2009, 134, 2003. [Google Scholar] [CrossRef]
© 2020 by the authors. Licensee MDPI, Basel, Switzerland. This article is an open access article distributed under the terms and conditions of the Creative Commons Attribution (CC BY) license (http://creativecommons.org/licenses/by/4.0/).