Article

LY75 Ablation Mediates Mesenchymal-Epithelial Transition (MET) in Epithelial Ovarian Cancer (EOC) Cells Associated with DNA Methylation Alterations and Suppression of the Wnt/β-Catenin Pathway

by
Sadia Mehdi
1,2,
Magdalena Bachvarova
2,
Marie-Pier Scott-Boyer
2,
Arnaud Droit
1,2 and
Dimcho Bachvarov
1,2,*
1
Department of Molecular Medicine, Université Laval, Québec, QC PQ G1V 0A6, Canada
2
Research Center of Quebec CHU-Université Laval, Québec, QC PQ G1E6W2, Canada
*
Author to whom correspondence should be addressed.
Int. J. Mol. Sci. 2020, 21(5), 1848; https://doi.org/10.3390/ijms21051848
Submission received: 29 January 2020 / Revised: 26 February 2020 / Accepted: 5 March 2020 / Published: 7 March 2020
(This article belongs to the Special Issue The Wnt Signaling Pathway in Cancer)

Abstract

:
Growing evidence demonstrates that epithelial–mesenchymal transition (EMT) plays an important role in epithelial ovarian cancer (EOC) progression and spreading; however, its molecular mechanisms remain poorly defined. We have previously shown that the antigen receptor LY75 can modulate EOC cell phenotype and metastatic potential, as LY75 depletion directed mesenchymal–epithelial transition (MET) in EOC cell lines with mesenchymal phenotype. We used the LY75-mediated modulation of EMT as a model to investigate for DNA methylation changes during EMT in EOC cells, by applying the reduced representation bisulfite sequencing (RRBS) methodology. Numerous genes have displayed EMT-related DNA methylation patterns alterations in their promoter/exon regions. Ten selected genes, whose DNA methylation alterations were further confirmed by alternative methods, were further identified, some of which could represent new EOC biomarkers/therapeutic targets. Moreover, our methylation data were strongly indicative for the predominant implication of the Wnt/β-catenin pathway in the EMT-induced DNA methylation variations in EOC cells. Consecutive experiments, including alterations in the Wnt/β-catenin pathway activity in EOC cells with a specific inhibitor and the identification of LY75-interacting partners by a proteomic approach, were strongly indicative for the direct implication of the LY75 receptor in modulating the Wnt/β-catenin signaling in EOC cells.

1. Introduction

Epithelial ovarian cancer (EOC) accounts for 5% of all cancers in women and is the leading cause of death from gynecologic malignancies [1,2]. Despite treatment improvements, long-term survival rates for patients with advanced disease remain disappointing [3]. EOC lethality primarily stems from the inability to detect the disease at an early, organ-confined stage, and the lack of effective therapies for advanced-stage disease (e.g., metastasis) [4]. Indeed, despite advances in cytotoxic therapies [5,6], only 30% of patients with advanced-stage EOC survive 5 years after initial diagnosis [4]. One way to resolve this problem is to target metastasis-specific pathways with novel therapies. Hence, focused identification of novel prometastatic EOC pathways and molecules could improve the chances of discovering new and more effective EOC therapies [4].
Metastasis is a complex multistep process in the progression of cancer, causing approximately 90% of all human cancer mortalities [7]. To colonize a distant secondary site, cancer cells undergo epithelial–mesenchymal transition (EMT) characterized by the suppression of epithelial markers E-cadherin and EpCAM and acquisition of migratory capacity, pivotal for invasion and metastasis. Although EMT is clearly important to tumor progression, it is inconsistent with the observation that metastatic lesions mostly exhibit epithelial phenotypes, thus suggesting that mesenchymal–epithelial transition (MET) is critical to the latter stages of metastasis [7]. EMT has emerged as a key regulator of various biological processes implicated in embryogenesis, organ fibrosis, and cancer metastasis [8], including EOC dissemination [9,10,11]; however, the molecular mechanisms sustaining this process in EOC remain poorly defined. Both EMT and MET involve widespread reprogramming of gene expression and as recently shown, epigenetic mechanisms, that include post-translational histone modifications, noncoding RNAs (ncRNA), and DNA methylation could play important roles in these processes [12,13,14].
We have previously shown that the antigen receptor LY75 (also known as DEC205/CD205) can modulate EOC cell phenotype and metastatic potential [7]. Indeed, LY75 depletion directed MET in EOC cell lines with mesenchymal-like phenotype (SKOV3 and TOV112), associated with the induction of the expression of the epithelial markers E-cadherin, EpCAM, and EMP1 and loss of expression of the mesenchymal markers N-cadherin, TWIST1, FN1, and SNAIL1 [7]. Moreover, re-expression of a shRNA-resistant LY75 gene variant in the LY75 knockdown SKOV3 clones (SKOV3-shR) completely restored the initial mesenchymal phenotype and re-established the SKOV3 parental pattern of mesenchymal markers’ expression [7].
In the present study, we used the LY75-mediated modulation of EMT in EOC cells as a model to investigate DNA methylation changes during EMT in EOC cells. We applied the reduced representation bisulfite sequencing (RRBS) approach, a bisulfite-based cost-effective protocol that enriches CpG-dense regions of the genome, thus reducing the amount of sequencing required, while capturing the majority of promoters and other relevant genomic regions [15]. This approach led to the identification of numerous genes showing altered DNA methylation patterns following LY75-mediated EMT alterations in SKOV3 cells. Some of these genes could be implicated in EOC progression and/or could represent new EOC therapeutic targets. Consecutive Ingenuity Pathway Analysis (IPA) of the methylation data was strongly indicative for the predominant implication of the Wnt/β-catenin signaling pathway in the EMT-induced DNA methylation variations in EOC cells mediated by the LY75 expression changes. Consecutive experiments, including alterations in the Wnt/β-catenin signaling activity in EOC cells with the use of a specific inhibitor, and the identification of LY75-interacting partners by a proteomic approach, were strongly indicative for the direct role of LY75 in modulating the Wnt/β-catenin pathway activity in EOC cells.

2. Results

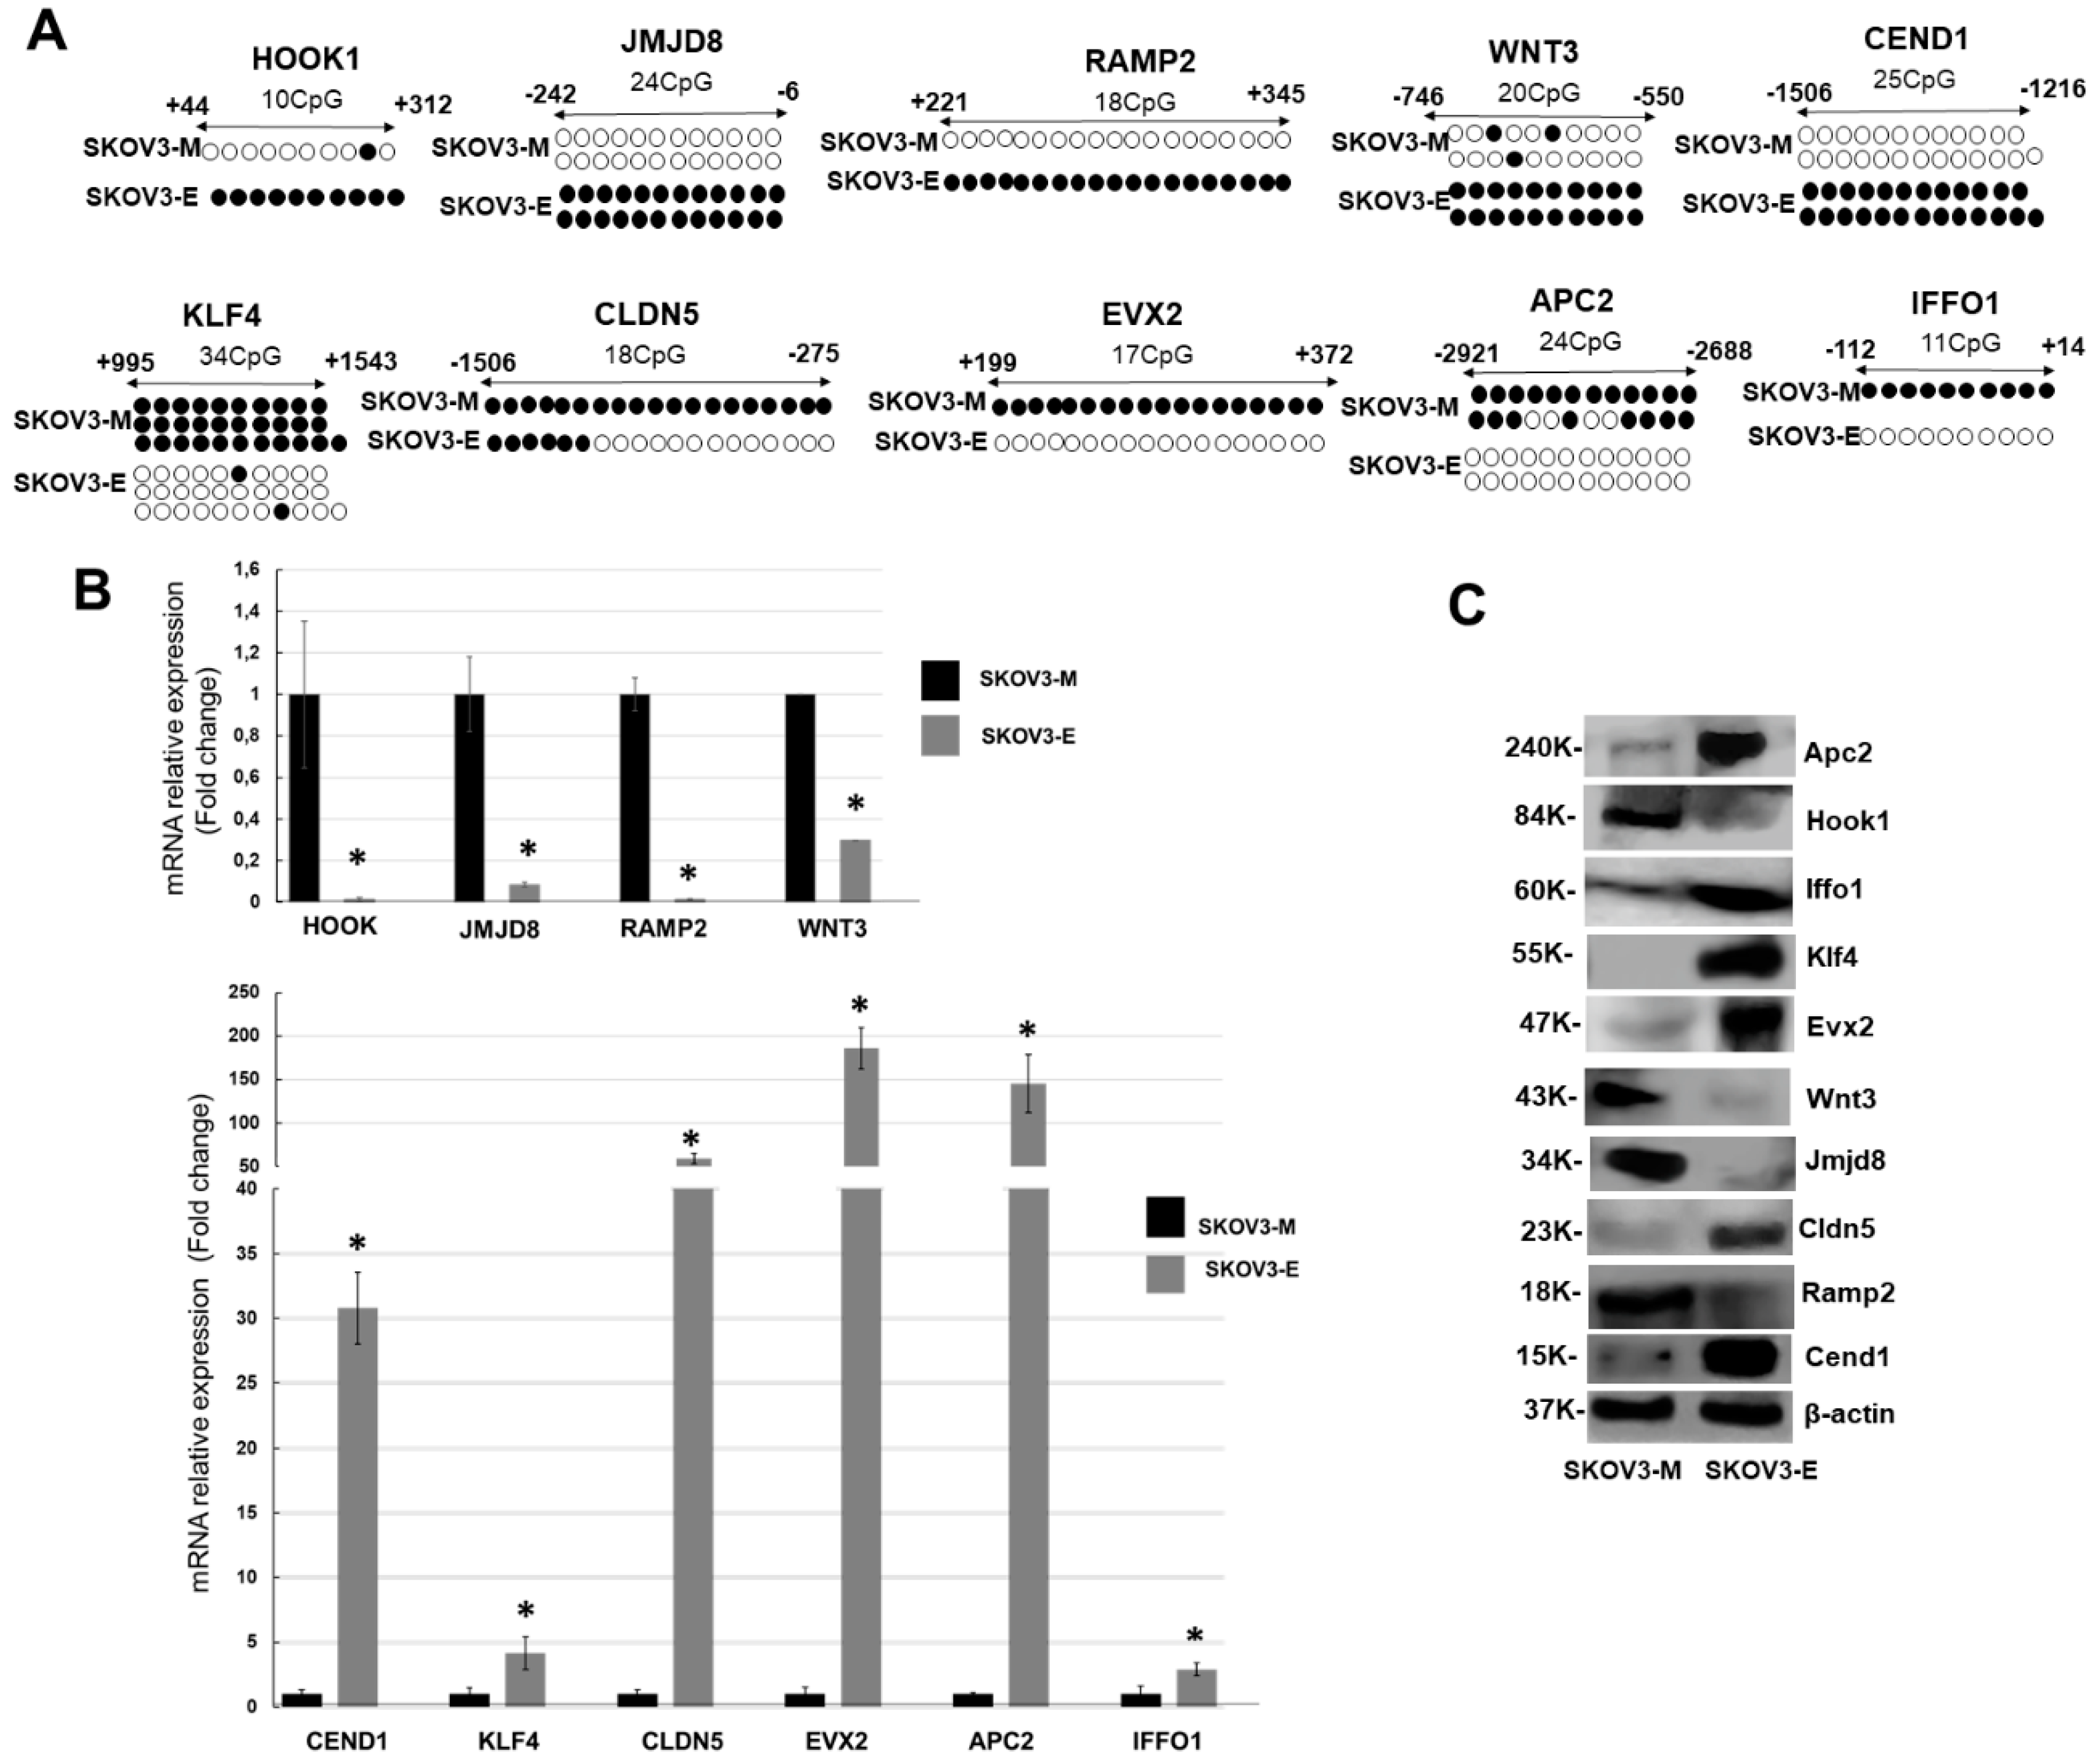
2.1. Reduced Representation Bisulfite Sequencing (RRBS) Analysis of Altered DNA Methylation Patterns during LY75-Mediated EMT in SKOV3 Cells; Identification of Novel Genes Displaying EMT-Associated DNA Methylation Variations

We applied the RRBS technology in order to identify specific genomic regions that undergo DNA methylation alterations during LY75-mediated EMT in EOC cells. Thus, we analyzed the DNA methylation patterns in previously generated SKOV3 cell clones with mesenchymal (M) phenotype (sh-control-SKOV3, SKOV3-shR), as compared to SKOV3 cell clones displaying epithelial (E) phenotype (sh-LY75-SKOV3, LY75-KO-SKOV3), as described before [7]; see also Table 1A for details. Three different experimental comparison (SKOV3-M vs. SKOV3-E) combinations were used for RRBS analysis, as shown in Table 1B.
Further analysis of the sequencing data based on differentially methylated regions (DMRs) covering genes’ exons and promoter regions led to the identification of ~10,000 genes displaying DMRs for each of the three experimental combinations used (see Table 1B and Supplementary Table S1A–C). As shown in Figure 1A, consecutive Venn diagram analysis of the DMRs data from the three experimental combinations revealed 6666 genes, displaying common altered DMRs in their exons/promoter regions, following LY75-mediated EMT alterations in SKOV3 cells (see Supplementary Table S1D). Based on the 6666 gene list, we performed consecutive selections based on increasing-stringency criteria in order to retain highly hyper- or hypomethylated genes with potential role in EMT-mediated EOC dissemination (Figure 1B). Thus, we initially selected genes exhibiting more than 50% methylation in their exons/promoter regions (4171 genes), then we focused on genes displaying predominant methylation alterations in a region comprising 2 kb upstream and downstream from the transcription start site (TSS; 971 genes). Using the Integrative Genomic Viewer (IGV) software, we further selected genes with high degree (≥70%) of CpG island methylation at their promoter/exon I regions (97 genes), and finally retained 45 genes, shown previously to be implicated in cancer-related EMT signaling (see Supplementary Table S1E for the 45-gene list). Bisulfite-sequencing PCR (BSP) validation of DNA methylation status of most of the 45 genes, combined in parallel with analysis of their mRNA and protein expression levels, led to final selection of 10 genes, including HOOK1, RAMP1, JMJD8, and WNT3, hypermethylated in SKOV3-E cells, and CEND1, EVX2, CLDN5, APC2, IFFO1, and KLF4, hypomethylated in SKOV3-E cells (see Supplementary Table S1E for details). Figure 2A shows the BSP-mediated confirmation of the methylation status of these genes, which precisely correlated with both their mRNA (Figure 2B) and protein (Figure 2C) expression values in the corresponding SKOV3 cell clones.
These data were further confirmed upon performing shRNA-mediated LY75 knockdown in the serous EOC cell line OVCAR8, which also exhibits a mesenchymal-like phenotype. Indeed, the shRNA-mediated LY75 knockdown OVCAR8 clones sh-63 and sh-64 displayed a typical epithelial morphology (see Supplementary Figure S1A), accompanied with the overexpression of E-cadherin, and the suppression of N-cadherin, TWIST1, and SNAIL1 (Supplementary Figure S1B). As shown in Supplementary Figure S1C, the protein expression profiles of the 10 genes described above displayed quite similar expression patterns in OVCAR8-M (control) and OVCAR8-E (sh-63) cells as those found in SKOV3-E or SKOV3-M cells (see Figure 2C for comparison).

2.2. LY75-Mediated EMT Alterations in EOC Cells are Associated with Predominant Epigenetic Regulation of Members of the Wnt/β-Catenin Pathway

We further analyzed the 6666 genes displaying common DNA methylation alterations in their exons/promoter regions upon LY75-mediated EMT by using the Ingenuity Pathways Analysis (IPA) software to identify relevant biological pathways and networks. As shown in Figure 3A, IPA analysis was indicative for EMT-related epigenetic alterations of functionally related groups, mostly linked to cellular development, cellular growth and proliferation, cellular movement, cellular function and maintenance, and importantly -cellular morphology. As expected, consecutive IPA canonical pathway analysis displayed predominant modulation of EMT-pathway-related genes and genes implicated in ovarian cancer signaling, as genes related to other major EMT-related pathways (including the Wnt/β-catenin, the Wnt/Ca2+, and the TGF-β pathways) similarly exhibited significant DNA methylation alterations (see Figure 3B and Table A1).
Remarkably, and as shown in Table A1, the number of Wnt/β-catenin-pathway-related genes with altered DMRs (69 genes) was significantly higher, compared to the TGF-β-pathway-related genes (39 genes). This was further supported by the number of the common genes shared between the EMT and Wnt/β-catenin pathways (27 genes) compared to those of the EMT/TGF-β pathways (five genes; see Figure 3C and Table A1), suggesting that the Wnt/β-catenin signaling might be the predominant pathway modulated by the LY75-mediated EMT alterations in EOC cells.

2.3. LY75 Expression Modulates the Wnt/β-Catenin Pathway Activity in EOC Cells

The above IPA analyses prompted us to more profoundly investigate the relative implications of the Wnt/β-catenin and the TGF-β signaling pathways during the LY75-mediated EMT alterations in EOC cells. As shown in Figure 4A, treatment of SKOV3-M and OVCAR8-M (parental) cells with the Wnt/β-catenin inhibitor XAV939 led to the acquirement of epithelial-like cellular phenotype, while treatment with the TGF-β inhibitor SB431542 had no effect on SKOV3-M and OVCAR8-M cellular morphologies. XAV939 treatment resulted in N-cadherin protein suppression and E-cadherin protein overexpression in SKOV3-M and OVCA8-M cells, similar to the LY75 KD effect in these cell lines (Figure 4B). Moreover, XAV939 treatment in both these cell lines was also associated with decreased levels of β-catenin, while members of the TGF-β pathway, including TGF-βRII and the phosphorylated form of Smad2/3 (pSmad2/3) were not affected (Figure 4B). Interestingly, XAV939 treatment resulted in reduced LY75 expression in EOC cells, suggestive for a possible feed-back mechanism between Wnt/β-catenin signaling and LY75 functional activity (Figure 4B). The use of the TGF-β inhibitor SB431542 was only associated with pSmad2/3 suppression, especially in SKOV3-M cells; however, this inhibitor induced no changes in the N-cadherin and E-cadherin expression levels in both EOC cell lines, despite a prolonged (5 days) treatment (Figure 4B). The impact of the LY75 gene expression on the Wnt/β-catenin pathway was further confirmed by Western blot analysis of the expression levels of some of its members and regulatory proteins. Thus, LY75 KD in both SKOV3 and OVCAR8 cells was associated with decreased β-catenin and Wnt3 expression and strong induction of the expression of Axin1 and APC2, both previously characterized as members of the suppressor complex of the Wnt/β-catenin pathway ([16]; see Figure 4C). This was also confirmed by immunofluorescence analysis of Axin1 and APC2 expression in the SKOV3-E cells and high expression and nuclear localization of β-catenin in the SKOV3-M (control) cells (Supplementary Figure S2).
Moreover, analysis of the TCGA data for ovarian cancer via the cBioPortal software (https://www.cbioportal.org/) was indicative for significant LY75 co-expression correlations (p ≤ 0.05) with 5046 genes (Supplementary Table S2A), including most (64) of the Wnt/β-catenin pathway gene members (Supplementary Table S2B).

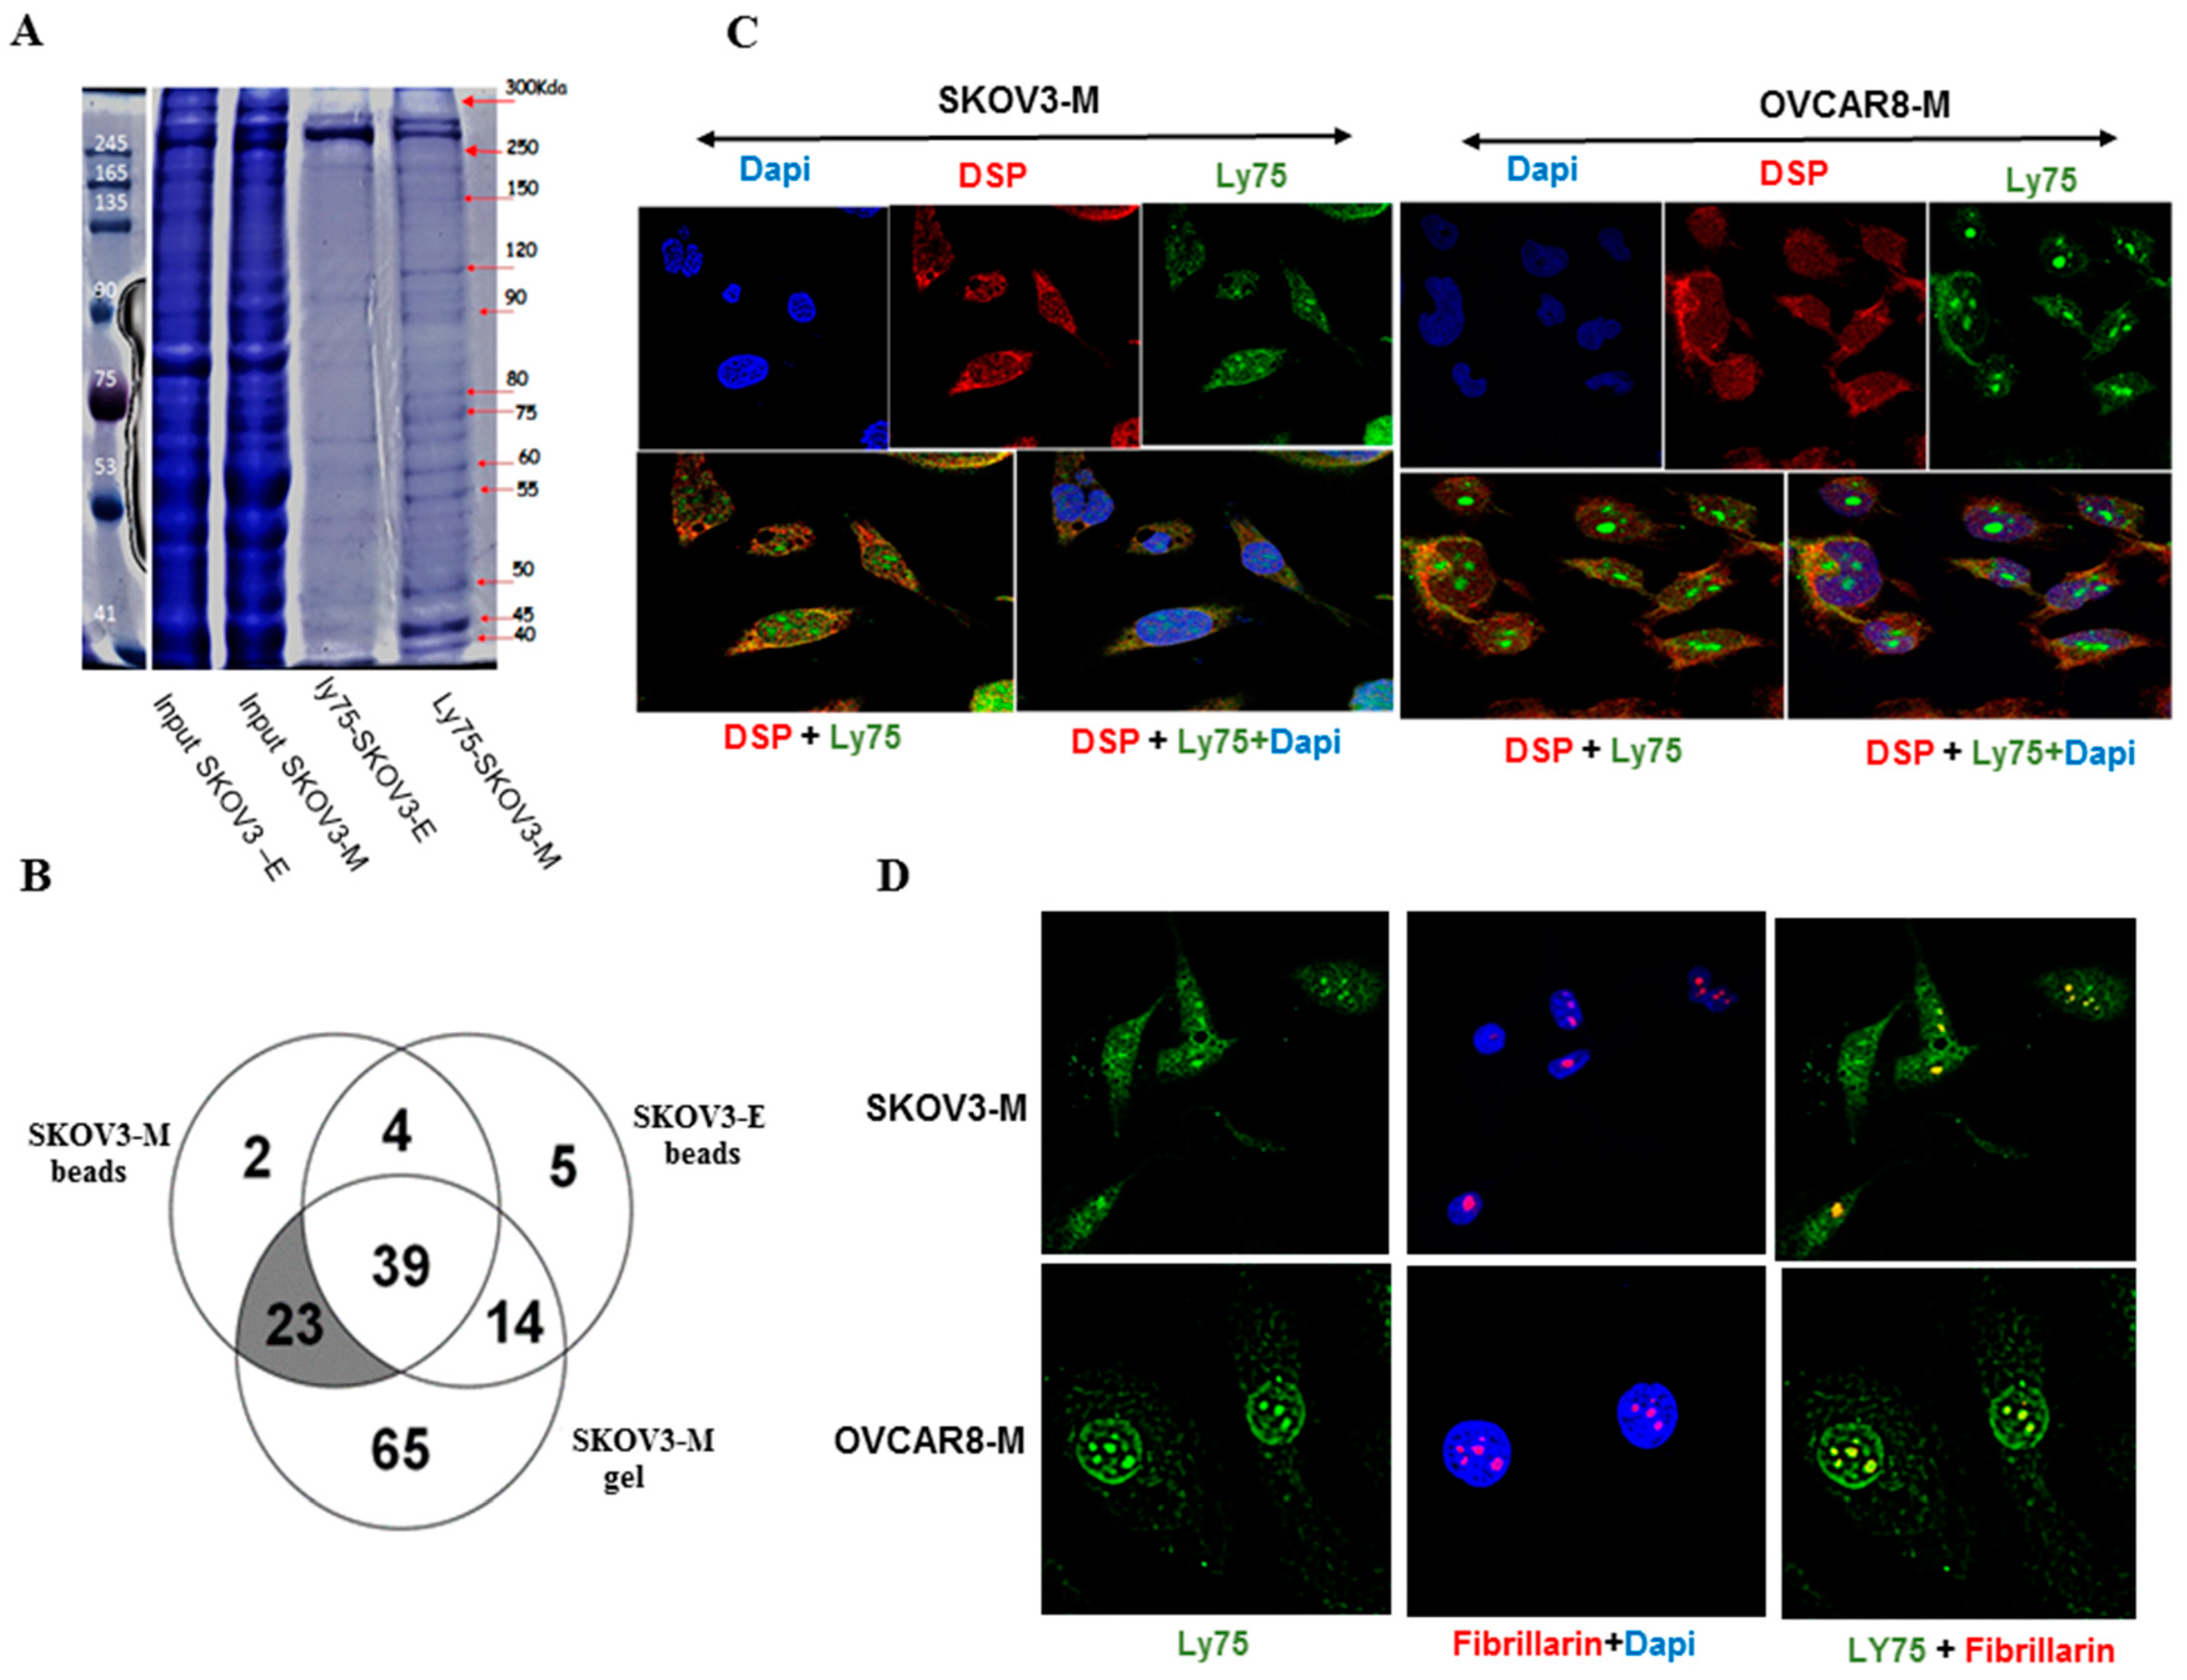
2.4. The Identification of Specific LY75-Interaction Proteins Supports the LY75 Role in Modulation of Wnt/β-Catenin Pathway Activity

We further proceeded with the identification of LY75-interaction proteins, as whole cell lysates of SKOV3-M (parental) cells and Ly75 KD SKOV3-E cells were anti-LY75 immunoprecipitated using streptavidin beads, and the resulting peptides were analyzed by liquid chromatography–mass spectrometry (LC-MS/MS). Alternatively, and following the repetition of the same experimental procedure, immunoprecipitated proteins were separated by electrophoresis and specific bands (present in the SKOV3-M fraction and absent in the SKOV3-E fraction) were gel-eluted and subjected to LC-MS/MS (Figure 5A). Venn diagram analysis of the common immunoprecipitated proteins in SKOV3-M (beads) and SKOV3-M (gel), as compared to those in SKOV3-E cells (beads), led to the identification of 23 LY75 specific interaction partners (Figure 5B and Table 2). As shown in Table 2, most LY75 interacting partners (including ACTN4, DNM2, KRT7, KRT8, KRT18, KRT19, SPTAN1, PLEC) were previously known to be involved in actin cytoskeleton remodeling and/or cell trafficking. Importantly, three of the newly identified LY75 partners (DSP, AHNAK, and SPTBN1) were formerly characterized as repressors of the Wnt/β-catenin pathway [17,18,19]. Moreover, immunofluorescence analysis was confirmative of cellular membrane and cytoplasmic co-localization of LY75 and DSP (Figure 5C).
Interestingly, seven nucleolar proteins (including RRBP1, MVP, HSD17B4, HNRNPM, LMNA, KHDRBS1, and RPL6) were among the proteins identified as LY75 interacting partners (Table 2), suggesting for a possible LY75 nucleolar localization. This was further confirmed by immunofluorescence-mediated co-localization analysis of LY75 and the nucleolar protein fibrillarin (Figure 5D).

3. Discussion

Numerous studies have previously suggested that EMT induction in cancer is accompanied by a dynamic reprogramming of the epigenome, including DNA methylation alterations, aberrant expression of noncoding RNAs, and post-translational histone modifications. EMT-related epigenetic changes have been described in many cancer types, including EOC [11]; however, the implications of the different epigenetic regulatory mechanisms in EMT-mediated cancer initiation and progression remain largely unexplored [12].
Using an epigenomic approach (methylated DNA immunoprecipitation coupled to CpG island tiling arrays), we have previously shown that DNA hypermethylation occurs in all (comprising less-invasive and early) stages of ovarian tumorigenesis, while advanced disease is exclusively associated with DNA hypomethylation of a number of oncogenes, implicated in EOC progression and invasion/metastasis [20], including genes (LY75, GRHL2, Hic-5, and RUNX1), implicated in EMT regulation [7,21,22,23,24]. In this study, we used the RRBS technology for a comprehensive analysis of DNA methylation changes during LY75-mediated EMT alterations in EOC cells. We initially compared the DNA methylation patterns of SKOV3 control (SKOV3-M) versus LY75-KD SKOV3 (SKOV3-E) cells, using three different experimental combinations, as shown in Table 1B. In each experimental condition, more than 10,000 genes displayed DMRs in their exons and promoter regions, as 6666 common genes were identified under these selection criteria as hypo- or hypermethylated in the SKOV3-E clones (Figure 1A). Based on the 6666 gene list, we further proceeded with a more stringent selection of genes displaying rather high degree (>70%) of methylation in their promoter/exon I regions and previously shown to be implicated in cancer-related EMT signaling. Our stringent selection retained 45 genes (see Supplementary Table S1E), as the DNA methylation status of the promoter regions of most of these genes was further validated by an alternative approach (BSP sequencing). Ten genes were finally selected, whose promoter/exon I DNA methylation patterns completely coincided with their mRNA and protein expression levels. Indeed, HOOK1, RAMP2, JMJD8, and WNT3 appeared hypomethylated and overexpressed (both on mRNA and protein levels) in SKOV3-M cells, whereas EVX2 CLDN5, KLF4, APC2, CEND1, and IFFO1 demonstrated hypomethylated profiles and strong mRNA/protein expression in SKOV3-E cells. These 10 genes also displayed quite similar mRNA and protein expression patterns in OVCAR8-M and OVCAR8-E cells (the latter generated upon shRNA-mediated LY75 KD in OVCAR8 EOC cells; see Supplementary Figure S1A–C). Consecutive analysis of the literature data was indicative for their involvement in carcinogenesis, as some of these genes displayed altered DNA methylation profiles in different cancers. Accordingly, Hook1 (Hook microtubule tethering protein1) represents a microtubule-binding protein involved in microtubule cytoskeleton dynamics, endocytic trafficking, and cell differentiation [25]. It was recently reported that Hook1 inhibits malignancy and EMT in several cancer types, including hepatocellular carcinoma, thyroid cancer and non-small-cell lung cancer [26,27,28]. Ramp2 (receptor activity-modifying protein-2) encodes a family member of single-transmembrane-domain proteins called RAMPs, which transport the calcitonin-receptor-like receptor to the plasma membrane. A specific combination of RAMP members and calcitonin-receptor-like receptor defines Ramp2 ligand affinity for either calcitonin or adrenomedullin [29]. A dual role of Ramp2 has been described in different cancer types; thus Ramp2 and its ligand adrenomedullin were shown to be overexpressed and to promote vascularization and metastasis in human colon cancer [30], while RAMP2 expression has been suppressed by promoter hypermethylation in lung cancer, and ectopic expression of RAMP2 directed apoptosis and inhibited lung cancer cell growth [31]. Similarly, the literature data for Jmjd8 implication in carcinogenesis are rather controversial. Jmjd8 belongs to the family of JmjC domain-redox enzymes that catalyze protein hydroxylation or demethylation [32], as a role of Jmjd8 in regulating cellular metabolism and angiogenesis has been recently reported [33]. An oncogenic role of Jmjd8 as a positive regulator of TNF-induced NF-κB signaling in colorectal cancer has been described [34,35]; however, a recent study demonstrated that JMJD8 knockdown promotes cell proliferation and double-strand base (DSB) repair in lung and bone cancer cells, suggesting that Jmjd8 could represent a potential target for more effective tumor radio- and chemotherapies [36]. As a member of Wnt/β-catenin family, an oncogenic role for Wnt3 has been reported in different cancer types, including colorectal, gastric, breast, liver, and lung cancer [37,38,39,40,41]; yet a potential tumor-suppressor role for Wnt3 has been described in chronic lymphocytic leukemia, where decreased Wnt3 expression is associated with disease progression and worse prognosis [42]. Interestingly, Wnt3 levels were found to be strongly reduced in malignant ovarian tissues compared to normal ovarian tissues [43]. EVX2 (even-skipped homeobox 2) was previously shown to be implicated in vertebrate spinal cord interneuron development [44]. This gene was found highly methylated in lung cancer, where a role for EVX2 as a methylation biomarker for early detection of the disease has been suggested [45]. Claudin5 (CLDN5) is a member of claudin gene family encoding proteins implicated in tight junction formation and function [46]. Cldn5 expression is frequently altered in different human cancers, as CLDN5 gene was found to be downregulated in colorectal, liver, and lung cancer and glioma [47,48,49,50], suggestive for a potential tumor-suppressor role of CLDN5 in these cancer types. However, CLDN5 has been described as an oncogene in breast, pancreatic, and esophageal cancers [51,52,53]. CLDN5 was also found to be highly expressed in malignant EOC tumors compared to benign EOC tumors [54]. Moreover, Cldn5 overexpression correlated with aggressive behavior in serous ovarian adenocarcinoma [55] and was shown to be involved in the malignant transformation of borderline mucinous EOC tumors [56]. Interestingly, CLDN5 was also found to be aberrantly methylated in pancreatic ductal adenocarcinomas [57]. Klf4 (Krüppel-like factor 4) is a zinc-finger-containing transcription factor implicated in regulating cellular growth, proliferation, differentiation, apoptosis, and cell cycle arrest [58]. Recently, a role of KLF4 was reported in inducing pluripotent stem cells and also maintaining the stemness of cancer stem cells [59]. Thus, KLF4 can act as a tumor suppressor or oncogene in different cancer types, largely depending on the cellular context, chromatin structure, cell cycle regulation, and expression patterns of other genes, including specific oncogenic drivers [60]. KLF4 expression was also shown to be frequently mediated through epigenetic or post-transcriptional mechanisms [61]. Moreover, a controversial role of KLF4 in regulating EMT in gastrointestinal cancer has been described [62,63], as currently, the mechanisms underlying its controversial role in this cancer type remain undefined. KLF4 has been characterized as a tumor-suppressor in EOC, as KLF4 downregulation correlated with accelerated EOC proliferation, invasion, and migration and poor patient survival [64,65]. Accordingly, the KLF4 overexpression significantly reduced the metastatic potential of EOC cells by inhibiting the TGFβ-induced EMT [66] and sensitized EOC cells to chemotherapy drugs [65]. Apc2 (adenomatous polyposis coli 2) promotes the assembly of a multiprotein β-catenin destruction complex which results in negative regulation of the Wnt/β-catenin signaling pathway [67]. This protein functions as a tumor suppressor in different cancer types, including prostate, colorectal, and lung cancers, osteosarcoma, retinoblastoma, and glioma [68,69,70,71,72,73], where the APC2 gene expression was frequently found to be inhibited by hypermethylation [72,74,75]. Similarly, a critical role of APC2 in suppressing EOC progression has been demonstrated [76], as APC2 silencing promoted EOC cell proliferation [77] and was associated with decreased overall survival in EOC patients following intraperitoneal chemotherapy [78]. CEND1 (cell cycle exit and neuronal differentiation protein 1) plays an important role in neuronal differentiation by modulating cell cycle progression/exit or apoptosis of neuronal progenitors [79]. CEND1 was shown to suppress cell proliferation via modulating the cyclin D1 pathway, which is linked to its potential tumor suppressor functions, associated with proliferation inhibition of neuroblastoma cells [80]. CEND1 was found to be epigenetically suppressed by methylation in invasive breast carcinoma, also suggestive for a potential tumor suppressor role in this cancer type [81]. IFFO1 (intermediate filament family orphan 1) is a member of the intermediate filament family which includes essential components of the cyto- and nucleoskeleton [82]. Recently, a potential role of IFFO1 in suppressing chromosome translocations during tumorigenesis has been discovered [83]. IFFO1 was reported to be downregulated by promoter methylation in different cancer types [83]. Accordingly, we and others have identified IFFO1 as a highly methylated gene in EOC [20,84], as the IFFO1 methylation has been proposed as EOC biomarker [84].
All the above described genes, epigenetically modulated during EMT in EOC cells, could represent potential prognostic/diagnostic EOC biomarkers. Further studies are warranted to more completely elucidate the functional implications of these 10 genes in ovarian tumorigenesis.
Moreover, our results suggest that Wnt/β-catenin pathway is the principal EMT-related pathway modulated by LY75 expression in EOC cells. In silico analysis of the TCGA data for ovarian cancer was also confirmative for the role of LY75 in modulating the Wnt/β-catenin pathway activity in EOC. Deregulations of the Wnt/β-catenin signaling pathway have been associated with the etiology of different human cancers, including colorectal, prostate, breast and skin cancers [85,86,87,88]. Accordingly, the Wnt/β-catenin signaling has been shown to play critical role in EOC development, including EOC stemness, EMT, progression to malignancy, and therapy resistance (recently reviewed in [89,90]). The β-catenin is the key mediator of this pathway, as in the presence of Wnt ligands, the Frizzled and LRP5/6 receptors prevent the formation of the destruction Axin/Apc2/Gskβ complex, allowing the stabilized β-catenin to translocate to the nucleus and to interact with the TCF/LEF transcription factors, thus modulating the transcription of Wnt downstream target genes, many of which regulate EMT, invasion, and metastasis [89].
The IPA canonical pathway analysis of the 6666-gene list displaying common altered DMRs in their exons/promoter regions upon LY75 KD in SKOV3 cells was strongly indicative for the implication of the Wnt/β-catenin pathway in the EMT-associated DNA methylation variations in this EOC cell line (see Figure 3B and Table A1). This was further confirmed following treatment of EOC cells with the Wnt/β-catenin inhibitor XAV939, as XAV939 treatment induced MET-related phenotype changes in SKOV3-M and OVCAR8-M cells (similar to the LY75-KD effect; see Figure 4A), accompanied with suppression of the β-catenin and N-cadherin expression (see Figure 4B). Analogous changes in cells morphology and β-catenin and N/E cadherin switching were not observed following treatment with TGF-β inhibitor SB431542 (Figure 4B). Consecutive immunofluorescence analyses were also indicative for abundant expression and importantly, nuclear localization of β-catenin in SKOV3-M cells, while a rather weak cytomembrane/cytoplasmic β-catenin expression was observed in SKOV3-E cells, accompanied with strong Axin 1 and Apc2 expression (see Supplementary Figure S2).
Furthermore, our proteomics approach led to the identification of 23 LY75 interaction partners mostly involved in actin cytoskeleton organization and/or in cell–cell interactions, which confirms the implication of LY75 in modulating the EOC cellular phenotype (see Figure 5A). Interestingly, three LY75 interaction partners, including spectrin beta chain (SPTBN1), desmoplakin (DSP) and neuroblast differentiation-associated protein (AHNAK) were previously shown to be associated with suppression of the Wnt/β-catenin signaling. Indeed, SPTBN1 has been found to potentiate the expression of the Wnt inhibitor kallistatin in liver cancer [19]. Similarly, DSP was shown to enhance the expression of plakoglobin (also known as γ-catenin) in human lung cancer, which is associated with the suppression of β-catenin [17]. AHNAK has been described as a tumor suppressor in breast cancer that negatively regulates both the AKT/MAPK and Wnt/β-catenin signaling pathways [18]. Thus, our data suggest a possible role of LY75 in maintaining active Wnt/β-catenin signaling in EOC cells by sequestering some of its inhibitors.
Remarkably, seven of the LY75 interaction partners identified were previously recognized as nucleolar proteins [91], and further co-localization immunofluorescence analysis of LY75 and the nucleolar protein fibrillarin was confirmative for a possible LY75 nucleolar localization in EOC cells. Thus, our data suggest a putative LY75 implication in some of the nucleolus functions that mainly include transcription regulation, rRNAs processing, and their subsequent assembly into ribosomal subunits. However, further studies are needed to understand the exact role of LY75 in the nucleolus.
In conclusion, we have shown that LY75-modulated EMT changes directed numerous DNA methylation alterations in EOC cells, as our experimental conditions resulted in the identification of 6666 genes displaying common altered DMRs in their exons/promoter regions. Ten genes were consecutively identified with significant methylation alterations in their promoter regions, which corresponded with their expression levels in EOC cells, suggesting their further investigation as potential EOC biomarkers/therapeutic targets. Moreover, LY75-mediated EMT alterations in EOC cells were predominantly associated with epigenetic regulation of members of the Wnt/β-catenin pathway. We further demonstrated that LY75 supports an active status of the Wnt/β-catenin pathway in EOC cells, while the LY75 depletion predominantly directs the pathway suppression. Though, a possible back-loop regulation of the LY75 expression via the Wnt/β-catenin signaling cannot be excluded. Our data are also indicative for a possible LY75 nucleolar localization; however, the role of LY75 in the nucleolus needs to be further elucidated.
A comprehensive understanding of molecular processes and the chronology of events between DNA methylation and the signaling pathways triggering EMT in EOC could arrange for the development of more effective (including epigenetic) treatment strategies for this deadly disease.

4. Materials and Methods

4.1. Cell Cultures

The SKOV3 and OVCAR8 EOC cell lines were purchased from American Tissue Type Collection (Manassas, VA, USA). Cells were maintained in RPMI-1640 medium supplemented with 10% (v/v) fetal bovine serum (Hyclone, Logan, UT, USA) and cultured in a humidified incubator with 5% CO2 at 37 °C as previously described [7]. In some experimental conditions, SKOV3 and OVCAR8 cells were treated for 24 h with the Wnt/β-catenin inhibitor XAV939 (Sigma-Aldrich, Oakville, ON, Canada) and for 5 days with the TGF-β inhibitor SB431542 (Reagents Direct, Encinitas, CA, USA), as both inhibitors were applied at a final concentration of 20 µM. The corresponding SKOV3 and OVCAR8 control cells were treated with 0.1% DMSO.

4.2. Reduced Representation Bisulfite Sequencing (RRBS) Analysis

For RRBS analysis, ~10 µg of genomic DNA was extracted from different SKOV3-M and SKOV3-E clones using the Blood & Cell culture DNA Mini Kit (Qiagen, Montreal, PQ, Canada). RRBS analysis was performed on a service basis by the company Diagenode Inc. (https://www.diagenode.com/en/p/rrbs-service). The comparisons between the RRBS datasets were carried out using the R package methylKit, using the hg19 refGene and CpG island annotation from the UCSC GenomeBrowser database (http://genome.ucsc.edu). Differentially methylated CpGs, as well as differentially methylated regions (DMRs) were identified with a >25% methylation difference and an adjusted p-value < 0.05 (the latter with a window size of 1000 bp, since this has been found to include the majority of DMRs [92]). The DMRs were annotated using the UCSC RefSeq tracks (hg19) to further analyze CpG sites included in genes’ exons and promoter regions (window size of 25 bp; promoter regions spanning around 2 kb upstream and downstream of the transcriptional start site). All RRBS sequencing and processed data were deposited in the Gene Expression Omnibus (GEO) with accession number GSE142310.

4.3. Bisulfite Sequencing PCR (BSP) Analysis

BSP analysis was performed, as previously described [20]. BSP primer selection was performed using the Methyl Primer Express Software v1.0 (Applied Biosystems, Waltham, MA, USA); all primers are listed in Table A3. PCR was done for 40 cycles (94 °C, 45 s; 54–60 °C, 45 s; 72 °C, 45 s), as shown before [20]. PCR products were sent for dideoxy-sequencing analysis at the Genomics Analysis Platform at Laval University (http://www.bioinfo.ulaval.ca/seq/en/).

4.4. Short Hairpin RNA (shRNA)- ediated LY75 Knockdown in EOC Cells

The shRNA-mediated LY75 knockdown in EOC cells was done, as previously described [7]. Briefly, two LY75 shRNAs cloned into the pLKO.1-puro vector (targeting the LY75 mRNA sequences 5′-GCCCUAAUACUCAACCUCCAA-3′ and 5′-UCCCGTCUUACAUAUUCAUCAA-3′) were retrieved from the Sigma Mission TRC human 1.5 shRNA library (clone numbers TRCN0000057363 and TRCN0000057364). Viral supernatants were generated by transfecting 293T cells with the shRNA constructs and the packaging vectors psPAX2 and pMD2.G (Addgene, Cambridge, MA, USA). The high-titer lentiviral supernatants in the presence of 8 µg/mL polybrene were used to infect SKOV3 and OVCAR8 cells. Two days later, infected cells were treated with puromycin (2 µg/mL) for the selection of stably-transduced clones. The pLKO.1-puro vector encoding a scramble sequence not matching any mammalian sequence was used for the generation of mock-transduced (control) clones. Stable clones with inhibited LY75 expression were evaluated and validated by quantitative RT-PCR and Western blot.

4.5. Western Blot Analysis

Western blot analyses were performed as previously described [7]. List of antibodies used: anti-LY75 (Abcam, Branford, CT, USA and Santa Cruz Biotechnology Dallas, TX, USA), anti-Snail1, anti-FN1, anti-E-cad, anti-EpCAM, anti-AXIN1, anti-WNT3, anti-EVX2, anti-IFFO1, anti-CLDN5, anti-HOOK1, anti-JMJD8, anti-RAMP2, anti-KLF-4, anti-β-actin antibodies (Santa Cruz Biotechnology, Dallas, TX, USA) and anti-Twist1, anti-E-cadherin, anti-N-cadherin, anti-APC2, and anti-Cend1 antibodies (Abcam Branford, CT, USA).

4.6. Quantitative PCR (qPCR)

Quantitative PCR was performed as previously described [7]. Briefly, total RNA was extracted by the RNeasy Plus Mini Kit (Qiagen, Montreal, PQ, Canada) and RNA was reverse transcribed into cDNA using Superscript III transcriptase, according to the manufacturer’s protocol (Invitrogen; Thermo Fisher Scientific, Waltham, MA, USA). RT-qPCR was performed using the SYBR Green PCR Master Mix (Applied Biosystems; Thermo Fisher Scientific Waltham, MA, USA) on ROTOR GENE real-time PCR machine (Corbett research, Corbett Robotics, Brisbane, Australia). Relative quantification of RNA expression was calculated using the 2−ΔΔCq method [93]. The 18S ribosomal gene was used as an internal standard. Each sample was tested in triplicate. Primers were designed as previously shown [7]; all primers for qPCR are listed in Table A2.

4.7. Immunoprecipitation and Consecutive Mass Spectrometry (MS) Analysis

For immunoprecipitation, SKOV3-M and SKOV3-E cells were lysed in 1 mL cell RIPA lysis buffer. Following lysis, 500 μg of proteins were incubated with 2 μg of the LY75 antibody (Santa Cruz Biotechnology, Dallas, TX, USA) for 4 h at room temperature and overnight at 4 °C upon gentle rotation, before being incubated with 40 μL Dynabeads Protein G (Invitrogen, Waltham, MA, USA) at 4 °C for 2 h under rotation. Beads were digested with trypsin and the resulting peptides were analyzed by LC-MS/MS. The same immunoprecipitation experiment was repeated once again; however, this time the beads were consecutively resuspended in 40 µL SDS sample buffer and boiled for 10 min; the supernatant was analyzed by electrophoresis and stained by Coomassie blue. Gel bands of interest of the SKOV3-M peptide fraction were digested with trypsin, and the resulting peptides were analyzed by LC-MS/MS. Protein digestion and MS analyses were performed at the Proteomics Platform of the CHU de Québec Research Center (Quebec, PQ, Canada), using the Ekspert NanoLC425 HPLC system (Eksigent technologies Dublin, CA, USA) coupled to a 5600+ mass spectrometer (Sciex, Framingham, MA, USA) equipped with a nanoelectrospray ion source, as previously described [94]. MGF peak list files were consecutively created using Protein Pilot version 4.5 software (Sciex, Framingham, MA, USA). MGF sample files were then analyzed using Mascot (Matrix Science, London, UK; version 2.5.1). Mascot was set up to search the contaminants_thegpm_20170713.fasta; CP_HomoSapiens_9606_CI_20170329_2 database (unknown version, 92,988 entries) assuming the digestion enzyme trypsin. Mascot was searched with a fragment ion mass tolerance of 0.100 Da and a parent ion tolerance of 0.100 Da. Carbamidomethyl of cysteine was specified in Mascot as a fixed modification. Deamidated of asparagine and glutamine and oxidation of methionine were specified in Mascot as variable modifications. Scaffold software (version Scaffold_4.8.4, Proteome Software Inc., Portland, OR, USA) was used to validate MS/MS-based peptide and protein identifications. An FDR less than 1.0% for peptide and protein was used. Proteins that contained similar peptides and could not be differentiated based on MS/MS analysis alone were grouped to satisfy the principles of parsimony.

4.8. Immunofluorescence

Cells were plated on poly-d-lysine coated slides (Sigma Aldrich Oakville, ON, Canada), then fixed in 4% paraformaldehyde and permeabilized with 1 x PBS–0.2% Triton X-100. After blocking, cells were incubated with different primary antibodies, including anti-β-catenin (Santa-Cruz Biotechnology Dallas, TX, USA), anti-LY75 (Santa-Cruz Biotechnology Dallas, TX, USA and Abcam, Branford, CT, USA), anti-APC2 (Abcam, Branford, CT, USA), anti-Axin1 (Santa-Cruz Biotechnology Dallas, TX, USA), and anti-DSP (Santa-Cruz Biotechnology Dallas, TX, USA), and subsequently incubated with secondary antibodies, including rhodamine-linked goat-anti-mouse IgG1 (Santa Cruz Biotechnology Dallas, TX, USA) or Alexa Fluor 488-labeled goat anti-rabbit antibody (Abcam, Branford, CT, USA). Cells were finally stained with 4′,6-diamidino-2-phenylindole (DAPI). Images were captured using a Zeiss LSM 700 confocal microscope (Carl Zeiss Meditec AG Jena, Germany).

Supplementary Materials

Supplementary materials can be found at https://www.mdpi.com/1422-0067/21/5/1848/s1.

Author Contributions

Conceptualization, S.M. and D.B.; data curation, D.B., S.M., M.-P.S.-B. and A.D.; funding acquisition, D.B.; methodology, S.M., M.B. and M.-P.S.-B.; project administration, D.B.; resources, D.B.; supervision, D.B.; validation, S.M., M.-P.S.-B., A.D. and D.B.; writing—original draft, S.M. and D.B.; writing—review and editing, S.M., M.-P.S.-B. and D.B. All authors have read and agreed to the published version of the manuscript.

Funding

This study was sustained by grants to D.B. from the Cancer Research Society of Canada, and financial support from FRQ-S—Réseau de Recherche en Cancer (http://www.rrcancer.ca).

Conflicts of Interest

The authors declare no conflicts of interest.

Abbreviations

EOCEpithelia ovarian cancer
EMTEpithelial–mesenchymal transition
METMesenchymal–epithelial transition
ncRNANoncoding RNA
RRBSReduced Representation Bisulfite Sequencing
IPAIngenuity Pathway Analysis
DMRsdifferentially methylated regions
IGVIntegrative Genomic Viewer
BSPBisulfite-sequencing PCR
shRNAShort hairpin RNA
q-PCRQuantitative PCR
LC-MS/MSliquid chromatography–mass spectrometry

Appendix A

Table A1. List of genes displaying EMT-related DNA methylation alterations upon IPA analysis of the EMT, Wnt/β-cat and TGF-β canonical pathways, including common genes between EMT/Wnt/β-cat or EMT/TGF-β canonical pathways.
EMT GenesWnt/β-Cat GenesTGF-β GenesCommon EMT/Wnt/β-Cat GenesCommon EMT/TGF-β Genes
WNT3PDGFDCDKN2AEP300INHAWNT3SMAD3
AXIN1NOTCH1WNT3AKT1BMP4AXIN1HRAS
PIK3R1WNT1AXIN1JUNSMAD3WNT6MAP2K2
SMAD3FGF5PPP2R5BCDH3SKIWNT7BSOS1
HRASRELATLE1UBA52HRASWNT4GRB2
PARD6GFZD10WNT6DKK3BMPR1BWNT5B
WNT6FGF8SOX13TGFB2MAPK13AKT2
PIK3R4TWIST1MYCSOX14MAPK11WNT9A
FGFR3KLBTGFB1CSNK2BTLX2FZD9
FOXC2HNF1APPM1JSOX7TGIF1TCF3
MAP2K2WNT2WNT7BLRP5EP300CDH1
TGFB1mir34RARAWNT9BBCL2CDH12
WNT7BFGF13WNT4CSNK1G3JUNFZD6
FGF12FGF4MAP4K1WNT2BMAP2K2LEF1
WNT4AKT1WNT5BDVL1TGFB1WNT1
IRS2KLAXIN2DKKL1SOS1FZD10
WNT5BSOS1AKT2TCF7L1TGFB2HNF1A
FGF19TGFB2CSNK1G2SOX11MAP4K1WNT2
PIK3C2BFGF23WNT9AFZD8VDRAKT1
AKT2PIK3R2CREBBPWNT3AHNF4AWNT9B
TWIST2FGF3CSNK1DWNT10ARUNX3WNT2B
JAG2EGFRFZD9SOX6GRB2DVL1
WNT9AMAP2K7TCF3APC2FOXH1TCF7L1
TYK2ESRP2ACVR1BNR5A2CREBBPFZD8
FGFR2WNT9BCDH1PPP2R5ESMAD6WNT3A
FZD9GRB2CDH12SOX15SMAD7WNT10A
MMP2EGR1TLE3WNT11MAPK9WNT11
NFKB2WNT2BFZD6LRP1PITX2
ZEB1DVL1LEF1SOX3MAPK12
TCF3FGF14SOX8 ACVR1B
TLR9TCF7L1SFRP1 INHBB
METFGF21WNT1 TRAF6
CDH1FZD8FZD10 NKX2-5
CDH12WNT3ASFRP2 FOS
IRS1WNT10AFRZB ZNF423
mir-192ZEB2SOX1 IRF7
FZD6FGF20FRAT1 SMURF2
LEF1FGF11MARK2 BMP7
FGFRL1RBPJHNF1A PMEPA1
WNT11JAK3WNT2
Table A2. Primers used for quantitative PCR (qPCR).
Geneq-PCR PrimersSequence (5′->3′)
HOOK1 (NM_015888)ForwardAGTGAGTTGACACCCTGTGG
ReverseTGGTATATGTACTCAAGCCTCCC
Product length (pb)103
JMJD8 (NM_001005920)ForwardTCATCACCCTCGTGGTTTCG
ReverseATCTGGCCAGGTCCATCTCT
Product length (pb)83
RAMP2 (NM_005854)ForwardGCACGAGCTTCTCAACAACC
ReverseCAACCCTGGCTTCCATTCCC
Product length (pb)134
KRT7 (NM_005556)ForwardATTCCACTGGTGGCAGTAGC
ReverseTGGAGAAGCTCAGGGCATTG
Product length (pb)83
APC2 (NM_001351273)ForwardGCTCCGACAGCATTACCTCA
ReverseAGACCCGGTACAGAAACGTG
Product length (pb)115
CEND1 (NM_016564)ForwardTACATACGCCCCCAACACAC
ReverseTCTTTCTGCCCTGGAGGTTG
Product length (pb)92
CLDN5 (NM_001130861)ForwardGGATTTCGCTTCCCCTCCAA
ReverseGTACACATCTTCCGGTGGGG
Product length (pb)119
EVX2 (NM_001080458)ForwardGGGAGAACTATGTGTCGCGG
ReverseCGGTTCTGGAACCACACCTT
Product length (pb)91
KLF4 (NM_004235.6)ForwardAGAACAGATGGGGTCTGTGAC
ReverseTCCACAACTTCCAGTCACCC
Product length (pb)106
WNT3 (NM_030753)ForwardATCTACGACGTGCACACCTG
ReverseTGCTTCCCATGAGACTTCGC
Product length (pb)95
18S (NR_003278)ForwardAACCCGTTGAACCCCATT
ReverseCCATCCAATCGGTAGTAGCG
Product length (pb)119
Table A3. Primers used for BSP analysis.
GenesPrimersOuter PCR-Sequence (5′->3′)Inner PCR-Sequence (5′->3′)
HOOK1 (NM_015888)ForwardGGTTTAGGTGTTTGGTAGYG 3GGTTTAGGTGTTTGGTAGYG
ReverseACCCAAATCATAAAACTATCRCACCRACTCTCCTCCAAAAA
Product length (pb)318204
JMJD8 (NM_001005920)ForwardATGAAGTGGTTGGAAGGTAGTTGGAGGTTGGAATTTGAGATTT
ReverseCRAAAATAACCTCCTTTAACCCCRAAAATAACCTCCTTTAACCC
Product length (pb)367231
RAMP2 (NM_005854)ForwardTTTTTTTTTTGTTGGGYGTTTTTTTTTTGTTGGGYG
ReverseCTTATCACTCACACCCAAACCCCCCTCATCTCTAACCAACTT
Product length (pb)318291
KRT7 (NM_005556)ForwardTTTGGATTGAAAGTTTGGTGGTAGTAGAGAAAGGTGGTT
ReverseAACCCCCATAAACAAAACAACCCCCATAAACAAAAC
Product length (pb)396325
APC2 (NM_001351273)ForwardTTGGTTGTTGTTATGGTATTAGTTTGGTTGTTGTTATGGTATTAGT
ReverseAACTCAATTTCCCCTCCAACCTCCAACTCCCACTCTAA
Product length (pb)447435
CEND1 (NM_016564)ForwardAGTAGTGTATTGTGGGAAATTTTAGTAGTGTATTGTGGGAAATTTT
ReverseACTACTACCACCTCCCAAACCCAATAACCTTCAAAACC
Product length (pb)391191
CLDN5 (NM_001130861)ForwardGTAAATTTTGGTTAGGGAAGTGGTAAATTTTGGTTAGGGAAGTG
ReverseCACCTCCTAAATCTACCAACTCACCAATCACAAAACCTCTAACAA
Product length (pb)436310
EVX2 (NM_001080458)ForwardGGGTTATTGTGATATTTTTAAGAATGGAGAGAGGGTTGTATAGTT
ReverseATTACCTTTACCATTATTTTCCTTATTACCTTTACCATTATTTTCCTT
Product length (pb)463398
KLF4 (NM_004235.6)ForwardATTTTTTGGATTTGGATTTTATTATTTTTTGGATTTGGATTTTATT
ReverseAAATATACACCRAATCCAATTCAAACRAACTCCCTACCATA
Product length (pb)339266
WNT3 (NM_030753)ForwardAGGAAATGTAAAGGTAGTAGGAGAGGAAATGTAAAGGTAGTAGGAG
ReverseAAAAACACAAAAATATTTCCAAACAAAAATATTTCCAAAAACCC
Product length (pb)286280

References

  1. Siegel, R.; Ward, E.; Brawley, O.; Jemal, A. Cancer statistics, 2011: The impact of eliminating socioeconomic and racial disparities on premature cancer deaths. CA A Cancer J. Clin. 2011, 61, 212–236. [Google Scholar] [CrossRef]
  2. Reid, B.M.; Permuth, J.B.; Sellers, T.A. Epidemiology of ovarian cancer: A review. Cancer Biol. Med. 2017, 14, 9–32. [Google Scholar] [CrossRef] [Green Version]
  3. Marchetti, C.; Pisano, C.; Facchini, G.; Bruni, G.S.; Magazzino, F.P.; Losito, S.; Pignata, S. First-line treatment of advanced ovarian cancer: Current research and perspectives. Expert Rev. Anticancer Ther. 2010, 10, 47–60. [Google Scholar] [CrossRef] [PubMed]
  4. Sheta, R.; Woo, C.M.; Roux-Dalvai, F.; Fournier, F.; Bourassa, S.; Droit, A.; Bertozzi, C.R.; Bachvarov, D. A metabolic labeling approach for glycoproteomic analysis reveals altered glycoprotein expression upon GALNT3 knockdown in ovarian cancer cells. J. Proteom. 2016, 145, 91–102. [Google Scholar] [CrossRef] [PubMed] [Green Version]
  5. Fruscio, R.; Corso, S.; Ceppi, L.; Garavaglia, D.; Garbi, A.; Floriani, I.; Franchi, D.; Cantu, M.G.; Bonazzi, C.M.; Milani, R.; et al. Conservative management of early-stage epithelial ovarian cancer: Results of a large retrospective series. Ann. Oncol. 2013, 24, 138–144. [Google Scholar] [CrossRef] [PubMed]
  6. Alouini, S. Management of ovarian cancer has changed. Gynecol. Oncol. 2012, 126, 313. [Google Scholar] [CrossRef]
  7. Faddaoui, A.; Bachvarova, M.; Plante, M.; Gregoire, J.; Renaud, M.C.; Sebastianelli, A.; Gobeil, S.; Morin, C.; Macdonald, E.; Vanderhyden, B.; et al. The mannose receptor LY75 (DEC205/CD205) modulates cellular phenotype and metastatic potential of ovarian cancer cells. Oncotarget 2016, 7, 14125–14142. [Google Scholar] [CrossRef]
  8. Kalluri, R.; Weinberg, R.A. The basics of epithelial-mesenchymal transition. J. Clin. Investig. 2009, 119, 1420–1428. [Google Scholar] [CrossRef] [Green Version]
  9. Takai, M.; Terai, Y.; Kawaguchi, H.; Ashihara, K.; Fujiwara, S.; Tanaka, T.; Tsunetoh, S.; Tanaka, Y.; Sasaki, H.; Kanemura, M.; et al. The EMT (epithelial-mesenchymal-transition)-related protein expression indicates the metastatic status and prognosis in patients with ovarian cancer. J. Ovarian Res. 2014, 7, 1757–2215. [Google Scholar] [CrossRef] [Green Version]
  10. Davidson, B.; Trope, C.G.; Reich, R. Epithelial-mesenchymal transition in ovarian carcinoma. Front Oncol 2012, 2. [Google Scholar] [CrossRef] [Green Version]
  11. Klymenko, Y.; Kim, O.; Stack, M.S. Complex Determinants of Epithelial: Mesenchymal Phenotypic Plasticity in Ovarian Cancer. Cancers 2017, 9, 104. [Google Scholar] [CrossRef] [PubMed] [Green Version]
  12. Tam, W.L.; Weinberg, R.A. The epigenetics of epithelial-mesenchymal plasticity in cancer. Nat. Med. 2013, 19, 1438–1449. [Google Scholar] [CrossRef] [PubMed] [Green Version]
  13. Bedi, U.; Mishra, V.K.; Wasilewski, D.; Scheel, C.; Johnsen, S.A. Epigenetic plasticity: A central regulator of epithelial-to-mesenchymal transition in cancer. Oncotarget 2014, 5, 2016–2029. [Google Scholar] [CrossRef] [PubMed] [Green Version]
  14. Sun, L.; Fang, J. Epigenetic regulation of epithelial-mesenchymal transition. Cell. Mol. Life Sci. 2016, 73, 4493–4515. [Google Scholar] [CrossRef] [PubMed]
  15. Gu, H.; Smith, Z.D.; Bock, C.; Boyle, P.; Gnirke, A.; Meissner, A. Preparation of reduced representation bisulfite sequencing libraries for genome-scale DNA methylation profiling. Nat. Protoc. 2011, 6, 468–481. [Google Scholar] [CrossRef] [PubMed]
  16. MacDonald, B.T.; Tamai, K.; He, X. Wnt/beta-catenin signaling: Components, mechanisms, and diseases. Dev Cell 2009, 17, 9–26. [Google Scholar] [CrossRef] [Green Version]
  17. Petersen, I.; Yang, L.; Zhang, Q.; Knösel, T.; Cui, T.; Chen, Y.; Albring, K.F.; Huber, O. Desmoplakin acts as a tumor suppressor by inhibition of the Wnt/β-catenin signaling pathway in human lung cancer. Carcinogenesis 2012, 33, 1863–1870. [Google Scholar] [CrossRef] [Green Version]
  18. Chen, B.; Wang, J.; Dai, D.; Zhou, Q.; Guo, X.; Tian, Z.; Huang, X.; Yang, L.; Tang, H.; Xie, X. AHNAK suppresses tumour proliferation and invasion by targeting multiple pathways in triple-negative breast cancer. J. Exp. Clin. Cancer Res. 2017, 36, 65. [Google Scholar] [CrossRef] [Green Version]
  19. Zhi, X.; Lin, L.; Yang, S.; Bhuvaneshwar, K.; Wang, H.; Gusev, Y.; Lee, M.-H.; Kallakury, B.; Shivapurkar, N.; Cahn, K.; et al. βII-Spectrin (SPTBN1) suppresses progression of hepatocellular carcinoma and Wnt signaling by regulation of Wnt inhibitor kallistatin. Hepatology 2015, 61, 598–612. [Google Scholar] [CrossRef]
  20. Keita, M.; Wang, Z.Q.; Pelletier, J.F.; Bachvarova, M.; Plante, M.; Gregoire, J.; Renaud, M.C.; Mes-Masson, A.M.; Paquet, E.R.; Bachvarov, D. Global methylation profiling in serous ovarian cancer is indicative for distinct aberrant DNA methylation signatures associated with tumor aggressiveness and disease progression. Gynecol. Oncol. 2013, 128, 356–363. [Google Scholar] [CrossRef]
  21. Faddaoui, A.; Sheta, R.; Bachvarova, M.; Plante, M.; Gregoire, J.; Renaud, M.C.; Sebastianelli, A.; Gobeil, S.; Morin, C.; Ghani, K.; et al. Suppression of the grainyhead transcription factor 2 gene (GRHL2) inhibits the proliferation, migration, invasion and mediates cell cycle arrest of ovarian cancer cells. Cell Cycle 2017, 16, 693–706. [Google Scholar] [CrossRef] [PubMed] [Green Version]
  22. Sheta, R.; Wang, Z.Q.; Bachvarova, M.; Plante, M.; Gregoire, J.; Renaud, M.C.; Sebastianelli, A.; Gobeil, S.; Morin, C.; Macdonald, E.; et al. Hic-5 regulates epithelial to mesenchymal transition in ovarian cancer cells in a TGFbeta1-independent manner. Oncotarget 2017, 8, 82506–82530. [Google Scholar] [CrossRef] [PubMed] [Green Version]
  23. Keita, M.; Bachvarova, M.; Morin, C.; Plante, M.; Gregoire, J.; Renaud, M.C.; Sebastianelli, A.; Trinh, X.B.; Bachvarov, D. The RUNX1 transcription factor is expressed in serous epithelial ovarian carcinoma and contributes to cell proliferation, migration and invasion. Cell Cycle 2013, 12, 972–986. [Google Scholar] [CrossRef] [PubMed] [Green Version]
  24. Li, Q.; Lai, Q.; He, C.; Fang, Y.; Yan, Q.; Zhang, Y.; Wang, X.; Gu, C.; Wang, Y.; Ye, L.; et al. RUNX1 promotes tumour metastasis by activating the Wnt/beta-catenin signalling pathway and EMT in colorectal cancer. J. Exp. Clin. Cancer Res. 2019, 38, 334. [Google Scholar] [CrossRef] [Green Version]
  25. Maldonado-Baez, L.; Cole, N.B.; Kramer, H.; Donaldson, J.G. Microtubule-dependent endosomal sorting of clathrin-independent cargo by Hook1. J. Cell Biol. 2013, 201, 233–247. [Google Scholar] [CrossRef] [Green Version]
  26. Sun, X.; Zhang, Q.; Chen, W.; Hu, Q.; Lou, Y.; Fu, Q.-H.; Zhang, J.-Y.; Chen, Y.-W.; Ye, L.-Y.; Wang, Y.; et al. Hook1 inhibits malignancy and epithelial–mesenchymal transition in hepatocellular carcinoma. Tumor Biol. 2017, 39. [Google Scholar] [CrossRef] [Green Version]
  27. Cao, J.; Huang, Y.-Q.; Jiao, S.; Lan, X.-B.; Ge, M.-H. Clinicopathological and prognostic significance of SHP2 and Hook1 expression in patients with thyroid carcinoma. Hum. Pathol. 2018, 81, 105–112. [Google Scholar] [CrossRef]
  28. Li, S.; Wang, L.; Zhao, Q.; Liu, Y.; He, L.; Xu, Q.; Sun, X.; Teng, L.; Cheng, H.; Ke, Y. SHP2 positively regulates TGFbeta1-induced epithelial-mesenchymal transition modulated by its novel interacting protein Hook1. J. Biol. Chem. 2014, 289, 34152–34160. [Google Scholar] [CrossRef] [Green Version]
  29. McLatchie, L.M.; Fraser, N.J.; Main, M.J.; Wise, A.; Brown, J.; Thompson, N.; Solari, R.; Lee, M.G.; Foord, S.M. RAMPs regulate the transport and ligand specificity of the calcitonin-receptor-like receptor. Nature 1998, 393, 333–339. [Google Scholar] [CrossRef]
  30. Nouguerède, E.; Berenguer, C.; Garcia, S.; Bennani, B.; Delfino, C.; Nanni, I.; Dahan, L.; Gasmi, M.; Seitz, J.-F.; Martin, P.-M.; et al. Expression of adrenomedullin in human colorectal tumors and its role in cell growth and invasion in vitro and in xenograft growth in vivo. Cancer Med. 2013, 2, 196–207. [Google Scholar] [CrossRef]
  31. Yue, W.; Dacic, S.; Sun, Q.; Landreneau, R.; Guo, M.; Zhou, W.; Siegfried, J.M.; Yu, J.; Zhang, L. Frequent Inactivation of RAMP2, EFEMP1 and Dutt1 in Lung Cancer by Promoter Hypermethylation. Clin. Cancer Res. 2007, 13, 4336–4344. [Google Scholar] [CrossRef] [PubMed] [Green Version]
  32. Accari, S.L.; Fisher, P.R. Emerging Roles of JmjC Domain-Containing Proteins. Int. Rev. Cell Mol. Biol. 2015, 319, 165–220. [Google Scholar] [CrossRef] [PubMed]
  33. Boeckel, J.N.; Derlet, A.; Glaser, S.F.; Luczak, A.; Lucas, T.; Heumuller, A.W.; Kruger, M.; Zehendner, C.M.; Kaluza, D.; Doddaballapur, A.; et al. JMJD8 Regulates Angiogenic Sprouting and Cellular Metabolism by Interacting With Pyruvate Kinase M2 in Endothelial Cells. Arterioscler. Thromb. Vasc. Biol. 2016, 36, 1425–1433. [Google Scholar] [CrossRef] [PubMed] [Green Version]
  34. Yeo, K.S.; Tan, M.C.; Wong, W.Y.; Loh, S.W.; Lam, Y.L.; Tan, C.L.; Lim, Y.-Y.; Ea, C.-K. JMJD8 is a positive regulator of TNF-induced NF-κB signaling. Sci. Rep. 2016, 6, 34125. [Google Scholar] [CrossRef] [Green Version]
  35. Wang, L.; Jiang, F.; Ma, F.; Zhang, B. MiR-873-5p suppresses cell proliferation and epithelial-mesenchymal transition via directly targeting Jumonji domain-containing protein 8 through the NF-kappaB pathway in colorectal cancer. J. Cell Commun. Signal. 2019, 13, 549–560. [Google Scholar] [CrossRef] [PubMed] [Green Version]
  36. Su, Y.; Wang, J. JmjC domain-containing protein 8 (JMJD8) represses Ku70/Ku80 expression via attenuating AKT/NF-kappaB/COX-2 signaling. Biochim. Biophys. Acta Mol. Cell Res. 2019, 1866, 118541. [Google Scholar] [CrossRef] [PubMed]
  37. Nie, X.; Xia, F.; Liu, Y.; Zhou, Y.; Ye, W.; Hean, P.; Meng, J.; Liu, H.; Liu, L.; Wen, J.; et al. Downregulation of Wnt3 Suppresses Colorectal Cancer Development Through Inhibiting Cell Proliferation and Migration. Front. Pharmacol. 2019, 10, 1110. [Google Scholar] [CrossRef]
  38. Wang, H.S.; Nie, X.; Wu, R.B.; Yuan, H.W.; Ma, Y.H.; Liu, X.L.; Zhang, J.Y.; Deng, X.L.; Na, Q.; Jin, H.Y.; et al. Downregulation of human Wnt3 in gastric cancer suppresses cell proliferation and induces apoptosis. Oncotargets Ther. 2016, 9, 3849–3860. [Google Scholar] [CrossRef] [Green Version]
  39. Wu, Y.; Ginther, C.; Kim, J.; Mosher, N.; Chung, S.; Slamon, D.; Vadgama, J.V. Expression of Wnt3 activates Wnt/beta-catenin pathway and promotes EMT-like phenotype in trastuzumab-resistant HER2-overexpressing breast cancer cells. Mol. Cancer Res. 2012, 10, 1597–1606. [Google Scholar] [CrossRef] [Green Version]
  40. Chu, Y.; Fan, W.; Guo, W.; Zhang, Y.; Wang, L.; Guo, L.; Duan, X.; Wei, J.; Xu, G. miR-1247-5p functions as a tumor suppressor in human hepatocellular carcinoma by targeting Wnt3. Oncol. Rep. 2017, 38, 343–351. [Google Scholar] [CrossRef] [Green Version]
  41. Xing, Z.; Wang, H.Y.; Su, W.Y.; Liu, Y.F.; Wang, X.X.; Zhan, P.; Lv, T.F.; Song, Y. Wnt3 knockdown sensitizes human non-small cell type lung cancer (NSCLC) cells to cisplatin via regulating the cell proliferation and apoptosis. Eur. Rev. Med Pharmacol. Sci. 2018, 22, 1323–1332. [Google Scholar] [CrossRef] [PubMed]
  42. Poppova, L.; Janovska, P.; Plevova, K.; Radova, L.; Plesingerova, H.; Borsky, M.; Kotaskova, J.; Kantorova, B.; Hlozkova, M.; Figulova, J.; et al. Decreased WNT3 expression in chronic lymphocytic leukaemia is a hallmark of disease progression and identifies patients with worse prognosis in the subgroup with mutated IGHV. Br. J. Haematol. 2016, 175, 851–859. [Google Scholar] [CrossRef] [PubMed]
  43. Yoshioka, S.; King, M.L.; Ran, S.; Okuda, H.; MacLean, J.A., 2nd; McAsey, M.E.; Sugino, N.; Brard, L.; Watabe, K.; Hayashi, K. WNT7A regulates tumor growth and progression in ovarian cancer through the WNT/beta-catenin pathway. Mol. Cancer Res. 2012, 10, 469–482,. [Google Scholar] [CrossRef] [PubMed] [Green Version]
  44. Juarez-Morales, J.L.; Schulte, C.J.; Pezoa, S.A.; Vallejo, G.K.; Hilinski, W.C.; England, S.J.; de Jager, S.; Lewis, K.E. Evx1 and Evx2 specify excitatory neurotransmitter fates and suppress inhibitory fates through a Pax2-independent mechanism. Neural Dev. 2016, 11, 5. [Google Scholar] [CrossRef] [Green Version]
  45. Rauch, T.A.; Wang, Z.; Wu, X.; Kernstine, K.H.; Riggs, A.D.; Pfeifer, G.P. DNA methylation biomarkers for lung cancer. Tumor Biol. 2012, 33, 287–296. [Google Scholar] [CrossRef]
  46. Liu, F.; Koval, M.; Ranganathan, S.; Fanayan, S.; Hancock, W.S.; Lundberg, E.K.; Beavis, R.C.; Lane, L.; Duek, P.; McQuade, L.; et al. Systems Proteomics View of the Endogenous Human Claudin Protein Family. J. Proteome Res. 2016, 15, 339–359. [Google Scholar] [CrossRef] [Green Version]
  47. Cherradi, S.; Martineau, P.; Gongora, C.; Del Rio, M. Claudin gene expression profiles and clinical value in colorectal tumors classified according to their molecular subtype. Cancer Manag. Res. 2019, 11, 1337–1348. [Google Scholar] [CrossRef] [Green Version]
  48. Sakaguchi, T.; Suzuki, S.; Higashi, H.; Inaba, K.; Nakamura, S.; Baba, S.; Kato, T.; Konno, H. Expression of tight junction protein claudin-5 in tumor vessels and sinusoidal endothelium in patients with hepatocellular carcinoma. J. Surg. Res. 2008, 147, 123–131. [Google Scholar] [CrossRef] [Green Version]
  49. Kudinov, A.E.; Deneka, A.; Nikonova, A.S.; Beck, T.N.; Ahn, Y.H.; Liu, X.; Martinez, C.F.; Schultz, F.A.; Reynolds, S.; Yang, D.H.; et al. Musashi-2 (MSI2) supports TGF-beta signaling and inhibits claudins to promote non-small cell lung cancer (NSCLC) metastasis. Proc. Natl. Acad. Sci. USA 2016, 113, 6955–6960. [Google Scholar] [CrossRef] [Green Version]
  50. Karnati, H.K.; Panigrahi, M.; Shaik, N.A.; Greig, N.H.; Bagadi, S.A.; Kamal, M.A.; Kapalavayi, N. Down regulated expression of Claudin-1 and Claudin-5 and up regulation of beta-catenin: Association with human glioma progression. Cns Neurol. Disord. Drug Targets 2014, 13, 1413–1426. [Google Scholar] [CrossRef]
  51. Escudero-Esparza, A.; Jiang, W.G.; Martin, T.A. Claudin-5 is involved in breast cancer cell motility through the N-WASP and ROCK signalling pathways. J. Exp. Clin. Cancer Res. 2012, 31, 43. [Google Scholar] [CrossRef] [PubMed] [Green Version]
  52. Soini, Y.; Eskelinen, M.; Juvonen, P.; Karja, V.; Haapasaari, K.M.; Saarela, A.; Karihtala, P. Strong claudin 5 expression is a poor prognostic sign in pancreatic adenocarcinoma. Tumour Biol. 2014, 35, 3803–3808. [Google Scholar] [CrossRef] [PubMed]
  53. Takala, H.; Saarnio, J.; Wiik, H.; Soini, Y. Claudins 1, 3, 4, 5 and 7 in esophageal cancer: Loss of claudin 3 and 4 expression is associated with metastatic behavior. APMIS Acta Pathol. Microbiol. Immunol. Scand. 2007, 115, 838–847. [Google Scholar] [CrossRef] [PubMed]
  54. Soini, Y.; Talvensaari-Mattila, A. Expression of claudins 1, 4, 5, and 7 in ovarian tumors of diverse types. Int. J. Gynecol. Pathol. 2006, 25, 330–335. [Google Scholar] [CrossRef]
  55. Turunen, M.; Talvensaari-Mattila, A.; Soini, Y.; Santala, M. Claudin-5 overexpression correlates with aggressive behavior in serous ovarian adenocarcinoma. Anticancer Res. 2009, 29, 5185–5189. [Google Scholar]
  56. Nissi, R.; Talvensaari-Mattila, A.; Kuvaja, P.; Paakko, P.; Soini, Y.; Santala, M. Claudin-5 is associated with elevated TATI and CA125 levels in mucinous ovarian borderline tumors. Anticancer Res. 2015, 35, 973–976. [Google Scholar]
  57. Hong, S.M.; Kelly, D.; Griffith, M.; Omura, N.; Li, A.; Li, C.P.; Hruban, R.H.; Goggins, M. Multiple genes are hypermethylated in intraductal papillary mucinous neoplasms of the pancreas. Mod. Pathol. 2008, 21, 1499–1507. [Google Scholar] [CrossRef]
  58. Ghaleb, A.M.; Yang, V.W. Kruppel-like factor 4 (KLF4): What we currently know. Gene 2017, 611, 27–37. [Google Scholar] [CrossRef]
  59. Tetreault, M.P.; Yang, Y.; Katz, J.P. Kruppel-like factors in cancer. Nat. Rev. Cancer 2013, 13, 701–713. [Google Scholar] [CrossRef]
  60. Yu, M.; Hao, B.; Zhan, Y.; Luo, G. Kruppel-like factor 4 expression in solid tumor prognosis: A meta-analysis. Clin. Chim. Acta 2018, 485, 50–59. [Google Scholar] [CrossRef]
  61. Park, C.S.; Lewis, A.; Chen, T.; Lacorazza, D. Concise Review: Regulation of Self-Renewal in Normal and Malignant Hematopoietic Stem Cells by Kruppel-Like Factor 4. Stem Cells Transl. Med. 2019, 8, 568–574. [Google Scholar] [CrossRef] [PubMed] [Green Version]
  62. Zhang, J.; Niu, Y.; Huang, C. Role of FoxM1 in the Progression and Epithelial to Mesenchymal Transition of Gastrointestinal Cancer. Recent Pat. Anti-Cancer Drug Discov. 2017, 12, 247–259. [Google Scholar] [CrossRef] [PubMed]
  63. Cui, J.; Shi, M.; Quan, M.; Xie, K. Regulation of EMT by KLF4 in gastrointestinal cancer. Curr. Cancer Drug Targets 2013, 13, 986–995. [Google Scholar] [CrossRef] [PubMed] [Green Version]
  64. Zhang, C.; Liu, J.; Zhang, Y.; Luo, C.; Zhu, T.; Zhang, R.; Yao, R. LINC01210 accelerates proliferation, invasion and migration in ovarian cancer through epigenetically downregulating KLF4. Biomed. Pharmacother. = Biomed. Pharmacother. 2019, 119, 109431. [Google Scholar] [CrossRef] [PubMed]
  65. Wang, B.; Shen, A.; Ouyang, X.; Zhao, G.; Du, Z.; Huo, W.; Zhang, T.; Wang, Y.; Yang, C.; Dong, P.; et al. KLF4 expression enhances the efficacy of chemotherapy drugs in ovarian cancer cells. Biochem. Biophys. Res. Commun. 2017, 484, 486–492. [Google Scholar] [CrossRef] [PubMed]
  66. Chen, Z.; Wang, Y.; Liu, W.; Zhao, G.; Lee, S.; Balogh, A.; Zou, Y.; Guo, Y.; Zhang, Z.; Gu, W.; et al. Doxycycline inducible Kruppel-like factor 4 lentiviral vector mediates mesenchymal to epithelial transition in ovarian cancer cells. PLoS ONE 2014, 9, e105331. [Google Scholar] [CrossRef]
  67. Roberts, D.M.; Pronobis, M.I.; Poulton, J.S.; Kane, E.G.; Peifer, M. Regulation of Wnt signaling by the tumor suppressor adenomatous polyposis coli does not require the ability to enter the nucleus or a particular cytoplasmic localization. Mol. Biol. Cell 2012, 23, 2041–2056. [Google Scholar] [CrossRef]
  68. Xing, R. miR-3648 Promotes Prostate Cancer Cell Proliferation by Inhibiting Adenomatous Polyposis Coli 2. J. Nanosci. Nanotechnol. 2019, 19, 7526–7531. [Google Scholar] [CrossRef]
  69. Geng, Y.; Zheng, X.; Hu, W.; Wang, Q.; Xu, Y.; He, W.; Wu, C.; Zhu, D.; Jiang, J. Hsa_circ_0009361 acts as the sponge of miR-582 to suppress colorectal cancer progression by regulating APC2 expression. Clin. Sci. 2019, 133, 1197–1213. [Google Scholar] [CrossRef]
  70. Xu, G.; Zhang, Z.; Zhang, L.; Chen, Y.; Li, N.; Lv, Y.; Li, Y.; Xu, X. miR-4326 promotes lung cancer cell proliferation through targeting tumor suppressor APC2. Mol. Cell. Biochem. 2018, 443, 151–157. [Google Scholar] [CrossRef]
  71. Wu, Z.; Shi, W.; Jiang, C. Overexpressing circular RNA hsa_circ_0002052 impairs osteosarcoma progression via inhibiting Wnt/beta-catenin pathway by regulating miR-1205/APC2 axis. Biochem. Biophys. Res. Commun. 2018, 502, 465–471. [Google Scholar] [CrossRef] [PubMed]
  72. Beta, M.; Chitipothu, S.; Khetan, V.; Biswas, J.; Krishnakumar, S. Hypermethylation of adenomatosis polyposis coli-2 and its tumor suppressor role in retinoblastoma. Curr. Eye Res. 2015, 40, 719–728. [Google Scholar] [CrossRef] [PubMed]
  73. Fang, B.; Li, G.; Xu, C.; Hui, Y. MicroRNA miR-1249 downregulates adenomatous polyposis coli 2 expression and promotes glioma cells proliferation. Am. J. Transl. Res. 2018, 10, 1324–1336. [Google Scholar] [PubMed]
  74. Mokarram, P.; Kumar, K.; Brim, H.; Naghibalhossaini, F.; Saberi-firoozi, M.; Nouraie, M.; Green, R.; Lee, E.; Smoot, D.T.; Ashktorab, H. Distinct high-profile methylated genes in colorectal cancer. PLoS ONE 2009, 4, e7012. [Google Scholar] [CrossRef] [PubMed] [Green Version]
  75. Zhang, K.; Wang, J.; Yang, L.; Yuan, Y.C.; Tong, T.R.; Wu, J.; Yun, X.; Bonner, M.; Pangeni, R.; Liu, Z.; et al. Targeting histone methyltransferase G9a inhibits growth and Wnt signaling pathway by epigenetically regulating HP1alpha and APC2 gene expression in non-small cell lung cancer. Mol. Cancer 2018, 17, 153. [Google Scholar] [CrossRef] [Green Version]
  76. Mohamed, N.E.; Hay, T.; Reed, K.R.; Smalley, M.J.; Clarke, A.R. APC2 is critical for ovarian WNT signalling control, fertility and tumour suppression. BMC Cancer 2019, 19, 677. [Google Scholar] [CrossRef] [Green Version]
  77. Ying, X.; Li-ya, Q.; Feng, Z.; Yin, W.; Ji-hong, L. MiR-939 promotes the proliferation of human ovarian cancer cells by repressing APC2 expression. Biomed. Pharmacother. = Biomed. Pharmacother. 2015, 71, 64–69. [Google Scholar] [CrossRef]
  78. Seagle, B.L.; Eng, K.H.; Yeh, J.Y.; Dandapani, M.; Schiller, E.; Samuelson, R.; Odunsi, K.; Shahabi, S. Discovery of candidate tumor biomarkers for treatment with intraperitoneal chemotherapy for ovarian cancer. Sci. Rep. 2016, 6, 21591. [Google Scholar] [CrossRef] [Green Version]
  79. Gaitanou, M.; Segklia, K.; Matsas, R. Cend1, a Story with Many Tales: From Regulation of Cell Cycle Progression/Exit of Neural Stem Cells to Brain Structure and Function. Stem Cells Int. 2019, 2019, 2054783. [Google Scholar] [CrossRef]
  80. Tsioras, K.; Papastefanaki, F.; Politis, P.K.; Matsas, R.; Gaitanou, M. Functional Interactions between BM88/Cend1, Ran-binding protein M and Dyrk1B kinase affect cyclin D1 levels and cell cycle progression/exit in mouse neuroblastoma cells. PLoS ONE 2013, 8, e82172. [Google Scholar] [CrossRef] [Green Version]
  81. Fleischer, T.; Frigessi, A.; Johnson, K.C.; Edvardsen, H.; Touleimat, N.; Klajic, J.; Riis, M.L.; Haakensen, V.D.; Wärnberg, F.; Naume, B.; et al. Genome-wide DNA methylation profiles in progression to in situ and invasive carcinoma of the breast with impact on gene transcription and prognosis. Genome Biol. 2014, 15, 435. [Google Scholar] [CrossRef] [PubMed] [Green Version]
  82. Quinlan, R.; Hutchison, C.; Lane, B. Intermediate filament proteins. Protein Profile 1994, 1, 779–911. [Google Scholar] [PubMed]
  83. Li, W.; Bai, X.; Li, J.; Zhao, Y.; Liu, J.; Zhao, H.; Liu, L.; Ding, M.; Wang, Q.; Shi, F.Y.; et al. The nucleoskeleton protein IFFO1 immobilizes broken DNA and suppresses chromosome translocation during tumorigenesis. Nat. Cell Biol. 2019, 21, 1273–1285. [Google Scholar] [CrossRef] [PubMed]
  84. Campan, M.; Moffitt, M.; Houshdaran, S.; Shen, H.; Widschwendter, M.; Daxenbichler, G.; Long, T.; Marth, C.; Laird-Offringa, I.A.; Press, M.F.; et al. Genome-scale screen for DNA methylation-based detection markers for ovarian cancer. PLoS ONE 2011, 6, e28141. [Google Scholar] [CrossRef]
  85. Christie, M.; Jorissen, R.N.; Mouradov, D.; Sakthianandeswaren, A.; Li, S.; Day, F.; Tsui, C.; Lipton, L.; Desai, J.; Jones, I.T.; et al. Different APC genotypes in proximal and distal sporadic colorectal cancers suggest distinct WNT/beta-catenin signalling thresholds for tumourigenesis. Oncogene 2013, 32, 4675–4682. [Google Scholar] [CrossRef]
  86. Kypta, R.M.; Waxman, J. Wnt/beta-catenin signalling in prostate cancer. Nat. Rev. Urol. 2012, 9, 418–428. [Google Scholar] [CrossRef]
  87. Lin, S.Y.; Xia, W.; Wang, J.C.; Kwong, K.Y.; Spohn, B.; Wen, Y.; Pestell, R.G.; Hung, M.C. Beta-catenin, a novel prognostic marker for breast cancer: Its roles in cyclin D1 expression and cancer progression. Proc. Natl. Acad. Sci. USA 2000, 97, 4262–4266. [Google Scholar] [CrossRef] [Green Version]
  88. Kovacs, D.; Migliano, E.; Muscardin, L.; Silipo, V.; Catricala, C.; Picardo, M.; Bellei, B. The role of Wnt/beta-catenin signaling pathway in melanoma epithelial-to-mesenchymal-like switching: Evidences from patients-derived cell lines. Oncotarget 2016, 7, 43295–43314. [Google Scholar] [CrossRef] [Green Version]
  89. Teeuwssen, M.; Fodde, R. Wnt Signaling in Ovarian Cancer Stemness, EMT, and Therapy Resistance. J. Clin. Med. 2019, 8, 1658. [Google Scholar] [CrossRef] [Green Version]
  90. Nguyen, V.H.L.; Hough, R.; Bernaudo, S.; Peng, C. Wnt/beta-catenin signalling in ovarian cancer: Insights into its hyperactivation and function in tumorigenesis. J. Ovarian Res. 2019, 12, 122. [Google Scholar] [CrossRef] [Green Version]
  91. Andersen, J.S.; Lyon, C.E.; Fox, A.H.; Leung, A.K.L.; Lam, Y.W.; Steen, H.; Mann, M.; Lamond, A.I. Directed Proteomic Analysis of the Human Nucleolus. Curr. Biol. 2002, 12, 1–11. [Google Scholar] [CrossRef] [Green Version]
  92. Juhling, F.; Kretzmer, H.; Bernhart, S.H.; Otto, C.; Stadler, P.F.; Hoffmann, S. metilene: Fast and sensitive calling of differentially methylated regions from bisulfite sequencing data. Genome Res. 2016, 26, 256–262. [Google Scholar] [CrossRef] [PubMed] [Green Version]
  93. Livak, K.J.; Schmittgen, T.D. Analysis of relative gene expression data using real-time quantitative PCR and the 2(-Delta Delta C(T)) Method. Methods 2001, 25, 402–408. [Google Scholar] [CrossRef] [PubMed]
  94. Dionne, U.; Chartier, F.J.M.; Lopez de Los Santos, Y.; Lavoie, N.; Bernard, D.N.; Banerjee, S.L.; Otis, F.; Jacquet, K.; Tremblay, M.G.; Jain, M.; et al. Direct Phosphorylation of SRC Homology 3 Domains by Tyrosine Kinase Receptors Disassembles Ligand-Induced Signaling Networks. Mol. Cell 2018, 70, 995–1007.e11. [Google Scholar] [CrossRef] [Green Version]
Figure 1. RRBS analysis of genes displaying common differentially methylated regions (DMRs) in their exons and promoter regions. (A) Venn diagram analysis of the three different comparison (M vs. E) experimental combinations used for RRBS analysis (see Table 1B for details); (B) A funnel plot indicating the selection criteria for the genes retained for further analyses, exhibiting a high degree of methylation in their promoter regions and implicated in cancer-related EMT signaling.
Ijms 21 01848 g001
Figure 2. Validation of methylation status and the corresponding expression levels of the ten RRBS-retained genes in the SKOV3-LY75-related EMT model. (A) Bisulfite-sequencing PCR (BSP) analysis of the methylation status of selected genes in the SKOV3-M (sh-control) and the SKOV3-E (sh3-8 clone). Filled circles represent methylated CpGs and open circles represent unmethylated CpGs. The indicated positions on the CpG plots represent the number of nucleotides stretching upstream (+) and downstream (−) of the transcription initiation (ATG) codon for each gene analyzed. (B) Quantitative PCR analysis of the mRNA expression profiles of the ten selected genes in SKOV3-M and SKOV3-E cells. In all analyses, mRNA levels were displayed as relative to their expression levels in SKOV3-M cells and normalized to the ribosomal 18S (control) gene expression. Error bars represent SD; * p < 0.05. (C) Western blot analysis of the protein expression levels of the 10 selected genes in SKOV3-M and SKOV3-E cells. β-Actin was used as a loading control.
Ijms 21 01848 g002
Figure 3. Ingenuity pathways analysis (IPA) of the 6666 common hyper- and hypomethylated genes in SKOV3-E cells. (A) Functional analysis for a dataset of the common hyper- and hypomethylated genes. Top functions that meet a Bonferroni–Holm multiple testing correction p-value of 0.05 are displayed. (B) List of selected canonical pathways that were significantly altered in SKOV3-E cells. Top functions that meet a Bonferroni–Holm multiple testing correction p-value of 0.05 are displayed. (C) Venn diagram analysis displaying common genes between the EMT, Wnt/β-catenin, and TGF-β signaling pathways, as derived from the IPA canonical pathways analysis.
Ijms 21 01848 g003
Figure 4. (A) Representative images of SKOV3-M and OVCAR8-M (parental) cells upon XAV939, SB431542, or DMSO (control) treatment. (B) Western blot analysis of Ly75, β-catenin, TGF-B-RII, p-Smad2/3, E-cadherin, and N-cadherin expression levels in SKOV3-M and OVCAR8-M cells upon treatment with the Wnt/β catenin inhibitor XAV939, the TGF-β inhibitor SB431542, and DMSO (control treatment). (C) Western blot analysis of the expression levels of different members (β-catenin, Axin1, Apc2, and Wnt3) of the Wnt/β catenin pathway in SKOV3-M, SKOV3-E, OVCAR8-M, and OVCAR8-E cells. β-Actin was used as a loading control.
Ijms 21 01848 g004
Figure 5. Identification of LY75 interaction partners. (A) Gel electrophoresis (Coomassie blue-stained) of anti-LY75 immunoprecipitated protein fractions in SKOV3-E and SKOV-M cells. Bands of interest are indicated by arrows. (B) Venn diagram analysis of LY75-interaction proteins identified by LC-MS-MS in SKOV3-M cells, either eluted directly from beads (SKOV3-M beads), or gel-extracted (SKOV3-M gel), compared to nonspecific LY75 interaction proteins extracted from the SKOV3-E (LY75 KD) cells. (C) Immunofluorescence analysis of LY75 and DSP cellular co-localization in SKOV3-M and OVCAR8-M cells. The green label is also indicative for a specific nuclear localization of LY75 in both epithelial ovarian cancer (EOC) cell lines. (D) Immunofluorescence analysis of LY75 and fibrillarin nucleolar co-localization in SKOV3-M and OVCAR8-M cells.
Ijms 21 01848 g005
Table 1. Reduced representation bisulfite sequencing (RRBS) analysis of altered DNA methylation patterns upon Ly75-mediated epithelial–mesenchymal transition (EMT) variations in SKOV3 cells.
A. Description of the SKOV3 Clones Used (as Described in [14])Phenotype
shC-S: control shRNA expressed in SKOV3 cellsMesenchymal (M)
sh-LY75-S: shRNA-mediated LY75-KD in SKOV3 cellsEpithelial (E)
LY75-KO-S: CRISPR/Cas9-mediated Ly75 KO in SKOV3 cellsEpithelial (E)
LY75-shR-S: sh-resistant-Ly75 cDNA expressed in sh-LY75-S cellsMesenchymal (M)
B. Experimental Comparison Combinations Used for RRBS AnalysisNumber of Differently Methylated Regions (Hypo + Hyper) Identified in Exons and Promoter Regions of Different Genes
shC-S vs. sh-LY75-S (M vs. E)10,722
LY75-R-S vs. LY75-KO-S (M vs. E)11,014
(mix: shC-S + LY75-R-S) vs. (mix: sh-LY75-S + LY5-KO-S) (M vs. E)9105
Table 2. Ly75 partners identified by the immunoprecipitation experiments.
Ly75 Partners Identified by ScaffoldM Weight
AHNAK: Neuroblast differentiation-associated protein629 kDa
PLEC: Isoform 4 of Plectin516 kDa
DSP: Desmoplakin332 kDa
SPTAN1: Spectrin alpha chain, nonerythrocytic285 kDa
SPTBN1: Spectrin beta chain275 kDa
CAD protein243 kDa
RRBP1: Ribosome-binding protein 1152 kDa
ACTN4: Alpha-actinin-4105 kDa
MVP: Major vault protein99 kDa
DNM2: Isoform 2 of Dynamin-298 kDa
HSD17B4: Peroxisomal multifunctional enzyme type 280 kDa
HNRNPM: Heterogeneous nuclear ribonucleoprotein M78 kDa
LMNA: Prelamin-A/C74 kDa
PABPC1: Polyadenylate-binding protein 171 kDa
SEPT9: Septin-965 kDa
KRT8: Keratin, type II cytoskeletal 854 kDa
SPATS2L: Isoform 2 of SPATS2-like protein54 kDa
KRT7: Keratin, type II cytoskeletal 751 kDa
KRT18: Keratin, type I cytoskeletal 1848 kDa
KHDRBS1: KH domain-containing, RNA-binding, signal transduction-associated protein 148 kDa
KRT19: Keratin, type I cytoskeletal 1944 kDa
RPL6: 60S ribosomal protein L633 kDa

