Abstract
Phosphate (Pi) transporters play critical roles in Pi acquisition and homeostasis. However, currently little is known about these genes in oil crops. In this study, we aimed to characterize the five Pi transporter gene families (PHT1-5) in allotetraploid Brassica napus. We identified and characterized 81 putative PHT genes in B. napus (BnaPHTs), including 45 genes in PHT1 family (BnaPHT1s), four BnaPHT2s, 10 BnaPHT3s, 13 BnaPHT4s and nine BnaPHT5s. Phylogenetic analyses showed that the largest PHT1 family could be divided into two groups (Group I and II), while PHT4 may be classified into five, Groups I-V. Gene structure analysis revealed that the exon-intron pattern was conservative within the same family or group. The sequence characteristics of these five families were quite different, which may contribute to their functional divergence. Transcription factor (TF) binding network analyses identified many potential TF binding sites in the promoter regions of candidates, implying their possible regulating patterns. Collinearity analysis demonstrated that most BnaPHTs were derived from an allopolyploidization event (~40.7%) between Brassica rapa and Brassica oleracea ancestors, and small-scale segmental duplication events (~39.5%) in the descendant. RNA-Seq analyses proved that many BnaPHTs were preferentially expressed in leaf and flower tissues. The expression profiles of most colinearity-pairs in B. napus are highly correlated, implying functional redundancy, while a few pairs may have undergone neo-functionalization or sub-functionalization during evolution. The expression levels of many BnaPHTs tend to be up-regulated by different hormones inductions, especially for IAA, ABA and 6-BA treatments. qRT-PCR assay demonstrated that six BnaPHT1s (BnaPHT1.11, BnaPHT1.14, BnaPHT1.20, BnaPHT1.35, BnaPHT1.41, BnaPHT1.44) were significantly up-regulated under low- and/or rich- Pi conditions in B. napus roots. This work analyzes the evolution and expression of the PHT family in Brassica napus, which will help further research on their role in Pi transport.
1. Introduction
Phosphorus (Pi) plays a central role in energy metabolism, signal transduction cascades, regulation of enzymes and as a structural element in nucleic acids and phospholipids [1]. Despite being one of the most abundant macronutrients in plant tissues, Pi forms organic complexes and undergoes inorganic fixation with cations in soil solution [2]. It was widely proved that Pi is very important for crop growth and the crop yield can be obviously increased by applying phosphate fertilizer [3]. However, Pi is one of the least available plant macronutrients [4]. Therefore, it is crucial to increase the efficiency of Pi absorption and utilization in crop production.
In order to improve Pi uptake efficiency from the soil, plants have developed an array of morphophysiological, biochemical, and molecular adaptations to adapt to the low availability of Pi [2,5,6], including reduced plant growth, changed root morphology and architecture, and expressed Pi response genes [7,8,9,10,11]. Among the molecular response processes, the Pi transporters play a pivotal role in the acquisition and mobilization of Pi in plants [8,12,13,14]. To date, five Pi transporter families have been identified and isolated in plants: PHT1-5 [15,16]. Among them, the PHT1 family is the high-affinity Pi transporter which represents a group of Pi carriers usually found in plasma membrane [17]. Members of this family play a wide role in Pi uptake and remobilization throughout plant development. For example, Arabidopsis AtPHT1;1 and AtPHT1;4 play major roles in Pi acquisition in both low- and high- Pi environments [12,13,14]; rice OsPht1;1 [18], OsPht1;2 and OsPht1;6 [19] were involved in Pi uptake and translocation. The other four families (PHT2-5) also play important roles in plant Pi transport. For example, Arabidopsis AtPHT2;1 in PHT2 family is a chloroplast low-affinity Pi transporter [20,21]; the PHT3 homologs act as a Pi/H+ symporter Pi/OH− antiport to play a critical role in Pi exchange between cytoplasm and mitochondria matrix [22,23]; AtPHT4;6 in PHT4 family transports Pi out of the Golgi lumenal space to be recycled after release from glycosylation [24]; while the PHT5 family members are known to be vacuolar Pi transporter [16]. Therefore, members of the five PHT families play critical roles in plant Pi uptake, translocation and mobilization. Based on the increasing available sequenced genome datasets, the PHT gene families were globally identified and analyzed in many plant species, such as Arabidopsis [25], rice [26], and poplar [27]. However, most of these studies merely focus on the PHT1 family, and few reports about the whole PHT family at genome-wide level are available.
Brassica napus L. is an important oil crop with a world production of over 60 million tons each year. It is demonstrated that B. napus is sensitive to Pi deficiency. A lack of available Pi in soil may inhibit its growth and even its yield and quality [28]. Although the PHT genes (PHTs) are important for plant Pi uptake and transport, only the PHT1 family [29] and one gene (BnPHT1;4) [30] were studied in B. napus to date. Global identification, and systematic evolution and expression profile analysis of the PHT families’ genes in B. napus genome will provide fundamental information for further functional assays of their roles in Pi uptake and translocation in this species.
In the present study, we applied a systematic identification and classification of the five PHT gene families in B. napus genome. The physicochemical properties, subcellular localization, gene structure, phylogenetic relationship, and evolution mechanism of the candidate PHTs in B. napus genome (BnaPHTs) were analyzed by diverse Bioinformatic methods. The spatiotemporal expression profiles of the candidates in 50 B. napus tissues and/or organs across different developmental stages were analyzed, and we found that most genes were preferentially expressed in leaf and flower tissues. Moreover, many BnaPHTs were proved to have hormone-induced expression profiles (IAA, auxin; GA3, gibberellin; 6-BA, cytokinin; ABA, abscisic acid and ACC, ethylene), based on our RNA-Seq dataset. In addition, their expression patterns in low- or high- Pi stresses were further assessed by qRT-PCR method, which proved that several genes in PHT1 family are significantly up-regulated under low- Pi conditions in B. napus roots.
2. Results
2.1. Identification of PHT Genes in B. napus
To identify the PHTs in the B. napus genome, a preliminary BLASTP search was performed using the sequences of known Arabidopsis PHT proteins (AtPHTs) as queries, based on the available B. napus genome database in GENOSCOPE (Darmor–bzh, http://www.genoscope.cns.fr/brassicanapus/) [31]. In each case, a large number of deduced PHT homologous sequences were acquired. The redundant sequences were firstly discarded from our dataset. Then the remaining sequences were verified by SMART (http://smart.embl-heidelberg.de/). The sequences possessing incomplete open reading frames (ORFs), especially long deletion were excluded from further analysis, such as BnaCnng51590D (Table S1). Finally, we obtained 81 typical PHT genes with relative complete ORFs in B. napus (BnaPHTs), and temporarily named them according to their order on the corresponding chromosomes (Table S1). To our knowledge, the candidate PHT genes in B. napus consist of the largest PHT family known to date [25,26,27,32]. This may attribute to B. napus (AACC. n=19) is an allotetraploid produced by the recent hybridization between B. rapa (AA. n=10) and B. oleracea (CC. n=9) about 7500 years ago.
Similarly, we also identified 46 candidate PHT homologs in Brassica rapa (BrPHTs) and 26 PHT homologs in Brassica oleracea (BoPHTs) from Phytozome v12 (https://phytozome.jgi.doe.gov/) by the same method (Table S2).
2.2. Phylogenetic Analysis of B. napus PHT Gene Family
To determine the evolutionary relationship of B. napus PHT gene families, we constructed a Neighbor-Joining (NJ) tree and a Maximum Likelihood (ML) trees of the candidate 165 PHT proteins from B. napus (80), Arabidopsis (22), B. rapa (42) and B. oleracea (21) based on the alignment of the full-length amino acid sequences using MEGA5.0 respectively. Five members (BnaPHT1.24, BrPHT1.25, BrPHT5.3, BoPHT1.4 and BoPHT1.5) were excluded from the phylogenetic trees because of technological reason (lacking common sites for the sequence pairs due to large sequence deletion).
The topologies and bootstrap support values of the NJ and ML trees were highly congruent (Figure 1 and Figure S1), and the candidate PHT members were clustered into five main clusters: PHT1-5 families (Figure 1). The PHT1 family is the largest one which includes nine genes in Arabidopsis (AtPHT1s), 25 in B. rapa (BrPHT1s), 8 B. oleracea (BoPHT1s) and 44 in B. napus (BnaPHT1s); the PHT2 family contained one AtPHT2 gene, two BrPHT2s, two BoPHT2s and four BnaPHT2s; the PHT3 family included three AtPHT3s, five BrPHT3s, four BoPHT3s and 10 BnaPHT3s; the PHT4 family was consisted of six AtPHT4s, seven BrPHT4s, six BoPHT4s and 13 BnaPHT4s; while the PHT5 family contained three AtPHT5s, three BrPHT5s, one BoPHT5 gene and nine BnaPHT5s (Figure 1). Consistent with previous studies [33], the PHT1 family could be further classified into two groups, where group I composed of 11 BnaPHT1s, seven BrPHT1s and five BoPHT1s that were homologous to AtPHT1.8 and AtPHT1.9; group II contained 33 BnaPHT1s, 18 BrPHT1s and three BoPHT1s that were homologous to AtPHT1.1-AtPHT1.7. Similarly, the PHT4 family might be classified into five groups (Group I-Ⅴ) (Figure 1), where group I contained nine Brassica members and AtPHT4.2 and AtPHT4.3; group II consisted of AtPHT4.5 and Brassica homologs; group III included AtPHT4.6 and four Brassica homologs; group IV composed of AtPHT4.1 and four Brassica homologs, and group Ⅴ included AtPHT4.4 and eight Brassica homologs.
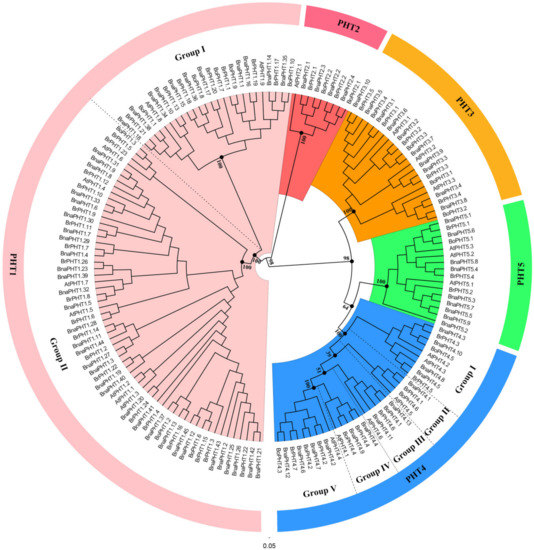
Figure 1.
Phylogenetic analysis of phosphate transporter (PHT) gene families in Brassica napus, Arabidopsis, Brassica rapa and Brassica oleracea. The colored background indicates different PHT family. The different groups within the PHT1 and 4 families were separated by dashed lines, respectively.
Physicochemical property analysis showed that the molecular weight (MW) of candidate BnaPHT proteins (BnaPHTs) ranged from19.20-78.90 kDa, the isoelectric point (IP) is 5.44–10.01 (Table S1). The amino acid length of BnaPHTs varied from 279 to 704 aa, and these of PHT5 family are almost the longest while the PHT3 family are obviously shorter than the others. Subcellular localization analysis found that members of PHT1 and 4 families are located on the cell membrane, and members of PHT2 and 3 families are located on chloroplast and mitochondrion, respectively. In contrast, the majority of the PHT5 family are located on the cell membrane and vacuole except for one (BnaPHT5.2), which was located on the cell membrane and chloroplast. The diverse subcellular localization features (Table S1) of these five families were highly consistent with the functional diversity of their homologs in plants [33].
2.3. Gene Structure of PHT Genes
To gain insight into the structural feature of PHTs in B. napus, Arabidopsis, B. rapa and B. oleracea, we compared their full-length cDNA and genomic DNA sequences to determine the insertion site and number of introns within each gene. The results of B. napus and Arabidopsis PHTs were viewed by GSDS software in Figure 2. The intron patterns of the five PHT families across these four species were presented in a schematic form in Figure S2, respectively.
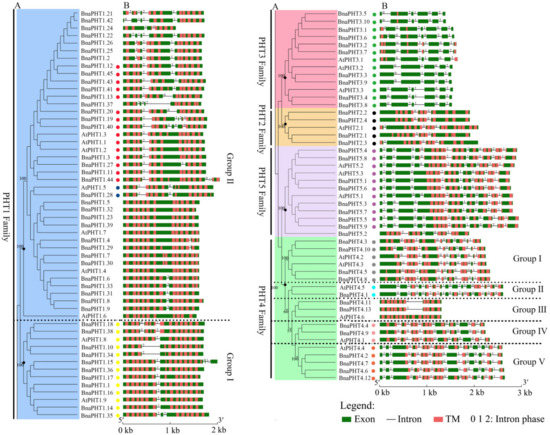
Figure 2.
Gene structures of candidate PHT genes (PHTs) across different families. (A) Phylogenetic analysis of PHT families in B. napus and Arabidopsis. Colored background indicates genes belong to different families. The dashed lines represent the genes belong to different groups. (B) Gene structure of PHTs in B. napus (BnaPHTs) and Arabidopsis (AtPHTs). Exon was indicated by green boxes, transmembrane (TM) by red boxes, and the spaces between the colored boxes correspond to introns. Numbers 0, 1, 2 represent introns in phases 0, 1, and 2, respectively. The colored dots represent the conservative intron insertion patterns corresponding to the Figure S2, respectively.
As shown in Figure 2, the coding regions of most PHTs in B. napus and Arabidopsis are disrupted by introns varying from one to 14, except for 9 members in PHT1 family (Figure 2B). Among the five PHT families, the gene structures in PHT2, 3, and 5 families were highly conserved in terms of the exon-intron structure with only a few exceptions that may be attributed to low genome sequence quality, respectively (Figure 2B). The genes in PHT2 family possessed 2-3 introns, those in PHT3 family possessed 4-6 introns; and those in PHT5 family generally possessed 8-9 introns except for BnaPHT5.2, BrPHT5.2 and BrPHT5.3 (containing four or six introns). In contrast, the gene structures in PHT1 and 4 families were relatively less conserved. The PHTs in PHT1 family generally possessed 1-4 introns, where 21 members of the 54 PHT1s have one intron, 14 PHT1s contain two introns, ten PHT1s have three or four introns, respectively (Figure 2B). However, the gene structures were generally conserved in the same branch in PHT1 family that was consistent with their group classification in the phylogenetic tree, particularly the group I (Figure 2A), forming three conserved intron patterns across the four species investigated (Figure 2B). Similarly, the intron patterns of PHTs in PHT4 family could be summarized into -five conserved intron patterns (Figure 2B). Similar results were observed in B. rapa and B. oleracea PHTs (Figure S2). These results indicated that the gain and loss of introns likely occurred in these two families during evolution.
Taken together, our results showed that the exon-intron patterns were generally conserved in each family or group in these five PHT families across the four species, indicating that each pattern shares a common ancestor.
2.4. Sequence Analysis of B. napus PHT Proteins
To analyze the sequence features of different PHT families in B. napus, we predicted the domains in the full-length protein sequences of the five PHT families using SMART software (Figure 3 and Table S3).
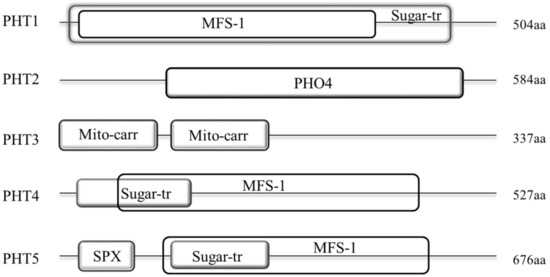
Figure 3.
Architecture of conserved protein domains in the five PHT families in B. napus. The conserved domains by Simple modular architecture research tool (SMART) were represented by different size boxes. The average protein length of each family is indicated on the right.
Our results showed that the protein structures of these five families were generally different. Among them, members of PHT1, 4 and 5 families display a similar domain architecture that they all contain the major facilitator superfamily (MFS-1, functions in transmembrane transport) and Sugar (and other) transporter (Sugar-tr, functions in transmembrane transport) domains. However, the sequence features of these two domains were not conservative among these three families with the MFS-1 and Sugar-tr domains are partial or even completely overlapped in these families. As shown in Figure 3, the MFS-1 domain (~400 aa) in PHT1 family is completely overlapped by the Sugar-tr domain (~480 aa) near the N-terminus. In contrast, the Sugar-tr domain is completely overlapped by the MFS-1 domain in PHT5 family (Figure 3). In addition, nearly all BnaPHT5s (except BnaPHT5.2) contained an additional highly conservative SYG1/Pho81/XPR1 (SPX, functions in phosphate transport) domain before the MFS-1 domain with a length of approximately 52 aa. In contrast, the MFS-1 and Sugar-tr domains are partial overlapped in PHT4 family. Furthermore, compared to PHT1 family, the MFS-1 domains were relatively highly conserved in both of PHT4 or PHT5 families, in contrast, the Sugar-tr domains were relatively poorly conserved in these two families. However, the sequence features of PHT2 and PHT3 were quite different from the PHT1, 4 and 5 families (Figure 3). The average lengths of the BnaPHT2s and BnaPHT3s were 584 aa and 337 aa, respectively. Moreover, the BnaPHT2s contained the highly conserved (PHO4, functions in inorganic phosphate transmembrane transport) domain near the C-terminus (approximately 400 aa in length), whereas the BnaPHT3s included two separated conservative Mitochondrial carrier (Mito-carr, substrate carrier proteins that are involved in energy transfer) domains at the N-terminus (about 90 aa for each domain).
The TMPRED software analyses showed that nearly all members of these five PHT families contained different numbers of transmembrane (TM) domains, suggesting this domain is important for their functions in plants. As shown in Figure 2B, all the BnaPHT1s contained 6-14 transmembrane (TM) domains; the BnaPHT2s contained 10-12 TM domains which are consistent with the previous report [5,20]; the BnaPHT4s and BnaPHT5s contained 8-14 and 11-13 TM domains, respectively; in addition, most of the BnaPHT3s possessed only 1-5 TM domains, but four members (BnaPHT3.3, BnaPHT3.4, BnaPHT3.8 and BnaPHT3.9) which belonged to the same branch with AtPHT3.2, and AtPHT3.2 lacked the TM domains. Because all the BnaPHT3s contained two mito-carr domains (including BnaPHT3.3, BnaPHT3.4, BnaPHT3.8 and BnaPHT3.9), the PHT3 family may rely on the mito-carr domain instead of the TM domain to function as Pi transporters. Furthermore, the sequence characteristics and spatial positions of the TM domains are generally conserved in each family or group. However, their locations were different across different families, such as those of BnaPHT5s were located at the C-terminal while those in BnaPHT1s were distributed in the full length ORF region.
Taken together, our results indicate that the sequence characteristics were conserved in each of the five PHT families or groups but were different across them, which may have contributed to functional divergence across different families.
2.5. Chromosomal Distribution and Duplication of BnaPHTs
To investigate the gene duplication events within B. napus PHT families, we analyzed the chromosomal locations and collinearity relationship of candidates based on the annotion information in Genoscope database.
Our results showed that the candidate BnaPHTs were distributed on all the 19 B. napus chromosomes, unevenly (Figure 4 and Table S1). The numbers of BnaPHTs between the two subgenomes are uneven, where the An-subgenome has 40 BnaPHTs while the Cn-subgenome possess 34 BnaPHTs. The genes distribution on each chromosome was bias, such as the A09 had a maximum number of nine genes, while A01 and A08 had a minimum of one gene. In addition, the chromosome information of seven genes was currently unknown (Table S1).
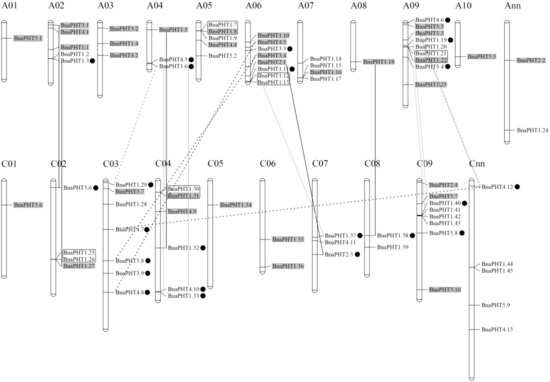
Figure 4.
Distribution of PHT genes on B. napus chromosomes. The 81 BnaPHTs were mapped on the 19 chromosomes, except for seven genes. The Ann and Cnn chromosomes represent the chromosomal fragments mapped to An or Cn subgenome respectively, but the locations of these are as yet unclear. The genes in the gray background were originated from the whole genome duplication event (WGD). The black, gray and dashed lines represent the genes involved in homologous exchange (HE), segmental exchange (SE), and segmental duplication (SD) events with the new duplicated genes are marked in black dot, respectively. The genes in the black box represent tandem duplication (TD) pairs.
On the basis of the collinearity analyses between B. napus, B. rape and/or B. oleracea, we found that 65 of the 81 BnaPHTs have colinear relationships with BrPHTs, BoPHTs and/or BnaPHTs (Table S5). Of these, ~50.8% of the colinear genes were inherited from B. rapa (22 genes, ~33.8%) or B. oleracea (11 genes, ~17.0%) genomes. Given that B. napus is a new allotetraploid that was hybridized by B. rapa and B. oleracea about 7500 years ago, these results demonstrated that most of the BnaPHTs (33/81, ~40.7%) were derived from its parents through allopolyploidy. Moreover, up to ~18.5% BnaPHTs were demonstrated to be derived from the segmental exchange (SE) event; ~7.4 % genes were from the homologous exchange (HE) event; and ~7.4% genes were from the segmental duplication (SD) event (Table S5), indicating this family tend to undergo small-scale duplication events in B. napus genome. Furthermore, we found that all the five PHT families have the largest number of genes that are orthologous pairs between B. napus and B. rapa or B. oleracea, including 14 pairs in PHT1 family, three pairs in PHT2 family, six pairs in PHT3 family, and five pairs in both of PHT4 and 5 families (Table S5). There are three, three and two pairs of BnaPHT1s involved in HE, SE, and SD events respectively; one pair of PHT2-4 families in HE event respectively; one pair of PHT3-5 families in SE event respectively; and one pair of PHT3 family, and three pairs of PHT4 family in SD event respectively (Table S5). In addition, five pairs of tandem duplication (TD) genes (BnaPHT1.7/1.8, BnaPHT1.12/1.13, BnaPHT1.21/1.22, BnaPHT1.25/1.26, and BnaPHT1.30/1.31) were identified (~6.2%), according to their distributions on chromosomes and sequence similarity (Table S5).
Overall, our results demonstrated that allopolyploid (large-scale duplication event) and small-scale duplication events after genomic heterogeneous doubling (HE, SE, and SD) were the main driving force for the large expansion of PHT gene family in B. napus genome. However, the trends of small-scale duplication events in the five PHT families were different.
2.6. Transcription Factor Binding Network Analysis
Gene expression and even function is commonly regulated by many kinds of transcription factor genes (TFs). To explore the transcriptional regulating mechanism of BnaPHTs, we analyzed the putative TFs binding sites in their promoter regions (upstream 1500 bp) by PlantTFDB database, and constructed their TF-binding network using Cytoscape software (Figure 5).
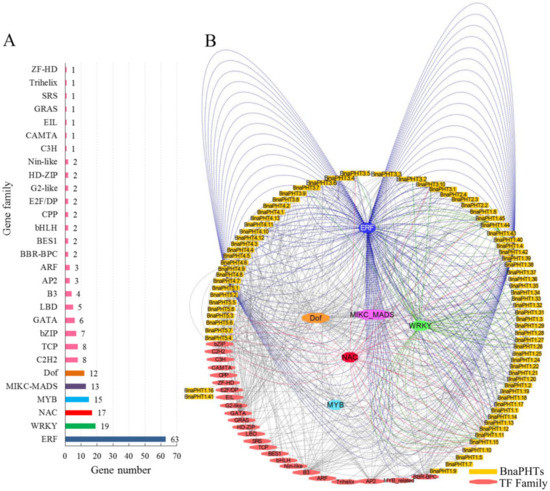
Figure 5.
Transcription factor (TF) binding network of BnaPHTs. (A): The TF gene families that may bind to the promoter regions of BnaPHTs; (B): The TFs binding network of BnaPHTs based on the anlayses in PlantTFDB database.
In general, various putative TF binding sites were observed in the promoter regions of candidate BnaPHTs, belonging to 30 TF gene families (Table S4). The most enriched TFs belong to the ERF (Ethylene responsive element binding factors, 63 genes), WRKY (WRKY DNA-binding protein, 19 genes), NAC (NAM, ATAF, and CUC TFs, 17 genes), MADS-box (MCM1, AG, DEF, and SRF TFs, 13 members), MYB (myeloblastosis, 15 genes, including 12 R2R3-MYB and three MYB-related genes) and Dof (DNA binding with one finger, 12 genes) families (Figure 5A). Moreover, many TFs are likely to bind to the same target gene, such as the 63 candidate ERF TFs may target to 21 BnaPHTs (Figure 5B). For example, many of the candidate WRKY TFs may bind to BnaPHT1.11 and BnaPHT1.44 genes promoters, suggesting these two BnaPHTs might be co-regulated by many WRKY TFs. Similarly, BnaPHT1.42 and BnaPHT4.7 were found to be the common targets of many ERF TFs, while many NAC TFs tend to target BnaPHT1.15 and BnaPHT5.4 (Figure 5B). In contrast, the Dof and MADS-box TFs are likely to target a much wider BnaPHTs, where the 13 MIKC-MADS-box TFs may regulate 27 BnaPHTs and the 12 Dof TFs may regulate 28 BnaPHTs (Figure 5B and Table S3). The remaining TF families only bind to a few BnaPHTs promoters as well, such as C3H TF may only bind to BnaPHT5.5 promoter, EIL TF may bind to BnaPHT1.41 promoter, while ZF-HD TF might bind to BnaPHT1.16 promoter (Figure 5).
To date, several TF families were reported to be involved in the transcriptional regulation of PHTs [34,35]. For example, the MYB-related gene PHR1 (phosphate starvation response), regulated PHT1 gene expression under low Pi condition through binding to the P1BS (PHR1-binding sequence) or P1BS-like domain; and the expressions of AtPHT1;1 and AtPHT1;4 genes were negatively regulated by MYB62 [34]. Accordingly, our results showed that many MYB homologs may bind to BnaPHTs promoters, suggesting their possible roles in Pi transport. It was previously reported that WRKY45 could positively regulate AtPHT1;1 expression under Pi starvation by binding to two W-boxes in its promoter [35]. Consequently, we found that 19 WRKY TFs may bind to BnaPHTs promoters, implying possible regulating roles of this kind of TFs in BnaPHTs expression.
Our results indicate that the expressions of BnaPHTs may be regulated by many types of TFs, especially the ERF, WRKY, MYB, Dof and MADS-box family members.
2.7. Spatial and Temporal Expressions of BnaPHTs
Gene expression is related to its encoded protein function. So we inspected the expression patterns of the 81 candidate BnaPHTs in 50 B. napus tissues/organs across different developmental stages, based on the RNA-seq data in NCBI (BioProject ID PRJNA358784). Twenty-seven BnaPHTs of PHT1 family with no or weak (FPKM < 1) expression levels that might be pseudogenes or have spatially or temporally restricted expressional pattern, were excluded from the heatmap.
In general, the majority of BnaPHTs were partial to highly express in leaf and flower tissues (Figure 6), indicating a temporal and a spatial expression trend. Consistent with their diverse sequence characteristics, the expression profiles of BnaPHTs in PHT1, 3 and 4 families are relative divergent, which may explain their possible functional division in phosphorus transport process. For instance, the expression pattern of PHT1 family could be classified into three main categories: the first type is preferentially expressed in germination seeds (BnaPHT1.28, BnaPHT1.6 and BnaPHT1.33); the second type was highly expressed in radicle (BnaPHT1.20, BnaPHT1.41, BnaPHT1.14, BnaPHT1.35, BnaPHT1.11, BnaPHT1.44, BnaPHT1.38, BnaPHT1.29 and BnaPHT1.10); while the remaining are mainly expressed in leaf and flower tissues. The expression profiles of BnaPHT3s can also be divided in to three categories: the first category was expressed in germination seeds and cotyledons, the second was mainly expressed in silique pericarps, and the rest was highly expressed in flower tissues. The expression profiles of the BnaPHT3s could be related to their predicted mitochondrial localization according to all of them contained the mito-carr domain. Similarly, the expressions of BnaPHT4s can be divided into two major groups: the first one consists of five members (BnaPHT4.1, BnaPHT4.4, BnaPHT4.9, BnaPHT4.2 and BnaPHT4.7) that were highly expressed in leaf and flower tissues, while the second has relatively wider expression levels in the tissues investigated. In contrast, the expression profiles of the other two families are more conserved than the above three ones (Figure 6). In PHT2 family, the expressions of candidates are very similar and are highly expressed in leaf and flower tissues. Combined with their subcellular location analysis results, we predicted that they maybe affect Pi allocation at chloroplast. Similarly, the BnaPHT5s were mainly expressed in leaf, flower and silique pericarps tissues, and some members were also highly expressed in seed and embryo tissues. The expression patterns together with their subcellular location analysis suggested that the BnaPHT5s may function in Pi storage in many tissues.
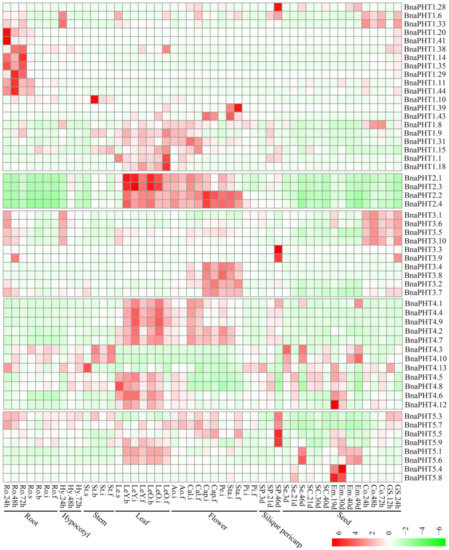
Figure 6.
Expression pattern of BnaPHTs in 50 tissues during plant development. Ro = root, St = stem, Le = leaf, Sp = silique pericarp, Sc = seed coat, Em = embryo, Ao = anthocaulus, Se = seed, Hy = hypocotyl, GS =germination seeds, Cap = capillament, Pi = pistil, Cal = calyx, Co = cotyledon, Pe = petal. The “h”, “d”, “i”, “f”, “s” indicate hour, day, seeding, budding, initial flowering, and full-bloom stages, respectively. The BnaPHTs with no or weak expression levels (FPKM < 1) were removed from the heatmap. The color bar at the low right represents log2 expression value (FPKM ≥ 1): green represents low expression, and red represents high expression.
In general, most of the BnaPHTs tend to be expressed in leaf and flower tissues. Moreover, the expression patterns within each family or group are similar, implying their functional conservation.
2.8. Expression Analysis of BnaPHTs under Five Hormone Inductions
Plant hormones participate in the regulation of diverse plant processes. For instance, auxin is a key regulator for virtually every aspect of plant growth and development [36]; Gibberellin (GA) is a bioactive growth regulator which controls seed germination, stem elongation, flowering [37]; 6-Benzylaminopurine (6-BA) could stimulate cell division or cytokinesis [38]. Moreover, phytohormones are also known to be associated with nutrient signaling [39]. Therefore, we explored the expression patterns of BnaPHTs under five exogenous hormone treatments (IAA, ACC, ABA, GA3, and 6-BA) in B. napus roots, based on our RNA-Seq dataset (BioProject ID PRJNA608211). Forty-four BnaPHTs with no or weak expression levels (FPKM < 1) were excluded from the heatmap.
As mentioned above, the expressions of most BnaPHTs were generally low in roots (Figure 6). However, the expressions of many genes in roots were induced by the five hormone treatments (Figure 7). Among the five PHT families, the BnaPHT1s (e.g., BnaPHT1.1, BnaPHT1.6, BnaPHT1.9, and BnaPHT1.31) were evidently up-regulated by ABA treatment; the BnaPHT2s (BnaPHT2.1-BnaPHT2.4) were up-regulated by all the five hormone treatments, especially IAA; the BnaPHT3s (BnaPHT3.1-BnaPHT3.8, and BnaPHT3.10) were up-regulated by IAA, ABA, GA3 and/or 6-BA treatments; whereas the genes in PHT5 family (BnaPHT5.1, BnaPHT5.3, BnaPHT5.5- BnaPHT5.7, and BnaPHT5.9) were evidently up-regulated by IAA and/or ABA treatments (Figure 7). Morevoer, the expressions of homologs in a same family are generally similar, such as BnaPHT1.1, BnaPHT1.9 and BnaPHT1.31 having similar expression patterns under ABA treatment; and BnaPHT2.1-BnaPHT2.4 having similar expression patterns under each of the five hormone inductions (Figure 7). These results suggest that the functions of PHTs in the same gene family are relative conserved. Notably, the expression patterns of BnaPHT4s were divided into two main patterns: the first type (BnaPHT4.1, BnaPHT4.2, BnaPHT4.4, BnaPHT4.7 and BnaPHT4.9) was obviously up-regulated by IAA treatment, while another was up-regulated by IAA, ABA, GA3 and/or 6-BA treatments under different trends. This suggests possibility functional divergence in the PHT4 family.
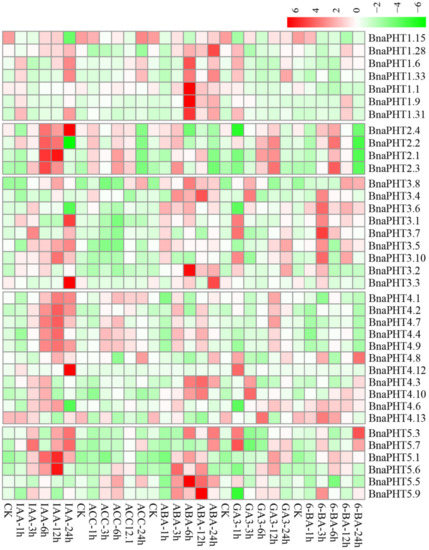
Figure 7.
Expression profiles of BnaPHTs under five hormone inductions in B. napus seedling roots by RNA-seq. CK: no extra hormone inductions (0 h), IAA: indoleacetic acid, ACC: 1-amino cyclopropanecarboxylic acid, ABA: abscisic acid, GA3: gibberellin acid 3, 6-BA: cytokinin. The “1 h”, “3 h”, “6 h”, “12 h”, and “24 h” represent hours after treatment. The color bar in the upper right represents log2 expression values (FPKM ≥ 1): green represents low expression and red represents high expression.
Previous reports have proven that the expressions of PHTs by hormone-induction are similar to that by Pi stress, suggesting there is a linkage between hormone treatment and Pi starvation [40,41,42]. For instance, in rice, OsPHT1;8 is involved in the cross-talk between Pi and auxin signaling, providing an evidence for the linkage between hormone and -Pi response [43]. Similarly, we found that the expressions of four BnaPHT1s (BnaPHT1.6, BnaPHT1.9, BnaPHT1.31 and BnaPHT1.33) which were up-regulated under Pi deficiency [29], were also up-regulated by IAA treatment (Figure 7). This implies a linkage between IAA treatment and Pi starvation. Moreover, cytokinin has been shown to be involved in the suppression of Pi starvation-induced gene expression [44]. Consistently, our results showed that the expressions of most BnaPHT1s were suppressed by 6-BA treatment (Figure 7), indicating similar mechanism may exist in B. napus.
In summary, our results demonstrate that exogenous hormones could strongly induce the expressions of many BnaPHTs in B. napus roots (especially IAA and ABA), indicating that hormones have an important role in their actions. Further research is required to elucidate their precise roles in hormone and −Pi signaling.
2.9. Expression Analysis of BnaPHTs in Response to High-Pi and Low-Pi Conditions by qRT-PCR
The transcription levels of PHTs are generally responsive to Pi levels. Among the five PHT families, members of PHT1 family are high-affinity Pi transporters in plants [13,14,18,45] and are up-regulated under Pi deprivation conditions [2,46]. On the basis of our spatiotemporal expression analysis (Figure 6) and the known functions of Arabidopsis homologs, three homologous pairs (BnaPHT1.20/BnaPHT1.41, BnaPHT1.11/BnaPHT1.44 and BnaPHT1.14/BnaPHT1.35) which were highly expressed in roots were selected for further qRT-PCR assay to explore their potential roles in response to low Pi (1 μM, −Pi) and high Pi (2 mM, +Pi) conditions in B. napus seedling roots.
As shown in Figure 8, all of the six genes were strongly up-regulated under −Pi condition, but were relatively less induced by +Pi stress (except for BnaPHT1.41), indicating they were more sensitive to −Pi condition. The expression patterns of these genes can be classified into three patterns: BnaPHT1.41 and BnaPHT1.11 were strongly up-regulated under both of −Pi and +Pi conditions; the two homologs of AtPHT1.9, BnaPHT1.14 and BnaPHT1.35 were up-regulated by -Pi stress while were slightly up-regulated under +Pi condition; and BnaPHT1.20 and BnaPHT1.44 were strongly up-regulated under -Pi condition but were not induced by +Pi stress. Notably, as a sister pair, the expression profiles of BnaPHT1.11 and BnaPHT1.44 under −Pi and +Pi conditions were somewhat different, where the expression of BnaPHT1.11 was gradually increased under −Pi treatment (except for on the fifth day), while BnaPHT1.44 had the highest expression level on the third day under −Pi condition (Figure 8). This indicates functional divergence trend of sister pair genes during evolution.
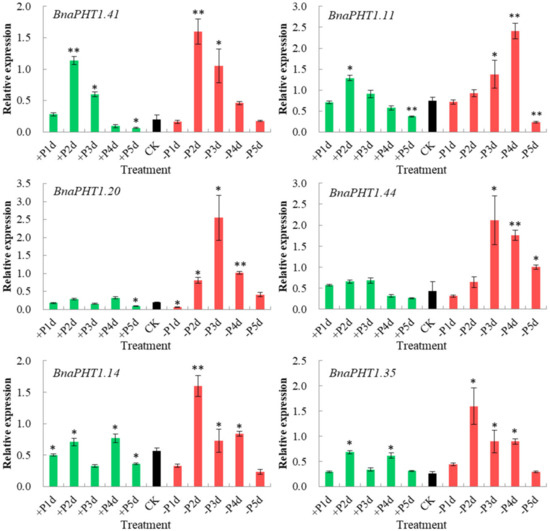
Figure 8.
Expressions of six BnaPHT1s under low- or high- Pi treatments by qRT-PCR. The transcript levels were determined in B. napus seedling roots by qRT-PCR method under low (-Pi) or high Pi (+Pi) conditions. CK: normal Pi condition; +P1d~+P5d: +Pi condition on 1-5 day (s); -P1d~-P5d: -Pi condition on 1~5 day (s). The B. napus Actin7 (BnActin7) (GenBank accession no. AF024716) was used as the reference gene. The red bar represents the expressions of BnaPHTs under -Pi conditions; the green bar represents the expressions of BnaPHTs under +Pi conditions; and the black bar represents the expressions of BnaPHTs under normal Pi conditions (CK). Error bars indicate the standard deviation of three independent experiments. *: Significant difference (0.05 > p > 0.01); **: Extremely significant difference (p < 0.01).
Overall, our results demonstrated that the six BnaPHTs in PHT1 family may involve in −Pi stress response in B. napus seedling roots, which provided a fundament for further gene functional research.
3. Discussion
3.1. Expansion and Evolution Mechanism of BnaPHTs
In the present study, we identified 81 PHT members in the B. napus genome, which represents the largest PHT gene family identified in plants to date. Given B. napus is an allotetraploid (AnAnCnCn) evolved from a spontaneous hybridization event (allopolyploid) between B. rapa (AnAn) and B. oleracea (CnCn) about 7500 years ago [31], and that Brassicaceae species experienced a common whole genome triplication (WGT) event during evolution, it was expected that the 21 Arabidopsis PHTs may be expanded to ~60 genes in B. rapa or B. oleracea, and ~120 in B. napus genomes, respectively. However, in this study, only 44, 26, and 81 genes were identified in these three species respectively, which revealed that 59% of BoPHTs, 30% of BrPHTs and 36% of BnaPHTs genes were lost during evolution. This indicates that many PHT members were lost after the WGD and allopolyploid events, in line with the important gene losses that genomes suffer shortly after WGD leading to a rapid diploidization [47]. Our colinearity analyses showed that up to 65 of the 81 BnaPHTs have colinear relationships. Among them, ~50.8% were inherited from B. rapa (~33.8%) or B. oleracea (~17.0%) genomes. Thus, the allopolyploid is the main driving force for PHTs expansion in B. napus, and the genes from B. rapa tended to be retained. Moreover, we found that ~39.5% BnaPHTs were derived from SE (~18.5%), HE (~7.4%), and SD (~7.4%), while only ~6.2% genes were from TD event (Table S5), suggesting that the small-scale segmental duplication events were the major contributor for the large gene expansion in B. napus after genomic heterogeneous doubling as well. Notably, the majority of BnaPHTs from HE (5 of 6 pairs, ~83.3%) were homologous exchanged from An- to Cn- subgenome, which represents an obvious bias for this event. In addition, the TD events were only observed in PHT1 family (Figure 4), suggesting a trend for this kind of gene expansion event. Together, the allopolyploid was the main driving force for the rapid expansion of BnaPHTs, followed by SE, SD, HE and TD events.
Gene duplication events might cause gene function differentiation, such as function redundancy, neo-functionalization, non-functionalization and sub-functionalization [48]. To explore the fates of the duplicated BnaPHTs, we calculated the sequence similarity and identity of the full protein, gene (DNA and cDNA) and the promoter (-1500 bp) sequences of the duplicates (Table S6). For the orthologous pairs between B. napus and B. rapa (21 pairs) or B. oleracea (8 pairs), the sequence identities of their protein, gene and promoter sequences were on average ~88.58%, ~77.15% and ~66.75%, respectively. Similarly, for the SE colinearity-pairs, the sequence identities of the protein, gene and promoter sequences were on average ~88.93%, ~85.78% and ~73.68%, respectively. For the HE colinearity-pairs, the sequence identities of the protein, gene and promoter sequences were on average ~95.02%, ~85.97% and ~69.70%, respectively. For the SD colinearity-pairs, the sequence identities of the protein, gene and promoter sequences were on average ~91.64%, ~83.84% and ~55.68%, respectively. For the TD colinearity-pairs, their protein, gene and promoter sequence identities were on average ~90.76%, ~81.28% and ~53.18%, respectively. Overall, the average sequence identity in the promoter regions of colinearity-pairs is ~65.50%, which is much lower than that of the protein (~89.89%) and gene sequences (~80.26%), implying the differentiation of duplications tended to occur in the promoter regions, firstly. The promoter regions in the genes from SD and TD events are likely to differentiate faster than the other events, indicating that the evolution trend of newly duplicated genes occurred in the descendant (B. napus).
Pearson correlation coefficient analysis showed that, except for seven colinearity-pairs which had low or no detectable expression levels in most tissues in B. napus, ~73.3% of the remaining pairs (including SE, HE, SD and TD events) have very similar expression patterns (Pearson correlation coefficient value > 0.8), while ~26.7% pairs have different expression patterns (Pearson correlation coefficient value < 0.6) (Table S6). This indicates that most of the colinearity-pairs are functionally redundant, while a few duplicates underwent expression differentiation that may lead to functional divergence (e.g., neo-functionalization and sub-functionalization) during evolution.
3.2. Function and Expression Characteristics of Each PHT Family
Pi is one of the keys as well as most limiting mineral nutrients essential for plant growth and development. The PHTs play important roles in Pi uptake and translocation. Since the cloning of the first plant PHT1 family gene in Arabidopsis [49], an increasing number of PHTs have been identified and functionally characterized in various plant species (Table S7).
The plant PHTs were commonly classified into five families, designated PHT1-5. Among them, PHT1 family is the most intensively studied one which acts as high affinity Pi transporter. To date, the majority PHT1 homologs were reported to play key roles in Pi uptake and translocation. For example, Arabidopsis AtPHT1;1 and AtPHT1;4 were responsible for Pi acquisition in both low- and high- Pi environments [14]; Rice OsPHT1;3 acted as a crucial factor for Pi acquisition under extremely low Pi condition [50] (Table S7). In agreement with their biological roles in Pi acquisition, many of them were generally Pi-starvation-induced in roots and/or shoots [18,45,51], e.g., eight of the nine Arabidopsis PHT1s (except for Pht1;6) [13] and 10 of the 13 rice PHT1s [26] were regulated in roots under Pi starvation. Similarly, in this study, we proved that six BnaPHT1s (BnaPHT1.11, BnaPHT1.14, BnaPHT1.20, BnaPHT1.35, BnaPHT1.41 and BnaPHT1.44) were regulated by Pi starvation, implying similar functions in Pi uptake and translocation. Notably, some PHT1 family members play critical roles in arbuscular mycorrhizal symbiosis and/or symbiotic Pi uptake as well, such as MtPT4 in M. truncatula [52], OsPT11 and OsPT13 in rice [53], AsPT1 and AsPT4 in Astragalus sinicus [54]; while some members (e.g., AtPht1;1, OsPht1;8 and PvPht1;3) play an important role in both Pi and Arsenic (As) uptake and translocation due to the similarity of Pi and As [55,56,57] (Table S7). In addition, PHT1 homologs are also involved in many other processes, such as Pi redistribution and mobilization [50], embryo development [58] (Table S7). Together, these results demonstrated that PHT1 genes not only have major roles in Pi uptake and translocation [18,45,46,47,48,49,50,51,52,53,54,55,56,57], but also have diverse biological functions in other plant processes, which is consistent with their diverse expression profile in plants [12,13,26,49,59,60].
In contrast, relatively fewer investigations have been performed on the last four PHT families which were mainly involved in Pi distribution within subcellular compartments (Table S7). The PHT2 family is generally small in each plant species (generally one member in each species) and shares extensive homology. Members of this family that have been characterized so far are low-affinity Pi transporters and act as H+/Pi cotransporters in plant plastids, such as AtPHT2;1 [20,21] and OsPHT2;1 [61]. The PHT2 homologs were predominantly expressed in green tissue [21,62,63,64,65], such as AtPHT2;1 [21], and EsPHT2;1 [65]. However, some PHT2 members were expressed in roots as well, and were regulated by external Pi concentration, such as TaPHT2;1 [64]. In B. napus, we identified four BnaPHT2s that had a conserved high expression profile in leaf and flower tissues (Figure 6). This is consistent with their known roles in chloroplasts. To date, merely a few genes of PHT3 family were functionally characterized in plants. Members of this group encode mitochondrial transporters that are involved in Pi exchange between cytoplasm and mitochondria via Pi⁄H+ symport or Pi⁄OH- antiport activities [66], and plant development and stress response [22,27,67]. Expression analysis showed that members of this family are preferentially expressed in flower or germinating seed tissues (Figure 6), indicating their potential roles in B. napus. PHT4 homologs are low-affinity Pi transporters as well and act as important Pi transport in Golgi apparatus and in plastids (Table S7). Interestingly, despite the limited membership of this family in each plant species (such as the six genes in Arabidopsis), they have a wide range of functions in plants in addition to their roles as plastid-localized Pi transporters (Table S7). For example, in Arabidopsis, AtPHT4;1 gene plays a critical role in Pi availability and basal defense [68], AtPHT4;2 influences Pi transport, starch accumulation and leaf size [69], AtPHT4;4 is a chloroplast-localized ascorbate transporter [70]; AtPHT4;6 facilitates the selective transport of Pi and responses to salt tolerance [24]; in Citrullus lanatus, ClPHT4;2 is correlated with chromoplast Pi transporter, flesh color development, and carotenoid content [71]. Similarly, Citrus sinensis CsPHT4;2 could be also involved in Pi transporter and enhance carotenoid accumulation [72]. Accordingly, we found that the sequence feature and expression profile of BnaPHT4s were relative divergent (Figure 2 and Figure 6), indicating their diverse functions in B. napus. The PHT5 family (also named SPX-MFS family) was considered as vacuolar Pi transporter [16]. PHT5 genes are well known to regulate cytoplasmic Pi homeostasis, and are required for fitness and plant growth as well [16] (Table S7). For instance, Arabidopsis AtPHT5;1 is essential for mediating vacuolar Pi storage and plant adaptation to fluctuating Pi level [16,73]; Rice OsSPX-MFS1 and OsSPX-MFS3 were also involved in maintaining Pi homeostasis [74,75]. On the basis of global expression analysis, we observed that many BnaPHTs were strongly up-regulated by exogenous hormone inductions (ABA, IAA, GA3, 6-BA and ACC) in B. napus roots (Figure 7), suggesting a potential linkage between hormone treatment and Pi signaling. Moreover, the subcellular localization of candidate BnaPHTs are highly consistent with the known functions of homologs in each family (Table S1), suggesting an important cue for gene functions as well.
In brief, the five PHT families have key roles in plant Pi uptake, transport and/or storage, and also have important roles in plant stress response, growth and development. Our results offer a useful basis for future research work on plant PHTs functions as well as the long-term goal of improving the Pi use efficiency of oil crops.
4. Materials and Methods
4.1. Identification and Phylogenetic Analyses of PHT Proteins in B. napus Genome
The sequences of the Arabidopsis PHTs were downloaded from TAIR (http://www.arabidopsis.org/). To identify the PHT genes in B. napus genome, a preliminary BLASTP [76] search was performed using the sequences of known Arabidopsis PHT proteins as queries, based on the available B. napus genome database in Genoscope (Darmor–bzh, http://www.genoscope.cns.fr/brassicanapus/) [31]. Only hits with E-values < 1.0 were considered as the candidate PHT gene family members. Subsequently, the candidate sequences were verified by SMART (http://smart.embl-heidelberg.de/) to ensure they own the typical domains of the five PHT families, respectively. The same methods were applied to identify the candidate PHTs in B. rapa and B. oleracea genomes in Phytozome v12 (https://phytozome.jgi.doe.gov/) [77], respectively.
Multiple sequence alignment of full length proteins of candidate PHTs was performed using the online MAFFT version 7 software under default parameters (https://mafft.cbrc.jp/alignment/server/). The result was then edited by MEGA version 7.0 software [78]. Based on the multiple sequence alignment of candidates, a neighbor-joining (NJ) tree was constructed by MEGA 7.0 with the following parameters: p-distance, pairwise deletion, and a bootstrap with 1000 replicates. The best evolutionary model of candidate PHT proteins was predicted by the Akaike information criterion (AIC) using MEGA7.0. The maximum-likelihood (ML) tree was constructed by MEGA 7.0 with 100 replicates, and JJT amino acid substitution model with estimation of the gamma distribution shape parameter (JJT + G), based on the multiple sequence alignment. The phylogenetic tree files were viewed and edited using FigTree v1.3.1 (http://tree.bio.ed.ac.uk/software/figtree/).
4.2. Biochemical Properties, Subcellular Localization and Sequence Analysis of BnaPHTs
The molecular weight (MW), theoretical isoelectronic points (PI), and grand average of hydropathy (GRAVY) of candidate BnaPHTs were calculated using ProtParam tool (https://web.expasy.org/protparam/) [79]. The information of cDNA and genomic sequences for candidate BnaPHTs were acquired from the B. napus genome as well. The gene structures of BnaPHTs (intron distribution, position, and phase in the full-length coding region) were viewed using Gene Structure Display Server (GSDS) 2.0 online software (http://gsds.cbi.pku.edu.cn/) [80]. The intron insertion information of the PHTs in Arabidopsis, B. rapa and B. oleracea was acquired from Phytozome v12. The information of the domains of BnaPHTs was acquired from SMART (http://smart.embl-heidelberg.de/) and Pfam (http://pfam.xfam.org/) respectively. The prediction of transmembrane helices was performed by TMHMM online software (http://www.cbs.dtu.dk/services/TMHMM-2.0/). Subcellular localization of BnaPHTs was predicted by Cell-PLoc 2.0 (http://www.csbio.sjtu.edu.cn/bioinf/Cell-PLoc-2/) [81], TargetP-2.0 (http://www.cbs.dtu.dk/services/TargetP/) and Pprowler (http://bioinf.scmb.uq.edu.au:8080/pprowler_webapp_1-2/index.jsp) respectively.
4.3. Chromosomal Location and Gene Duplication Analysis
The information regarding chromosome length and gene locations of candidate BnaPHTs were obtained from B. napus genome in Genoscope database as well. The collinearity relationship of PHTs from Arabidopsis, B. napus, B. oleracea and B. rapa was analyzed by CoGe online software (https://genomevolution.org/coge/). The duplication events were defined based on the cross-genome collinearity analysis of candidate PHTs (orthologous gene pairs in orthologous blocks). The closely related PHTs that were physically located to each other on a given chromosome and no more than one gene intervention were defined as tandemly duplicated genes. The Mapchart software was used to draw the chromosome map of the BnaPHTs.
4.4. Transcription Factor (TF) -Binding Network Analysis
The putative transcription factor-binding site analysis was performed by PlantTFDB database (http://planttfdb.cbi.pku.edu.cn/prediction.php) using the promoter sequences (upstream 1500 bp) of PHTs. The corresponding TF-binding network was visualized by Cytoscape [82] software.
4.5. Development and Hormone-Induced Expression Profile Analysis of BnaPHTs
The temporal and spatial expression profiles of BnaPHTs in 50 different tissues/organs (root, stem, leaf, flower, seed, and silique tissues) of B. napus cultivar ‘Zhongshuang 11′ (ZS11) at different developmental stages (seed germination, seedling, budding, initial flowering, full-bloom and seed maturation) were analyzed based on the RNA-seq data in NCBI (BioProject ID PRJNA358784). Similarly, the expression patterns of BnaPHTs under five major hormone inductions (IAA, GA3, 6-BA, ABA and ACC) in B. napus ZS11 seedling roots were evaluated based on our recently constructed RNA-seq dataset (BioProject ID PRJNA608211). Genes with no or weak expression value (FPKM<1) were removed from further analyses. The RNA-Seq data (FPKM ≥ 1) was log2-transformed, and the heatmap was performed using R package [83].
4.6. Plant Materials and Growth Condition
Seeds of ZS11 were obtained from the College of Agriculture and Biotechnology, Southwest University. The seeds were germinated in individual plastic pots filled with sand, and grown in an artificial climatic chamber at 22 °C with a 16:8 h photoperiod (day:night). The seedlings at five-leaf stage were used for low−Pi (−Pi) and high−Pi (+Pi) treatments, respectively. For each treatment, three biological replicates were performed, and each replicate contained five plants. The seedlings were treated in 1/2-strength Hoagland solution supplemented with 1 mM KH2PO4 (Control, CK), 1/2-strength Hoagland solution with 1 μM KH2PO4 (-Pi treatment), and 1/2-strength Hoagland solution with 2 mM KH2PO4 (+Pi treatment). The root tissues were harvested on 1, 2, 3, 4 and 5 days after the treatments, and were immediately frozen in liquid nitrogen and then stored at −80 °C for RNA isolation.
4.7. Real-Time PCR Analyses of BnaPHTs under Low- and High- Pi Treatments
Total RNA of each sample was extracted using EASYspin total RNA Extraction kit (Biomed, Beijing). The quality and concentration of the total RNA was determined using gel electrophoresis and a NanoDrop 2000 spectrophotometer, to ensure it met the criteria of A260/280 ratio = 1.8-2.1 and A260/230 ratio ≥ 2.0. The RNA sample was treated with DNase I (Promega, USA), and then was used for first-strand cDNA synthesis in a 20 μL reaction volume according to the manufacturer’s instructions of M-MuLV RT kit (Takara Biotechnology, Japan). The primers used in this analysis are listed in Table S8. B. napus Actin7 gene (BnActin7) (GenBank accession no. AF024716) was used as the reference gene. The SYBR-Green PrimeScript RT-PCR Kit (Takara Biotechnology, Japan) was used for real-time PCR analyses by the CFX Connect™ Real-Time System (Bio-Rad, Chongqing, China). The thermocycling parameters were as follows: an initial denaturation for 3 min at 95 °C, followed by 45 cycles of a denaturation step at 95 °C for 15 s, and an annealing step at 58 °C for 20 s. The fluorescence was measured after the extension step. Three biological replicates were applied for each treatment, and each treatment consisted of three technical replicates. Expression levels were calculated as the mean signal intensity across the three replicates. The relative expression levels of BnaPHTs were determined using the 2(−ΔΔCt) method [84]. Data are the mean ± standard deviation of three independent experiments. Error bars represent the standard errors from three independent experiments. Expression difference in BnaPHTs following Pi treatments was assessed by One-way ANOVA test (*p < 0.05; **p < 0.01) using Excel 2010.
Supplementary Materials
Supplementary materials can be found at https://www.mdpi.com/1422-0067/21/5/1752/s1. Table S1: Features of the 81 PHT genes identified in Brassica napus (BnaPHTs). Table S2: Features of the PHT genes (PHTs) in B. napus, Arabidopsis, Brassica rapa and Brassica oleracea. Table S3: Protein domains of PHT proteins in B. napus. Table S4: Transcription factor (TF) binding sites in the promoter regions of BnaPHTs. Table S5: Duplication events of BnaPHTs. Table S6: Homology and expression correlation analysis of 51 sister pairs of BnaPHTs. Table S7: The functionally characterized plant PHTs. Table S8: List of the primers used for the Real-time PCR analyses. Figure S1: The Maximum Likelihood (ML) trees of the candidate PHT proteins from Brassica napus, Arabidopsis, Brassica rapa and Brassica oleracea. Figure S2: The intron pattern of the five PHT families in B. napus, Arabidopsis, B. rapa and B. oleracea.
Author Contributions
H.D. contributed to the conception of the study. H.D., and J.Y. drafted the manuscript. J.Y., J.Z., H.-J.Z., M.-M.W., M.-M.L., H.D., Y.-Z.K., and P.-F.L. contributed to the data analyses. J.Y., H.D., and M.-M.W., conceived and designed the experiments. H.D., and J.-N.L. revised the manuscript. All authors read and approved the final manuscript.
Funding
This work was supported by the National Key Research and Development Program of China (2018YFD1000900).
Acknowledgments
This work was mainly supported by the Du Hai Group and Southwest University.
Conflicts of Interest
The authors declare no conflict of interest. The founding sponsors had no role in the design of the study, in the collection, analysis, or interpretation of data; in the writing of the manuscript, or in the decision to publish the results.
References
- Jain, A.; Vasconcelos, M.J.; Sahi, S.V.; Raghothama, K.G. Molecular mechanisms of plant adaptation to phosphate deficiency. In Plant Breeding Reviews; Janick, J., Ed.; John Wiley & Sons: Hoboken, NJ, USA, 2007; Volume 29, pp. 359–419. [Google Scholar] [CrossRef]
- Schachtman, D.P.; Shin, R. Nutrient sensing and signaling: NPKS. Annu. Rev. Plant Biol. 2007, 58, 47–69. [Google Scholar] [CrossRef] [PubMed]
- Maharajan, T.; Ceasar, S.A.; Krishna, T.P.A.; Ignacimuthu, S. Phosphate supply influenced the growth, yield and expression of PHT1 family phosphate transporters in seven millets. Planta 2019, 250, 1433–1448. [Google Scholar] [CrossRef] [PubMed]
- Marschner, H. Mineral Nutrition of Higher Plants; Academic Press: London, UK, 1995. [Google Scholar]
- Raghothama, K.G. Phosphate acquisition. Annu. Rev. Plant Physiol. Plant Mol. Biol. 1999, 50, 665–693. [Google Scholar] [CrossRef] [PubMed]
- Raghothama, K.G.; Karthikeyan, A.S. Phosphate Acquisition. Plant Soil. 2005, 274, 37–49. [Google Scholar] [CrossRef]
- López-Bucio, J.; Hernández-Abreu, E.; Sánchez-Calderón, L.; Nieto-Jacobo, M.F.; Simpson, J.; Herrera-Estrella, L. Phosphate availability alters architecture and causes changes in hormone sensitivity in the Arabidopsis root system. Plant Physiol. 2002, 129, 244–256. [Google Scholar] [CrossRef] [PubMed]
- Rausch, C.; Bucher, M. Molecular mechanisms of phosphate transport in plants. Planta 2002, 216, 23–37. [Google Scholar] [CrossRef] [PubMed]
- Vance, C.P.; Uhde-Stone, C.; Allan, D.L. Phosphorus acquisition and use: Critical adaptations by plants for securing a nonrenewable resource. N. Phytol. 2003, 157, 423–447. [Google Scholar] [CrossRef]
- Hammond, J.P.; Broadley, M.R.; White, P.J. Genetic responses to phosphorus deficiency. Ann. Bot 2004, 94, 323–332. [Google Scholar] [CrossRef]
- Misson, J.; Raghothama, K.G.; Jain, A.; Jouhet, J.; Block, M.A.; Bligny, R.; Ortet, P.; Creff, A.; Somerville, S.; Rolland, N. A genome-wide transcriptional analysis using Arabidopsis thaliana Affymetrix gene chips determined plant responses to phosphate deprivation. Proc. Natl. Acad. Sci. USA 2005, 102, 11934–11939. [Google Scholar] [CrossRef]
- Karthikeyan, A.S.; Varadarajan, D.K.; Mukatira, U.T.; D’Urzo, M.P.; Damsz, B.; Raghothama, K.G. Regulated expression of Arabidopsis phosphate transporters. Plant Physiol. 2002, 130, 221–233. [Google Scholar] [CrossRef]
- Mudge, S.R.; Rae, A.L.; Diatloff, E.; Smith, F.W. Expression analysis suggests novel roles for members of the Pht1 family of phosphate transporters in Arabidopsis. Plant. J. 2002, 31, 341–353. [Google Scholar] [CrossRef] [PubMed]
- Shin, H.; Shin, H.S.; Dewbre, G.R.; Harrison, M.J. Phosphate transport in Arabidopsis: Pht1;1 and Pht1;4 play a major role in phosphate acquisition from both low- and high-phosphate environments. Plant J. 2004, 39, 629–642. [Google Scholar] [CrossRef] [PubMed]
- Lopez-Arredondo, D.L.; Leyva-Gonzalez, M.A.; Gonzalez-Morales, S.I.; Lopez-Bucio, J.; Herrera-Estrella, L. Phosphate nutrition: Improving low-phosphate tolerance in crops. Annu. Rev. Plant Biol. 2014, 65, 95–123. [Google Scholar] [CrossRef] [PubMed]
- Liu, T.Y.; Huang, T.K.; Yang, S.Y.; Hong, Y.T.; Huang, S.M.; Wang, F.N.; Chiang, S.F.; Tsai, S.Y.; Lu, W.C.; Chiou, T.J. Identification of plant vacuolar transporters mediating phosphate storage. Nat. Commun. 2016, 7, 11095. [Google Scholar] [CrossRef]
- Pao, S.S.; Paulsen, I.T.; Saier, M.H. Major facilitator superfamily. Microbiol. Mol. Biol. Rev. 1998, 62, 1–34. [Google Scholar] [CrossRef]
- Sun, S.; Gu, M.; Cao, Y.; Huang, X.; Zhang, X.; Ai, P. A constitutive expressed phosphate transporter OsPht11 modulates phosphate uptake and translocation in phosphate-replete rice. Plant Physiol. 2012, 159, 1571–1581. [Google Scholar] [CrossRef]
- Ai, P.; Sun, S.; Zhao, J.; Fan, X.; Xin, W.; Guo, Q. Two rice phosphate transporters OsPht12 and OsPht16 have different functions and kinetic properties in uptake and translocation. Plant J. 2009, 57, 798–809. [Google Scholar] [CrossRef]
- Daram, P.; Brunner, S.; Rausch, C.; Steiner, C.; Amrhein, N.; Bucher, M. Pht2;1 encodes a low-affinity phosphate transporter from Arabidopsis. Plant Cell 1999, 11, 2153–2166. [Google Scholar] [CrossRef]
- Versaw, W.K.; Harrison, M.J. A chloroplast phosphate transporter PHT2;1 influences allocation of phosphate within the plant and phosphate-starvation responses. Plant Cell 2002, 14, 1751–1766. [Google Scholar] [CrossRef]
- Takabatake, R.; Hata, S.; Taniguchi, M.; Kouchi, H.; Sugiyama, T.; Izui, K. Isolation and characterization of cDNAs encoding mitochondrial phosphate transporters in soybean, maize, rice, and Arabidopsis. Plant Mol. Biol. 1999, 40, 479–486. [Google Scholar] [CrossRef]
- Stappen, R.; Krämer, R. Kinetic mechanism of phosphate/phosphate and phosphate/OH−antiports catalyzed by reconstituted phosphate carrier from beef heart mitochondria. J. Biol. Chem. 1994, 269, 11240–11246. [Google Scholar] [PubMed]
- Cubero, B.; Nakagawa, Y.; Jiang, X.Y.; Miura, K.J.; Li, F.; Raghothama, K.G. The phosphate transporter PHT4;6 is a determinant of salt tolerance that is localized to the golgi apparatus of Arabidopsis. Mol. Plant 2009, 2, 535–552. [Google Scholar] [CrossRef] [PubMed]
- Okumura, S.; Mitsukawa, N.; Shirano, Y.; Shibata, D. Phosphate transporter gene family of Arabidopsis thaliana. DNA Res. 1998, 5, 261–269. [Google Scholar] [CrossRef] [PubMed]
- Liu, F.; Chang, X.J.; Ye, Y.; Xie, W.B.; Wu, P.; Lian, X.M. Comprehensive sequence and whole-life-cycle expression profile analysis of the phosphate transporter gene family in rice. Mol. Plant 2011, 4, 1105–1122. [Google Scholar] [CrossRef] [PubMed]
- Zhang, C.; Meng, S.; Li, M.; Zhao, Z. Genomic identification and expression analysis of the phosphate transporter gene family in poplar. Front. Plant Sci. 2016, 7, 1398. [Google Scholar] [CrossRef] [PubMed]
- Ding, G.D.; Zhao, Z.K.; Liao, Y.; Hu, Y.F.; Shi, L.; Long, Y. Quantitative trait loci for seed yield and yield related traits and their responses to reduced phosphorus supply in Brassica napus. Ann. Bot. 2012, 109, 747–759. [Google Scholar] [CrossRef]
- Li, Y.; Wang, X.; Zhang, H.; Wang, S.; Ye, X.; Shi, L.; Xu, F.; Ding, G. Molecular identification of the phosphate transporter family 1 (PHT1) genes and their expression profiles in response to phosphorus deprivation and other abiotic stresses in Brassica napus. PLoS ONE 2019, 14, e0220374. [Google Scholar] [CrossRef]
- Ren, F.; Zhao, C.Z.; Liu, C.S.; Huang, K.L.; Guo, Q.Q.; Chang, L.L.; Xiong, H.; Li, X.B. A Brassica napus PHT1 phosphate transporter, BnaPHT1;4, promotes phosphate uptake and affects roots architecture of transgenic Arabidopsis. Plant Mol. Biol. 2014, 86, 595. [Google Scholar] [CrossRef]
- Chalhoub, B.; Denoeud, F.; Liu, S.; Parkin, I.A.; Tang, H.; Wang, X.; Chiquet, J.; Belcram, H.; Tong, C.; Samans, B.; et al. Plant genetics. Early allopolyploid evolution in the post-Neolithic Brassica napus oilseed genome. Science 2014, 345, 950–953. [Google Scholar] [CrossRef]
- Sun, T.; Li, M.; Shao, Y.; Yu, L.; Ma, F. Comprehensive Genomic Identification and Expression Analysis of the Phosphate Transporter (PHT) Gene Family in Apple. Front. Plant Sci. 2017, 8, 426. [Google Scholar] [CrossRef]
- Wang, D.; Lv, S.; Jiang, P.; Li, Y. Roles, regulation, and agricultural application of plant phosphate transporters. Front. Plant Sci. 2017, 8, 817. [Google Scholar] [CrossRef] [PubMed]
- Devaiah, B.N.; Madhuvanthi, R.; Karthikeyan, A.S.; Raghothama, K.G. Phosphate starvation responses and gibberellic acid biosynthesis are regulated by the MYB62 transcription factor in Arabidopsis. Mol. Plant 2009, 2, 43–58. [Google Scholar] [CrossRef] [PubMed]
- Wang, H.; Xu, Q.; Kong, Y.H.; Chen, Y.; Duan, J.Y.; Wu, W.H. Arabidopsis WRKY45 transcription factor activates PHOSPHATE TRANSPORTER11 expression in response to phosphate starvation. Plant Physiol. 2014, 164, 2020–2029. [Google Scholar] [CrossRef] [PubMed]
- Ljung, K. Auxin metabolism and homeostasis during plant development. Development 2013, 140, 943–950. [Google Scholar] [CrossRef]
- Yamaguchi, S. Gibberellin metabolism and its regulation. Annu. Rev. Plant Biol. 2008, 59, 225–251. [Google Scholar] [CrossRef]
- Deng, Y.; Zhao, L.; Zhang, L. Effects of sand and hormone treatment on seed germination of Bupleurum chinese DC. and B. falcatum, L. Zhongguo Zhong Yao Za Zhi. 1996, 21, 208–255. [Google Scholar]
- Baek, D.; Chun, H.J.; Yun, D.J.; Kim, M.C. Cross-talk between phosphate starvation and other environmental stress signaling pathways in plants. Mol. Cells 2017, 40, 697–705. [Google Scholar] [CrossRef]
- Bates, T.R.; Lynch, J.P. Stimulation of root hair elongation in Arabidopsis thaliana by low phosphorus availability. Plant. Cell Environ. 1996, 19, 529–538. [Google Scholar] [CrossRef]
- Lynch, J.; Brown, K.M. Ethylene and plant responses to nutritional stress. Physiol. Plant 1997, 100, 613–619. [Google Scholar] [CrossRef]
- Gilbert, G.A.; Knight, J.D.; Vance, C.P.; Allan, D.L. Proteoid root development of phosphorus deficient lupin is mimicked by auxin and phosphonate. Ann. Bot. 2000, 85, 921–928. [Google Scholar] [CrossRef]
- Jia, H.; Zhang, S.; Wang, L.; Yang, Y.; Zhang, H.; Cui, H.; Shao, H.; Xu, G. OsPht1;8, a phosphate transporter, is involved in auxin and phosphate starvation response in rice. J. Exp. Bot. 2017, 68, 5057–5068. [Google Scholar] [CrossRef] [PubMed]
- Martin, A.C.; del Pozo, J.C.; Iglesias, J.; Rubio, V.; Solano, R.; de la Pena, A.; Leyva, A.; Paz-Ares, J. Influence of cytokininson the expression of phosphate starvation responsive genes in Arabidopsis. Plant J. 2000, 24, 559–567. [Google Scholar] [CrossRef] [PubMed]
- Remy, E.; Cabrito, T.R.; Batista, R.A.; Teixeira, M.C.; Sá-Correia, I.; Duque, P. The Pht19 and Pht18 transporters mediate inorganic phosphate acquisition by the Arabidopsis thaliana root during phosphorus starvation. N. Phytol. 2012, 195, 356–371. [Google Scholar] [CrossRef] [PubMed]
- Smith, S.E.; Jakobsen, I.; Grønlund, M.; Smith, F.A. Roles of arbuscular mycorrhizas in plant phosphorus nutrition: Interactions between pathways of phosphorus uptake in arbuscular mycorrhizal roots have important implications for understanding and manipulating plant phosphorus acquisition. Plant Physiol. 2011, 156, 1050–1057. [Google Scholar] [CrossRef]
- Ozkan, H.; Feldman, M. Rapid cytological diploidization in newly formed allopolyploids of the wheat (Aegilops-Triticum) group. Genome 2009, 52, 926–934. [Google Scholar] [CrossRef]
- Flagel, L.E.; Wendel, J.F. Gene duplication and evolutionary novelty in plants. N. Phytol. 2009, 183, 557–564. [Google Scholar] [CrossRef]
- Muchhal, U.; Pardo, J.; Raghothama, K. Phosphate transporters from the higher plant Arabidopsis thaliana. Proc. Natl. Acad. Sci. USA 1996, 93, 10519–10523. [Google Scholar] [CrossRef]
- Chang, M.; Gu, M.; Xia, Y.; Dai, X.; Dai, C.; Zhang, J. OsPHT13 mediates uptake translocation and remobilization of phosphate under extremely low phosphate regimes. Plant Physiol. 2019, 179, 656–670. [Google Scholar] [CrossRef]
- Xu, Y.J.; Liu, F.; Li, X.Y.; Cheng, B.J. The mycorrhiza-induced maize ZmPt9 gene affects root development and phosphate availability in nonmycorrhizal plant. Plant Signal. Behav. 2018, 13, e1542240. [Google Scholar] [CrossRef]
- Javot, H.; Penmetsa, R.V.; Terzaghi, N.; Cook, D.R.; Harrison, M.J. A Medicago truncatula phosphate transporter indispensable for the arbuscular mycorrhizal symbiosis. Proc. Natl. Acad. Sci. USA 2007, 104, 1720–1725. [Google Scholar] [CrossRef]
- Yang, S.Y.; Grønlund, M.; Jakobsen, I.; Grotemeyer, M.S.; Rentsch, D.; Miyao, A.; Hirochika, H.; Kumar, C.S.; Sundaresan, V.; Salamin, N.; et al. Nonredundant regulation of rice Arbuscular Mycorrhizal symbiosis by two members of the PHOSPHATE TRANSPORTER1 gene family. Plant Cell 2012, 24, 4236–4251. [Google Scholar] [CrossRef] [PubMed]
- Xie, X.A.; Wu, H.; Liu, F.C.; Tang, N.W.; Liu, Y.; Lin, H.; Zhao, B. Functional analysis of the novel mycorrhiza-specific phosphate transporter AsPT1 and PHT1 family from Astragalus sinicus during the arbuscular mycorrhizal symbiosis. N. Phytol. 2013, 198, 836–852. [Google Scholar] [CrossRef] [PubMed]
- Catarecha, P.; Segura, M.D.; Franco-Zorrilla, J.; García-Ponce, B.; Lanza, M.; Solano, R.; Paz-Ares, J.; Leyva, A. A mutant of the Arabidopsis phosphate transporter PHT1;1 displays enhanced Arsenic accumulation. Plant Cell 2007, 19, 1123–1133. [Google Scholar] [CrossRef] [PubMed]
- Wang, F.M.; Rose, T.; Jeong, K.; Kretzschmar, T.; Wissuwa, M. The knowns and unknowns of phosphorus loading into grains, and implications for phosphorus efficiency in cropping systems. J. Exp. Bot. 2016, 67, 1221–1229. [Google Scholar] [CrossRef]
- Cao, Y.; Feng, H.Y.; Sun, D.; Xu, G.H.; Rathinasabapathi, B.; Chen, Y.S.; Ma, L.Q. Heterologous expression of Pteris vittata phosphate transporter PvPht1;3 enhances arsenic translocation to and accumulation in tobacco shoots. Environ. Sci. Technol. 2019, 53, 10636–10644. [Google Scholar] [CrossRef]
- Zhang, F.; Sun, Y.F.; Pei, W.X.; Jain, A.; Sun, R.; Cao, Y.; Wu, X.N.; Jiang, T.T.; Zhang, L.; Fan, X.R.; et al. Involvement of OsPht1;4 in phosphate acquisition and mobilization facilitates embryo development in rice. Plant J. 2015, 82, 556–569. [Google Scholar] [CrossRef]
- Chen, A.; Chen, X.; Wang, H.; Liao, D.; Gu, M.; Qu, H. Genome- wide investigation and expression analysis suggest diverse roles and genetic redundancy of Pht1 family genes in response to Pi deficiency in tomato. BMC Plant Biol. 2014, 14, 61. [Google Scholar] [CrossRef]
- Teng, W.; Zhao, Y.Y.; Zhao, X.Q.; He, X.; Ma, W.Y.; Deng, Y.; Chen, X.P.; Tong, Y.P. Genome-wide identification, characterization, and expression analysis of PHT1 phosphate transporters in wheat. Front. Plant Sci. 2017, 8, 543. [Google Scholar] [CrossRef]
- Liu, X.L.; Wang, L.; Wang, X.W.; Yan, Y.; Yang, X.L.; Xie, M.Y.; Hu, Z.; Shen, X.; Ai, H.; Lin, H.H.; et al. Mutation of the chloroplast-localized phosphate transporter OsPHT2;1 reduces flavonoid accumulation and UV tolerance in rice. Plant J. 2019. [CrossRef]
- Rausch, C.; Zimmermann, P.; Amrhein, N.; Bucher, M. Expression analysis suggests novel roles for the plastidic phosphate transporter Pht2;1 in auto- and heterotrophic tissues in potato and Arabidopsis. Plant J. 2004, 39, 13–28. [Google Scholar] [CrossRef]
- Loth-Pereda, V.; Orsini, E.; Courty, P.E.; Lota, F.; Kohler, A.; Diss, L.; Blaudez, D.; Chalot, M.; Nehls, U.; Bucher, M.; et al. Structure and expression profile of the phosphate Pht1 transporter gene family in mycorrhizal Populus trichocarpa. Plant Physiol. 2011, 156, 2141–2154. [Google Scholar] [CrossRef] [PubMed]
- Guo, C.; Zhao, X.; Liu, X.; Zhang, L.; Gu, J.; Li, X.; Lu, W.; Xiao, K. Function of wheat phosphate transporter gene TaPHT2;1 in Pi translocation and plant growth regulation under replete and limited Pi supply conditions. Planta 2013, 237, 1163–1178. [Google Scholar] [CrossRef]
- Velasco, V.M.; Mansbridge, J.; Bremner, S.; Carruthers, K.; Summers, P.S.; Sung, W.W.; Champigny, M.J.; Weretilnyk, E.A. Acclimation of the crucifer Eutrema salsugineum to phosphate limitation is associated with constitutively high expression of phosphate-starvation genes. Plant Cell Environ. 2016, 39, 1818–1834. [Google Scholar] [CrossRef] [PubMed]
- Zhu, W.; Miao, Q.; Sun, D.; Yang, G.; Wu, C.; Huang, J.; Zheng, C. The mitochondrial phosphate transporters modulate plant responses to salt stressvia affecting ATP and gibberellin metabolism in Arabidopsis thaliana. PLoS ONE 2012, 7, e43530. [Google Scholar] [CrossRef]
- Shukla, V.; Kaur, M.; Aggarwal, S.; Bhati, K.K.; Kaur, J.; Mantri, S. Tissue specific transcript profiling of wheat phosphate transporter genes and its association with phosphate allocation in grains. Sci. Rep. 2016, 6, 39293. [Google Scholar] [CrossRef]
- Karlsson, P.M.; Herdean, A.; Adolfsson, L.; Beebo, A.; Nziengui, H.; Irigoyen, S.; Ünnep, R.; Zsiros, O.; Nagy, G.; Garab, G.; et al. The Arabidopsis thylakoid transporter PHT4;1 influences phosphate availability for ATP synthesis and plant growth. Plant J. 2015, 84, 99–110. [Google Scholar] [CrossRef]
- Irigoyen, S.; Karlsson, P.M.; Kuruvilla, J.; Spetea, C.; Versaw, W.K. The sink-specific plastidic phosphate transporter PHT4;2 influences starch accumulation and leaf size in Arabidopsis. Plant Physiol. 2011, 157, 1765–1777. [Google Scholar] [CrossRef]
- Miyaji, T.; Kuromori, T.; Takeuchi, Y.; Yamaji, N.; Yokosho, K.; Shimazawa, A. AtPHT4;4 is a chloroplast-localized ascorbate transporter in Arabidopsis. Nat. Commun. 2015, 6, 5928. [Google Scholar] [CrossRef]
- Zhang, J.; Guo, S.G.; Ren, Y.; Zhang, H.Y.; Gong, G.Y.; Zhou, M.; Wang, G.Z.; Zong, M.; He, H.J.; Liu, F.; et al. High-level expression of a novel chromoplast phosphate transporter ClPHT4;2 is required for flesh color development in watermelon. N. Phytol. 2017, 213, 1208–1221. [Google Scholar] [CrossRef]
- Lu, P.J.; Wang, S.S.; Grierson, D.; Xu, C.J. Transcriptomic changes triggered by carotenoid biosynthesis inhibitors and role of Citrus sinensis phosphate transporter 4;2 (CsPHT4;2) in enhancing carotenoid accumulation. Planta 2019, 249, 257–270. [Google Scholar] [CrossRef]
- Liu, J.; Fu, S.; Yang, L.; Luan, M.; Zhao, F.; Luan, S.; Lan, W. Vacuolar SPX-MFS transporters are essential for phosphate adaptation in plants. Plant Signal. Behav. 2016, 11, e1213474. [Google Scholar] [CrossRef] [PubMed]
- Wang, C.; Huang, W.; Ying, Y.H.; Li, S.; Secco, D.; Tyerman, S.; Whelan, J.; Shou, H.X. Functional characterization of the rice SPX-MFS family reveals a key role of OsSPX-MFS1 in controlling phosphate homeostasis in leaves. N. Phytol. 2012, 196, 139–148. [Google Scholar] [CrossRef] [PubMed]
- Wang, C.; Yue, W.H.; Ying, Y.H.; Wang, S.D.; Secco, D.; Liu, Y.; Whelan, J.; Tyerman, S.D.; Shou, H.X. Rice SPX-Major Facility Superfamily3, a vacuolar phosphate efflux transporter, is involved in maintaining phosphate homeostasis in rice. Plant Physiol. 2015, 169, 2822–2831. [Google Scholar] [PubMed]
- Camacho, C.; Coulouris, G.; Avagyan, V.; Ma, N.; Papadopoulos, J.; Bealer, K.; Madden, T.L. BLAST+: Architecture and applications. BMC Bioinf. 2009, 10, 421. [Google Scholar] [CrossRef]
- Goodstein, D.M.; Shu, S.; Howson, R.; Neupane, R.; Hayes, R.D.; Fazo, J.; Mitros, T.; Dirks, W.; Hellsten, U.; Putnam, N.; et al. Phytozome: A comparative platform for green plant genomics. Nucleic Acids Res. 2012, 40, D1178–D1186. [Google Scholar] [CrossRef]
- Kumar, S.; Stecher, G.; Tamura, K. MEGA7: Molecular evolutionary genetics analysis version 7.0 for bigger datasets. Mol. Biol. Evol. 2016, 33, 1870. [Google Scholar] [CrossRef]
- Artimo, P.; Jonnalagedda, M.; Arnold, K.; Baratin, D.; Csardi, G.; de Castro, E.; Duvaud, S.; Flegel, V.; Fortier, A.; Gasteiger, E.; et al. ExPASy: SIB bioinformatics resource portal. Nucleic Acids Res. 2012, 40, W597–W603. [Google Scholar] [CrossRef]
- Hu, B.; Jin, J.; Guo, A.Y.; Zhang, H.; Luo, J.; Gao, G. GSDS 2.0: An upgraded gene feature visualization server. Bioinformatics 2014, 31, 1296. [Google Scholar] [CrossRef]
- Chou, K.C.; Shen, H.B. Cell-PLoc: A package of Web servers for predicting subcellular localization of proteins in various organisms. Nat. Protoc. 2007, 3, 153–162. [Google Scholar] [CrossRef]
- Shannon, P.; Markiel, A.; Ozier, O.; Baliga, N.S.; Wang, J.T.; Ramage, D.; Amin, N.; Schwikowski, B.; Ideker, T. Cytoscape: A software environment for integrated models of biomolecular interaction networks. Genome Res. 2003, 13, 2498–2504. [Google Scholar] [CrossRef]
- Galili, T.; O’Callaghan, A.; Sidi, J.; Sievert, C. Heatmaply: An R package for creating interactive cluster heatmaps for online publishing. Bioinformatics 2018, 34, 1600–1602. [Google Scholar] [CrossRef] [PubMed]
- Livak, K.J.; Schmittgen, T.D. Analysis of relative gene expression data using real-time quantitative PCR and the 2−ΔΔCt method. Methods 2001, 25, 402–408. [Google Scholar] [CrossRef] [PubMed]
© 2020 by the authors. Licensee MDPI, Basel, Switzerland. This article is an open access article distributed under the terms and conditions of the Creative Commons Attribution (CC BY) license (http://creativecommons.org/licenses/by/4.0/).