Article

Secreted Factors and EV-miRNAs Orchestrate the Healing Capacity of Adipose Mesenchymal Stem Cells for the Treatment of Knee Osteoarthritis

Laboratorio di Biotecnologie Applicate all’Ortopedia, IRCCS Istituto Ortopedico Galeazzi, Via R. Galeazzi 4, I-20161 Milano, Italy
*
Author to whom correspondence should be addressed.
Int. J. Mol. Sci. 2020, 21(5), 1582; https://doi.org/10.3390/ijms21051582
Submission received: 17 January 2020 / Revised: 21 February 2020 / Accepted: 24 February 2020 / Published: 26 February 2020
(This article belongs to the Special Issue Non-Coding RNA Biogenesis and Function)

Abstract

:
Mesenchymal stem cells (MSCs) derived from adipose tissue and used either as expanded cells or minimally manipulated cell preparations showed positive clinical outcomes in regenerative medicine approaches based on tissue restoration and inflammation control, like in osteoarthritis (OA). Recently, MSCs’ healing capacity has been ascribed to the large array of soluble factors, including soluble cytokines/chemokines and miRNAs conveyed within extracellular vesicles (EVs). Therefore, in this study, 200 secreted cytokines, chemokines and growth factors via ELISA, together with EV-embedded miRNAs via high-throughput techniques, were scored in adipose-derived MSCs (ASCs) cultivated under inflammatory conditions, mimicking OA synovial fluid. Both factors (through most abundantly expressed TIMP1, TIMP2, PLG and CTSS) and miRNAs (miR-24-3p, miR-222-3p and miR-193b-3p) suggested a strong capacity for ASCs to reduce matrix degradation activities, as those activated in OA cartilage, and switch synovial macrophages, often characterized by an M1 inflammatory polarization, towards an M2 phenotype. Moreover, the crucial importance of selecting the target tissue is discussed, showing how a focused search may greatly improve potency prediction and explain clinical outcomes. In conclusion, herein presented data shed light about the way ASCs regulate cell homeostasis and regenerative pathways in an OA-resembling environment, therefore suggesting a rationale for the use of MSC-enriched clinical products, such as stromal vascular fraction and microfragmented adipose tissue, in joint pathologies.

1. Introduction

Osteoarthritis (OA) is a heterogeneous disease with a wide range of underlying pathways and involves structural alterations mainly in the articular cartilage, subchondral bone and synovial membrane [1]. In particular, OA is characterized by a complex biological imbalance between the repair and destruction of joint tissues, rather than a stand-alone mechanical degeneration [2]. The initial loss of cartilage integrity leads first to superficial erosions and later to fissures followed by the expansion of calcifications. Matrix degradation products and proinflammatory mediators deregulate chondrocyte function and stimulate synovium proliferative and inflammatory responses of both resident synoviocytes and macrophages. Eventually, bone turnover is increased with the development of subchondral bone marrow lesions [3].
Due to the strong biological fingerprint, the ideal OA management should rely on the restoration of tissue homeostasis. Nevertheless, to date, available treatments are not supposed to have a direct influence on the damaged tissues but, rather, on symptoms control. Oral nonsteroidal anti-inflammatory and analgesic drugs, as well as intra-articular corticosteroids or hyaluronic acid (HA), are commonly used alone or in combination to manage early pain and improve mobility [4]. In end-stage OA, joint replacement is still the most effective practice [5,6]. Nevertheless, although total knee replacement showed greater pain relief and functional improvement than nonsurgical treatments [7], up to 25% of patients still complain of pain and disability after surgery [8]. In this perspective, new biological-based products aimed to prevent the progression of OA and restoring tissue homeostasis have been introduced. They are mostly based on mesenchymal stem cells (MSCs) whose pro-regenerative properties are well known. Of note, in addition to expanded MSCs, MSC-enriched products prepared at the point of care under minimal manipulation are also available, both from bone marrow (bone marrow aspirate concentrate—BMAC) and adipose tissue (stromal vascular fraction—SVF or microfragmented fat tissue—MFAT).
MSCs are multipotent cells with a high capacity for self-renewal that, in adult life, are found dormant in vivo as pericytes and, once activated, take part in tissue repair [9]. Further, signals associated with disease, such as pro-inflammatory mediators in the joint cavity, may enhance MSCs activity, which in turn secrete factors, chemokines and cytokines able to limit the extent of damage and improve tissue healing [10]. In this frame, both in vitro and in vivo, MSCs were shown to secrete an array of molecules with, among others, anti-inflammatory properties, such as: prostaglandin-E2 (PGE2), responsible for inducing an M2 switch in human synovial macrophages [11]; indoleamine 2,3-dioxygenase (IDO), suppressing T-cell proliferation [12] and driving M2 polarization of macrophages [13] and other anti-inflammatory and immunosuppressive molecules, like iNOS, TSG6, HO1, TGF-β and galectins [14]. Supporting this notion, both MSCs and MSC-conditioned mediums (CMs) have been shown to have a protective effect on cartilage in a murine OA model, together with pain reduction [15], the last due to a decrement of inflammation, as also shown in both in vitro models of OA chondrocyte [16] and ex vivo explants of cartilage and synovia [17]. In fact, together with cartilage destruction, inflammation is a crucial player in the establishment and maintenance of OA and positively correlates with knee pain [18], with synovial membrane inflammation a hallmark of the pathology [19]. Moreover, higher levels of pro-inflammatory cytokines and infiltrated immune cells, predominantly macrophages, positively correlate with OA severity [20].
Together with secreted factors, in the last years, it has been proposed that also extracellular vesicles (EVs) and embedded molecules, such as proteins, lipids or nucleic acids (predominantly miRNAs), may contribute to MSC pro-regenerative and immunosuppressive potential [21,22]. In OA, preliminary in vitro results showed MSC-EVs protective effects on both chondrocytes and synoviocytes [23,24]. Notably, EVs derived from synovial MSCs overexpressing miR-140-5p induced proliferation of chondrocytes in vitro, supporting the crucial role of miRNAs [25]. Consistently, in an OA mouse model, synovium MSC-EVs attenuated disease scores by promoting chondrocyte proliferation and migration [26]. Similar results were obtained with EVs obtained from ASCs, bone marrow- and amniotic fluid-derived MSCs, with an almost complete restoration of cartilage, less pain and a M1 to M2 polarization of macrophages [27,28,29]. In this frame, MSC-EVs have been demonstrated to possess regulatory functions on immune cells by regulating the proliferation, maturation, polarization and migration of various immune effector cells [30]. As an example, in a model of collagen-induced OA, MSC-EVs exerted anti-inflammatory effects through the inhibition of B cell maturation [27]. Moreover, an increasing number of reports showed the M1-suppressing and M2-enhancing capacities of MSC-EVs on macrophages, mainly through shuttled miRNAs [30], contributing to the beneficial effect of ASCs on macrophage regulation [31]. Intriguingly, also MFAT was shown to switch off synovial macrophage activity in vitro [32], through a decrease of activating chemokines and, possibly, the presence of M2-modulating EVs.
Therefore, a complex network of both soluble factors and EVs-embedded miRNAs would be responsible for the promising results of MSC-based therapies in the OA setting. Nevertheless, to date, a complete picture of secreted molecules and miRNAs is missing, especially in conditions mimicking those MSCs find once injected in the OA joint. In fact, often, the experimentally induced inflammatory conditions are very far from the real amount and types of inflammatory factors found in a pathological joint. The aim of this study was therefore to identify secreted cytokines, chemokines and growth factors and EV-shuttled miRNAs from ASCs treated with inflammatory mediators at concentrations resembling those in the OA synovial fluid based on literature reports [33,34,35,36,37,38,39,40,41] in order to clarify how the ASCs regulate cell homeostasis and regenerative pathways in OA joints.

2. Results

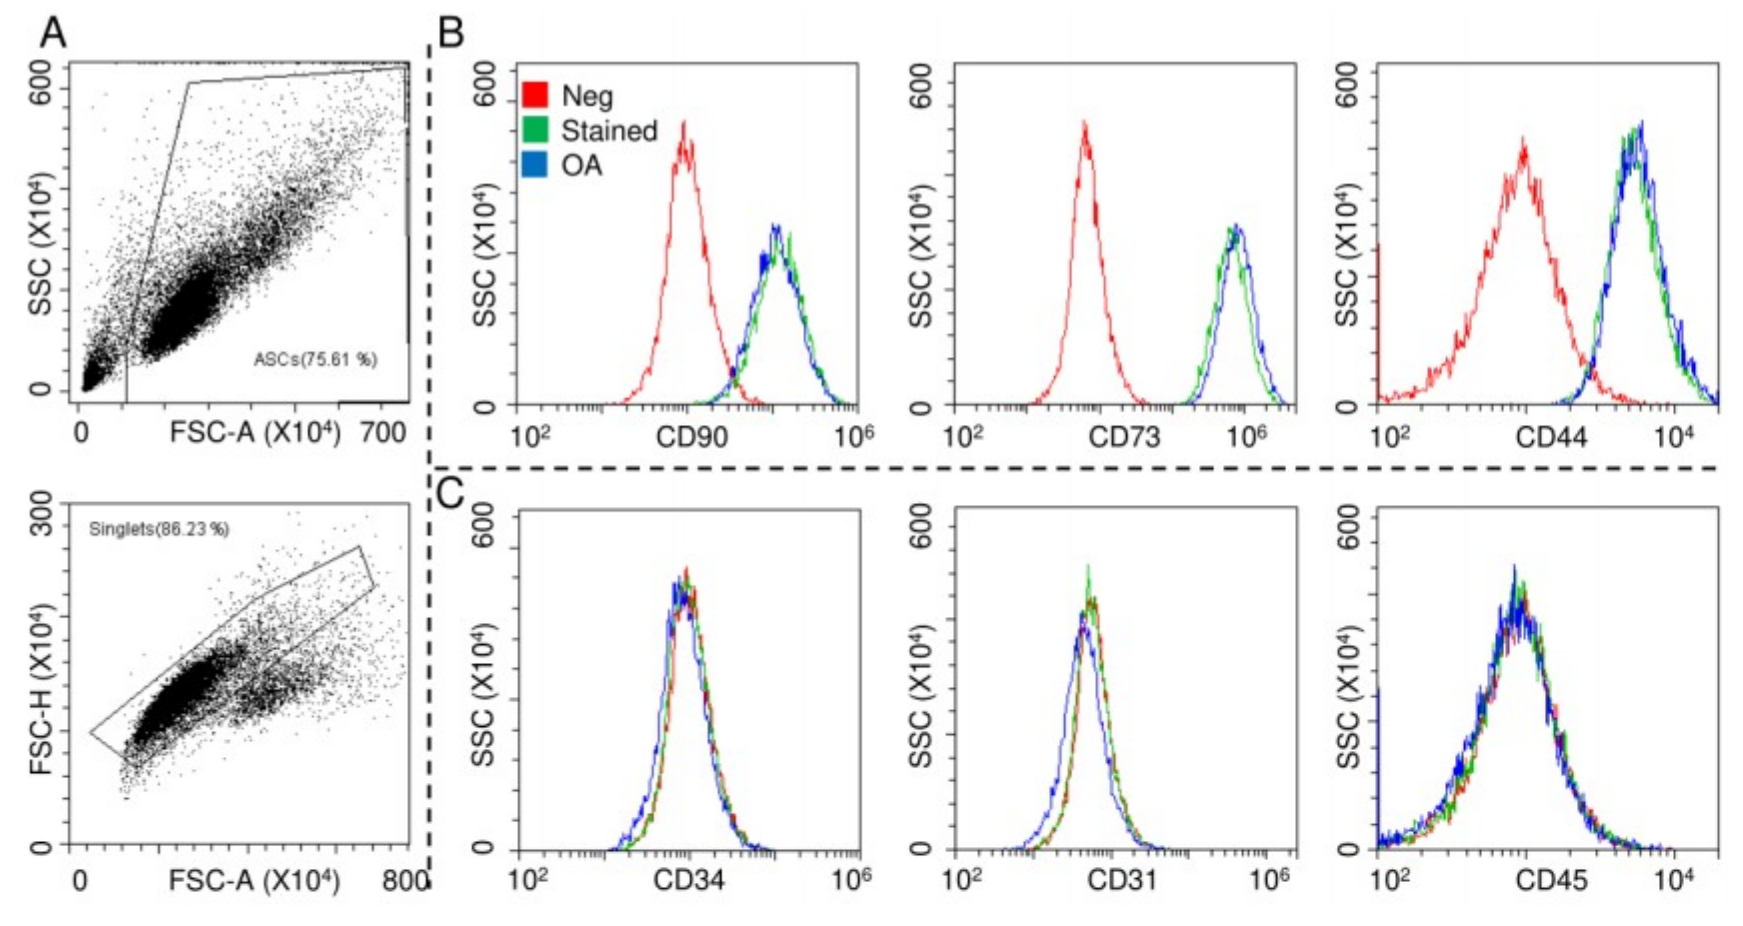
2.1. ASCs Characterization

ASCs were characterized by flow cytometry for both MSCs and hemato-endothelial markers in the absence and presence of OA-resembling cytokines TNFα (5 pg/mL) + IL1β (10 pg/mL) + IFNγ (40 pg/mL), with working concentrations obtained by calculating the median values from the OA synovial fluid analysis [33,34,35,36,37,38,39,40,41] (Figure 1A). The cells were strongly positive for mesenchymal epitopes (Figure 1B, CD90-CD73-CD44) and negative for CD31, CD34 and CD45, confirming their identity (Figure 1C). Inflammation did not alter marker expression, as well as viability (95% ± 1% in control ASCs and 96% ± 1% in the OA condition).

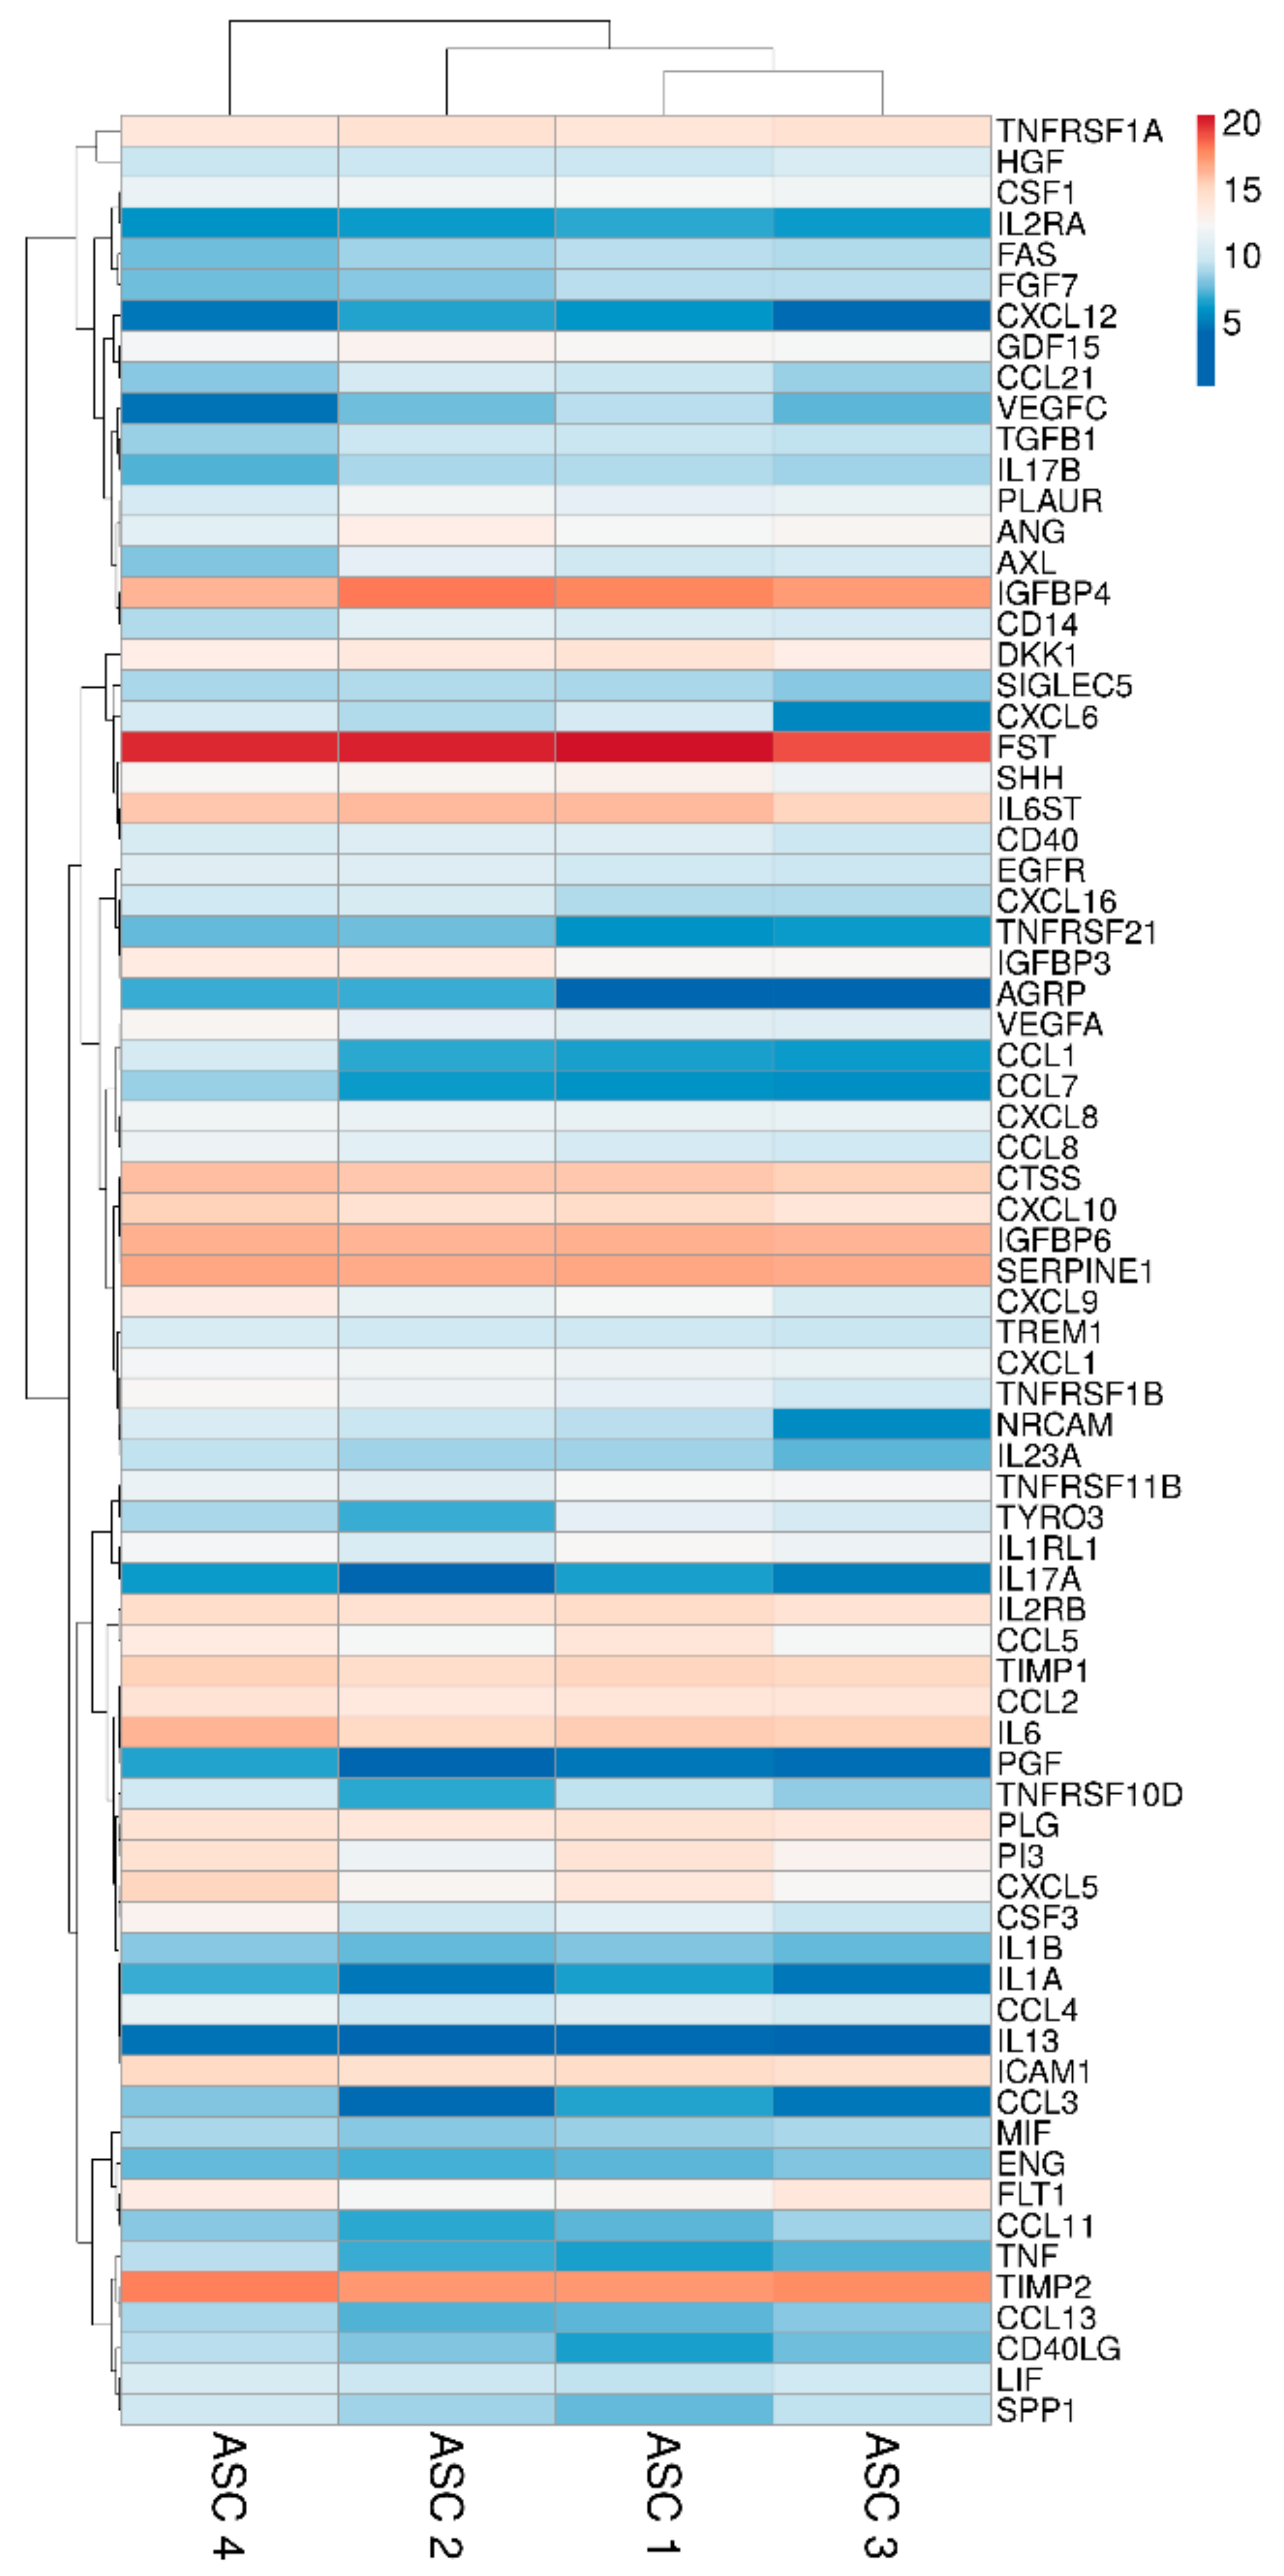
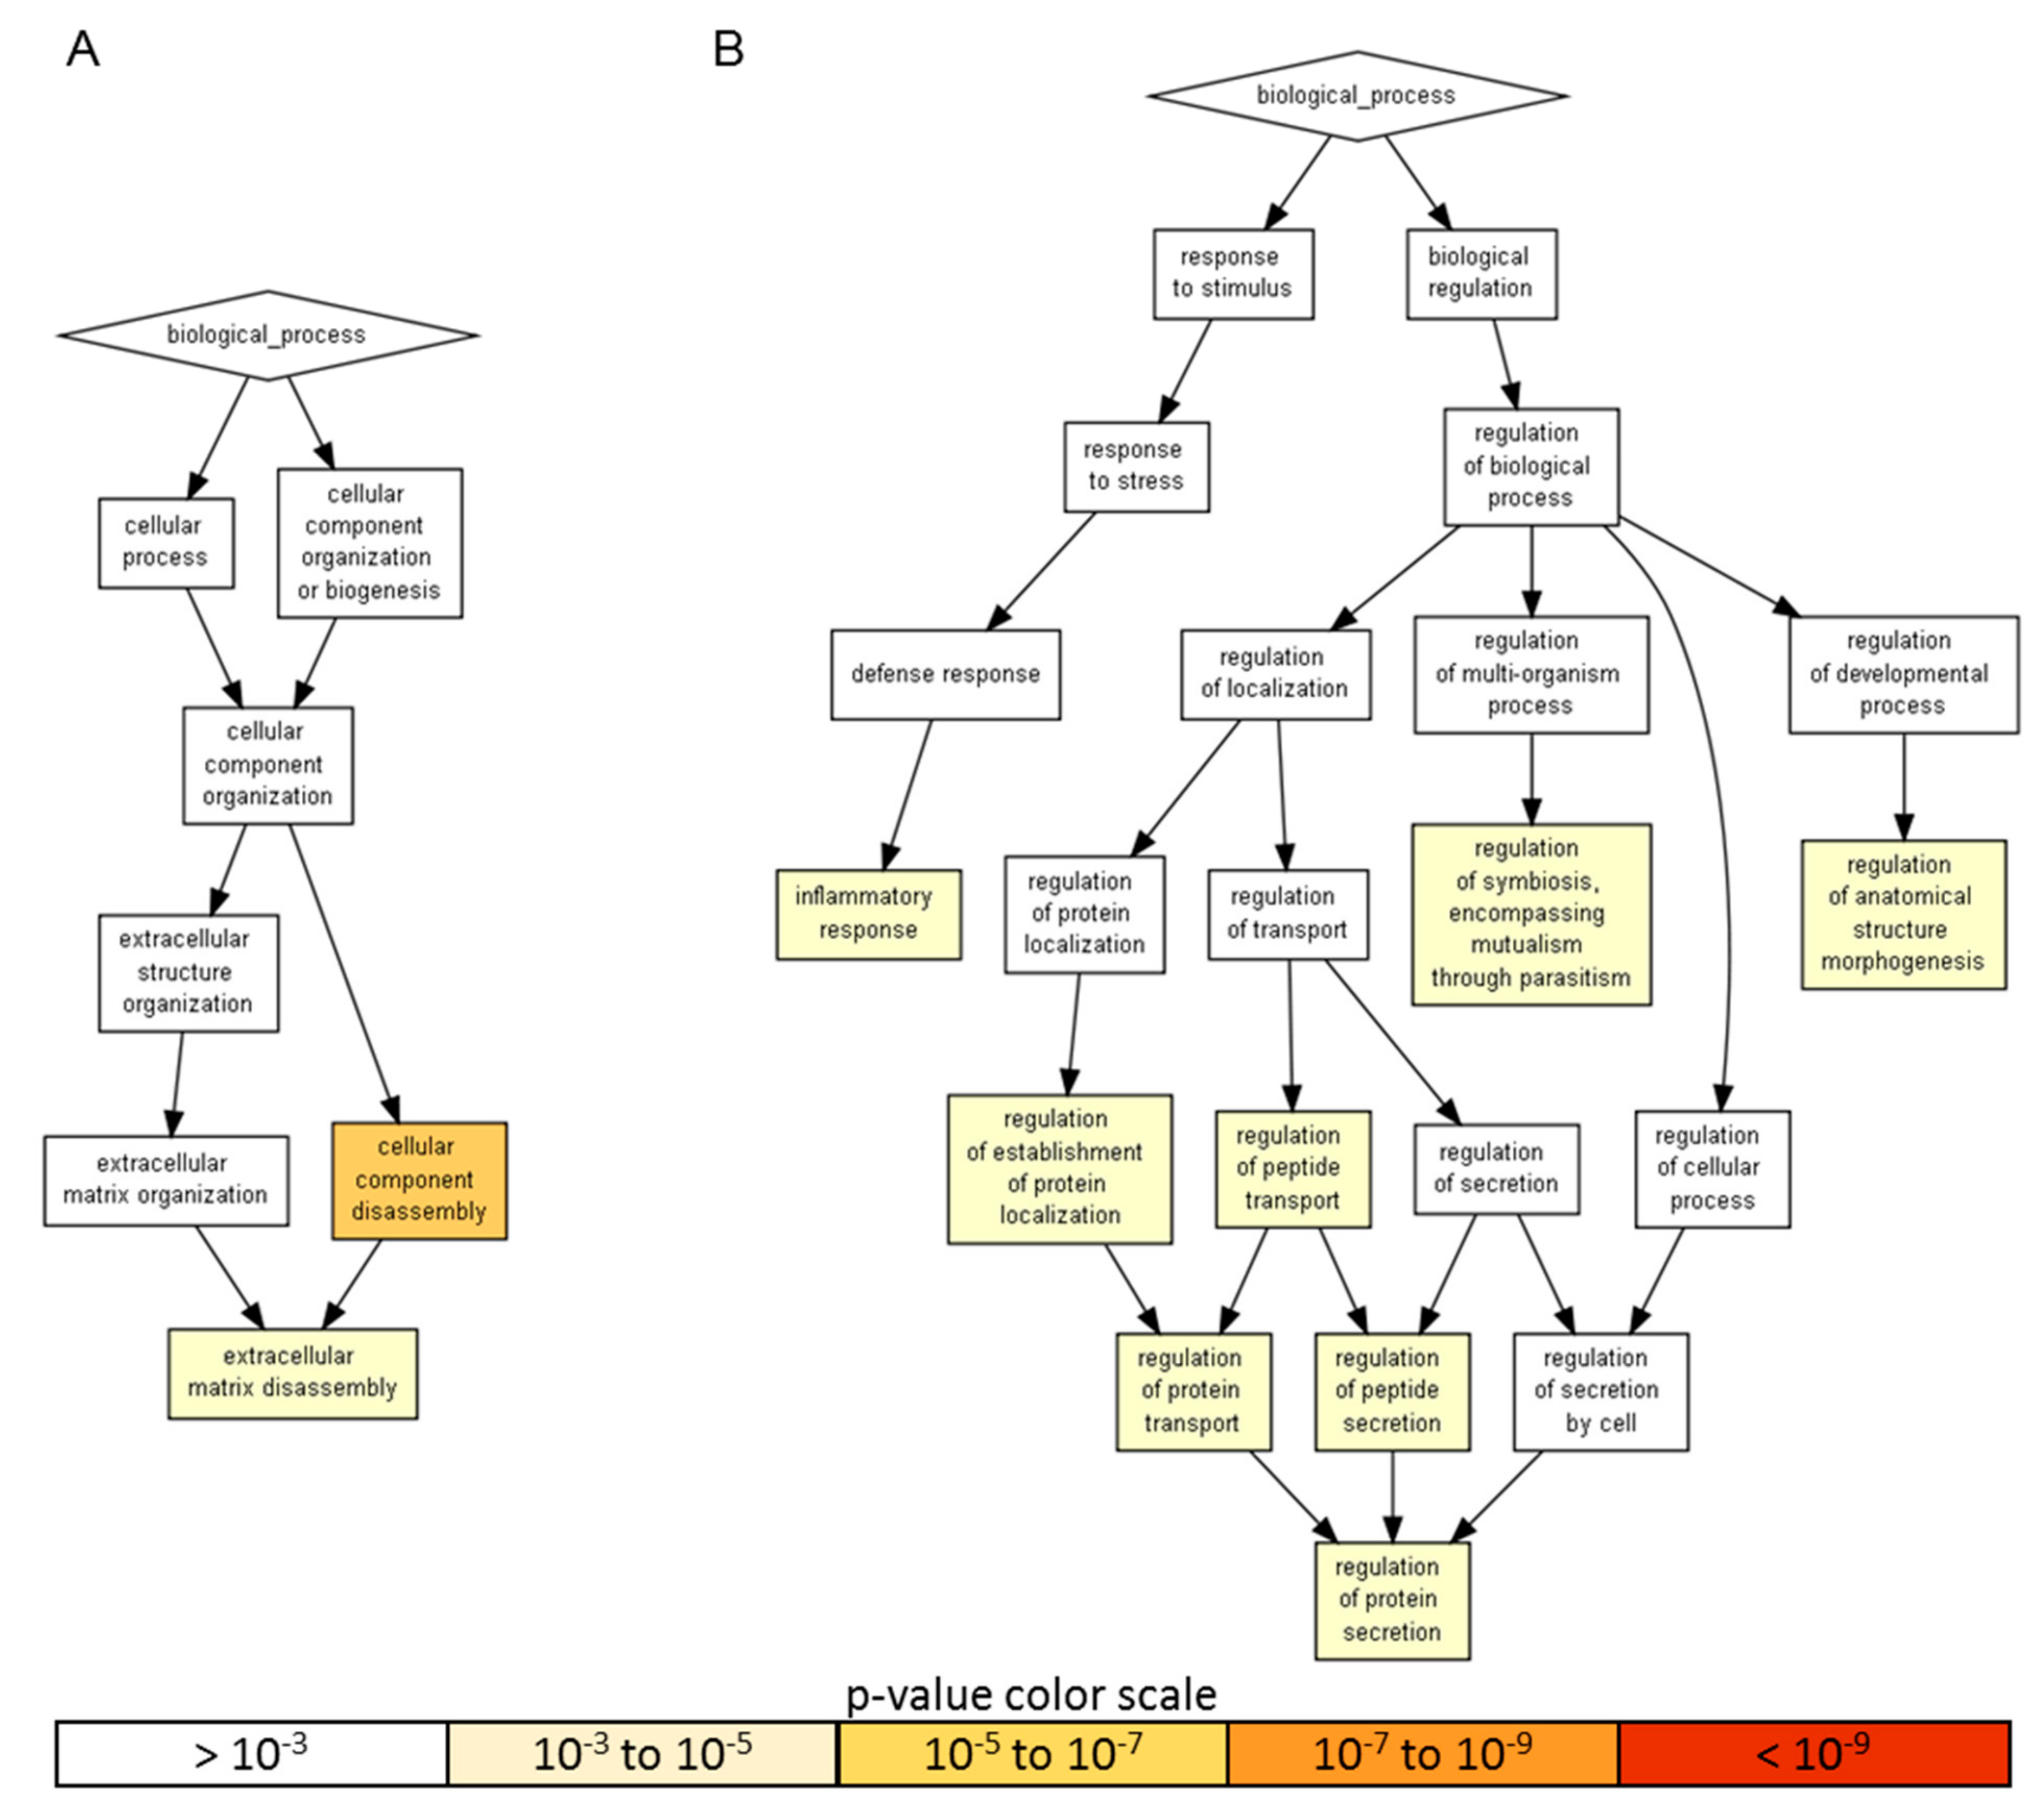
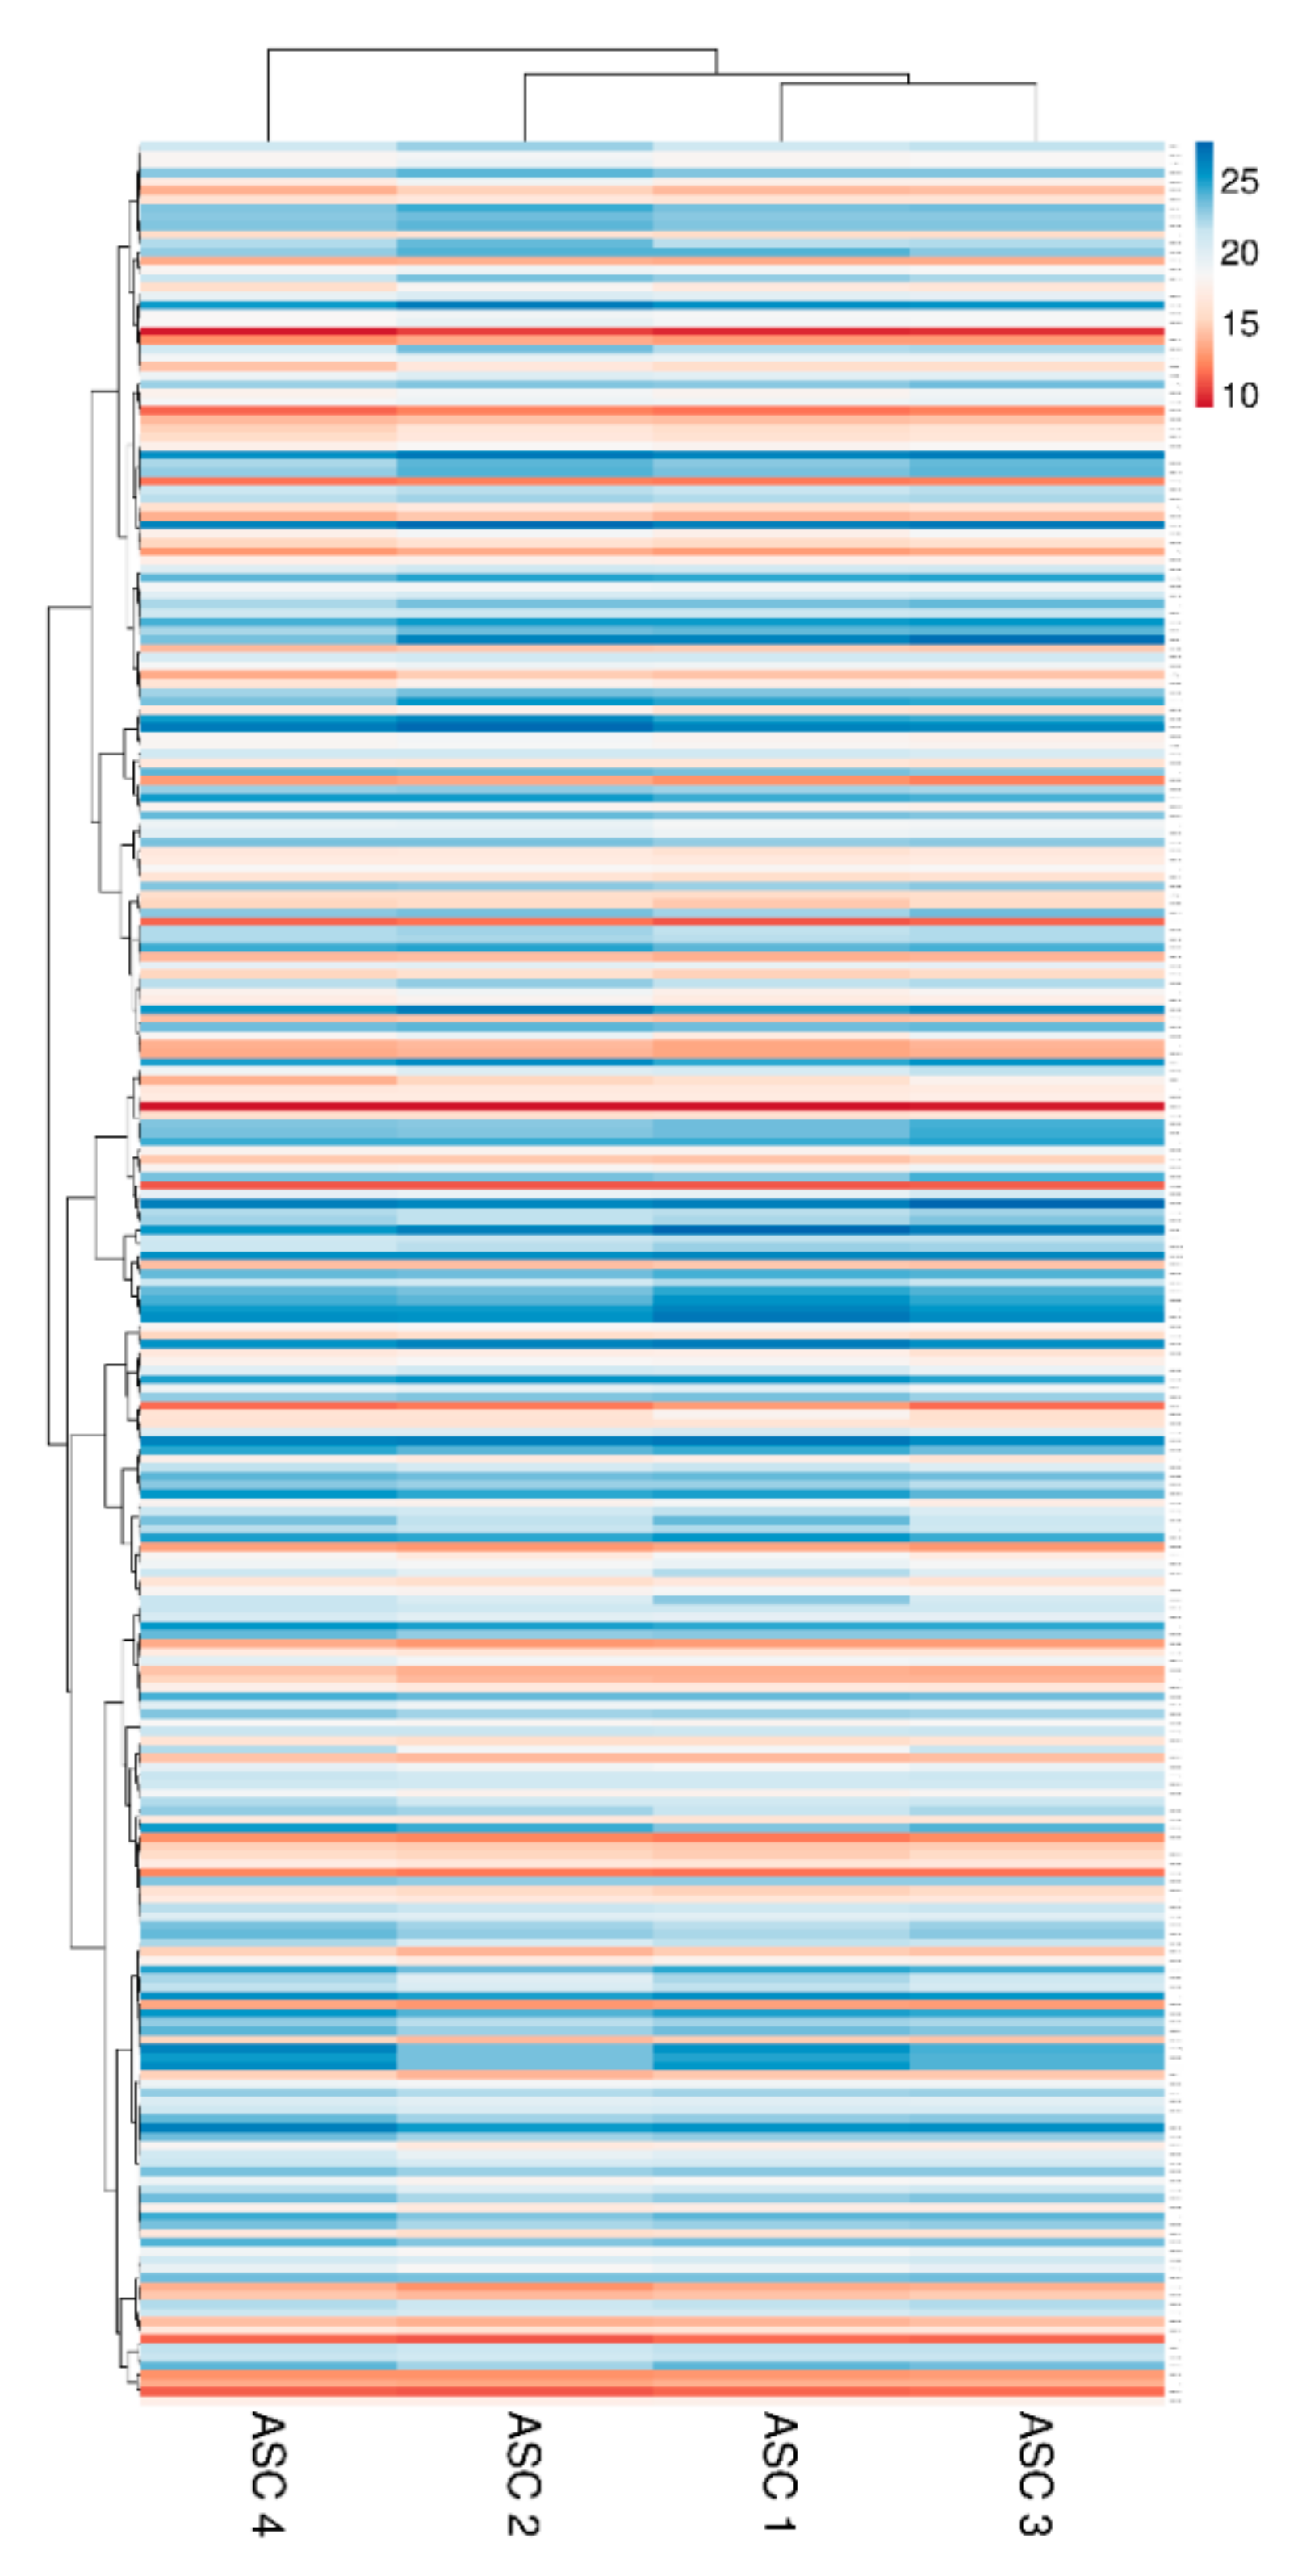
2.2. ASCs Secreted Factors

Two hundred molecules, including inflammatory mediators and growth factors, chemokines, receptors and cytokines, were tested in conditioned medium produced by ASCs under OA-simulating conditions. Seventy-five molecules were scored in all samples at 48 h of induction (Table 1). Interestingly, about 0.2 ng of IL1β and TNFα were detected. This value is higher than the initial levels in the culture medium provided by the medium supplementation (0.01 and 0.05, respectively). On the other side, IFNγ was below detection, meaning a consumption of the administered cytokine without further release given by inflammation at the selected time point of 48 h, being aware that a more prolonged inflammation might lead to its secretion. Hierarchical clustering was able to show a higher similarity for ASC 1 and 3 (Figure 2), although in a pattern of overall conservation, since the correlation analysis showed a mean R2 of 0.96 ± 0.02. Consequently, an average intensity value was calculated in order to provide a guide to the level of each factor (Table 1). In 48 h, per million cells, four factors were secreted with an average amount superior to 100 ng, namely FST (mean 1037 ± SD 377), TIMP2 (196 ± 43), IGFBP4 (182 ± 85) and SERPINE1 (108 ± 9). Fourteen factors were between 10 and 100 ng: IGFBP6 (86 ± 7), IL6ST (56 ± 15), CTSS (52 ± 10), IL6 (49 ± 23), TIMP1 (34 ± 6), ICAM 1 (27 ± 5), CXCL10 (26 ± 10), IL2RB (24 ± 5), TNFRSF1A (18 ± 4), CCL2 (16 ± 2), PLG (16 ± 2), CXCL5 (16 ± 15), DKK1 (12 ± 4) and PI3 (12 ± 9). Eventually, the average amount of 24 factors was between 10 and 1 ng and, of the other 33, below 1 ng.
Gene ontology enrichment analysis was performed using annotations for the 200 factors as the background dataset. Two groups were scored: (i) the 18 factors with an amount > than 10 ng, representing a more focused and preponderant secretome fingerprint and (ii) the factors secreted at lower levels that, even if less abundant, could represent an equally important overall signal due to higher number of molecules. For heavily secreted factors, gene ontology (GO) enrichment analysis identified two significant (p-value < 10−3) biological process (BP) terms, namely cellular component disassembly (GO:0022411), encompassed by five proteins, and extracellular matrix disassembly (GO:0022617), defined by four players (Figure 3A and Table 2). When the other 57 factors were analyzed, eight statistically enriched BPs were found (Figure 3B and Table 2), with the terminal nodes being for the: (i) biological regulation pathway—regulation of anatomical structure morphogenesis (GO:0022603, 28 molecules), regulation of symbiosis, encompassing mutualism through parasitism (GO:0043903, seven) and regulation of protein secretion (GO:0050708, 19) and, for the (ii) response to stimulus cascade—inflammatory response (GO:0006954, 31). Further, due to the reported role of ASCs in modulating synovial macrophages, the inflammatory response list was sifted through a Panther algorithm to identify specific and macrophage-related GO terms. A few terms emerged: macrophage chemotaxis (GO:0048246, two factors) and migration (GO:1905517), both defined by CCL3 and CCL5; the positive regulation of macrophage differentiation (GO:0045651) and regulation of macrophage differentiation (GO:0045649), both defined by CSF1 and TGFB1; the positive regulation of macrophage chemotaxis (GO:0010759, CCL5 and CSF1) and regulation of macrophage chemotaxis (GO:0010758, CSF1, CCL5 and MIF) and the positive regulation of macrophage activation (GO:0043032, CCL3 and IL13) and regulation of macrophage activation (GO:0043030, CCL3, IL13 and MIF). Eventually, to have a comprehensive overview of the entire dataset, in the inflammatory response terms, nine proteins of the > 10 ng group also fell (CCL2, CXCL10, CXCL5, EGFR, ICAM1, IGFBP4, IL6, TIMP1 and TNFRSF1A). CCL2 belonged to macrophage chemotaxis, LIF to the regulation of macrophage differentiation and IL1RL1 and IL6 to macrophage activation. Related to macrophages and their ability to migrate, monocyte chemotaxis (GO:0002548, IL6 and CCL2) emerged. Interestingly, other GO terms related with motility were identified, like leukocyte chemotaxis (GO:0030595, IL6, CCL2, CXCL5 and CXCL10); lymphocyte chemotaxis (GO:0048247, CCL2 and CXCL10) and granulocyte chemotaxis (GO:0071621, CCL2, CXCL5 and CXCL10). In particular, the positive regulation of leukocyte migration (GO:0002687, ICAM1, IL6 and CXCL10) term was defined, indicating the influence of highly secreted factors on processes that activate or increase the frequency, rate or extent of leukocyte migration. Supporting this notion, a more general analysis of the 65 factors allowed to identify 23 molecules under leukocyte chemotaxis (GO:0030595), with only two factors related to the negative regulation of leukocyte chemotaxis (GO:0002689, MIF and CCL2) and 16 to the positive regulation of leukocyte chemotaxis (GO:0002690). Therefore, overall, ASC secretome was enriched in molecules involved in both extracellular matrix homeostasis and the inflammatory response control to different levels, from migration to homeostasis/activation.

2.3. Characterization of ASC-Derived Extracellular Vesicles

ASCs treated with OA cytokines for 48 h release around 22,500 extracellular vesicles (EVs) per cell. Isolated EVs exhibited the characteristic cup-shape morphology (Figure 4A) and were within the literature-reported size range (50–400 nm in diameter), with enrichment in the small particles (mode 118 ± 19 nm) (Figure 4B). To detect particles within the nanometer range, the flow cytometer has been calibrated with FITC-fluorescent beads of predetermined size (100 to 900 nm, Figure 4C). Purified EVs felt within the 100 nm size, confirming NTA data (Figure 4D). EVs were strongly positive for extracellular vesicle CD63 and CD81 markers (Figure 4E), 78.9% ± 1% and 81.6% ± 0.9%, respectively, consistent with previously reported characteristics of extracellular vesicles. On the contrary, CD9 staining was low (2.4% ± 0.2%).

2.4. EV-Associated miRNAs

Two-hundred and fifty-seven miRNAs were identified as EVs embedded at various levels of expression in all the four ASCs under analysis (Supplementary Table S1). EV-miRNA hierarchical clustering output was superimposable to the one obtained for factors with higher similarity for ASC 1 and 3 (Figure 5). Nevertheless, a pattern of overall conservation was again present, with correlation analysis showing a mean R2 of 0.97 ± 0.01. Therefore, an average CRT value was calculated in order to provide a guide to the level of each miRNA (Supplementary Table S1).
Given the presence on average of one abundant miRNA molecule per EV in MSC, 100 MSC-EVs would be needed to shuttle its genetic message to target cells [42,43]. Therefore, only highly abundant miRNAs laying in the first quartile of expression were considered for further analysis (65 miRNAs, covering 96.7% of the genetic message) (Supplementary Table S1, yellow background). Ingenuity pathway analysis (IPA) of the 65 miRNAs used to score only experimentally observed targets identified 818 mRNAs (Supplementary Table S2). An unbiased GO enrichment analysis against the whole genome, with a stringent p-value threshold (< 10−6) due to the high number of scored mRNAs, was able to identify BP related to cell cycle regulation (Figure 6), with the most significantly (p-value < 10−9) enriched terms being: regulation of the cell cycle process (GO:0010564, p-value 1.31 × 10⁻¹¹, 45 associated genes) and regulation of the mitotic cell cycle (GO:0007346, 8.14 × 10⁻¹⁰, 39 genes). Notably, negative regulation of the cell cycle process term (GO:0010948, 6.12 × 10⁻⁷, 24 genes) suggested that shuttled miRNAs may reduce the activity of genes delaying the cell cycle events, thus promoting proliferation. To define better this influence, the enriched molecular function (MF) GO search was able to specify target terms as the cyclin-dependent protein serine/threonine kinase regulator activity term (GO:0016538, 2.02 × 10⁻⁹), encompassing several cyclins (CCNA2, CCNE2, CCNF, CCNE1, CCND1 and CCND3); cyclin-dependent kinases (CDK4) and inhibitors (CDKN2A, CDKN1C, CDKN1B and CDKN1A) and an apoptosis-related cysteine peptidase (CASP3).

2.5. Target and Effect Prediction of EV-miRNAs on OA-Cartilage

To frame the power of EV-miRNAs in the OA setting, the 818 target mRNAs were filtered through 2368 abundantly expressed genes, identified as laying in the first quartile of expression (out of 9474 total genes), in cartilage biopsies from OA patients [44]. After filtering, 224 EV-miRNA targets were left and shared (Supplementary Table S3). First, identified genes were searched against those in the IPA database of the OA-related pathway. Nineteen genes resulted targets of EV-miRNAs (ATF4, BMPR2, FGF2, FGFR1, FGFR3, FN1, HIF1A, ITGA5, JAG1, MEF2C, MMP3, SMAD3, SMAD4, SMAD5, SP1, TGFBR1, TGFBR2, TIMP3 and VEGFA). Most represented protein classes were transcription factors (PC00218: HIF1A, MEF2C, SMAD3/4/5 and SP1); receptors (PC00197: BMPR2 and TGFBR1/2) and signaling molecules (PC00207: FGF2, FN1 and VEGFA). Notably, many of these molecules specified molecular cascades that are directly involved with OA insurgence and development, like TGF-beta (P00052: BMPR2, SMAD3/4/5 and TGFBR1/2); FGF (P00021: FGF2 and FGFR1/3) and Wnt (P00057: SMAD4/5 and TGFBR1) signaling pathways. Second, GO enrichment (p-value < 10−6 for enriched GO term threshold) was conducted by scoring the 224 mRNAs against the entire first quartile of OA cartilage as background. Several BP terms were identified, suggesting that when a tissue and/or disease-focused search is performed, the specificity and power of the outcomes increase (Supplementary Figure S1). In particular, five terms were more significantly enriched (p-value < 10−9): the negative regulation of multicellular organismal process (GO:0051241, 1.68 × 10⁻¹⁰, 52 genes); regulation of cellular component movement (GO:0051270, 3.93 × 10⁻¹⁰, 50 genes); regulation of cell motility (GO:2000145, 4.42 × 10⁻¹⁰, 48 genes); cellular response to chemical stimulus (GO:0070887, 7.71 × 10⁻¹⁰, 68 genes) and regulation of cell migration (GO:0030334, 8.45 × 10⁻¹⁰, 46 genes). Interestingly, EV-miRNAs seem to selectively target genes defining the positive regulation of movement: positive regulation of cell migration (GO:0030335, 1.37 × 10⁻⁹, 35 genes); positive regulation of cell motility (GO:2000147, 2.76 × 10⁻⁹, 35 genes) and positive regulation of locomotion (GO:0040017, 6.76 × 10⁻⁹, 35 genes). All these BP regulating the cell response and adaptation relies on several cascades ending in a complex transcriptional regulation, as outlined by the enriched MF GO term DNA-binding transcription factor activity, RNA polymerase II-specific (GO:0000981, 1.79 × 10⁻⁸, 38 genes).
Finally, the list of 65 abundant EV-miRNAs was compared with the database of miRNAs reported to be directly involved in OA pathogenesis, both protective and destructive [45]. Seventeen miRNAs resulted to be involved with protective mechanisms, seven regulate degenerative pathways and four are controlling both mechanisms (Table 3 and Figure 7). Interestingly, scoring the genetic weight of the EV-shuttle and miRNA-related message, protective molecules account for almost 40%, whereas degenerative ones less than 10%. Overall, this might indicate a preponderance of EV-miRNAs in cartilage and synovium protection.

2.6. Target and Effect Prediction of EV-miRNAs on Synovial Macrophages

In a recent publication, the transcriptional landscape of infiltrated synovial macrophages has been defined in OA patients [46]. Two types of macrophages were identified: inflammatory-like OA (iOA) macrophages, which are closely aligned to rheumatoid arthritis (RA) macrophages, and classical OA (cOA) ones displaying, together with lower inflammatory features, aberrant tissue repair mechanisms and secretion of factors that may directly contribute to cartilage degradation. Since, in a previous publication, the macrophage transcriptional fingerprint was able to clearly distinguish RA and OA cells [47], we opted to consider newly defined cOA macrophages’ mRNA dataset for further analysis. Eight-hundred and eighteen EV-miRNA target mRNAs were filtered against the first quartile of expression (2498 transcripts) of synovial macrophages (total of 9991), and 214 shared genes were identified (Supplementary Table S4). Only 112 genes were shared between the OA cartilage and synovial macrophages, suggesting a divergent response.
First, identified genes were searched against those in the IPA database of the inhibition of metalloproteases pathway, a subclass of the previously scored OA pathway, given the role of synovial macrophages in cartilage ECM destruction. Interestingly, MMP1, 3 and 9 resulted experimentally verified targets, together with RECK and TIMP3 inhibitors, suggesting a profound role of EVs on OA macrophages remodeling activity. Further, searching the GO term macrophage activation (GO:0042116), out of 94 annotated genes, six emerged as possible targets (APP, IL10, JUN, TLR4/7 and TNFa). Intriguingly, abundant miRNAs did not target directly the expression of canonical M1 chemokines (CCL2/3/4/8/20 in the top expressed OA-synovial macrophages mRNAs) and cytokines (IL1A/B), with the exception of IL6 and TNFa. On the contrary, EVs might regulate macrophage polarization by targeting TLR4 that, through NF-kb, suppresses STAT3, whose predominance over STAT1 increases M2 polarization, associated with immune tolerance and tissue repairing. Then, to have a more comprehensive view, the genes were scored against the OA synovial-macrophages first quartile mRNAs (p-value < 10−6) as background to identify enriched GO terms. Again, several BP emerged, with a completely different pattern with respect to cartilage. In particular, six terms were strongly enriched (p-value < 10−9): the anatomical structure development (GO:0048856, 6.05 × 10⁻¹², 84 genes); animal organ development (GO:0048513, 3.66 × 10⁻¹¹, 46 genes); positive regulation of multicellular organismal process (GO:0051240, 1.51 × 10⁻¹⁰, 68 genes); negative regulation of cell death (GO:0060548, 4.49 × 10⁻¹⁰, 54 genes); regulation of smooth muscle cell proliferation (GO:0048660, 7.47 × 10⁻¹⁰, 19 genes) and negative regulation of programmed cell death (GO:0043069, 9.95 × 10⁻¹⁰, 50 genes). Interestingly, and differently from cartilage, in macrophages, EV-miRNAs may preferentially target genes regulating apoptosis and cell death-related pathways, as emphasized by other significantly enriched GO terms like the negative regulation of the apoptotic process (GO:0043066, 1.47 × 10⁻⁹, 1.81 × 10⁻⁶, 49 genes) and regulation of cell death (GO:0010941, 6.29 × 10⁻⁹, 71 genes). In fact, narrowing the GO enrichment analysis (p-value < 10−9 as the threshold for GO enrichment), cell death and its regulation emerged as a main constituent of a GO term branch (Supplementary Figure S2). Further, EV-miRNAs are also able to target genes defining myeloid lineage, as shown by GO terms: the regulation of myeloid cell differentiation (GO:0045637, 1.87 × 10⁻⁷, 19 genes) and positive regulation of myeloid cell differentiation (GO:0045639, 2.04 × 10⁻⁷, 13 genes). As for cartilage, the different BPs rely on a high number of molecular and transcriptional cascades, as emphasized by the MF GO term DNA-binding transcription factor activity, RNA polymerase II-specific (GO:0000981, 8.45 × 10⁻⁹, 31 genes).
Eventually, a database of miRNAs involved in M1 vs. M2 macrophage polarization [48] was scored to weight the influence of embedded EV-miRNAs on macrophage phenotypes (Table 4). Although four miRNAs are involved in M2 with respect to seven controlling M1 phenotype, the presence of miR-24-3p, which is responsible for the M1 to M2 switch, and miR-222-3p, which controls M2 polarization, tip the balance towards a more pronounced influence on M2 phenotype (Figure 8). Consistently, as a global EV fingerprint, 26% of first-quartile miRNA-dependent signals are encompassed by M2-related molecules vs. 7% represented by M1 players. Intriguingly, when IPA CCR5 signaling in the macrophages pathway was searched against the 214 target mRNAs, JUN, FOS and MAP2K4 kinases were identified, suggesting an EV-dependent downregulation of the CCR5 cascade, whose inactivation resulted in a switch towards an M2 phenotype [49]. Moreover, to support the influence of EV-miRNAs on monocyte/macrophage homeostasis, miR-16-5p (0.5%), regulating the monocyte to macrophage developmental transition, and miR-34a-5p (0.7%) together with miR-132-3p (0.5%), participating in macrophage maturation, were also found in the frame of the most expressed miRNAs.

3. Discussion

In this work, both EV-shuttled miRNAs and soluble factors have been characterized in the secretome of ASCs cultivated in vitro under OA-resembling inflammatory conditions. Several molecules were identified as both cartilage-protective and M1 towards M2 macrophage switchers. Herein presented results provide a strong molecular basis for the promising clinical results observed with ASC-containing products, as MFAT or SVF, in OA settings.
In a murine OA model, injection of MSC secretome, similarly to injection of MSCs, resulted in early pain reduction with a protective effect [15]. Further, both the whole conditioned medium and purified EVs resulted to be effective in cartilage surface restoration and ECM deposition in several in vivo OA defect models [25,27,50,51,52], mainly thorough EV-associated matrix-remodeling enzymes and regulators as a novel means of matrix remodeling in physiological and pathological conditions [53]. In humans, phase I clinical trials demonstrated the safety and preliminary evidence of efficacy and pain reduction by using local injections of autologous ASCs in OA patients [54,55]. Similarly, autologous and minimally manipulated MSC-enriched tissues [56], such as BMAC or MFAT/SVF, showed the same outcomes. Of note, a partially overlapping array of pro-regenerative and anti-inflammatory molecules was recently shown to be secreted from both expanded ASCs and MFAT or lipoaspirates [57], suggesting that signals secreted by MSCs may explain, at least in part, the promising results of MSC-enriched products in OA management.
Although it is quite well-accepted that MSCs act through paracrine mechanisms on resident cells, nevertheless, a thorough characterization of soluble factors and EV content is lacking and would be essential to define MSCs and MSC-enriched products. In this perspective, in the last years, researchers have tried to couple the array of secreted molecules with the observed protective effects in clinical experiences [58,59]. Despite valuable hints, very often, the input datasets had two major flaws. First, secreted factors and EV-miRNAs data were not generated from the same experimental workflow; therefore, technical and/or biological differences were underestimated. Second, for both types of molecules, no inflammatory effects resembling those in the OA joint were considered, being cells cultured in a control medium or under a heavy priming (in the order of ng/mL), which is not close to the concentration of cytokines usually found in synovial fluids (pg/mL). Thus, the present study offers a more homogeneous and comprehensive dataset, being aware that the combination of the three inflammatory cytokines used is a simplified in vitro condition due to the greatly higher number of factors and the wide range of concentration in the joints of OA patients.
Cartilage thinning and degradation are one of the major fingerprints in OA, resulting from an imbalance of the cartilage homeostasis characterized by excessive catabolic activity that overcomes repair capacity. In particular, increased action of the matrix metalloproteinases (MMPs) in combination with reduction of their inhibitors (TIMPs) levels are largely responsible for the earliest osteoarthritic changes [60], suggesting that a restoration of the healthy balance would help in residual cartilage protection and regeneration. Interestingly, in pioneering studies on OA patients, SVF injection was able to stimulate partial regeneration of the articular cartilage, as described by positive changes in the imaging outcomes (MRI or CT) [61,62,63,64,65]. Consistently, in the last years, few clinical trials based on intra-articular injection of autologous ASCs in OA joints reported improvement in pain, function and cartilage volume [66,67]. These effects on cartilage may be, at least partially, ascribed to those protective molecules and miRNAs we found in the ASC secretome. In fact, three out of four of the most abundantly secreted factors (FST, TIMP2 and SERPINE1) are connected with extracellular matrix assembly and homeostasis and are further reported to have a direct influence on cartilage. TIMPs can regulate ECM remodeling and the activities of growth factors and their receptors by inhibiting MMPs [68]. In dogs, TIMP2 expression is decreased in OA cartilage [69] and synovial fluids [70], whereas, in mice, TIMP2 depletion leads to accelerated OA [71]. Similar protective effects on cartilage homeostasis were demonstrated in mice for the activin receptor follistatin, whose injection reduced both proteoglycan erosion and synovial macrophage infiltration [72]. Further, Serpin E1, also called PAI-1 or plasminogen activator inhibitor 1, positively correlates with the synthesis of cartilage during pathophysiologic processes [73] and counteracts the activity of urokinase/tissue-type plasminogen activators (uPA/tPA), both elevated in OA cartilage in contrast to reduced serpin E1 [74]. Moreover, the presence of the urokinase plasminogen activator surface receptor (PLAUR) in the secretome (2.4 ng per 106 ASCs) may also contribute to reduce plasminogen (either naturally occurring or secretome-shuttled) activation in plasmin, which can activate MMPs and plays an important role in modulating cartilage function [75]. Furthermore, elafin (PI3) that was found in the secretome at 12 ng per million ASCs may directly inhibit MMP9 [76].
Nevertheless, other abundant molecules, although at lower levels (between 10 and 100 ng with the exception of IGFBP4), have detrimental or ambiguous effects on cartilage homeostasis, making an overall potency prediction less straight-forward. IGFBPs (insuline growth factor-binding proteins) bind chondrocyte-secreted IGF-1, which induces the production of cartilage matrix components and has a protective role in OA [77]. Accordingly, IGF-1 deficiency, partly caused by IGFPBs seizure, caused an increased severity of OA articular cartilage lesions in both rats and guinea pigs [78,79]. Additionally, cathepsin S is a cysteine protease which has been implicated in the pathogenesis of OA and is involved in acute inflammatory conditions of cartilage [80]. Interestingly, Dkk1, a Wnt pathway suppressor, was reported to have dual activity: its supplementation has been shown to protect mice from experimental OA [81], whereas, in rats, the silencing alleviated chondrocyte apoptosis and cartilage destruction [82]. Thus, a stringent control over Wnt-signaling is required to maintain cartilage homeostasis [83]. Further, interleukin 6 is associated with increased levels of MMPs, as well as with the radiographic severity of OA [84]; although, in the secretome, the concomitant presence of its receptor IL6ST may mitigate the detrimental effects. Similarly, the detection of receptors such as IL2RB and TNFRSF1A, with TNFRSF1B/11B and IL1RL1 and CD40 between 1 and 10 ng, may reduce the amount of free OA-related cytokines and chemokines [85]. Thus, the global message of ASC-secreted factors supports the protective and postulated pro-regenerative effects observed in the clinical experience.
This indication is also endorsed by the EV-miRNAs. It clearly emerged that only a sharp definition of the disease context may allow a potency prediction. In fact, each miRNA may target multiple mRNAs which may be absent, weakly expressed or very abundant. In this work, we decided to study the effect of shuttled miRNAs on highly expressed transcripts, in either cartilage or macrophages, being aware that those with low levels might also have important direct regulatory or, through their protein products, active functions. Interestingly, EV-miRNAs appeared to regulate several processes connected with both OA-related transcriptional cascades and migration/cell motility. In particular, the TGFB pathway was demonstrated to play multiple roles in the development, growth and maintenance of articular cartilage [86]. EV-miRNAs appeared to potentially downregulate the TGFBR1/2 branch of the pathway, targeting in addition the downstream effectors SMAD3 and 4. This is of relevance, since TGFBR1 levels and activation correlated with aggrecan and collagen type II levels in human OA cartilage [87]. Nevertheless, a clear picture is again difficult to be drawn, since SMAD5, effector of the alternative ALK1-dependent branch of the TGFB pathway and highly correlating with MMP-13 mRNA levels [87], is also targeted by EV-miRNAs. Thus, the net effect of miRNAs on the protective TGFBR1/Smad2/3 vs. destructive ALK1/Smad1/5 signaling balance may not be evaluable in silico. Under a different point of view, a tight regulation of TGFB may be beneficial, since its supplementation as a therapeutic agent, although leading to prolonged elevation of proteoglycan synthesis and content in articular cartilage, may also induce inflammation, synovial hyperplasia and osteophyte formation [88]. Therefore, ASC-EVs might be an interesting adjuvant therapy to circumvent the undesirable effects of TGFB on cartilage repair. On the contrary, in silico-predicted effects on chondrocyte movements are much sharper, with a strong target on genes involved in cell motility and chemotactic response. Interestingly, in OA cartilage, it has been postulated that chondrocytes may move towards one another and cluster together [89] to secrete inflammatory factors like TNF-α or IL-6. Thus, ASC-EVs could suppress chondrocyte movement and cluster formation observed in pathologic tissues. Eventually, miRNAs effects get even clearer when only those directly involved in cartilage protective or destructive mechanisms are considered (Figure 7). The net weight of shuttled miRNAs is toward protection, especially counteracting inflammatory signals. In particular, miR-24-3p represents 19% of EV-miRNAs and was proposed as therapeutic, since its reduction led to p16INK4a increase and MMP1 secretion, indicating that miR-24-3p is protective against senescence and cartilage catabolism [90]. Additionally, miR-24-3p inhibits chondrocyte apoptosis and helps in reducing OA pathogenic processes in rats [91]. In addition, among the most abundant ones, miR-125b-5p (12.5%) prevents aggrecan loss and miR-222-3p (5.8%) cartilage degradation. Therefore, in agreement with secreted factors, miRNAs have a strong balance towards protective messages on OA cartilage, although few degenerative signals may be identified.
Recently, together with cartilage repair [57], MFAT was also demonstrated to mediate the activity of synovial macrophages [32]. In fact, MFAT released mediators with long-lasting anti-inflammatory properties, unraveling the deep interplay with the OA synovial membrane and/or inflammatory cells presence/homeostasis. Supporting this paradigm, herein reported data showed a clear effect of ASCs factors and miRNAs. In fact, 23 secreted molecules control, at different levels, leukocyte chemotaxis, and 16 are involved with positive regulation. Among the most expressed, the alpha chemokine CXCL10, naturally present in OA synovial fluid, has a pivotal role in the first wave of leukocyte recruitment to the synovium [92]. Of note, CXCL10 was also shown to effectively recruit human subchondral progenitors, suggesting that postulated purely inflammatory molecules may contribute to the migratory effect of synovial fluid, not only on inflammatory cells but also on human subchondral progenitors with healing properties [93]. Similar properties on mesenchymal progenitors were shown for the neutrophil chemoattractant CXCL5, also found at > 10 ng, and T cells-attractant CXCL12, able to enhance the migration of bone marrow MSCs [94,95]. In contrast, CCL2 (> 10 ng) does not recruit human MSCs [96], being a potent soluble mediator involved in macrophage chemotaxis and migration together with other beta chemokines found in ASC secretome as CCL5/8 (> 1 ng), CCL1/3/7/13/21 and MIF (< 1 ng) [96]. Intriguingly, and supporting the effectiveness of the herein proposed in vitro model, MSCs treated with OA synovial fluid showed high expression of CCL2 and IL6 [97], that, together with migration, can direct M2 polarization of monocyte/macrophages [98], suggesting not only an attractant but also a potential anti-inflammatory mechanism. In fact, once monocyte/macrophage accumulate within the inflamed synovial joints as the initial and critical step for OA pathogenesis, their survival, activation and, most importantly, polarization are crucial. In this path, TGFB, CSF1 and IL13 are potent stimulator of the M2 phenotype. They can explain, at least in part, how MSCs facilitate the monocyte to macrophage transition, attenuate already activated M1 macrophages and enhance M2 activation. In this frame, in previous reports, bone marrow MSCs promoted changes in the M1/M2 balance in vitro [99]. This paradigm may also explain the in vitro observation that both ASCs and SVF induced macrophage polarization toward a pro-wound healing M2 type [100]. Therefore, thanks to secreted factors, ASCs in enriched tissues as MFAT or SVF can attenuate M1 macrophages by shifting them to an M2 state, laying the foundations for injury resolution in inflammatory-stimulating environments, such as OA joints.
Intriguingly, in the last years, not only MSCs but also their purified EVs showed similar effects on macrophages with cartilage restoration, pain reduction and a M1 to M2 polarization [27,28,29]. Mining the transcriptome of OA synovia-isolated macrophages, although EV-miRNAs targeted the macrophage-secreted remodeling enzymes, such as MMP1/3/9, they did not directly target and shutdown M1 signals. Albeit, they appeared to induce M2 polarization by interfering with TLR4, which suppresses STAT3, whose predominance over STAT1 increases M2 phenotype [101]. This capacity was emphasized for miRNAs involved in M1 vs. M2 macrophage polarization [48]. Twenty-six percent of miRNA molecules embedded in ASC-EVs are directly involved in M2 regulation (Table 4). Although less in number with respect to M1 miRNAs, the presence of miR-24-3p and miR-222-3p (5.8%) tipped the balance towards a protective phenotype. In particular, miR-24-3p was reported to have a wide field of action in macrophages. First, it is able to mediate the transition between M1 and M2 states through p110δ [102]. Second, it enhanced the ability of IL-4 and IL-13, both found in ASC secretome, to generate a M2 phenotype eventually able to resist M1 re-conversion under inducing stimuli [102]. Third, miR-24-3p is a negative regulator of TLR-mediated pro-inflammatory cytokine production in M1 macrophages [103,104]. Furthermore, miR-222-3p was demonstrated to suppress the expression of SOCS3, an alternative negative regulator of the M2 promoter STAT3 [105]. Remarkably, ingenuity pathway analysis of the CCR5 signaling in macrophages identified JUN, FOS and MAP2K4 kinases as targets, suggesting an EV-dependent downregulation of the CCR5 cascade, whose inactivation resulted in a switch towards an M2 phenotype [49]. Eventually, EV-miRNAs also target genes of the negative regulation of programmed cell death (GO:0043069) and of the apoptotic process (GO:0043066). This means that cell death and turnover might be tightly regulated in macrophages, being thus a further beneficial effect since, in mice, unbiased macrophage depletion did not attenuate the severity of OA but induced systemic inflammation with a massive infiltration of inflammatory T cells and neutrophils into the injured joints [106]. Therefore, not only macrophage polarization but also the maintenance of specific macrophage subtypes, may be necessary to mitigate inflammation and OA.
Thus, being aware that other factors and EV-embedded miRNAs secreted by ASCs were not assayed in the present study and will need further characterization in future experiments, the global message of ASC secretome with a strong contribution of highly secreted TIMP1, TIMP2, PLG and CTSS or miR-24-3p, miR-222-3p and miR-193b-3p supports the protective and postulated pro-regenerative effects observed in the clinical experience and could be potential therapeutic candidates in organ/tissue healing.

4. Materials and Methods

4.1. Ethics Statement

The research was performed at IRCCS Istituto Ortopedico Galeazzi under Institutional Review Board approval (San Raffaele Hospital Ethics Committee approval in date 8 March 2018, registered under number 6/int/2018). Specimens were collected after obtainment of patient informed consent (CI_REGAIN_adulto_v2) and following the 1964 Helsinki declaration and its later amendments or comparable ethical standards.

4.2. Adipose-Derived Mesenchymal Stem Cell (ASCs) Isolation and Expansion

Adipose waste material from four female donors (ASC 1—57 yo, ASC 2—45 yo, ASC 3—54 yo and ASC 4—61 yo) undergoing liposuction was collected. Tissue was digested with type I collagenase (0.075% w/v, 30 min at 37 °C) (Worthington Biochemical Co, Lakewood, NJ, USA), filtered through a 100 μm cell strainer and centrifuged (1000 × g, 5 min). Pellets were suspended in DMEM + 10% FBS (GE Healthcare, Piscataway, NJ, USA) and penicillin-streptomycin (Life Technology, Carlsbad, CA, USA) and seeded at 5 × 10³ cells/cm2 in. Cells were cultured at 37 °C, 5% CO2 and 95% humidity and analyzed at passage 5 at 90% confluence after five times washed with PBS and eventual addition of FBS-free DMEM for 48 h. Inflammation was performed supplementing FBS-free DMEM with TNFα (5 pg/mL) + IL1β (10 pg/mL) + IFNγ (40 pg/mL) (Peprotech, London, UK), concentrations obtained calculating the median values from [32,33,34,35,36,37,38,39,40]. Conditioned medium (secretome) was collected and centrifuged at 1000× g for 15 min at 4 °C, 2000× g for 15 min at 4 °C and twice at 4000× g for 15 min at 4°C. Clarified supernatant was split and used for EVs analysis and ELISA assays. At time of supernatant collection, cells were detached, counted and viability assessed with Tali image-based cytometer (Thermo Fisher Scientific, Waltham, MA, USA).

4.3. ASCs Flow Cytometry Characterization

Flow cytometry was used to score positive or negative MSC (CD44-PE Vio770 clone REA690, CD73-PE clone REA804 and CD90-FITC clone REA897) or hemato/endothelial (CD34-FITC clone AC136, CD31-PerCp Vio700 clone REA730 and CD45-PE Vio770 clone REA747) (Miltenyi Biotec, Bergisch Gladbach, Germany) markers with a CytoFLEX flow cytometer (Beckman Coulter, Fullerton, CA, USA) collecting a minimum of 10,000 events. Doublets and cell aggregates were removed from analysis gating events on FSC-A and FSC-H plots.

4.4. ELISA Assays

Concentrations of 200 soluble cytokines, chemokines, receptors and inflammatory and growth factors were determined by Quantibody® Human Cytokine Array 4000 Kit (https://www.raybiotech.com/quantibody-human-cytokine-array-4000/) in the ASC secretomes after, according to the manufacturers’ instructions (RayBiotech, Norcross, GA, USA). Dilutions (1:2) allowed to have absorbance readings within the standard curve values. The amount of each factor in pg/mL was converted into pg/million cells by multiplying the original value for the total volume in ml and, finally, diving by the total number of cells. Values are shown as million cells normalized pg and mean values ± SD calculated.

4.5. EVs Isolation and Characterization

Five milliliters of clarified secretomes were 1:2 diluted with PBS and centrifuged at 100,000× g for 9 h at 4 °C in a 70Ti rotor (Beckman Coulter, Fullerton, CA, USA), and EV pellets were processed as follows:
(i)
Flow cytometry: Before ultracentrifugation, secretomes were additioned with 10 µM CFSE (Sigma-Aldrich) and incubated for 1 h at 37 °C. After ultracentrifugation, as previously described, labelled EVs were suspended in 50 µl PBS per 5 mL of processed medium. Particles were 1:10,000 diluted in PBS and 100 µl stained with anti-5 μL CD9-APC clone HI9a, anti-CD63-APC clone H5C6 and CD81-APC clone 5A6 (Biolegend, San Diego, CA, USA) for 30 min at 4 °C in the dark. Antibodies were used individually. Events collection was performed with a CytoFLEX flow cytometer collecting a minimum of 30,000 events. A reference bead mix (Biocytex, Marseille, France) composed of a FITC fluorescent mixture of spheres (100 nm, 300 nm, 500 nm and 900 nm) was used to set up the flow cytometer. Gains were: FSC = 106, SSC = 61, FITC = 272, PE = 116 and PC7 = 371. FITC threshold was set at 500 to include 100 nm beads and some smaller debris in the FITC channel.
(ii)
Transmission electron microscopy: Five microliters of PBS-suspended EVs were absorbed on Formvar carbon-coated grids for 10 min. Filter paper was used to blot drops. Negative stain was performed with 2% uranyl acetate aqueous suspension for 10 min, and excess was removed by filter paper before drying the grid at RT. Samples were examined with a TALOS L120C transmission electron microscope (Thermo Fisher Scientific, Waltham, MA, USA) at 120 kV.
(iii)
Nanoparticle tracking analysis (NTA): Purified EVs in PBS (1:100 diluted) were visualized by Nanosight LM10-HS system (NanoSight Ltd., Amesbury, UK). Three recordings of 30 s were performed for each sample. NTA software was used to analyze the data and provided both the concentration measurements and the high-resolution particle size distribution profiles.

4.6. Screening of EV-Embedded miRNA Expression

After ultracentrifugation, Trizol was used to dissolve EV pellets, and miRNeasy Kit and RNeasy CleanUp Kit were used sequentially to obtain RNA enriched in small molecules < 200 nt (Qiagen, Hilden, Germany). During extraction, 6 pg of a nonhuman synthetic miRNA (arabidopsis thaliana ath-miR-159a) were added to each sample as a spike-in to monitor the technical variability during both the isolation and the following reactions. The spike-in was further used to equalize A and B panels of the OpenArray® platform (Life Technologies). Briefly, cDNAs were prepared by standard reverse transcription (RT), and preamplification was performed with A and B independent kits, followed by real-time RT-PCR analysis with the QuantStudio™ 12 K Flex OpenArray® Platform (QS12KFlex), as previously described [107]. To process miRNA expression data from the A and B miRNA panels, together covering 754 human miRNA sequences from the Sanger miRBase v21 Gene, the Expression Suite Software (Life Technologies) was used. CRT of 28 was considered as a burden for the absence or presence of amplification. The global mean was selected as a normalization method [108] and was calculated from miRNAs positively amplified in all samples. Normalized miRNA expression was determined using the relative quantification 2−ΔCRT. Values are shown as normalized Ct and mean values ± SD calculated.

4.7. Pathway Analysis

Identification of functional annotations:
(i)
Protein: Secretome-identified factors were subjected to functional enrichment analysis to provide insight into the functional associations of these protein subsets. The analysis was performed using Gorilla tool (http://cbl-gorilla.cs.technion.ac.il/) with two unranked lists of genes (target and background lists) running mode and 200 factors of the ELISA array as background [109,110]. The list of proteins was also submitted to the PANTHER web interface (http://www.pantherdb.org/) to identify proteins belonging to the same functional classifications, following default settings [111].
(ii)
miRNA: The predicted miRNA targets were annotated into functional BP using the microRNA Target Filter tool in ingenuity pathway analysis (IPA; Ingenuity® Systems, http://www.ingenuity.com). Filters were: confidence “experimentally observed”, with all sources available in the IPA database (TarBase, miRecords, TargetScan Human and Ingenuity Expert Findings). To obtain the list of all experimentally validated mRNA targets, no disease filter was set.

4.8. Hierarchical Clustering

Heat map plots were generated, scoring factors or miRNAs with ClustVis package (https://biit.cs.ut.ee/clustvis/) [112]. Clustering options were: distance for rows—correlation, method for rows—average and tree ordering for rows—tightest cluster first. Log2 [(pg) factors per 106 cells] or miRNA CRT after normalization values were used.

4.9. Statistical Analyses

In each experiment, four independent ASCs were analyzed. Only proteins or miRNAs present and quantified in all conditions were considered as positively identified. GraphPad Prism software (GraphPad, San Diego, CA, USA) was used for statistical analysis. Kolmogorov–Smirnov normality test assayed normal data distribution. Grubbs’ test identified outliers. The level of significance was set with a minimum p-value < 0.05. Data was presented as mean ± SD (Appendix A).

5. Conclusions

Secreted factors and EV-embedded miRNAs may explain the promising results observed for both expanded ASCs and ASC-enriched products as SVF or MFAT. Both molecules and miRNAs may profoundly alter cartilage homeostasis and macrophage polarization, supporting the protective and pro-regenerative effects observed in the clinical experience. We think that this report shed light on some mechanisms that mesenchymal stem cells, alone or in their niche, activate to heal a diseased joint. Future studies will be needed, especially under the light of new transcriptomes being daily released for the other cellular players, as the identification of the targets appeared as a mandatory sieve to deeply understand cellular and molecular interactions.

Supplementary Materials

Supplementary materials can be found at https://www.mdpi.com/1422-0067/21/5/1582/s1.

Author Contributions

Conceptualization, E.R. and C.P.O.; methodology, E.R. and C.P.O.; validation, P.D.L. and M.V.; formal analysis, E.R. and A.C.; investigation, E.R. and C.P.O.; data curation, M.V.; writing—original draft preparation, E.R.; writing—review and editing, L.d.G.; supervision, L.d.G. and funding acquisition, L.d.G. All authors have read and agreed to the published version of the manuscript.

Funding

This work was supported by the Italian Ministry of Health, “Ricerca Corrente”.

Acknowledgments

Authors wish to thank Salvatore Criniti and Gaia Lugano for data management and Giuseppe Banfi for useful discussions.

Conflicts of Interest

The authors declare no conflicts of interest.

Abbreviations

OAOsteoarthritis
MSCMesenchymal Stem Cells
EVExtracellular Vesicles
miRNAMicroRNA
HAHyaluronic Acid
ECMExtracellular Matrix
GOGene Ontology
BPBiological Process

Appendix A

Raw data can be found at OSF Repository, https://osf.io/kjgxq/.

References

  1. Martel-Pelletier, J.; Barr, A.J.; Cicuttini, F.M.; Conaghan, P.G.; Cooper, C.; Goldring, M.B.; Goldring, S.R.; Jones, G.; Teichtahl, A.J.; Pelletier, J.P. Osteoarthritis. Nat. Rev. Dis. Primers 2016, 2, 16072. [Google Scholar] [CrossRef] [Green Version]
  2. Fu, K.; Robbins, S.R.; McDougall, J.J. Osteoarthritis: The genesis of pain. Rheumatology 2018, 57, iv43–iv50. [Google Scholar] [CrossRef] [Green Version]
  3. Loeser, R.F.; Collins, J.A.; Diekman, B.O. Ageing and the pathogenesis of osteoarthritis. Nat. Rev. Rheumatol. 2016, 12, 412–420. [Google Scholar] [CrossRef] [PubMed] [Green Version]
  4. Nelson, A.E.; Allen, K.D.; Golightly, Y.M.; Goode, A.P.; Jordan, J.M. A systematic review of recommendations and guidelines for the management of osteoarthritis: The chronic osteoarthritis management initiative of the US bone and joint initiative. Semin. Arthritis Rheum. 2014, 43, 701–712. [Google Scholar] [CrossRef] [PubMed]
  5. Ferket, B.S.; Feldman, Z.; Zhou, J.; Oei, E.H.; Bierma-Zeinstra, S.M.; Mazumdar, M. Impact of total knee replacement practice: Cost effectiveness analysis of data from the Osteoarthritis Initiative. BMJ 2017, 356, j1131. [Google Scholar] [CrossRef] [PubMed] [Green Version]
  6. Bruyère, O.; Honvo, G.; Veronese, N.; Arden, N.K.; Branco, J.; Curtis, E.M.; Al-Daghri, N.M.; Herrero-Beaumont, G.; Martel-Pelletier, J.; Pelletier, J.P.; et al. An updated algorithm recommendation for the management of knee osteoarthritis from the European Society for Clinical and Economic Aspects of Osteoporosis, Osteoarthritis and Musculoskeletal Diseases (ESCEO). Semin. Arthritis Rheum. 2019, 49, 337–350. [Google Scholar] [CrossRef] [PubMed]
  7. Skou, S.T.; Roos, E.M.; Laursen, M.B.; Rathleff, M.S.; Arendt-Nielsen, L.; Simonsen, O.; Rasmussen, S. A Randomized, Controlled Trial of Total Knee Replacement. N. Engl. J. Med. 2015, 373, 1597–1606. [Google Scholar] [CrossRef]
  8. Wylde, V.; Hewlett, S.; Learmonth, I.D.; Dieppe, P. Persistent pain after joint replacement: Prevalence, sensory qualities, and postoperative determinants. Pain 2011, 152, 566–572. [Google Scholar] [CrossRef]
  9. Crisan, M.; Yap, S.; Casteilla, L.; Chen, C.W.; Corselli, M.; Park, T.S.; Andriolo, G.; Sun, B.; Zheng, B.; Zhang, L.; et al. A perivascular origin for mesenchymal stem cells in multiple human organs. Cell Stem Cell 2008, 3, 301–313. [Google Scholar] [CrossRef] [Green Version]
  10. Manferdini, C.; Paolella, F.; Gabusi, E.; Gambari, L.; Piacentini, A.; Filardo, G.; Fleury-Cappellesso, S.; Barbero, A.; Murphy, M.; Lisignoli, G. Adipose stromal cells mediated switching of the pro-inflammatory profile of M1-like macrophages is facilitated by PGE2: In vitro evaluation. Osteoarthr. Cartil. 2017, 25, 1161–1171. [Google Scholar] [CrossRef] [Green Version]
  11. Ryan, A.; Murphy, M.; Barry, F. Mesenchymal stem/stromal cell therapy. In The Biology and Therapeutic Application of Mesenchymal Cells; Atkinson, K., Ed.; Wiley-Blackwell: Hoboken, NJ, USA, 2017; pp. 426–440. [Google Scholar]
  12. Meisel, R.; Zibert, A.; Laryea, M.; Göbel, U.; Däubener, W.; Dilloo, D. Human bone marrow stromal cells inhibit allogeneic T-cell responses by indoleamine 2,3-dioxygenase-mediated tryptophan degradation. Blood 2004, 103, 4619–4621. [Google Scholar] [CrossRef] [PubMed] [Green Version]
  13. Ge, W.; Jiang, J.; Arp, J.; Liu, W.; Garcia, B.; Wang, H. Regulatory T-cell generation and kidney allograft tolerance induced by mesenchymal stem cells associated with indoleamine 2,3-dioxygenase expression. Transplantation 2010, 90, 1312–1320. [Google Scholar] [CrossRef] [PubMed]
  14. Shi, Y.; Wang, Y.; Li, Q.; Liu, K.; Hou, J.; Shao, C.; Wang, Y. Immunoregulatory mechanisms of mesenchymal stem and stromal cells in inflammatory diseases. Nat. Rev. Nephrol. 2018, 14, 493–507. [Google Scholar] [CrossRef] [PubMed]
  15. Khatab, S.; van Osch, G.J.; Kops, N.; Bastiaansen-Jenniskens, Y.M.; Bos, P.K.; Verhaar, J.A.; Bernsen, M.R.; van Buul, G.M. Mesenchymal stem cell secretome reduces pain and prevents cartilage damage in a murine osteoarthritis model. Eur. Cells Mater. 2018, 36, 218–230. [Google Scholar] [CrossRef] [PubMed]
  16. Chen, Y.; Chang, Y.W.; Tan, K.P.; Shen, Y.S.; Wang, Y.H.; Chang, C.H. Can mesenchymal stem cells and their conditioned medium assist inflammatory chondrocytes recovery? PLoS ONE 2018, 13, e0205563. [Google Scholar] [CrossRef] [PubMed]
  17. Van Buul, G.M.; Villafuertes, E.; Bos, P.K.; Waarsing, J.H.; Kops, N.; Narcisi, R.; Weinans, H.; Verhaar, J.A.; Bernsen, M.R.; Van Osch, G.J. Mesenchymal stem cells secrete factors that inhibit inflammatory processes in short-term osteoarthritic synovium and cartilage explant culture. Osteoarthr. Cartil. 2012, 20, 1186–1196. [Google Scholar] [CrossRef] [Green Version]
  18. Baker, K.; Grainger, A.; Niu, J.; Clancy, M.; Guermazi, A.; Crema, M.; Hughes, L.; Buckwalter, J.; Wooley, A.; Nevitt, M.; et al. Relation of synovitis to knee pain using contrast-enhanced MRIs. Ann. Rheum. Dis. 2010, 69, 1779–1783. [Google Scholar] [CrossRef] [Green Version]
  19. Mathiessen, A.; Conaghan, P.G. Synovitis in osteoarthritis: Current understanding with therapeutic implications. Arthritis Res. Ther. 2017, 19, 18. [Google Scholar] [CrossRef] [Green Version]
  20. Benito, M.J.; Veale, D.J.; FitzGerald, O.; van den Berg, W.B.; Bresnihan, B. Synovial tissue inflammation in early and late osteoarthritis. Ann. Rheum. Dis. 2005, 64, 1263–1267. [Google Scholar] [CrossRef] [Green Version]
  21. Ferguson, S.W.; Wang, J.; Lee, C.J.; Liu, M.; Neelamegham, S.; Canty, J.M.; Nguyen, J. The microRNA regulatory landscape of MSC-derived exosomes: A systems view. Sci. Rep. 2018, 8, 1419. [Google Scholar] [CrossRef]
  22. Nawaz, M.; Fatima, F.; Vallabhaneni, K.C.; Penfornis, P.; Valadi, H.; Ekström, K.; Kholia, S.; Whitt, J.D.; Fernandes, J.D.; Pochampally, R.; et al. Extracellular Vesicles: Evolving Factors in Stem Cell Biology. Stem Cells Int. 2016, 2016, 1073140. [Google Scholar] [CrossRef] [PubMed] [Green Version]
  23. Vonk, L.A.; van Dooremalen, S.F.J.; Liv, N.; Klumperman, J.; Coffer, P.J.; Saris, D.B.F.; Lorenowicz, M.J. Mesenchymal Stromal/stem Cell-derived Extracellular Vesicles Promote Human Cartilage Regeneration In Vitro. Theranostics 2018, 8, 906–920. [Google Scholar] [CrossRef] [PubMed]
  24. Ragni, E.; Perucca Orfei, C.; De Luca, P.; Lugano, G.; Viganò, M.; Colombini, A.; Valli, F.; Zacchetti, D.; Bollati, V.; de Girolamo, L. Interaction with hyaluronan matrix and miRNA cargo as contributors for in vitro potential of mesenchymal stem cell-derived extracellular vesicles in a model of human osteoarthritic synoviocytes. Stem Cell Res. Ther. 2019, 10, 109. [Google Scholar] [CrossRef]
  25. Tao, S.C.; Yuan, T.; Zhang, Y.L.; Yin, W.J.; Guo, S.C.; Zhang, C.Q. Exosomes derived from miR-140-5p-overexpressing human synovial mesenchymal stem cells enhance cartilage tissue regeneration and prevent osteoarthritis of the knee in a rat model. Theranostics 2017, 7, 180–195. [Google Scholar] [CrossRef]
  26. Zhu, Y.; Wang, Y.; Zhao, B.; Niu, X.; Hu, B.; Li, Q.; Zhang, J.; Ding, J.; Chen, Y.; Wang, Y. Comparison of exosomes secreted by induced pluripotent stem cell-derived mesenchymal stem cells and synovial membrane-derived mesenchymal stem cells for the treatment of osteoarthritis. Stem Cell Res. Ther. 2017, 8, 64. [Google Scholar] [CrossRef] [PubMed] [Green Version]
  27. Cosenza, S.; Ruiz, M.; Toupet, K.; Jorgensen, C.; Noël, D. Mesenchymal stem cells derived exosomes and microparticles protect cartilage and bone from degradation in osteoarthritis. Sci. Rep. 2017, 7, 16214. [Google Scholar] [CrossRef] [PubMed]
  28. Wu, J.; Kuang, L.; Chen, C.; Yang, J.; Zeng, W.N.; Li, T.; Chen, H.; Huang, S.; Fu, Z.; Li, J.; et al. miR-100-5p-abundant exosomes derived from infrapatellar fat pad MSCs protect articular cartilage and ameliorate gait abnormalities via inhibition of mTOR in osteoarthritis. Biomaterials 2019, 206, 87–100. [Google Scholar] [CrossRef] [PubMed]
  29. Zavatti, M.; Beretti, F.; Casciaro, F.; Bertucci, E.; Maraldi, T. Comparison of the therapeutic effect of amniotic fluid stem cells and their exosomes on monoiodoacetate-induced animal model of osteoarthritis. Biofactors 2019. [Google Scholar] [CrossRef] [PubMed]
  30. Seo, Y.; Kim, H.S.; Hong, I.S. Stem Cell-Derived Extracellular Vesicles as Immunomodulatory Therapeutics. Stem Cells Int. 2019, 2019, 5126156. [Google Scholar] [CrossRef]
  31. Sun, M.; Sun, L.; Huang, C.; Chen, B.C.; Zhou, Z. Induction of Macrophage M2b/c Polarization by Adipose Tissue-Derived Mesenchymal Stem Cells. J. Immunol. Res. 2019, 2019, 7059680. [Google Scholar] [CrossRef] [Green Version]
  32. Paolella, F.; Manferdini, C.; Gabusi, E.; Gambari, L.; Filardo, G.; Kon, E.; Mariani, E.; Lisignoli, G. Effect of microfragmented adipose tissue on osteoarthritic synovial macrophage factors. J. Cell Physiol. 2019, 234, 5044–5055. [Google Scholar] [CrossRef] [PubMed]
  33. Kahle, P.; Saal, J.G.; Schaudt, K.; Zacher, J.; Fritz, P.; Pawelec, G. Determination of cytokines in synovial fluids: Correlation with diagnosis and histomorphological characteristics of synovial tissue. Ann. Rheum. Dis. 1992, 51, 731–734. [Google Scholar] [CrossRef] [PubMed] [Green Version]
  34. Westacott, C.I.; Whicher, J.T.; Barnes, I.C.; Thompson, D.; Swan, A.J.; Dieppe, P.A. Synovial fluid concentration of five different cytokines in rheumatic diseases. Ann. Rheum. Dis. 1990, 49, 676–681. [Google Scholar] [CrossRef] [PubMed] [Green Version]
  35. Tsuchida, A.I.; Beekhuizen, M.; Ct Hart, M.; Radstake, T.R.; Dhert, W.J.; Saris, D.B.; van Osch, G.J.; Creemers, L.B. Cytokine profiles in the joint depend on pathology, but are different between synovial fluid, cartilage tissue and cultured chondrocytes. Arthritis Res. Ther. 2014, 16, 441. [Google Scholar] [CrossRef] [Green Version]
  36. Mabey, T.; Honsawek, S.; Tanavalee, A.; Yuktanandana, P.; Wilairatana, V.; Poovorawan, Y. Plasma and synovial fluid inflammatory cytokine profiles in primary knee osteoarthritis. Biomarkers 2016, 21, 639–644. [Google Scholar] [CrossRef]
  37. Siqueira, M.B.; Frangiamore, S.; Klika, A.K.; Gajewski, N.; Barsoum, W.K.; Higuera, C.A. Comparison of Synovial Fluid Cytokine Levels between Traumatic Knee Injury and End-Stage Osteoarthritis. J. Knee Surg. 2017, 30, 128–133. [Google Scholar] [CrossRef]
  38. Vangsness, C.T., Jr.; Burke, W.S.; Narvy, S.J.; MacPhee, R.D.; Fedenko, A.N. Human knee synovial fluid cytokines correlated with grade of knee osteoarthritis—A pilot study. Bull. NYU Hosp. Jt. Dis. 2011, 69, 122–127. [Google Scholar]
  39. Orita, S.; Koshi, T.; Mitsuka, T.; Miyagi, M.; Inoue, G.; Arai, G.; Ishikawa, T.; Hanaoka, E.; Yamashita, K.; Yamashita, M.; et al. Associations between proinflammatory cytokines in the synovial fluid and radiographic grading and pain-related scores in 47 consecutive patients with osteoarthritis of the knee. BMC Musculoskelet. Disord. 2011, 12, 144. [Google Scholar] [CrossRef] [Green Version]
  40. Kokebie, R.; Aggarwal, R.; Lidder, S.; Hakimiyan, A.A.; Rueger, D.C.; Block, J.A.; Chubinskaya, S. The role of synovial fluid markers of catabolism and anabolism in osteoarthritis, rheumatoid arthritis and asymptomatic organ donors. Arthritis Res. Ther. 2011, 13, R50. [Google Scholar] [CrossRef] [Green Version]
  41. Scanzello, C.R.; Umoh, E.; Pessler, F.; Diaz-Torne, C.; Miles, T.; Dicarlo, E.; Potter, H.G.; Mandl, L.; Marx, R.; Rodeo, S.; et al. Local cytokine profiles in knee osteoarthritis: Elevated synovial fluid interleukin-15 differentiates early from end-stage disease. Osteoarthr. Cartil. 2009, 17, 1040–1048. [Google Scholar] [CrossRef] [Green Version]
  42. Toh, W.S.; Lai, R.C.; Zhang, B.; Lim, S.K. MSC exosome works through a protein-based mechanism of action. Biochem. Soc. Trans. 2018, 46, 843–853. [Google Scholar] [CrossRef] [PubMed] [Green Version]
  43. Chevillet, J.R.; Kang, Q.; Ruf, I.K.; Briggs, H.A.; Vojtech, L.N.; Hughes, S.M.; Cheng, H.H.; Arroyo, J.D.; Meredith, E.K.; Gallichotte, E.N.; et al. Quantitative and stoichiometric analysis of the microRNA content of exosomes. Proc. Natl. Acad. Sci. USA 2014, 111, 14888–14893. [Google Scholar] [CrossRef] [PubMed] [Green Version]
  44. Fisch, K.M.; Gamini, R.; Alvarez-Garcia, O.; Akagi, R.; Saito, M.; Muramatsu, Y.; Sasho, T.; Koziol, J.A.; Su, A.I.; Lotz, M.K. Identification of transcription factors responsible for dysregulated networks in human osteoarthritis cartilage by global gene expression analysis. Osteoarthr. Cartil. 2018, 26, 1531–1538. [Google Scholar] [CrossRef] [PubMed] [Green Version]
  45. Endisha, H.; Rockel, J.; Jurisica, I.; Kapoor, M. The complex landscape of microRNAs in articular cartilage: Biology, pathology, and therapeutic targets. JCI Insight 2018, 3, e121630. [Google Scholar] [CrossRef] [Green Version]
  46. Wood, M.J.; Leckenby, A.; Reynolds, G.; Spiering, R.; Pratt, A.G.; Rankin, K.S.; Isaacs, J.D.; Haniffa, M.A.; Milling, S.; Hilkens, C.M. Macrophage proliferation distinguishes 2 subgroups of knee osteoarthritis patients. JCI Insight 2019, 4, e125325. [Google Scholar] [CrossRef] [Green Version]
  47. Mandelin, A.M.; Homan, P.J.; Shaffer, A.M.; Cuda, C.M.; Dominguez, S.T.; Bacalao, E.; Carns, M.; Hinchcliff, M.; Lee, J.; Aren, K.; et al. Transcriptional Profiling of Synovial Macrophages Using Minimally Invasive Ultrasound-Guided Synovial Biopsies in Rheumatoid Arthritis. Arthritis Rheumatol. 2018, 70, 841–854. [Google Scholar] [CrossRef]
  48. Xu, S.J.; Hu, H.T.; Li, H.L.; Chang, S. The Role of miRNAs in Immune Cell Development, Immune Cell Activation, and Tumor Immunity: With a Focus on Macrophages and Natural Killer Cells. Cells 2019, 8, 1140. [Google Scholar] [CrossRef] [Green Version]
  49. Kitade, H.; Sawamoto, K.; Nagashimada, M.; Inoue, H.; Yamamoto, Y.; Sai, Y.; Takamura, T.; Yamamoto, H.; Miyamoto, K.; Ginsberg, H.N.; et al. CCR5 plays a critical role in obesity-induced adipose tissue inflammation and insulin resistance by regulating both macrophage recruitment and M1/M2 status. Diabetes 2012, 61, 1680–1690. [Google Scholar] [CrossRef] [Green Version]
  50. Toh, W.S.; Lai, R.C.; Hui, J.H.P.; Lim, S.K. MSC exosome as a cell-free MSC therapy for cartilage regeneration: Implications for osteoarthritis treatment. Semin. Cell Dev. Biol. 2017, 67, 56–64. [Google Scholar] [CrossRef]
  51. Liu, Y.; Ma, Y.; Zhang, J.; Yuan, Y.; Wang, J. Exosomes: A Novel Therapeutic Agent for Cartilage and Bone Tissue Regeneration. Dose Response 2019, 17, 1559325819892702. [Google Scholar] [CrossRef]
  52. Wang, Y.; Yu, D.; Liu, Z.; Zhou, F.; Dai, J.; Wu, B.; Zhou, J.; Heng, B.C.; Zou, X.H.; Ouyang, H.; et al. Exosomes from embryonic mesenchymal stem cells alleviate osteoarthritis through balancing synthesis and degradation of cartilage extracellular matrix. Stem Cell Res. Ther. 2017, 8, 189. [Google Scholar] [CrossRef] [PubMed] [Green Version]
  53. Nawaz, M.; Shah, N.; Zanetti, B.R.; Maugeri, M.; Silvestre, R.N.; Fatima, F.; Neder, L.; Valadi, H. Extracellular Vesicles and Matrix Remodeling Enzymes: The Emerging Roles in Extracellular Matrix Remodeling, Progression of Diseases and Tissue Repair. Cells 2018, 7, 167. [Google Scholar] [CrossRef] [PubMed] [Green Version]
  54. Jo, C.H.; Lee, Y.G.; Shin, W.H.; Kim, H.; Chai, J.W.; Jeong, E.C.; Kim, J.E.; Shim, H.; Shin, J.S.; Shin, I.S.; et al. Intra-articular injection of mesenchymal stem cells for the treatment of osteoarthritis of the knee: A proof-of-concept clinical trial. Stem Cells 2014, 32, 1254–1266. [Google Scholar] [CrossRef] [PubMed]
  55. Pers, Y.M.; Rackwitz, L.; Ferreira, R.; Pullig, O.; Delfour, C.; Barry, F.; Sensebe, L.; Casteilla, L.; Fleury, S.; Bourin, P.; et al. ADIPOA Consortium. Adipose Mesenchymal Stromal Cell-Based Therapy for Severe Osteoarthritis of the Knee: A Phase I Dose-Escalation Trial. Stem Cells Transl. Med. 2016, 5, 847–856. [Google Scholar] [CrossRef] [Green Version]
  56. Di Matteo, B.; Vandenbulcke, F.; Vitale, N.D.; Iacono, F.; Ashmore, K.; Marcacci, M.; Kon, E. Minimally Manipulated Mesenchymal Stem Cells for the Treatment of Knee Osteoarthritis: A Systematic Review of Clinical Evidence. Stem Cells Int. 2019, 2019, 1735242. [Google Scholar] [CrossRef] [Green Version]
  57. Nava, S.; Sordi, V.; Pascucci, L.; Tremolada, C.; Ciusani, E.; Zeira, O.; Cadei, M.; Soldati, G.; Pessina, A.; Parati, E.; et al. Long-Lasting Anti-Inflammatory Activity of Human Microfragmented Adipose Tissue. Stem Cells Int. 2019, 2019, 5901479. [Google Scholar] [CrossRef]
  58. Mancuso, P.; Raman, S.; Glynn, A.; Barry, F.; Murphy, J.M. Mesenchymal Stem Cell Therapy for Osteoarthritis: The Critical Role of the Cell Secretome. Front. Bioeng. Biotechnol. 2019, 7, 9. [Google Scholar] [CrossRef] [Green Version]
  59. D’Arrigo, D.; Roffi, A.; Cucchiarini, M.; Moretti, M.; Candrian, C.; Filardo, G. Secretome and Extracellular Vesicles as New Biological Therapies for Knee Osteoarthritis: A Systematic Review. J. Clin. Med. 2019, 8, 1867. [Google Scholar] [CrossRef] [Green Version]
  60. Castañeda, S.; Vicente, E.F. Osteoarthritis: More than Cartilage Degeneration. Clin. Rev. Bone Miner. Metab. 2017, 15, 69–81. [Google Scholar] [CrossRef]
  61. Borić, I.; Hudetz, D.; Rod, E.; Jeleč, Ž.; Vrdoljak, T.; Skelin, A.; Polašek, O.; Plečko, M.; Trbojević-Akmačić, I.; Lauc, G.; et al. A 24-Month Follow-Up Study of the Effect of Intra-Articular Injection of Autologous Microfragmented Fat Tissue on Proteoglycan Synthesis in Patients with Knee Osteoarthritis. Genes 2019, 10, 1051. [Google Scholar] [CrossRef] [Green Version]
  62. Bansal, H.; Comella, K.; Leon, J.; Verma, P.; Agrawal, D.; Koka, P.; Ichim, T. Intra-articular injection in the knee of adipose derived stromal cells (stromal vascular fraction) and platelet rich plasma for osteoarthritis. J. Transl. Med. 2017, 15, 141. [Google Scholar] [CrossRef] [Green Version]
  63. Pham, P.V.; Bui, K.H.-T.; Duong, T.D.; Nguyen, N.T.; Nguyen, T.D.; Le, V.T.; Mai, V.T.; Phan, N.L.-C.; Le, D.M.; Ngoc, N.M. Symptomatic knee osteoarthritis treatment using autologous adipose derived stem cells and platelet-rich plasma: A clinical study. Biomed. Res. Ther. 2014, 1, 2. [Google Scholar] [CrossRef]
  64. Hong, Z.; Chen, J.; Zhang, S.; Zhao, C.; Bi, M.; Chen, X.; Bi, Q. Intra-articular injection of autologous adipose-derived stromal vascular fractions for knee osteoarthritis: A double-blind randomized self-controlled trial. Int. Orthop. 2019, 43, 1123–1134. [Google Scholar] [CrossRef] [PubMed]
  65. Koh, Y.G.; Jo, S.B.; Kwon, O.R.; Suh, D.S.; Lee, S.W.; Park, S.H.; Choi, Y.J. Mesenchymal stem cell injections improve symptoms of knee osteoarthritis. Arthroscopy 2013, 29, 748–755. [Google Scholar] [CrossRef] [PubMed]
  66. Song, Y.; Du, H.; Dai, C.; Zhang, L.; Li, S.; Hunter, D.J.; Lu, L.; Bao, C. Human adipose-derived mesenchymal stem cells for osteoarthritis: A pilot study with long-term follow-up and repeated injections. Regen. Med. 2018, 13, 295–307. [Google Scholar] [CrossRef] [PubMed]
  67. Jo, C.H.; Chai, J.W.; Jeong, E.C.; Oh, S.; Shin, J.S.; Shim, H.; Yoon, K.S. Intra-articular Injection of Mesenchymal Stem Cells for the Treatment of Osteoarthritis of the Knee: A 2-Year Follow-up Study. Am. J. Sports Med. 2017, 45, 2774–2783. [Google Scholar] [CrossRef] [PubMed]
  68. Dean, D.D.; Martel-Pelletier, J.; Pelletier, J.P.; Howell, D.S.; Woessner, J.F., Jr. Evidence for metalloproteinase and metalloproteinase inhibitor imbalance in human osteoarthritic cartilage. J. Clin. Investig. 1989, 84, 678–685. [Google Scholar] [CrossRef] [Green Version]
  69. Clements, D.N.; Fitzpatrick, N.; Carter, S.D.; Day, P.J. Cartilage gene expression correlates with radiographic severity of canine elbow osteoarthritis. Vet. J. 2009, 179, 211–218. [Google Scholar] [CrossRef]
  70. Alam, M.R.; Ji, J.R.; Kim, M.S.; Kim, N.S. Biomarkers for identifying the early phases of osteoarthritis secondary to medial patellar luxation in dogs. J. Vet. Sci. 2011, 12, 273–280. [Google Scholar] [CrossRef] [Green Version]
  71. Mi, M.; Shi, S.; Li, T.; Holz, J.; Lee, Y.J.; Sheu, T.J.; Liao, Q.; Xiao, T. TIMP2 deficient mice develop accelerated osteoarthritis via promotion of angiogenesis upon destabilization of the medial meniscus. Biochem. Biophys. Res. Commun. 2012, 423, 366–372. [Google Scholar] [CrossRef]
  72. Yamada, J.; Tsuji, K.; Miyatake, K.; Matsukura, Y.; Abula, K.; Inoue, M.; Sekiya, I.; Muneta, T. Follistatin alleviates synovitis and articular cartilage degeneration induced by carrageenan. Int. J. Inflam. 2014, 2014, 959271. [Google Scholar] [CrossRef]
  73. Li, J.; Ny, A.; Leonardsson, G.; Nandakumar, K.S.; Holmdahl, R.; Ny, T. The plasminogen activator/plasmin system is essential for development of the joint inflammatory phase of collagen type II-induced arthritis. Am. J. Pathol. 2005, 166, 783–792. [Google Scholar] [CrossRef] [Green Version]
  74. Blanco Garcia, F.J. Catabolic events in osteoarthritic cartilage. Osteoarthr. Cartil. 1999, 7, 308–309. [Google Scholar] [CrossRef] [PubMed] [Green Version]
  75. Dreier, R.; Wallace, S.; Fuchs, S.; Bruckner, P.; Grässel, S. Paracrine interactions of chondrocytes and macrophages in cartilage degradation: Articular chondrocytes provide factors that activate macrophage-derived pro-gelatinase B (pro-MMP-9). J. Cell. Sci. 2001, 114, 3813–3822. [Google Scholar] [PubMed]
  76. Alejandre Alcazar, M.A.; Kaschwich, M.; Ertsey, R.; Preuss, S.; Milla, C.; Mujahid, S.; Masumi, J.; Khan, S.; Mokres, L.M.; Tian, L.; et al. Elafin Treatment Rescues EGFR-Klf4 Signaling and Lung Cell Survival in Ventilated Newborn Mice. Am. J. Respir. Cell Mol. Biol. 2018, 59, 623–634. [Google Scholar] [CrossRef]
  77. McQuillan, D.J.; Handley, C.J.; Campbell, M.A.; Bolis, S.; Milway, V.E.; Herington, A.C. Stimulation of proteoglycan biosynthesis by serum and insulin-like growth factor-I in cultured bovine articular cartilage. Biochem. J. 1986, 240, 423–430. [Google Scholar] [CrossRef] [PubMed]
  78. Ekenstedt, K.J.; Sonntag, W.E.; Loeser, R.F.; Lindgren, B.R.; Carlson, C.S. Effects of chronic growth hormone and insulin-like growth factor 1 deficiency on osteoarthritis severity in rat knee joints. Arthritis Rheum. 2006, 54, 3850–3858. [Google Scholar] [CrossRef] [PubMed]
  79. Wei, F.Y.; Lee, J.K.; Wei, L.; Qu, F.; Zhang, J.Z. Correlation of insulin-like growth factor 1 and osteoarthritic cartilage degradation: A spontaneous osteoarthritis in guinea-pig. Eur. Rev. Med. Pharmacol. Sci. 2017, 21, 4493–4500. [Google Scholar]
  80. Hou, W.S.; Li, Z.; Büttner, F.H.; Bartnik, E.; Brömme, D. Cleavage site specificity of cathepsin K toward cartilage proteoglycans and protease complex formation. Biol. Chem. 2003, 384, 891–897. [Google Scholar] [CrossRef]
  81. Oh, H.; Chun, C.H.; Chun, J.S. Dkk-1 expression in chondrocytes inhibits experimental osteoarthritic cartilage destruction in mice. Arthritis Rheum. 2012, 64, 2568–2578. [Google Scholar] [CrossRef]
  82. Weng, L.H.; Wang, C.J.; Ko, J.Y.; Sun, Y.C.; Wang, F.S. Control of Dkk-1 ameliorates chondrocyte apoptosis, cartilage destruction, and subchondral bone deterioration in osteoarthritic knees. Arthritis Rheum. 2010, 62, 1393–1402. [Google Scholar] [CrossRef] [PubMed]
  83. De Santis, M.; Di Matteo, B.; Chisari, E.; Cincinelli, G.; Angele, P.; Lattermann, C.; Filardo, G.; Vitale, N.D.; Selmi, C.; Kon, E. The Role of Wnt Pathway in the Pathogenesis of OA and Its Potential Therapeutic Implications in the Field of Regenerative Medicine. Biomed. Res. Int. 2018, 2018, 7402947. [Google Scholar] [CrossRef] [PubMed] [Green Version]
  84. Vuolteenaho, K.; Koskinen-Kolasa, A.; Laavola, M.; Nieminen, R.; Moilanen, T.; Moilanen, E. High synovial fluid interleukin-6 levels are associated with increased matrix metalloproteinase levels and severe radiographic changes in osteoarthritis patients. Osteoarthr. Cartil. 2017, 25, S92–S93. [Google Scholar] [CrossRef]
  85. Miller, R.E.; Miller, R.J.; Malfait, A.M. Osteoarthritis joint pain: The cytokine connection. Cytokine 2014, 70, 185–193. [Google Scholar] [CrossRef] [Green Version]
  86. Finnson, K.W.; Chi, Y.; Bou-Gharios, G.; Leask, A.; Philip, A. TGF-b signaling in cartilage homeostasis and osteoarthritis. Front. Biosci. 2012, 4, 251–268. [Google Scholar] [CrossRef]
  87. Blaney Davidson, E.N.; Remst, D.F.; Vitters, E.L.; van Beuningen, H.M.; Blom, A.B.; Goumans, M.J.; van den Berg, W.B.; van der Kraan, P.M. Increase in ALK1/ALK5 ratio as a cause for elevated MMP-13 expression in osteoarthritis in humans and mice. J. Immunol. 2009, 182, 7937–7945. [Google Scholar] [CrossRef] [Green Version]
  88. Van Beuningen, H.M.; Glansbeek, H.L.; van der Kraan, P.M.; van den Berg, W.B. Osteoarthritis-like changes in the murine knee joint resulting from intra-articular transforming growth factor-beta injections. Osteoarthr. Cartil. 2000, 8, 25–33. [Google Scholar] [CrossRef] [Green Version]
  89. Kouri, J.B.; Jiménez, S.A.; Quintero, M.; Chico, A. Ultrastructural study of chondrocytes from fibrillated and non-fibrillated human osteoarthritic cartilage. Osteoarthr. Cartil. 1996, 4, 111–125. [Google Scholar] [CrossRef] [Green Version]
  90. Philipot, D.; Guérit, D.; Platano, D.; Chuchana, P.; Olivotto, E.; Espinoza, F.; Dorandeu, A.; Pers, Y.M.; Piette, J.; Borzi, R.M.; et al. p16INK4a and its regulator miR-24 link senescence and chondrocyte terminal differentiation-associated matrix remodeling in osteoarthritis. Arthritis Res. Ther. 2014, 16, R58. [Google Scholar] [CrossRef] [Green Version]
  91. Wu, Y.H.; Liu, W.; Zhang, L.; Liu, X.Y.; Wang, Y.; Xue, B.; Liu, B.; Duan, R.; Zhang, B.; Ji, Y. Effects of microRNA-24 targeting C-myc on apoptosis, proliferation, and cytokine expressions in chondrocytes of rats with osteoarthritis via MAPK signaling pathway. J. Cell. Biochem. 2018, 119, 7944–7958. [Google Scholar] [CrossRef]
  92. Benigni, G.; Dimitrova, P.; Antonangeli, F.; Sanseviero, E.; Milanova, V.; Blom, A.; van Lent, P.; Morrone, S.; Santoni, A.; Bernardini, G. CXCR3/CXCL10 Axis Regulates Neutrophil-NK Cell Cross-Talk Determining the Severity of Experimental Osteoarthritis. J. Immunol. 2017, 198, 2115–2124. [Google Scholar] [CrossRef] [PubMed]
  93. Endres, M.; Andreas, K.; Kalwitz, G.; Freymann, U.; Neumann, K.; Ringe, J.; Sittinger, M.; Häupl, T.; Kaps, C. Chemokine profile of synovial fluid from normal, osteoarthritis and rheumatoid arthritis patients: CCL25, CXCL10 and XCL1 recruit human subchondral mesenchymal progenitor cells. Osteoarthr. Cartil. 2010, 18, 1458–1466. [Google Scholar] [CrossRef] [PubMed] [Green Version]
  94. Ponte, A.L.; Marais, E.; Gallay, N.; Langonné, A.; Delorme, B.; Hérault, O.; Charbord, P.; Domenech, J. The in vitro migration capacity of human bone marrow mesenchymal stem cells: Comparison of chemokine and growth factor chemotactic activities. Stem Cells 2007, 25, 1737–1745. [Google Scholar] [CrossRef] [PubMed]
  95. Ringe, J.; Strassburg, S.; Neumann, K.; Endres, M.; Notter, M.; Burmester, G.R.; Kaps, C.; Sittinger, M. Towards in situ tissue repair: Human mesenchymal stem cells express chemokine receptors CXCR1, CXCR2 and CCR2, and migrate upon stimulation with CXCL8 but not CCL2. J. Cell. Biochem. 2007, 101, 135–146. [Google Scholar] [CrossRef]
  96. Hughes, C.E.; Nibbs, R.J.B. A guide to chemokines and their receptors. FEBS J. 2018, 285, 2944–2971. [Google Scholar] [CrossRef] [PubMed]
  97. Gómez-Aristizábal, A.; Sharma, A.; Bakooshli, M.A.; Kapoor, M.; Gilbert, P.M.; Viswanathan, S.; Gandhi, R. Stage-specific differences in secretory profile of mesenchymal stromal cells (MSCs) subjected to early- vs late-stage OA synovial fluid. Osteoarthr. Cartil. 2017, 25, 737–741. [Google Scholar] [CrossRef] [Green Version]
  98. Sierra-Filardi, E.; Nieto, C.; Domínguez-Soto, A.; Barroso, R.; Sánchez-Mateos, P.; Puig-Kroger, A.; López-Bravo, M.; Joven, J.; Ardavín, C.; Rodríguez-Fernández, J.L.; et al. CCL2 shapes macrophage polarization by GM-CSF and M-CSF: Identification of CCL2/CCR2-dependent gene expression profile. J. Immunol. 2014, 192, 3858–3867. [Google Scholar] [CrossRef] [Green Version]
  99. Cho, D.I.; Kim, M.R.; Jeong, H.Y.; Jeong, H.C.; Jeong, M.H.; Yoon, S.H.; Kim, Y.S.; Ahn, Y. Mesenchymal stem cells reciprocally regulate the M1/M2 balance in mouse bone marrow-derived macrophages. Exp. Mol. Med. 2014, 46, e70. [Google Scholar] [CrossRef]
  100. Zhang, Y.; Grosfeld, E.C.; Camargo, W.A.; Tang, H.; Magri, A.M.P.; van den Beucken, J.J.J.P. Efficacy of intraoperatively prepared cell-based constructs for bone regeneration. Stem Cell Res. Ther. 2018, 9, 283. [Google Scholar] [CrossRef]
  101. Wang, N.; Liang, H.; Zen, K. Molecular mechanisms that influence the macrophage m1-m2 polarization balance. Front. Immunol. 2014, 5, 614. [Google Scholar] [CrossRef] [Green Version]
  102. Self-Fordham, J.B.; Naqvi, A.R.; Uttamani, J.R.; Kulkarni, V.; Nares, S. MicroRNA: Dynamic Regulators of Macrophage Polarization and Plasticity. Front. Immunol. 2017, 8, 1062. [Google Scholar] [CrossRef] [PubMed] [Green Version]
  103. Fordham, J.B.; Naqvi, A.R.; Nares, S. Regulation of miR-24, miR-30b, and miR-142-3p during macrophage and dendritic cell differentiation potentiates innate immunity. J. Leukoc. Biol. 2015, 98, 195–207. [Google Scholar] [CrossRef] [PubMed] [Green Version]
  104. Naqvi, A.R.; Fordham, J.B.; Nares, S. miR-24, miR-30b, and miR-142-3p regulate phagocytosis in myeloid inflammatory cells. J. Immunol. 2015, 194, 1916–1927. [Google Scholar] [CrossRef] [PubMed] [Green Version]
  105. Ying, X.; Wu, Q.; Wu, X.; Zhu, Q.; Wang, X.; Jiang, L.; Chen, X.; Wang, X. Epithelial ovarian cancer-secreted exosomal miR-222-3p induces polarization of tumor-associated macrophages. Oncotarget 2016, 7, 43076–43087. [Google Scholar] [CrossRef] [PubMed] [Green Version]
  106. Wu, C.L.; McNeill, J.; Goon, K.; Little, D.; Kimmerling, K.; Huebner, J.; Kraus, V.; Guilak, F. Conditional Macrophage Depletion Increases Inflammation and Does Not Inhibit the Development of Osteoarthritis in Obese Macrophage Fas-Induced Apoptosis-Transgenic Mice. Arthritis Rheumatol. 2017, 69, 1772–1783. [Google Scholar] [CrossRef] [PubMed]
  107. Pergoli, L.; Cantone, L.; Favero, C.; Angelici, L.; Iodice, S.; Pinatel, E.; Hoxha, M.; Dioni, L.; Letizia, M.; Albetti, B.; et al. Extracellular vesicle-packaged miRNA release after short-term exposure to particulate matter is associated with increased coagulation. Part. Fibre Toxicol. 2017, 14, 32. [Google Scholar] [CrossRef] [Green Version]
  108. D’haene, B.; Mestdagh, P.; Hellemans, J.; Vandesompele, J. miRNA expression profiling: From reference genes to global mean normalization. Methods Mol. Biol. 2012, 822, 261–272. [Google Scholar] [CrossRef]
  109. Eden, E.; Navon, R.; Steinfeld, I.; Lipson, D.; Yakhini, Z. GOrilla: A tool for discovery and visualization of enriched GO terms in ranked gene lists. BMC Bioinform. 2009, 10, 48. [Google Scholar] [CrossRef] [Green Version]
  110. Eden, E.; Lipson, D.; Yogev, S.; Yakhini, Z. Discovering motifs in ranked lists of DNA sequences. PLoS Comput. Biol. 2007, 3, e39. [Google Scholar] [CrossRef]
  111. Mi, H.; Huang, X.; Muruganujan, A.; Tang, H.; Mills, C.; Kang, D.; Thomas, P.D. PANTHER version 11: Expanded annotation data from Gene Ontology and Reactome pathways, and data analysis tool enhancements. Nucleic Acids Res. 2017, 45, D183–D189. [Google Scholar] [CrossRef] [Green Version]
  112. Metsalu, T.; Vilo, J. ClustVis: A web tool for visualizing clustering of multivariate data using Principal Component Analysis and heatmap. Nucleic Acids Res. 2015, 43, W566–W570. [Google Scholar] [CrossRef] [PubMed]
Figure 1. Surface marker expressions of adipose-derived MSCs (ASCs). After FSC/SSC gating and doublets removal (A), ASCs without and with osteoarthritis (OA) inflammation resulted positive for CD90/73/44 MSC markers (B) and negative for CD34/31/45 hemato/endothelial determinants (C). Red: unstained ASCs, green: stained ASCs and blue: stained inflamed (OA) ASCs. Representative cytograms of a single population are shown.
Ijms 21 01582 g001
Figure 2. Heat map of ASCs-secreted factors across all samples. Heat map of hierarchical clustering analysis: the log2 values of 75 detected secreted factors after normalization per 106 ASCs. The sample clustering tree is shown at the top. The color scale shown in the map illustrates the absolute expression levels of factors across all samples: red shades = high expression levels (high log2(pg) per 106 ASCs) and blue shades = lower expression levels (low log2(pg) per 106 ASCs).
Ijms 21 01582 g002
Figure 3. A visualization of the biological process gene ontology annotations using Gorilla for identified secreted factors. A) The background dataset used is composed of 200 human factors tested in the ELISA arrays (see Materials and Methods). Enrichment using the 18 factors expressed at > 10 ng per 106 ASCs is shown. B) Enrichment using the 57 factors expressed at < 10 ng per 106 ASCs is shown. The Gorilla settings were left at default values: p-value threshold of p < 10−3, organism Homo sapiens.
Ijms 21 01582 g003
Figure 4. Characterization of ASC-EVs (extracellular vesicles). A) Transmission electron micrographs of ASC-EVs showing particles with characteristic cup-shaped morphology. B) Size distribution of nanoparticles by NanoSight particle-tracking analysis. C) Nanometric fluorescent beads with diameters of 100 nm, 300 nm, 500 nm and 900 nm used for flow cytometer calibration confirmed instrument sensitivity with respect to background. D) CFSE-stained ASC-EVs (green) with respect to background. E) Flow cytometry scoring CD63/81 EV marker positivity on CFSE-labeled ASC-EVs. CD9 resulted barely positive. One representative donor is shown.
Ijms 21 01582 g004
Figure 5. Heat map of EV-miRNAs across all samples. Heat map of hierarchical clustering analysis of the normalized CRT values of detected miRNAs in ASC-EVs. Rows are centered. The sample clustering tree is shown at the top. The color scale shown in the map illustrates the absolute expression levels of factors across all samples: red shades = high expression levels (low CRT values) and blue shades = lower expression levels (high CRT values).
Ijms 21 01582 g005
Figure 6. A visualization of the biological process gene ontology annotations using Gorilla for targets of abundant EV-miRNAs. The background dataset used is composed of the entire human genome. Enrichment using the 818 mRNAs verified as targets of EV-miRNAs in the first quartile of expression. The Gorilla settings were left at default values: p-value threshold of p < 10−6, organism Homo sapiens.
Ijms 21 01582 g006
Figure 7. EV-miRNAs involved in protective or destructive mechanisms in the OA joint. Indication of miRNAs in the first quartile of expression in ASC-EVs and their role in cartilage homeostasis. miRNAs are divided per category and the relative amount of their genetic message shown.
Ijms 21 01582 g007
Figure 8. EV-miRNAs involved in M1 or M2 polarization in macrophages. Indication of miRNAs in the first quartile of expression in ASC-EVs and their role in macrophage polarization. miRNAs are divided per category, and the relative amount of their genetic message is shown. Direction of arrows represents the guidance of polarization phenotype. Size of arrows reflects the genetic weight.
Ijms 21 01582 g008
Table 1. pg per 106 adipose-derived MSCs (ASCs) in 48 h.
FACTORASC 1ASC 2ASC 3ASC 4MEANSDDESCRIPTION
FST1,492,6731,081,479570,4161,004,9321,037,375377,865Follistatin
TIMP2167,790162,350198,481256,519196,28543,191Metalloproteinase inhibitor 2
IGFBP4223,536276,754145,19884,223182,42884,887Insulin-like growth factor-binding protein 4
SERPINE1109,335103,66198,032119,47510,76269148Plasminogen activator inhibitor 1
IGFBP686,61083,50277,84294,33285,5726877Insulin-like growth factor-binding protein 6
IL6ST68,64768,36136,58550,18255,94415,530Interleukin-6 receptor subunit beta
CTSS52,27550,38040,22664,80851,92210,089Cathepsin S
IL643,02530,59140,43582,76949,20523,008Interleukin-6
TIMP134,98527,02433,21041,83934,2656094Metalloproteinase inhibitor 1
ICAM128,71521,85722,37733,31126,5655472Intercellular adhesion molecule 1
CXCL1028,62921,38616,09438,66526,1939774C-X-C motif chemokine 10
IL2RB28,88520,96218,10127,05723,7515066Interleukin-2 receptor subunit beta
TNFRSF1A15,65221,27721,32813,79118,0123875Tumor necrosis factor receptor superfamily member 1A
CCL216,28613,41115,77119,07616,1362325C-C motif chemokine 2
PLG17,21814,05514,93617,79316,0011790Plasminogen
CXCL515,2265628520436,61415,66814,711C-X-C motif chemokine 5
DKK117,27512,4228703954011,9853870Dickkopf-related protein 1
PI318,9533218656720,20712,2368605Elafin (Peptidase inhibitor 3)
CCL515,6114502440711,97091225591C-C motif chemokine 5
FLT15604485413,91610,83488024324Vascular endothelial growth factor receptor 1
IGFBP3489811,609514511,34982503731Insulin-like growth factor-binding protein 3
ANG461289905615215853442831Angiogenin
SHH695757513445543753981457Sonic hedgehog protein
GDF1551286376453441675051968Growth/differentiation factor 15
CXCL943912472127210,67747034185C-X-C motif chemokine 9
CSF144883510362427973604693Macrophage colony-stimulating factor 1
CXCL133343781251642763477747Growth-regulated alpha protein
IL1RL1521214403249399134731579Interleukin-1 receptor-like 1
TNFRSF11B437818614234293433521187Tumor necrosis factor receptor superfamily member 11B
CXCL825213046271538393030581Interleukin-8
TNFRSF1B227733271014502529111697Tumor necrosis factor receptor superfamily member 1B
VEGFA195623781738560029181808Vascular endothelial growth factor A
PLAUR24043497258111142399981Urokinase plasminogen activator surface receptor
CSF31989897770660525652748Granulocyte colony-stimulating factor
CCL8110720461098335119001064C-C motif chemokine 8
CCL418511055131226891727722C-C motif chemokine 4
CD401730168184113801408408Tumor necrosis factor receptor superfamily member 5
CD141467211411755551328648Monocyte differentiation antigen CD14
EGFR1006160279219381335529Epidermal growth factor receptor
AXL958229411832771178838Tyrosine-protein kinase receptor UFO
TREM1961106370915491071352Triggering receptor expressed on myeloid cells 1
TYRO3233412311554941026971Tyrosine-protein kinase receptor TYRO3
HGF8238321407778960299Hepatocyte growth factor
LIF67683410141295954265Leukemia inhibitory factor
CXCL165141256539993825362C-X-C motif chemokine 16
CXCL61144546411123714527C-X-C motif chemokine 6
NRCAM574723501424693567Neuronal cell adhesion molecule
CCL217311164384289642397C-C motif chemokine 21
TGFB1769793630363639197Human TGF-beta 1
SPP1189434635917544308Osteopontin
TNFRSF10D6371033301033526403Tumor necrosis factor receptor superfamily member 10D
FAS608399540203438179Tumor necrosis factor receptor superfamily member 6
FGF7617308575208427200Fibroblast growth factor 7
SIGLEC5456545288446434107Sialic acid-binding Ig-like lectin 5
IL23A441425166655422200Interleukin-23 subunit alpha
IL17B532453438156395164Interleukin-17B
MIF37628544647939686Macrophage migration inhibitory factor
CCL188112731214371562C-C motif chemokine 1
CD40LG80268220588289215CD40 ligand
CCL13166155297490277156C-C motif chemokine 13
VEGFC56821516023241232Vascular endothelial growth factor C
CCL11159103416294243141Eotaxin
IL1B27117918729423358Interleukin-1 beta
TNF81123151590236237Tumor necrosis factor
ENG16212825417918153Endoglin
TNFRSF21621997619213273Tumor necrosis factor receptor superfamily member 21
CCL7587254362137150C-C motif chemokine 7
CCL390192525196108C-C motif chemokine 3
IL2RA1087472587821Interleukin-2 receptor subunit alpha
AGRP17125161136859Agouti-related protein
IL1A8525261156345Interleukin-1 alpha
CXCL12719219285235Stromal cell-derived factor 1
IL17A87134785040Interleukin-17A
PGF258201003842Placenta growth factor
IL131891125167Interleukin-13
Colors represent factor amount, red for high and blue for low.
Table 2. Enriched gene ontology (GO) terms for secreted factors.
Factor AmountGO TERMDescriptionp-ValueFactors
> 10 ng/106 ASCGO:0022411cellular component disassembly3.74 × 10−6TIMP1, TIMP2, DKK1, PLG and CTSS
GO:0022617extracellular matrix disassembly5.13 × 10−5TIMP1, TIMP2, PLG and CTSS
< 10 ng/106 ASCGO:0002791regulation of peptide secretion8.05 × 10−4IL17A, ANG, VEGFC, TGFB1, CCL5, IL13, IL1RL1, MIF, CD40LG, IL1B, CD40, CCL1, IL1A, CCL3, TNFRSF21, TNF, EGFR, CD14 and TNFRSF1B
GO:0050708regulation of protein secretion8.05 × 10−4IL17A, ANG, VEGFC, TGFB1, CCL5, IL13, IL1RL1, MIF, CD40LG, CCL1, CD40, IL1B, IL1A, CCL3, TNFRSF21, TNF, EGFR, CD14 and TNFRSF1B
GO:0022603regulation of anatomical structure morphogenesis8.07 × 10−4SHH, FLT1, CXCL9, GDF15, LIF, PGF, CXCL12, SPP1, FGF7, ENG, CSF1, VEGFA, CCL13, VEGFC, CCL11, TGFB1, CCL8, CCL7, IL1B, CD40, IL1A, CCL3, HGF, TNF, IL8, TNFRSF1B, NRCAM and TNFSRSF11B
GO:0043903regulation of symbiosis8.22 × 10−4TNF, IL8, CCL5, CCL4, CCL8, CXCL6 and CCL3
GO:0070201regulation of protein localization9.16 × 10-4IL17A, ANG, VEGFC, TGFB1, SHH, CCL5, IL13, IL1RL1, MIF, CD40LG, CCL1, IL1B, CD40, IL1A, CCL3, TNFRSF21, TNF, EGFR, CD14 and TNFRSF1B
GO:0051223regulation of protein transport9.16 × 10−4IL17A, ANG, VEGFC, TGFB1, SHH, CCL5, IL13, IL1RL1, MIF, CD40LG, IL1B, CD40, CCL1, IL1A, CCL3, TNFRSF21, TNF, EGFR, CD14 and TNFRSF1B
GO:0090087regulation of peptide transport9.16 × 10−4IL17A, ANG, VEGFC, TGFB1, SHH, CCL5, IL13, IL1RL1, MIF, CD40LG, CCL1, CD40, IL1B, IL1A, CCL3, TNFRSF21, TNF, EGFR, CD14 and TNFRSF1B
GO:0006954inflammatory response9.98 × 10−4IL17A, IL17B, CXCL9, IL13, MIF, SPP1, IL23A, AXL, CD14, CSF1, CCL13, CCL11, TGFB1, CCL5, IL2RA, CCL4, CCL8, CCL7, CD40LG, TREM1, IL1B, CD40, CCL1, IL1A, CCL3, TNF, CXCL1, IL8, CXCL6, TNFRSF1B and CCL21
Table 3. First-quartile extracellular vesicle (EV)-miRNAs involved in osteoarthritis (OA) pathogenesis.
Protective
miRNA% EV-genetic weightTargetTissueRole
hsa-miR-24-3p19.0P16INK4ACartilageRegulates senescence
hsa-miR-222-3p5.8HDAC4CartilagePrevents cartilage degradation
hsa-miR-193b-3p5.0TGFB2-3/MMP19CartilageRegulates inflammation
hsa-miR-92a-3p1.5ADAMTS4-5/HDAC2CartilageAnti-catabolic
hsa-miR-29a-3p1.1VEGFSynoviumInhibits synovial remodeling
hsa-miR-199a-3p0.9COX2CartilageAnti-catabolic
hsa-miR-27a-3p0.8FSTL1SynoviumPrevents synoviocyte migration
hsa-miR-26a-5p0.6iNOSCartilageCartilage homeostasis
hsa-miR-130a-3p0.6TNFaCartilageAnti-inflammatory
hsa-miR-320a-3p0.5BMI1/RUNX2/MMP13CartilageChondrogenic
hsa-miR-152-3p0.5DNMTSynoviumPrevents synoviocyte migration
hsa-miR-17-5p0.5SQSTM1CartilageInduces Autophagy
hsa-miR-27b-3p0.3MMP13/LEPTINCartilageAnti-catabolic
hsa-miR-210-3p0.2DR6/HIF3aCartilageAnti-apoptotic/promotes ECM
hsa-miR-30a-5p0.2ADAMTS5CartilageCartilage homeostasis
hsa-miR-26b-5p0.1KPNA3CartilagePromotes NF-kB pathway
hsa-miR-149-5p0.1TNFaCartilageAnti-inflammatory
Total37.9
Destructive
miRNA% EV-genetic weightTargetTissueRole
hsa-miR-21-5p4.7GDF5CartilageChondrogenesis inhibitor
hsa-miR-30b-5p2.4BECN1/ATG5CartilageECM degradation
hsa-miR-19b-3p1.4ndSynoviumInduces NF-kB signaling
hsa-miR-34a-5p0.7SIRT1CartilageApoptotic
hsa-miR-16-5p0.4SMAD3CartilageCartilage degradation
hsa-miR-138-5p0.2FOXC1CartilagePromotes cartilage degradation
hsa-miR-483-5p0.1MATN3/TIMP2CartilageECM degradation
Total9.8
Protective/Destructive
miRNA% EV-genetic weightTargetTissueRole
hsa-miR-125b-5p12.6ADAMTS4/SYVN1Cartilage/SynoviumPrevents aggrecan loss/Pro-apoptotic
hsa-miR-221-3p4.7SDF1/ndCartilagePrevents ECM degradation/Pro-inflammatory
hsa-miR-145-5p1.7TNFRSF11B/SOX9-SMAD3CartilageChondrocyte proliferation/Cartilage degradation
hsa-miR-365-3p0.2HIF2a/HDAC4CartilagePrevents ECM loss/Pro-inflammatory
Total19.2
Table 4. First-quartile EV-miRNAs involved in macrophage polarization.
M1 Polarization
miRNAs% EV-Genetic WeightRegulation of Macrophage Phenotype
hsa-miR-145-5p1.7Promotes M1
hsa-miR-27a-3p0.8Promotes M1, suppresses M2
hsa-miR-27b-3p0.3Promotes M1, suppresses M2
hsa-miR-130a-3p0.6Promotes M1, suppresses M2
hsa-miR-26a-5p0.6Suppresses M2
hsa-miR-26b-5p0.1Suppresses M2
hsa-miR-7203.0Suppresses M2
Total7.2
M2 Polarization
miRNAs% EV-Genetic WeightRegulation of Macrophage Phenotype
hsa-miR-34a-5p0.7Promotes M2
hsa-miR-222-3p5.8Promotes M2
hsa-let-7b-5p0.6Promotes M2
hsa-miR-24-3p19.0Promotes M2, suppresses M1
Total26.1

