Article

Ethylene Biosynthesis Inhibition Combined with Cyanide Degradation Confer Resistance to Quinclorac in Echinochloa crus-galli var. mitis

1
Weed Research Laboratory, College of Life Sciences, Nanjing Agricultural University, Nanjing 210095, China
2
Department of Agronomy, University of Agriculture, Faisalabad 38000, Pakistan
*
Author to whom correspondence should be addressed.
Int. J. Mol. Sci. 2020, 21(5), 1573; https://doi.org/10.3390/ijms21051573
Submission received: 28 January 2020 / Revised: 20 February 2020 / Accepted: 21 February 2020 / Published: 25 February 2020
(This article belongs to the Section Molecular Plant Sciences)

Abstract

:
Echinochloa crus-galli var. mitis has rarely been reported for herbicide resistance, and no case of quinclorac resistance has been reported so far. Synthetic auxin-type herbicide quinclorac is used extensively to control rice weeds worldwide. A long history of using quinclorac in Chinese rice fields escalated the resistance in E. crus-galli var. mitis against this herbicide. Bioassays in Petri plates and pots exhibited four biotypes that evolved into resistance to quinclorac ranking as JS01-R > AH01-R > JS02-R > JX01-R from three provinces of China. Ethylene production in these biotypes was negatively correlated with resistance level and positively correlated with growth inhibition. Determination of the related ethylene response pathway exhibited resistance in biotypes that recorded a decline in 1-aminocyclopropane-1-carboxylic acid (ACC) content, ACC synthase oxidase activities, and less inducible ACS and ACO genes expressions than the susceptible biotype, suggesting that there was a positive correlation between quinclorac resistance and ethylene biosynthesis inhibition. Cyanides produced during the ethylene biosynthesis pathway mainly degraded by the activity of β-cyanoalanine synthase (β-CAS). Resistant biotypes exhibited higher β-CAS activity than the susceptible ones. Nucleotide changes were found in the EcCAS gene of resistant biotypes as compared to sensitive ones that caused three amino acid substitutions (Asn-105-Lys, Gln-195-Glu, and Gly-298-Val), resulting in alteration of enzyme structure, increased binding residues in the active site with its cofactor, and decreased binding free energy; hence, its activity was higher in resistant biotypes. Moreover, these mutations increased the structural stability of the enzyme. In view of the positive correlation between ethylene biosynthesis inhibition and cyanide degradation with resistance level, it is concluded that the alteration in ethylene response pathway or at least variation in ACC synthase and ACC oxidase enzyme activities—due to less relative expression of ACS and ACO genes and enhanced β-CAS activity, as well as mutation and increased relative expression of EcCAS gene—can be considered as a probable mechanism of quinclorac resistance in E. crus-galli var. mitis.

Graphical Abstract

1. Introduction

Contributing more than USD 34 billion toward herbicidal control cost [1], weeds are considered to be the most troublesome entity in agricultural systems [2]. Weed control by using herbicides dates back to 1945 with the commercial availability of 2,4-dichlorophenoxyacetic acid (2,4-D (synthetic auxin)) [3]. Herbicides greatly contributed to abundant food production worldwide. Nevertheless, the evolution of a resistant population is a major threat to the sustained efficacy of these herbicides. Robust selection pressure, which is imposed by herbicides on vast and genetically assorted pest populations, firstly results in high mortality; on the other hand, selection and enrichment of the rare resistant genes present in the population result in the evolution of resistance [4,5]. Worldwide, 256 species containing 500 resistant biotypes are present, which consists of 149 dicotyledon and 107 monocotyledon biotypes [6].
Selection for multiple herbicide-resistant weed populations stems from the long history of herbicide use [6], eventually leaving fewer options for effectual alternative herbicides. The mechanisms attributing to herbicide resistance in weeds are target-site resistance (TSR) and non-target-site resistance (NTSR). Herbicide resistance can occur by the alteration of the gene that translates the herbicide target protein. Even a single nucleotide substitution in genes is enough to cause herbicide resistance [7]. Additionally, copy number variation [8], codon triplet deletion [9], target-site protein over-production, and change in the structure of binding site by amino acid substitution [10] have been reported so far, and these are characterized as TSR because this is caused by herbicide target gene mutation. Any mechanism causing a change in herbicide absorption, translocation, metabolism, and degradation are categorized as NTSR [11]. Genes involved in NTSR mechanism often comprise a superfamily, hence prompting difficulty in gene identification [12]. Consequently, a fewer number of genes have been reported for NTSR [13,14,15]. In outcrossing species, gene flow of resistance alleles and sequential herbicide selection can bring several mechanism accumulations rendering multiple herbicide resistance [16].
In Chinese rice fields, barnyard grass (Echinochloa crus-galli) is considered as the most problematic weed [17,18,19], and it is ranked as the sixth most troublesome herbicide-resistant weed globally [20]. Echinochloa crus-galli is much devastating that it can reduce the rice biomass and yield by 75% and 50%, respectively, even at a 10:1 ratio of rice and E. crus-galli plants [21]. To control Echinochloa spp. in rice fields, herbicides are being applied for more than 30 years. Nonetheless, herbicide resistance is rapidly developing due to the persistent use of herbicides [7]. Eight herbicide-resistant species have been reported from genus Echinochloa in different countries around the globe [6].
Quinclorac with a quinolone carboxylic acid backbone is a synthetic auxin herbicide and is considered as an effective tool to control Echinochloa weed species [22,23,24]. Though, extensive use of this herbicide gave rise to quinclorac-resistant Echinochloa species such as E. colona [25,26], E. crus-galli [26,27,28,29], E. crus-galli var. zelayensis [18], E. crus-pavonis [6], E. phyllopogon [30], E. oryzicola, and E. hispidula [31].
TIR1/AFB has been discovered as an auxin receptor, as well as the receptor for quinclorac [23,32]. Quinclorac application results in the induction of auxin-responsive genes, including 1-aminocyclopropane-1-carboxylic acid (ACC) synthase, inducing the de novo synthesis of ACC synthase. In susceptible species, quinclorac application results in an increase of ACC, and then this produced ACC is oxidized into ethylene and hydrogen cyanide (HCN) by ACC oxidase. Several metabolic enzymes can be affected by a higher level of HCN, ultimately causing the death of susceptible plants [23]. One of the essential enzymes in the respiratory chain, cytochrome c oxidase, is inhibited by HCN [33]. A multigene family encodes the ACS (1-aminocyclopropane-1-carboxylic acid synthase) and ACO (1-aminocyclopropane-1-carboxylic acid oxidase) enzymes in the ethylene biosynthesis pathway [34]. Differential expressions of ACO and ACS genes were reported in quinclorac sensitive and resistant E. crus-galli var. zalayensis [19]. HCN produced during the ethylene biosynthesis was degraded by the activity of β-cyanoalanine synthase (β-CAS) [35]. Numerous studies mentioned that quinclorac resistance could be instigated by elevated levels of β-CAS activity [29,36,37]. Contrarily, quinclorac resistance in E. phyllopogan might solely depend on ethylene biosynthesis inhibition rather than cyanide degradation [38]. However, it is a fact that mutations can increase enzyme activity [39]. β-CAS mainly depends upon pyridoxal phosphate (PLP) for its activity [35]. Quinclorac-resistant E. crus-galli var. zelayensis was found to evolve single nucleotide mutation in β-CAS [37], but the effect of this mutation on enzyme structure stability and its binding with cofactor PLP needs further investigations.
Previous studies documented that there is no difference in quinclorac absorption/uptake, transport, and metabolism in resistant and susceptible plants [36,40,41]. Additionally, quinclorac did not cause cellulose synthesis inhibition [42]. The resistant populations of E. crus-galli var. zelayensis did not show a remarkable increase in ethylene level after quinclorac spray [18]. Echinochloa crus-galli var. mitis was found to evolve resistance against ALS-inhibiting herbicides such as imazethapyr + imazapic, penoxsulam, and bispyribac-sodium [43], as well as against pretilachlor [17]. Considering the unique mode of action of quinclorac, the TSR and NTSR mechanisms might be involved in its resistance. The low level of ACC synthase activity in resistant biotypes can be attributed to less sensitivity at auxin receptors level or/and altered auxin signal transduction pathway. Cyanide degradation by β-CAS can give further advantage to resistant biotypes to cope with quinclorac sensitivity.
Echinochloa crus-galli var. mitis is an important and widespread weed in China that has never been reported for quinclorac resistance. Four E. crus-galli var. mitis biotypes from different provinces of China were found to evolve resistance against quinclorac. To reveal the possible resistance mechanism, ethylene production and related enzymes such as ACC accumulation, ACS and ACO activities, β-CAS activity, its structure stability, and binding with cofactor PLP, as well as genes expression patterns, were comparatively evaluated between four resistant and one susceptible biotypes of E. crus-galli var. mitis.

2. Results

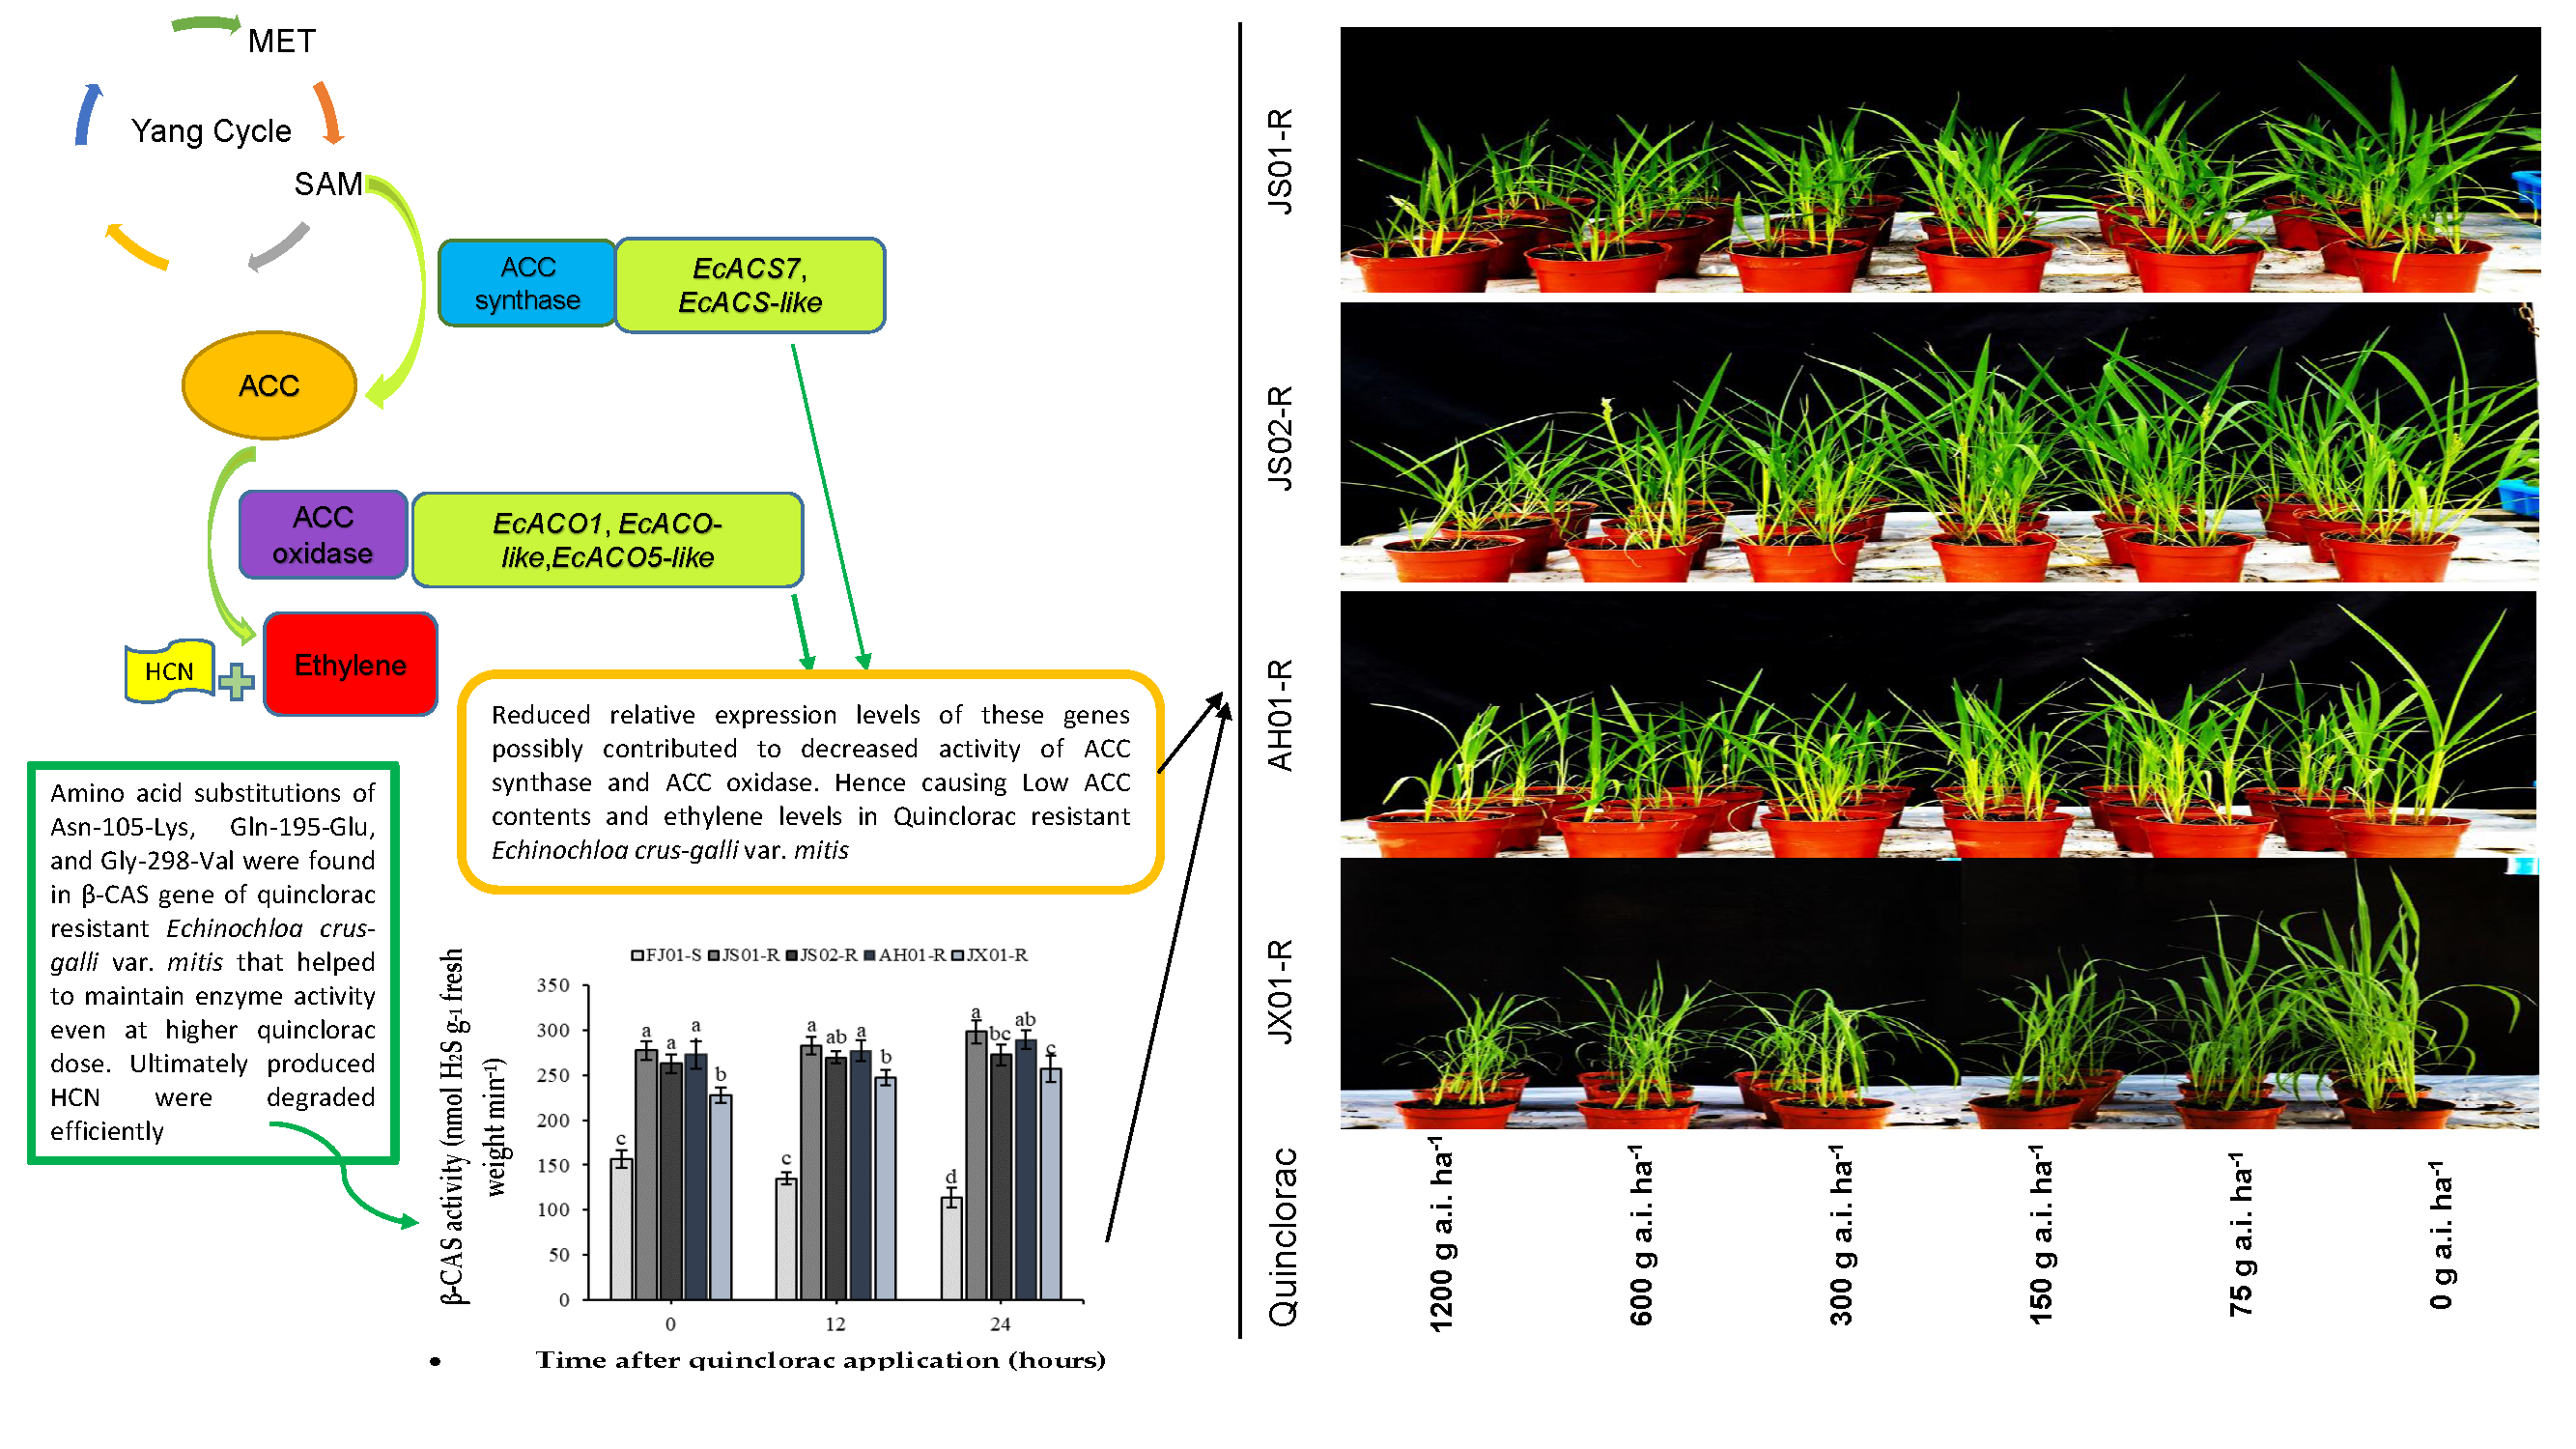
2.1. Dose–Response Analysis

In the seed and whole-plant bioassay, S biotype FJ01-S was unable to survive the increased rates of quinclorac, resulting in decreased EC50, GR50, and RI (Table 1; Figure 1 and Figure 2). JX01-R biotype sustaining the quinclorac field rates proved resistant as compared to FJ01-S, as it showed a 12–14-fold increase in RI as compared to FJ01-S. However, AH01-R and JS02-R biotypes showed a remarkable increase in EC50, GR50, and RI (Table 1); hence, these were proved more resistant than JX01-R. According to both assay results, JS01-R was dominated as a highly resistant biotype, as it exhibited a 27–35-fold increase in RI than FJ01-S biotype. The resistance level between all biotypes can be ranked as JS01-R > AH01-R > JS02-R > JX01-R.

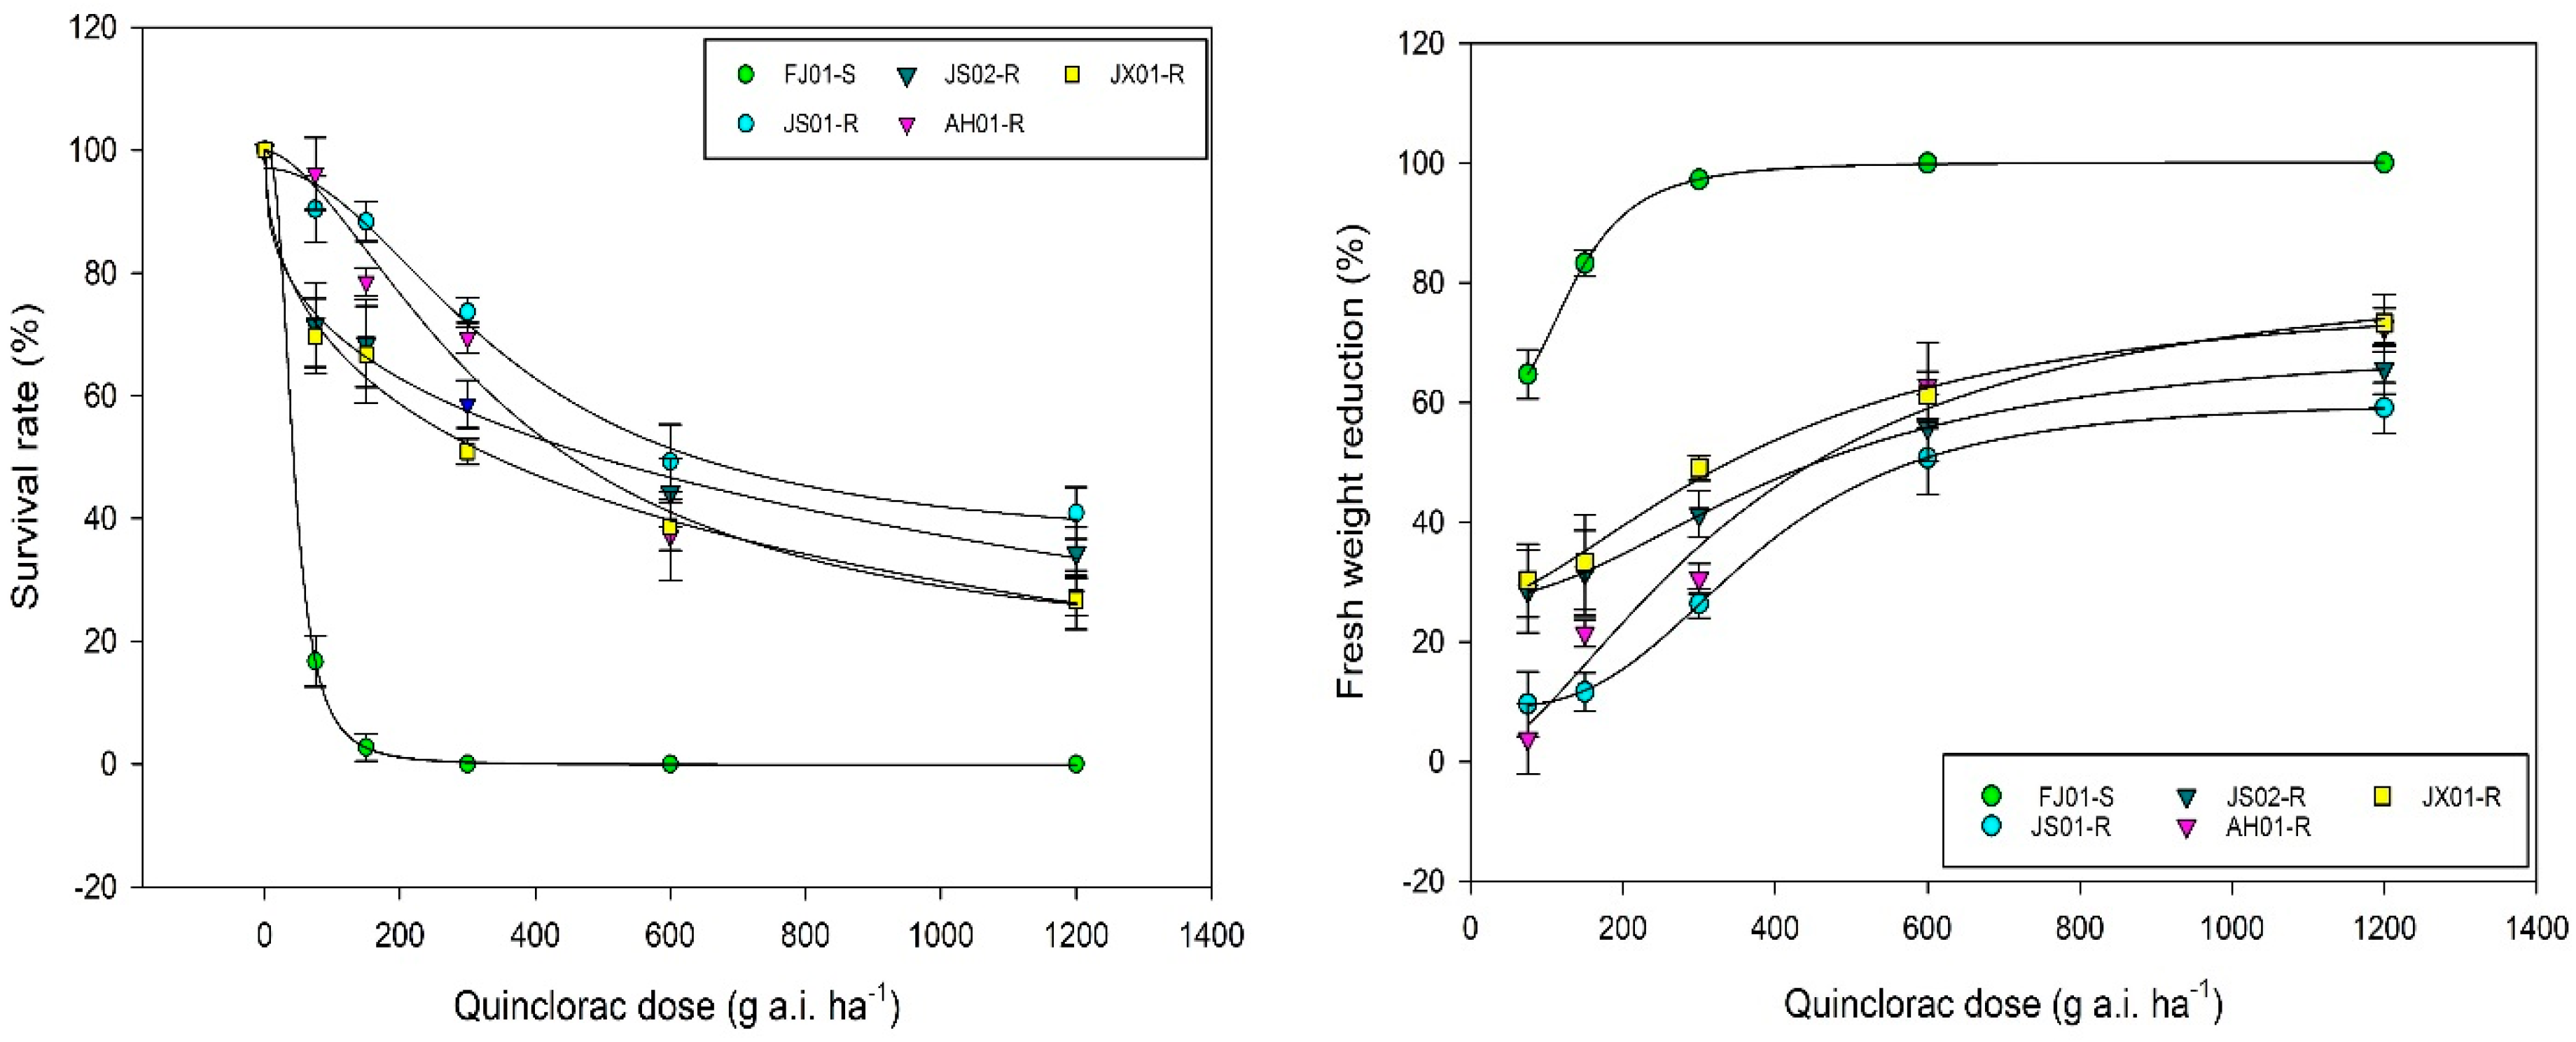
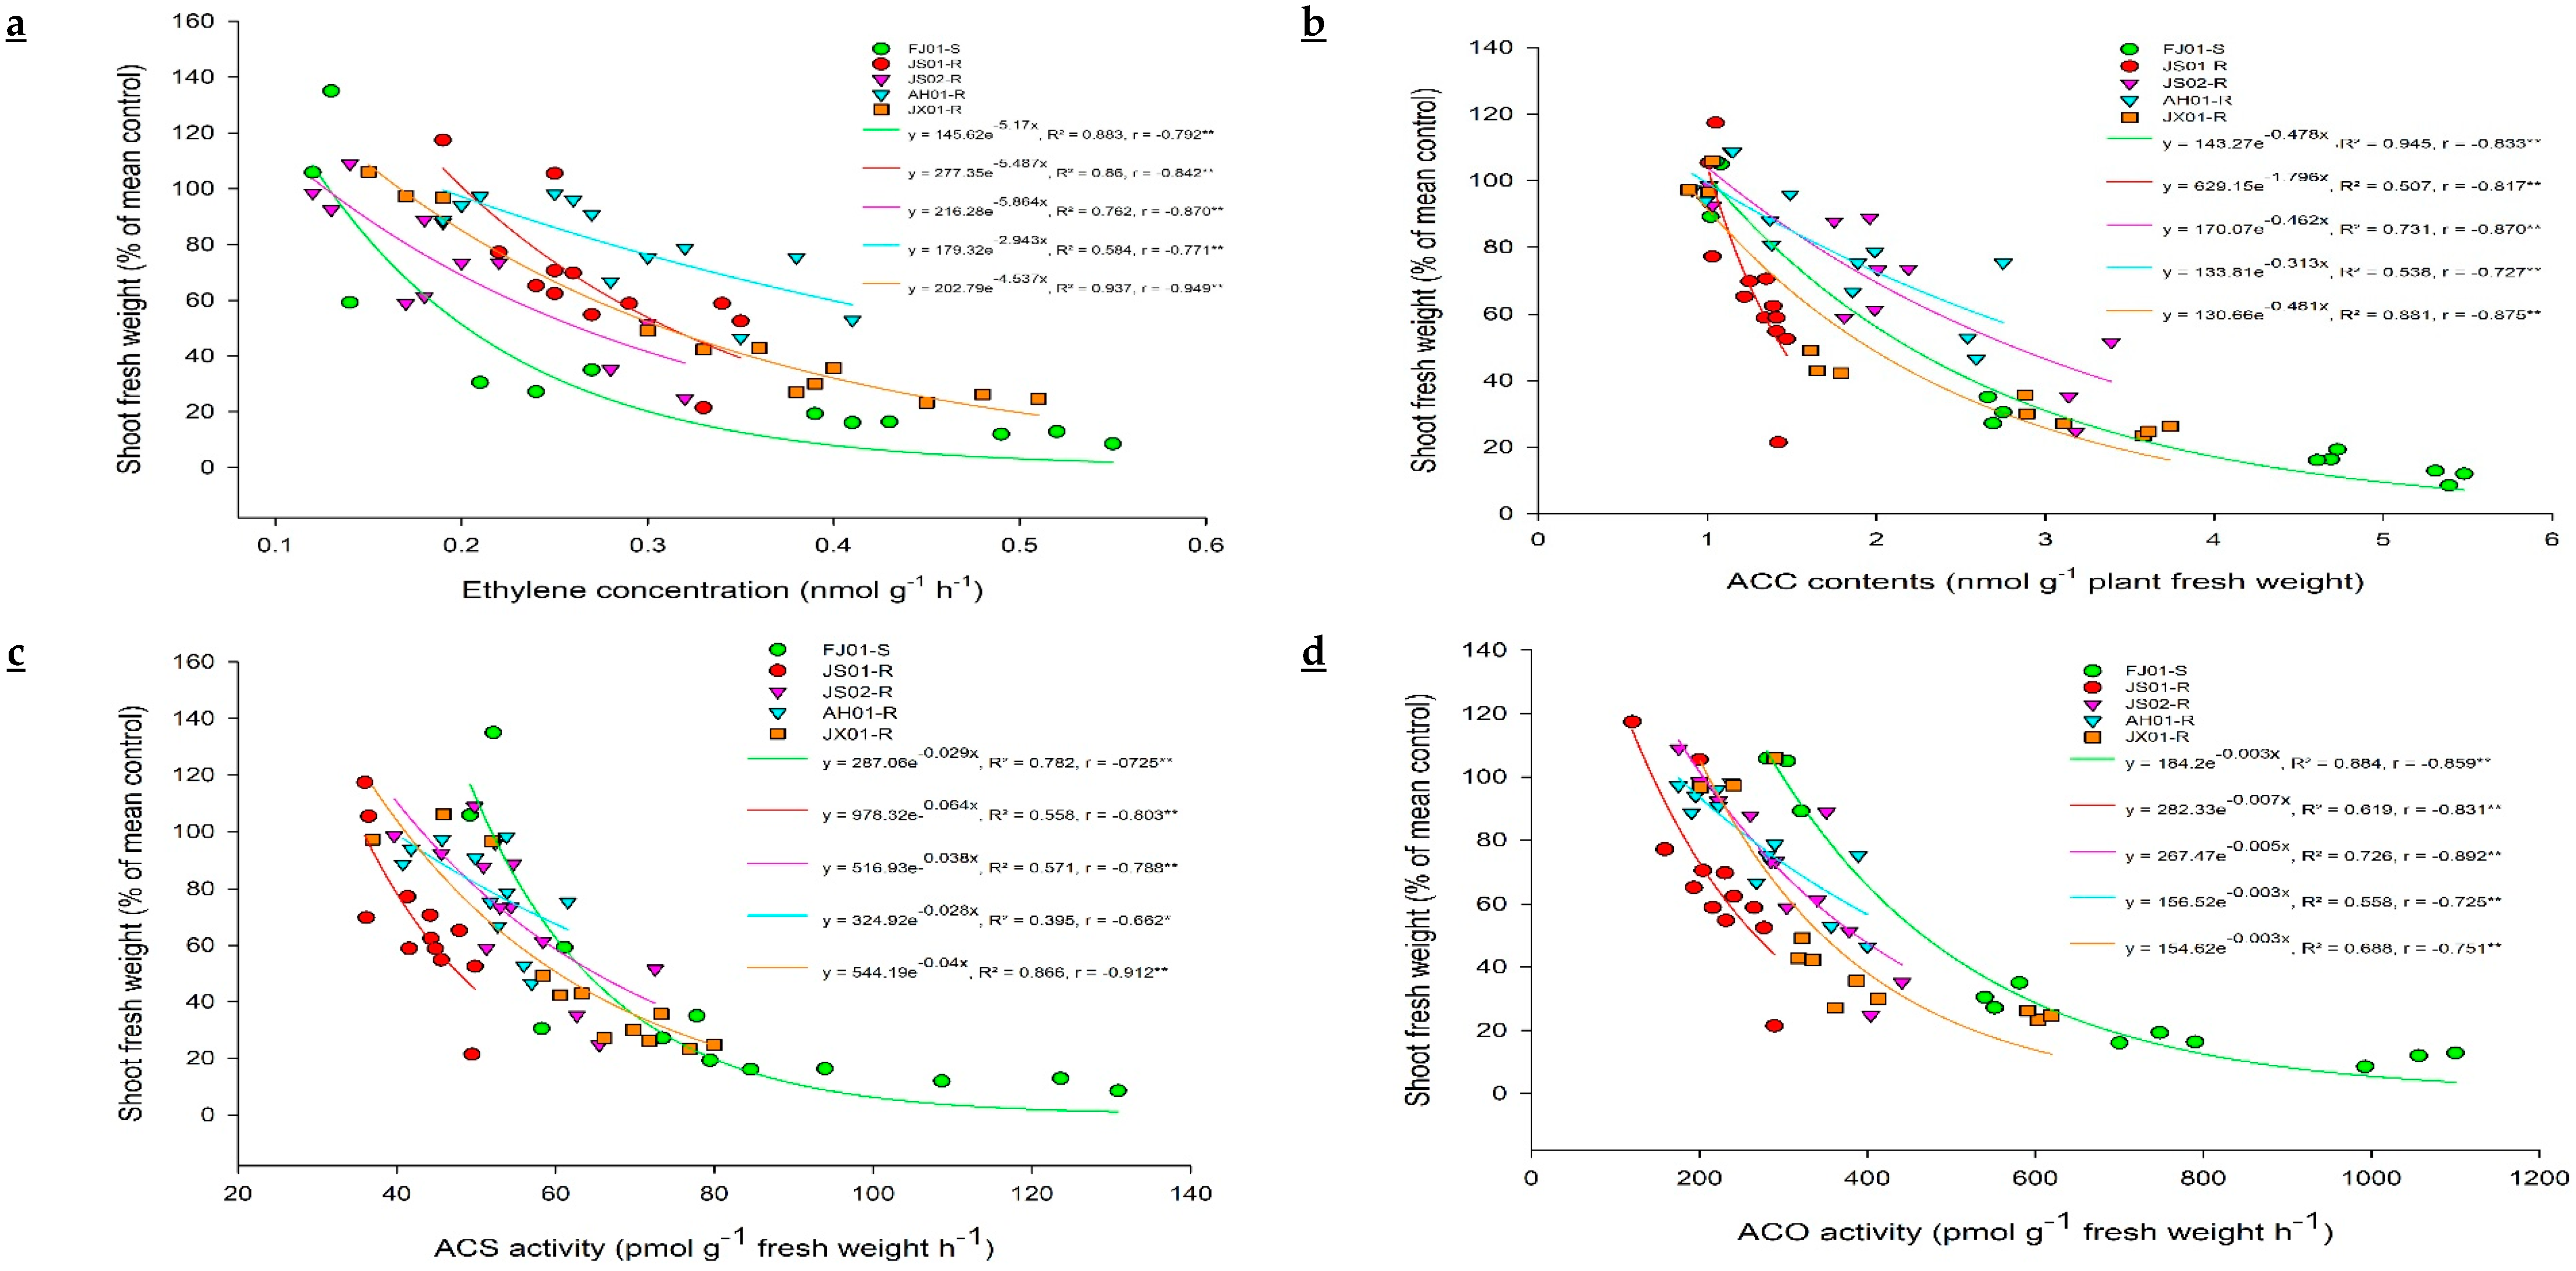
2.2. Effect on Ethylene Biosynthesis

Quinclorac induces ethylene biosynthesis in susceptible plants. Hence, ethylene levels were measured in all biotypes to figure out its relationship with quinclorac resistance. Ethylene levels increased with the increasing rate of quinclorac in all biotypes, measured 24 h after spray (Figure 3a). However, this increment was not the same in all biotypes, as JS01-R exhibited a slight increase in ethylene level as compared to respective control (ethylene level without quinclorac spray) even at the highest quinclorac dose (600 g a.i. ha−1). FJ01-S, (quinclorac-susceptible biotype) showed a remarkable increase in ethylene levels on increased quinclorac rates. As this biotype exhibited 4.1 times increment in ethylene level at 600 g a.i ha−1 quinclorac treatment than the untreated control. On the same quinclorac rate, ethylene level increment in AH01-R, JS02-R, and JX01-R was 1.9, 2.4, and 2.8 times, respectively as compared to untreated control proving that ethylene production is negatively correlated with quinclorac resistance (Figure 4a). Ethylene production peaked after 24 h of quinclorac spray, and it started to decrease gradually later on in all biotypes at 300 g a.i. ha−1 quinclorac treatment (Figure 3b). However, the ethylene level measured in FJ01-S 96 h after spray on the same treatment level was 2 times higher than the untreated control. Moreover, quinclorac induced ethylene production caused toxicity in plants and resulted in fresh weight reduction. A positive correlation was found between growth inhibition and stimulation of ethylene production (Figure 4a). After quinclorac treatment, biotypes were ranked as FJ01-S > JX01-R > JS02-R > AH01-R > JS01-R regarding ethylene production, exhibiting a negative correlation between ethylene production and resistance levels (Figure 4a).

2.3. Effect on ACC (Precursor for Ethylene Biosynthesis)

Ethylene production can be calculated directly by employing the endogenous ACC production rate, as a radical increase in ethylene production was recorded after exogenous ACC application in many plant tissues [44]. ACC accumulation (precursor of ethylene biosynthesis) was investigated in different biotypes of E. crus-galli var. mitis at 24 h after treating with varying rates of quinclorac (0, 150, 300, and 600 g a.i. ha−1; Figure 5a). ACC content increment was negligible in JS01-R, while other biotypes showed higher ACC content with increasing quinclorac rate. FJ01-S (quinclorac-susceptible biotype) recorded the highest ACC content (five times higher than untreated control) at 600 g a.i. ha−1 quinclorac rate (Figure 5a). While having a look at ACC content at 300 g a.i. ha−1 quinclorac rate, it is clear that its content increased till 24 h after spray but decreased afterward (Figure 5b). JS01-R showed a slight increase in ACC content regardless of the sampling time. Afterward, 24 h later, quinclorac application ACC contents were 4.4 and 3 times higher than untreated control in FJ01-S and JX01-R biotypes, respectively, while AH01-R and JS02-R biotypes exhibited 1.8 times higher ACC content than untreated control at the same sampling time (Figure 5b). ACC content in all biotypes followed the same trend as for ethylene levels and was negatively correlated with quinclorac resistance (Figure 4b).

2.4. ACS and ACO Enzymes Activity

In the ethylene biosynthesis pathway, ACS and ACO are two vital enzymes controlling the ethylene production rate. Hence, to find out the differential response of E. crus-galli var. mitis biotypes regarding quinclorac induced ACS and ACO enzyme activities, plants were treated with varying rates of quinclorac (0, 150, 300, and 600 g a.i. ha−1) till 24 h. A negative correlation was found among quinclorac resistance and ACS and ACO activities (Figure 4c,d).

2.4.1. Effect on ACS Activity

ACS activity was higher in FJ01-S biotypes as compared to other biotypes without quinclorac treatment (Table 2). There was no significant difference in ACS activity in JS01-R biotype regardless of quinclorac rate. All other biotypes possessed a remarkable increment in ACS activity at increasing quinclorac rates (Table 2). FJ01-S biotype exhibited the highest (120% over mean untreated control) ACS activity at 600 g a.i. ha−1 quinclorac rate. While JX01-R, JS02-R, and AH01-R biotypes exhibited 68%, 47%, and 30% increase in ACS activity, respectively, at the same quinclorac rate (Table 2).

2.4.2. Effect on ACO Activity

As ACS activity, ACO activity was higher in FJ01-S biotype before treating with quinclorac (Table 3). All the biotypes depicted differential increment in ACO activity at higher quinclorac rates. As JS01-R biotype exhibited the least increase (74% over untreated control) in ACO activity at 600 g a.i. ha−1 quinclorac rate. While JX01-R, JS02-R, and AH01-R biotypes showed 151, 81, and 72% increment than untreated control at the same quinclorac rate. FJ01-S (quinclorac-susceptible biotype) showed the highest ACO activity, as 77%, 147%, and 247% increase in ACO activity was recorded at 150, 300, and 600 g a.i. ha−1 quinclorac rate (Table 3).

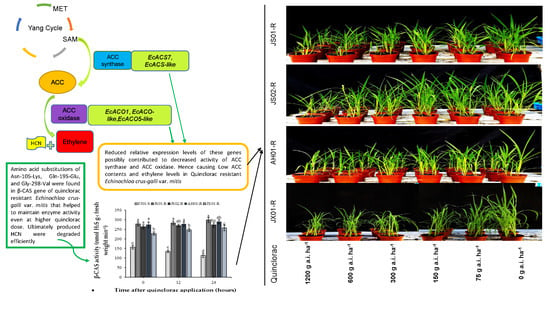
2.5. Effect on β-CAS Activity

The significantly lower β-CAS activity was recorded in susceptible biotype as compared to resistant ones before quinclorac application (Figure 6a). Susceptible biotype (FJ01-S) exhibited a decreasing trend regarding β-CAS activity after quinclorac application, as a 25% decline in β-CAS was observed 24 h after treatment (HAT). Enzyme activity in resistant biotypes was significantly (p < 0.05) higher than susceptible one at all observed time periods (Figure 6a). JX01-R exhibited lower enzyme activity as compared to other resistant biotypes at all observed time periods, and at 24 HAT, JS02-R was at the same level than this biotype regarding the β-CAS activity. Slight β-CAS activity upsurge was observed in all resistant biotypes.

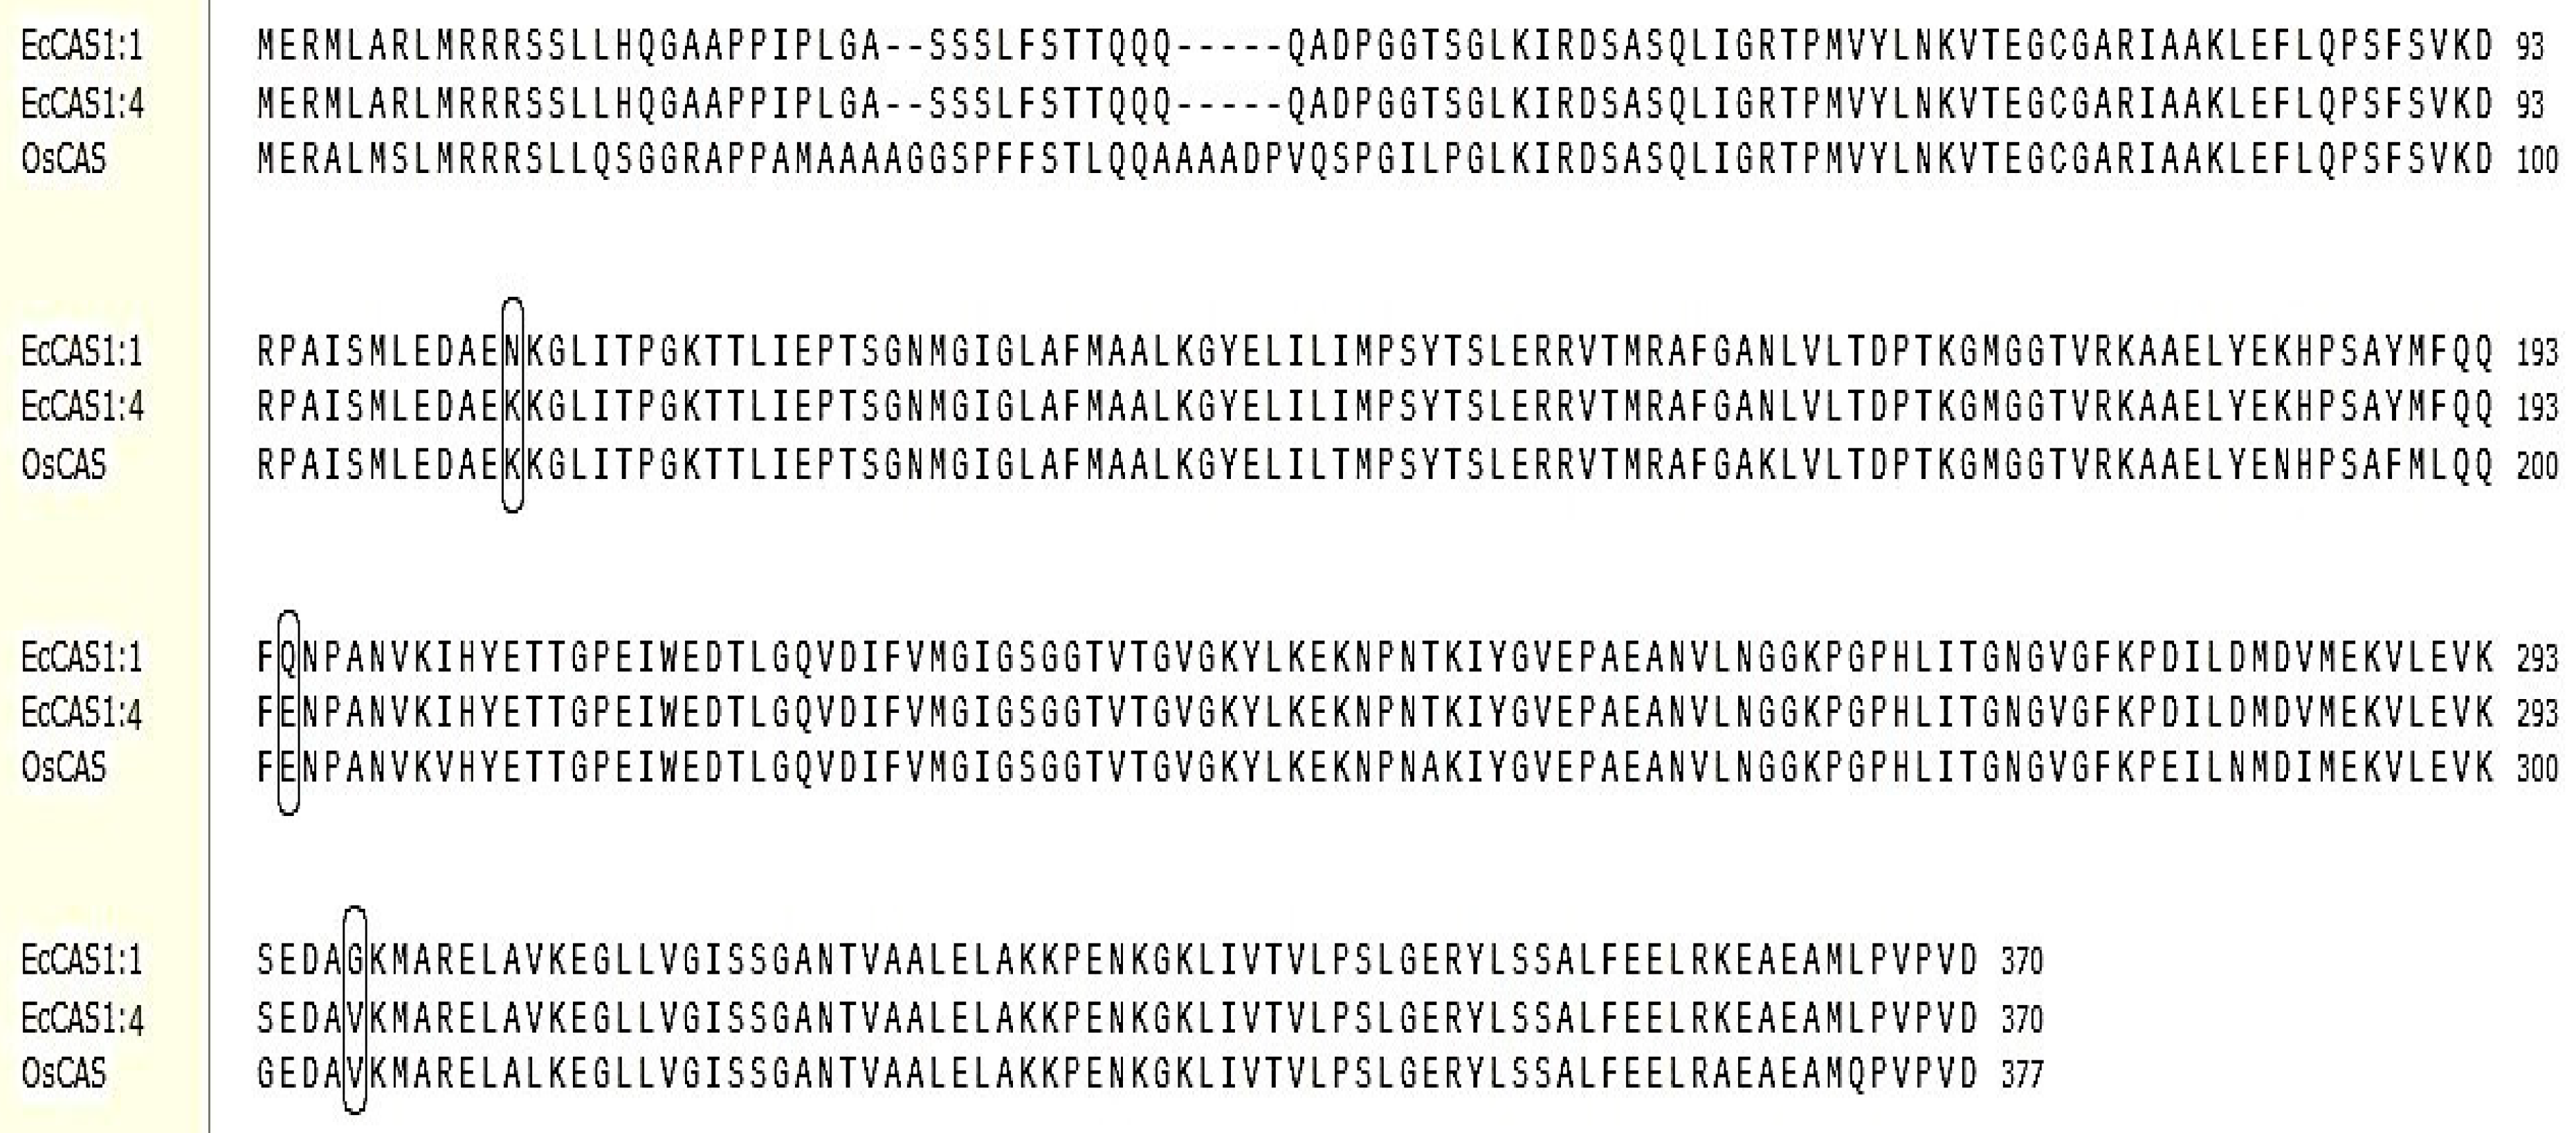
2.6. EcCAS Gene Sequence Description, Comparison, and Mutation Identification

After partial amplification of the EcCAS gene, the full sequence was obtained by amplifying 5′ and 3′ ends. The EcCAS gene ORFs (open reading frame) in five biotypes were sequenced, which consisted of 1113 bp, and it encoded 370 amino acids polypeptide and submitted to NCBI website (MN815009 and MN815010). The high similarity of the EcCAS gene from E. crus-galli var. mitis with the same gene in E. crus-galli var. zelayensis (KY922855.1; 99%) and rice (AY720933.1; 88%) proved that it was the exact sequence of the EcCAS gene.
Nucleotide sequences were translated into amino acid sequences. The EcCAS gene from E. crus-galli var. mitis exhibited three and four copies in susceptible and resistant biotypes, respectively. EcCAS1;1, EcCAS1;2, and EcCAS1;3 were found in the FJ01-S biotype while EcCAS1;4, EcCAS1;5, EcCAS1;6, and EcCAS1;7 were found in all other biotypes. EcCAS1;1 and EcCAS1;4 were the most abundant copies in their respective biotypes whereas EcCAS1;2, EcCAS1;3, EcCAS1;5, EcCAS1;6, and EcCAS1;7 were detected in only 3–4 clones out of 24 clones sequenced in each biotype. EcCAS1;1 differed from EcCAS1;2 and EcCAS1;3 by one amino acid (Ile-Thr and Glu-Gln) at positions 269 and 138, respectively. EcCAS1;4 differed from EcCAS1;5, EcCAS1;6, and EcCAS1;7 at positions 29 (Gly-Asp), 117 (Glu-Gln), and 222 (Phe-Leu), respectively. Three mutations in nucleotide sequences were found in all copies of EcCAS1;4, EcCAS1;5, EcCAS1;6, and EcCAS1;7 as compared to three copies of FJ01-S. The mutations of AAC to AAA, CAG to GAG, and GGT to GTT resulted in amino acid substitutions of Asn to Lys, Gln to Glu, and Gly to Val at 105, 195, and 298 positions, respectively (Figure 7).

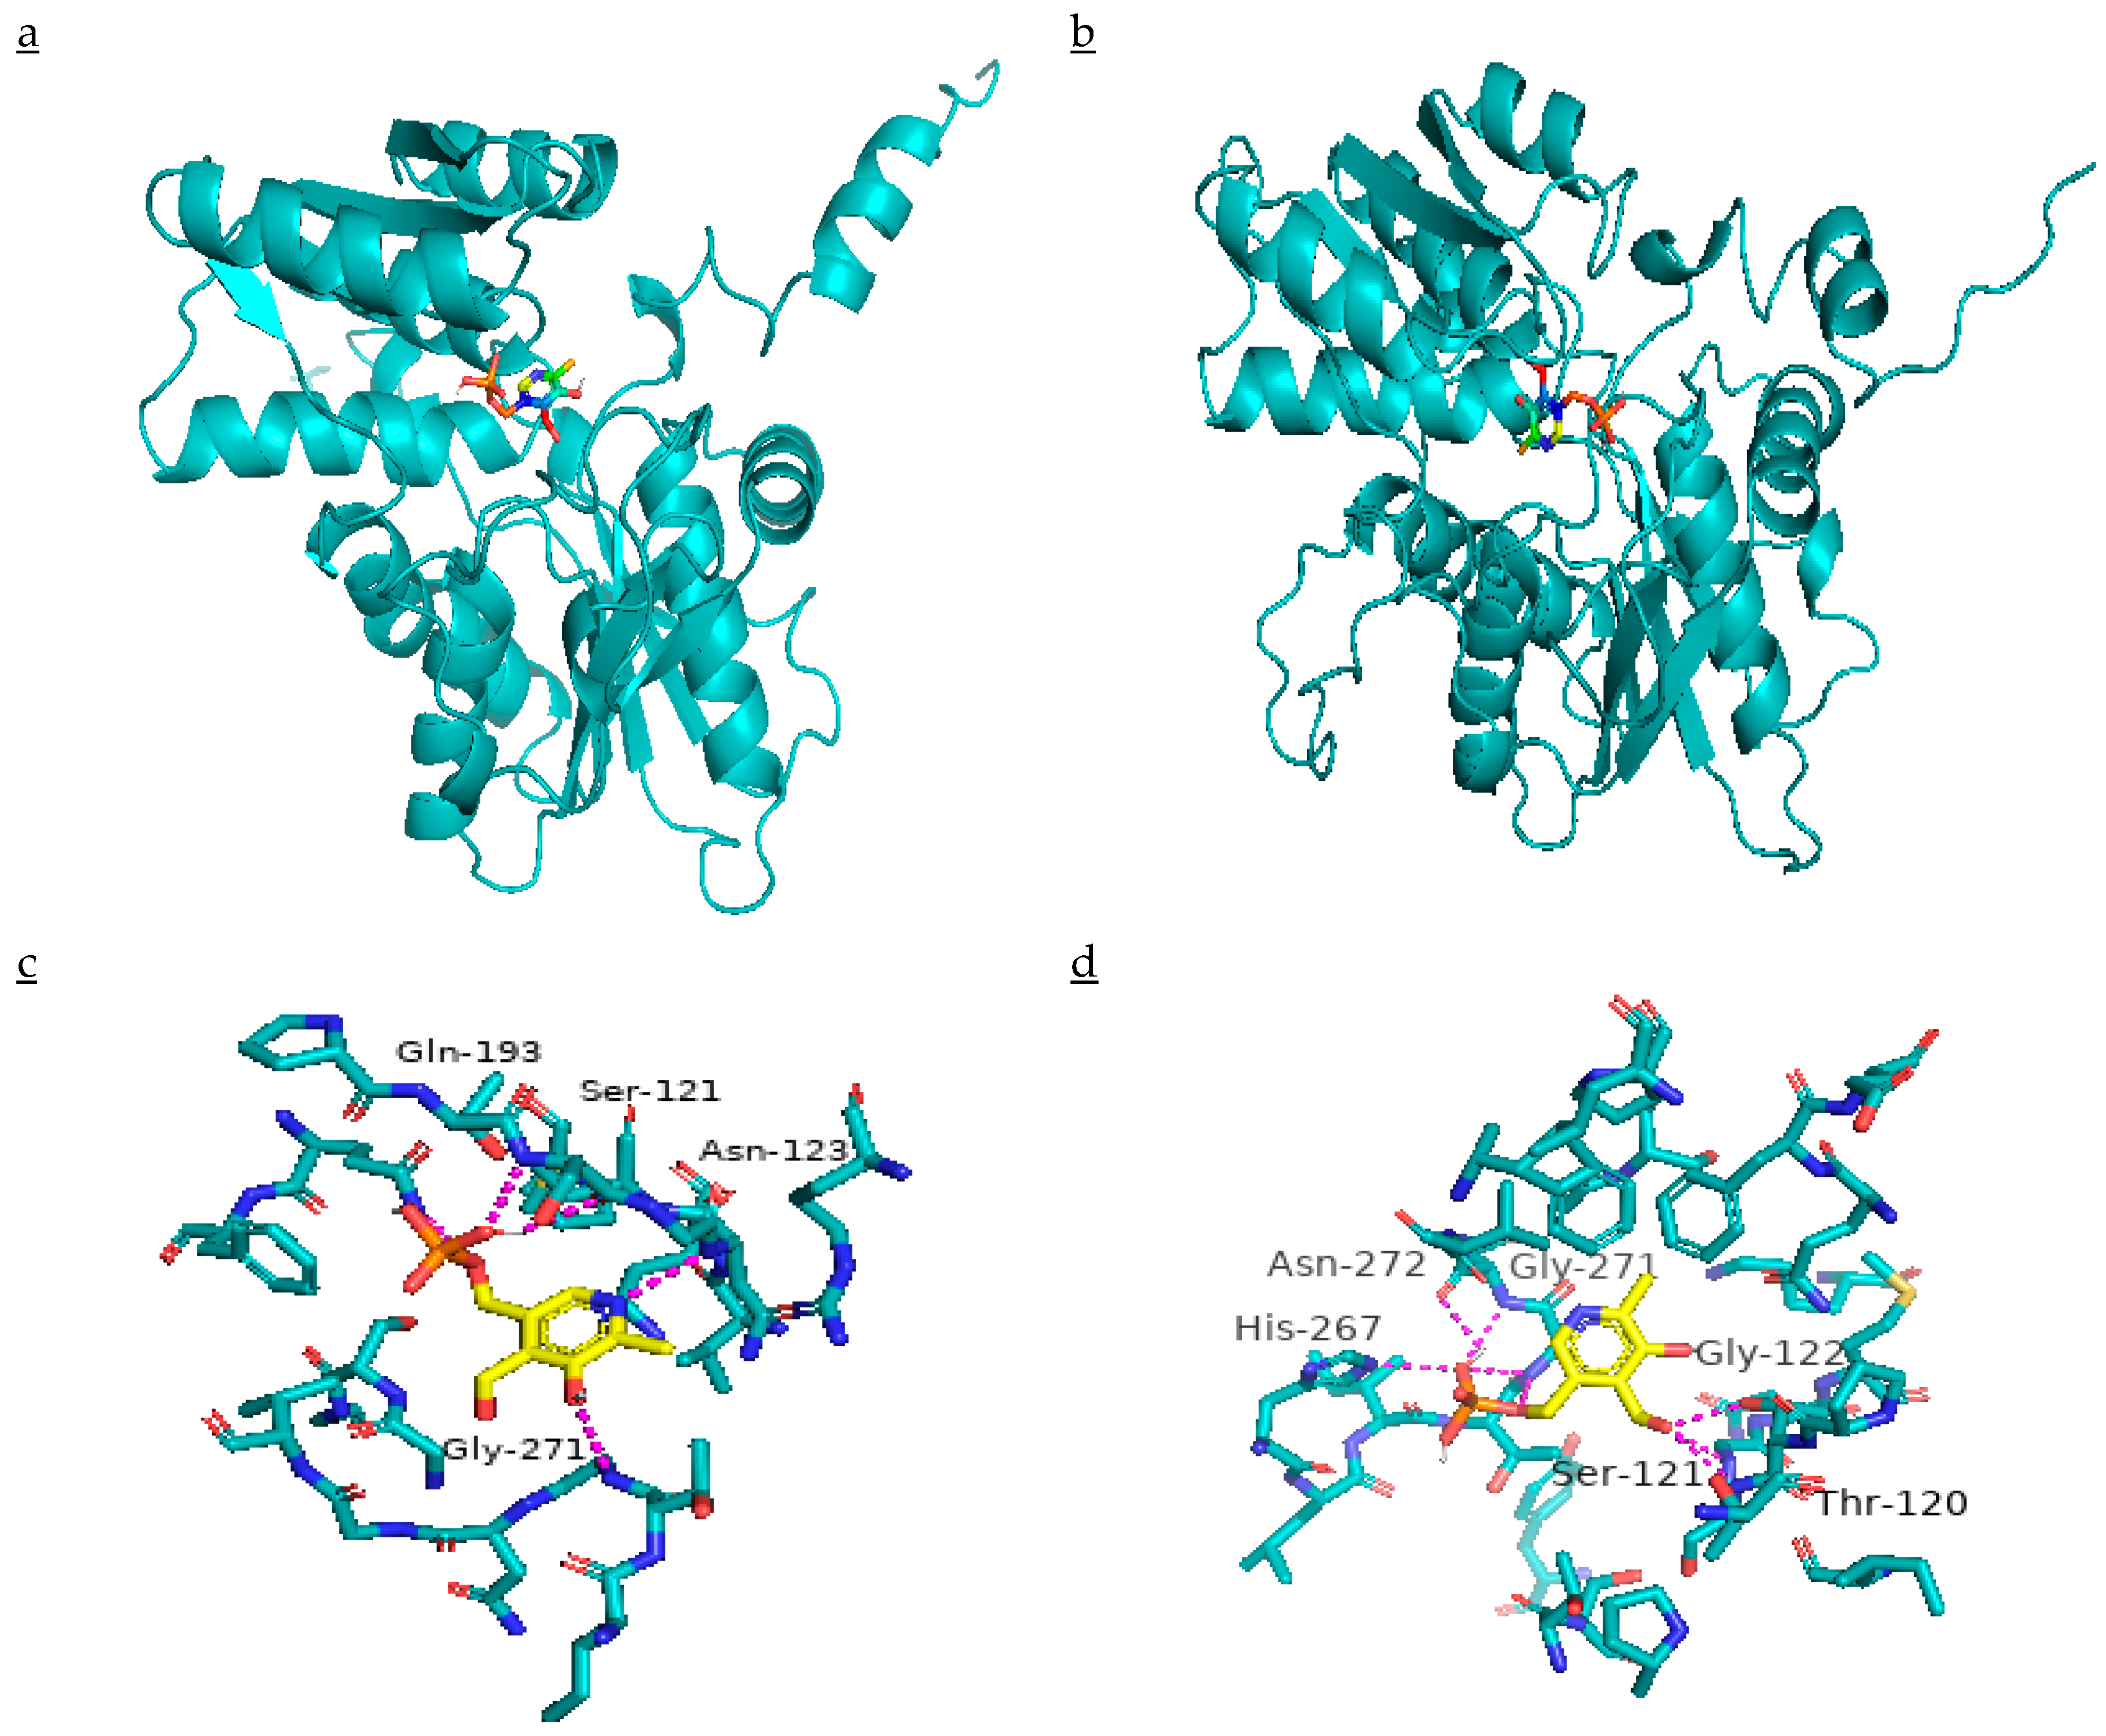
2.7. Effect of Mutation on β-CAS Structure and its Docking with PLP

Three amino acid mutations exhibited the change in ΔΔG (Gibbs free energy) of resistant β-CAS as compared to susceptible ones. Site-Directed Mutator (SDM) predicted ΔΔG values resulted due to Asn-105-Lys, Gln-195-Glu, and Gly-298-Val substitutions being 0.7, 0.01, and 0.72 kcal mol−1, respectively. The model parameters are given in Supplementary Table S1. According to SDM, ΔΔG > 0 kcal mol−1 indicates increased stability of structure due to mutation. Three-dimensional structures of β-CAS are shown in Figure 8a,b. The binding of PLP shows the active sites in the structure (Figure 8c,d). Three amino acid mutations affected the binding of PLP with β-CAS as PLP was bound with Ser-121, Asn-123, Gln-193, and Gly-271 amino acids in susceptible β-CAS, while in the resistant one, it was bound to Thr-120, Ser-121, Gly-122, His-267, Gly-271, and Asn-272. Molecular docking results revealed that binding free energy was decreased (−0.61 to −0.72 kcal mol−1) as the result of mutations that made resistant β-CAS to combine with its cofactor PLP more convenient.

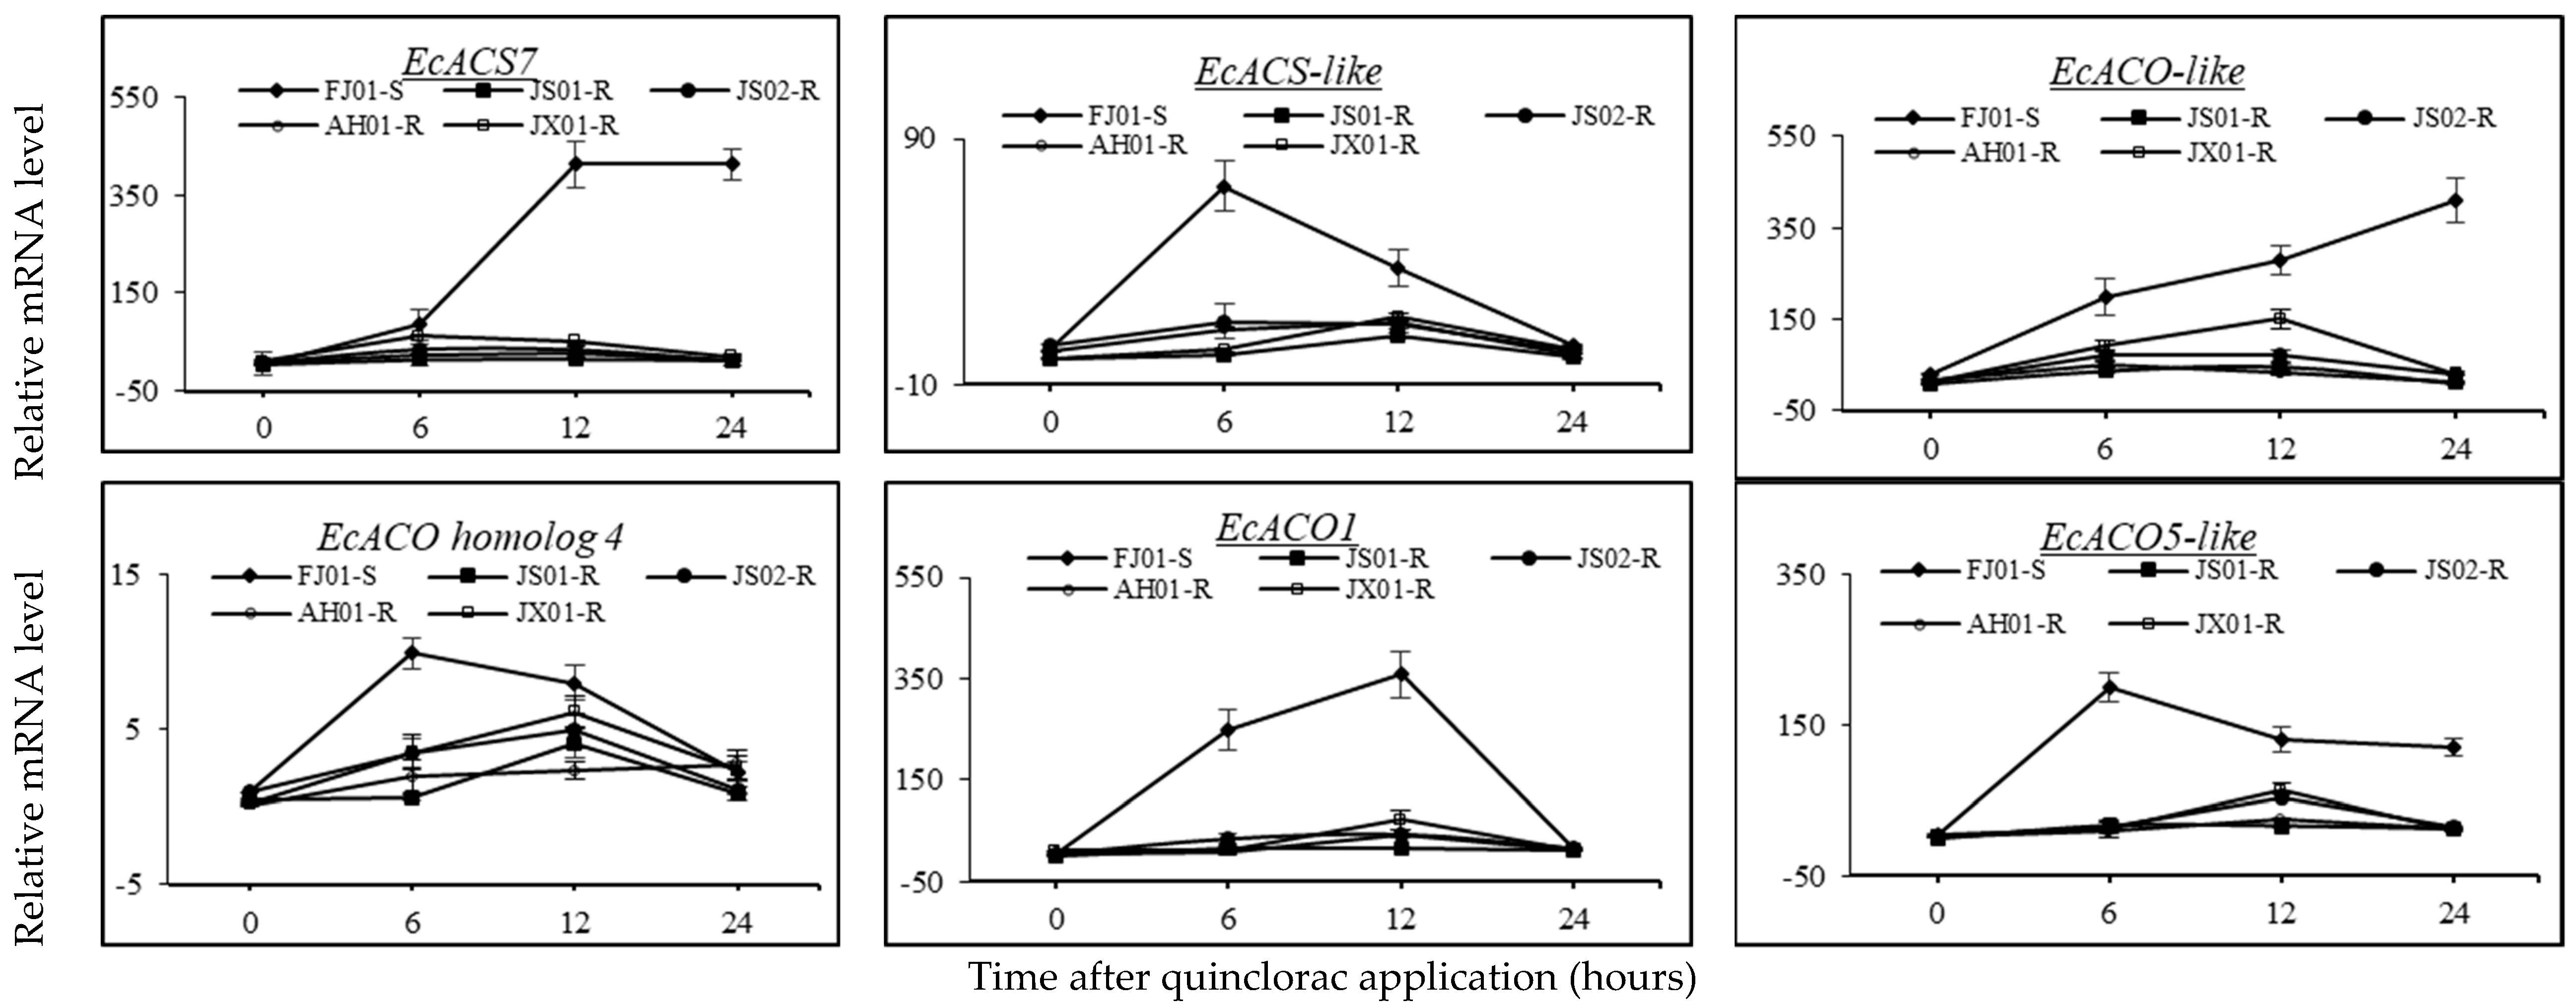
2.8. Effect on the Expression Pattern of ACS and ACO Genes

The relative expression levels of ACS and ACO genes were studied at 0, 6, 12, and 24 HAT showed that the JS01-R did not express the significant increase in relative mRNA levels of all genes under study (Figure 9). Nonetheless, EcACS7, EcACS-like, EcACO1, EcACO-like, and EcACO5-like relative expression levels showed a remarkable upregulation as compared to 0 HAT in the FJ01-S biotype. The relative expression levels of these five genes were upregulated by 15-, 16-, 47-, 6-, and 37-fold at 6 HAT in FJ01-S. Furthermore, the upregulation of these genes (EcACS7, EcACS-like, EcACO1, EcACO-like, and EcACO5-like) in FJ01-S was 77-, 8-, 68-, 12- and 24-fold at 12 HAT, respectively, compared to 0 HAT. Expression levels of EcACS-like and EcACO5-like peaked at 6 HAT, while in the case of ECACO1, at 12 HAT. A decline in expression levels of the aforementioned genes was observed in later hours. EcACS7 and EcACO-like did not show any decrease in relative expression levels until 24 HAT, as these were upregulated by 77- and 13-fold, respectively, compared to 0 HAT in FJ01-S (Figure 9).
Relative expression levels of EcACS7, EcACS-like, EcACO1, EcACO-like, and EcACO5-like were increased slightly in JS02-R, AH01-R, and JX01-R. Nevertheless, they were significantly lower than the increase in FJ01-S. A slight induction of expression levels was observed in EcACO homolog 4 in FJ01-S and JX01-R biotypes. Relative transcript levels peaked at 6 HAT in FJ01-S and relatively maintained till 12 HAT, while the relative expression level in JX01-R peaked at 12 HAT and decreased after.

2.9. Effect on Transcript Level of EcCAS Gene

The relative transcript level of EcCAS observed from E. crus-galli var. mitis depicted that untreated resistant biotypes have higher (p < 0.05) relative mRNA levels as compared to control as the 1.4–2.6-fold increase was observed (Figure 6b). The quinclorac application resulted in a decline of EcCAS transcript levels in the susceptible biotype (FJ01-S) as, at 24 HAT, it decreased to half of that of the untreated plants. EcCAS transcript level was maintained by resistant biotypes till 24 HAT and did not increase significantly as compared to the untreated plants. At 12 HAT, the transcript level in the resistant biotypes depicted a 1.73–4.32-fold increase as compared to the susceptible biotype (Figure 6b).

3. Discussion

A long history of using quinclorac in rice fields can be held responsible for the quinclorac resistance outbreak in Echinochloa species. Quinclorac resistance was confirmed in E. crus-galli var. mitis. Misuse of quinclorac led to the evolution of resistance in these biotypes against this herbicide. As it is proposed earlier, the misuse of herbicide can lead to resistant weed species [25,26,28,40,45].
Quinclorac (auxin-type herbicide) is held responsible for ACS de novo synthesis initiation, ultimately leading to ethylene level increment and an upsurge in cyanide content in susceptible plants [18,30,46,47]. Ethylene (major plant hormone) is responsible for plant death and senescence [48]. Enzymes responsible for energy metabolism and respiration (cytochrome c oxidase in mitochondria) were severely affected by increased cyanides in quinclorac-susceptible biotypes [33,49]. Ethylene biosynthesis inhibition has been reported as a possible mechanism for quinclorac resistance in barnyard grass [18,19,38,47,50]. In the present study, a distinction in ethylene levels between resistant and susceptible strengthen the fact that quinclorac resistance is linked with ethylene biosynthesis inhibition, as it was formerly documented for other species in the literature [18,19,30,47]. In this study, quinclorac caused growth inhibition by increasing ethylene concentration in FJ01-S, which confirms the positive correlation between growth inhibition and ethylene production (Figure 4a). Therefore, the role of higher ethylene concentration in quinclorac phytotoxicity is validated [18,22,30,47,51].
ACS and ACO gene families were found controlling ethylene biosynthesis [34,52]. Auxin is responsible for the induction of twelve ACS genes found in Arabidopsis [53]. Previously, it was found that the increase in ethylene biosynthesis was related to the upregulation of ACS and ACO genes in quinclorac sensitive E. crus-galli var. zelayensis [19]. In the present study, different relative expression levels of EcACS7, EcACS-like, EcACO1, EcACO-like, and EcACO5-like genes were observed in quinclorac-resistant and susceptible E. crus-galli var. mitis. Changes in expression levels and changes in herbicide target tertiary structure can cause resistance [12,53]. This study presented that expression levels of EcACS7, EcACS-like, EcACO1, EcACO-like, and EcACO5-like a showed >10-fold increment in FJ01-S (quinclorac-susceptible biotype), while relative expression induction was lower in resistant biotypes.
ACC (precursor of ethylene) is converted from SAM by the activity of ACS; then, it is converted into ethylene (by the ACO activity) [23]. Considering the role of quinclorac in ethylene biosynthesis induction, ACC content, ACS, and ACO activities were mandatory for the quinclorac resistance mechanism study. Alongside this, β-CAS activity was essential to study to explore the cyanide detoxifying ability of resistant biotypes. In the present study, quinclorac application induced a higher increase in ACC, ACS, and ACO activities in FJ01-S as compared to resistant biotypes. Consequently, low ethylene production was recorded in resistant biotypes than susceptible ones. Previous studies also documented that the increase in ACC, ACS, and ACO activities was higher in quinclorac-susceptible biotypes than resistant ones [18,30,44,46,47]. In the present study, quinclorac-resistant biotypes exhibited a higher β-CAS activity as compared to susceptible ones; hence, cyanides produced after quinclorac application were detoxified more efficiently by these biotypes. Low β-CAS activity in the susceptible biotype resulted in cyanide accumulation in plants. Moreover, accumulated cyanides can trigger the ACS activity, thus causing more production of ethylene and cyanide [44]. So, cyanide degradation ability by β-CAS activity in resistant biotypes helped them to escape from more ethylene production by triggering the ACS. Down-regulation of EcCAS transcript levels in the susceptible biotype and maintenance of relative mRNA levels in the resistant ones as a result of quinclorac application support the positive correlation of quinclorac resistance with β-CAS activity. It can be inferred that ethylene response pathway alteration, as well as cyanide degradation, were responsible for quinclorac resistance in E. crus-galli var. mitis, as found in previous studies regarding E. crus-galli var. zelayensis [18,37]. In the present study, quinclorac resistance might be caused by decreased ACS and ACO activities in resistant biotypes, as quinclorac-susceptible biotype exhibited an increase in ACS (2–3 times) and ACO (2–4 times) activities than resistant ones. These results strengthen the role of ethylene biosynthesis inhibition conferring quinclorac resistance.
The molecular study of the EcCAS gene exhibited that there were three mutation points causing Asn-105-Lys, Gln-195-Glu, and Gly-298-Val substitutions in resistant biotypes as compared to susceptible ones. Differential gene expression and mutations can cause non-target enzyme activity [15,54]. Altered gene expression as a result of mutations can be held responsible for herbicide resistance [11,12]. The EcCAS amino acid sequence analyzed on the website http://www.ebi.ac.uk/interpro/, revealed that mutations at 105, 195, and 298 positions are part of a domain (Domain ID IPR001926) and it consisted of 286 amino acid. Its molecular function is L-3-cyanoalanine synthase activity and cysteine synthase activity, and it involves biological processes like cyanide metabolic process and cysteine biosynthetic process from serine. In resistant biotypes, Asn-105-Lys, Gln-195-Glu, and Gly-298-Val substitution lying motifs α1, β6B, and β9A [35], respectively, were found similar to rice (quinclorac tolerant) [36]. The amino acid sequence comparison with other species CAS gene sequences revealed that these mutations were in accordance with wheat and most of the other species at the same nucleotide positions (Supplementary Figure S1). PLP working as cofactor binds β-CAS with cysteine; this repositioned the amino acid to be attacked by CN and led to the production of β cyanoalanine [55]. Molecular docking of PLP with β-CAS provided an insight of bonding alteration among quinclorac-resistant and susceptible β-CAS enzymes. By making polar bonds with six amino acid subunits in the active site, resistant β-CAS depicted lower binding free energy, hence making bonding easier and more firm than susceptible ones. All biological processes in cells are regulated by protein–protein interactions. Protein affinity and structure stability can severely be affected by mutations in protein, resulting in a malfunction in the network of protein interaction [56]. β-CAS enzyme structure stability predicted by SDM depicted that these three mutations are not contributing to structure destabilization; hence, these play a role in stabilizing the structure of the enzyme. On the other hand, single nucleotide polymorphism (SNP) in the β-CAS gene of quinclorac-resistant E. phyllopogan as compared to the susceptible biotype was found to be not correlated with quinclorac resistance [38]. The reported mutation occurred at intron and quinclorac sensitive biotypes lacking that mutation caused alternative gene splicing. Nevertheless, the mentioned SNP did not cause any change in the translated amino acid sequence, so increased β-CAS activity due to the prevention of alternative splicing may not be correlated with quinclorac resistance. However, in the present study, three-point mutations were found in the EcCAS gene of quinclorac-resistant E. crus-galli var. mitis, which resulted in amino acid substitutions. It is a fact that HCN produced during ethylene biosynthesis is degraded by β-CAS enzyme activity [35]. So, the mutation in the respective gene helped to maintain enzymatic activity even after the quinclorac application. Moreover, β-CAS activity can still be correlated to quinclorac resistance. Mutations in Arabidopsis Starch Synthase III were found to increase enzyme expression level and its activity [57]. Numerous studies documented that mutations in gene resulted in increased enzyme activity [39,58]. In the present study, molecular simulation results revealed that these mutations are favoring the bonding between the enzyme and its cofactor by stabilizing the structure, decreasing the binding free energy, and increasing its binding site residues. Mutations can increase the affinity of the enzyme to its substrate [59]. Moreover, mutations can lead to structural stability [60]. This can be inferred that these mutations in the EcCAS gene proved to be favorable in terms of increased β-CAS enzyme activity.
So, keeping in the context of these results, less inducible expression of EcACS7, EcACS-like, EcACO1, EcACO-like, and EcACO5-like genes resulted in a decrease of ACS and ACO activities. On the other hand, the higher β-CAS activity, the lower binding free energy of β-CAS enzyme, and mutations in the EcCAS gene resulting in its differential transcript levels among resistant and susceptible biotypes, ultimately leading to reduced ethylene biosynthesis coupled with improved cyanide degradation, hence causing quinclorac resistance.

4. Materials and Methods

4.1. Plant Material

Seeds of E. crus-galli var. mitis were collected from different rice fields of Jiangsu (Funing 33°76′ N/119°93′ E; Yixing 31°36′ N/119°63′ E), Anhui (Dongzhi County 30°56′ N/117°59′ E), Jiangxi (Yifeng 28°38′ N/115° 81′ E), and Fujian (Pucheng, 27°80′ N/118°44′ E) provinces in China during fall 2016 (Supplementary Figure S2). These two sites from Jiangsu province and the latter two ones were subjected to quinclorac application for more than 15 years and 10 years, respectively, except for the Pucheng site. Seeds were shade dried and stored at room temperature. These seeds were examined for a different level of quinclorac in a Petri plate assay. A susceptible biotype (S) from Fujian province (Pucheng, 27°80′ N/118°44′ E) was used for comparative analysis. Seeds of all biotypes were planted in the field (30 and 50 plants for R and S biotypes, respectively). The seedlings at 3–4 leaf stage were subjected to a quinclorac field dose (300 g a.i. ha−1), and half of the S seedlings were not sprayed. The inflorescence of each plant was covered (35 days after emergence) with a butter paper bag to avoid the cross-pollination between different biotypes. F1 generations of four surviving biotypes of the quinclorac field dose were further used in the study and were designated as resistant biotypes (R). The F1 generation of S seedlings that were not sprayed with quinclorac was further used in the study. All five biotypes were named as per their province names: JS01-R, JS02-R, AH01-R, JX01-R, and FJ01-S (R and S representing the resistant and susceptible biotypes).

4.2. Chemical

Quinclorac used in the present study was purchased from Jiangsu Futian Agricultural Chemicals (Nanjing, China). Poly (vinylpolypyrrolidone), polyvinylpyrrolidone, Dithiothreitol (DDT), Tricine, and SAM were bought from Solarbio Science and Technology Co. Ltd. (Beijing, China). Sodium bicarbonate, ACC, and MOPS were purchased from MDBio Inc (Taipei, Taiwan). 5-Sulfosalicylic acid dehydrate, and sodium hypochlorite were obtained from BBI Life Science and Sangon Biotech (Shanghai, China).

4.3. Quinclorac Resistance

4.3.1. Petri Plate/Seed Bioassay

Seeds of R and S biotypes were incubated on wet filter papers (Whatman No. 1; Sigma-Aldrich, St. Louis, MO, USA) containing five varying concentrations of quinclorac (1200, 600, 300, 150, 75 mg L−1), along with quinclorac free control (distilled water). Plastic Petri plates (9 cm diameter) were purchased from Shanghai Joylab Medical Instruments Co. Ltd. (Shanghai, China) and used in the study, each containing 15 seeds of either biotype. Each Petri plate was irrigated with either 5 mL herbicide solution or distilled water as per treatment and rehydrated when needed (approximately 3 days interval) with distilled water. The experiment was conducted in a growth chamber set at 60% relative humidity; day/night period was 14/10 h having 8000 lux light intensity, and 26/18 °C temperature. The shoot length of five random seedlings per Petri plate was measured after 9 days and averaged after. The experiment was conducted twice with three replications per treatment.

4.3.2. Resistance Confirmation in Pot Assay

For whole-plant bioassay, seeds of each biotype were grown in a plastic pot (12 cm diameter) containing a 2:1 mixture of sand and organic soil (NPK ≥2%, organic matter ≥35%, and pH = 5.5–6.5) purchased from Zhenjiang Peilei Organic Fertilizer Co. Ltd. (Zhenjiang, China). Pots were placed in watered containers to provide sub-irrigated conditions for plant growth. Growth conditions were the same as described in Section 4.3.1, and 5 seedlings were maintained per pot. At 3–4 leaf stage, quinclorac was sprayed with a laboratory sprayer equipped with a flat fan nozzle (3WPSH-500D, Nanjing, China), with a delivering capacity of 280 L ha−1 at 230 kPa [18]. Quinclorac dose rates were 0, 75, 150, 300, 600, and 1200 g a.i. ha−1 for R biotypes and 0, 37.5, 75, 150, 300, and 600 g a.i. ha−1 for S biotype. Above ground plant parts were clipped after three weeks of herbicide spray, and fresh weight was measured. The experiment was conducted twice using three replications for each treatment.

4.4. Ethylene Production by R and S Biotypes

To find the quinclorac resistance in R biotypes associated with ethylene biosynthesis inhibition, an experiment was conducted having four replicates. Quinclorac with four varying concentrations (0, 150, 300, 600 g a.i. ha−1) was sprayed on R and S biotypes at 3–4 leaf stage. Plant shoots from each treatment were clipped at varying time intervals (0, 12, 24, 48, 96 h after spray) and incubated in a 15 mL tarred screw-neck vial for five hours at 25 °C. The quantitative determination of ethylene was carried out by Abdallah’s method with a few modifications [18]. After incubation, a syringe was used to withdraw 1 mL gas and injected into GC system 7890A (Agilent Technologies, Santa Clara, CA, USA) equipped with a column and flame ionization detector to measure the ethylene quantity. The temperature was set at 70, 200, and 250 °C for injector, detector, and column, respectively. The flow rates were 30, 300, and 30 mL min−1 for N2, air, and H2, respectively. The ethylene contents were measured in nmol g−1 fresh weight h−1 of incubation. Another set of the same experiment was run alongside and shoot fresh weight was measured 7 days after spray and expressed as percent of mean untreated control.

4.5. Effect on Endogenous ACC Levels

An experiment was carried out to find out whether quinclorac application attributed to the difference in ACC levels of R and S biotypes. The dose of quinclorac and sampling times were the same as for ethylene quantitative determination. ACC (nmol g−1 plant fresh weight) contents were measured as described earlier [45,61] with some modifications [62]. After powdering in liquid N2, 0.2 g shoot tissue was extracted in 0.4 mL 5% sulfosalicylic acid [62]. ACC in samples was chemically converted into ethylene, HgCl2 was used to stop the conversion of ACC into ethylene before its measurement by GC system.

4.6. Effect on ACS Activity

ACC (precursor for ethylene biosynthesis) is transported to shoot from roots. So, the activity of ACS is mainly confined in roots [46]. Hence, ACS activity (pmol g−1 root fresh weight h−1 of incubation) was measured from root tissues at 24 h after treating the plants with quinclorac (0, 150, 300, 600 g a.i. ha−1) by following the Grossmann methods [44,46]. The crushed frozen sample of 0.5 g was centrifuged with extraction solution (100 mM potassium phosphate buffer (pH 8.5), 10 μM leupeptin, 6 μM PLP, and 5 mM DTT) at 15,000× g at 4 °C for 15 min. The supernatants were eluted from Sephadex G- 25 desalting columns after equilibration with 5 mM potassium phosphate buffer containing 6 μM PLP and 1 mM DTT. Enzyme preparation (0.3 mL) was incubated for 2 h at 37 °C with ACS assay mixture (20 μM PLP and 100 μM SAM in 80 mM potassium phosphate buffer (pH 8.5)). Lastly, the reaction was stopped by adding 20 μmol HgCl2. During the incubation time, ACS activity was investigated by monitoring ACC levels. When the reaction was quenched at time zero, the background level of ACC could be determined by its conversion into ethylene.

4.7. Effect on ACO Activity

ACC is converted to ethylene by the activity of ACO. Plants were treated with quinclorac (0, 150, 300, and 600 g a.i. ha−1) to find out whether there is a difference between R and S biotypes regrading ACO activity (pmol g−1 root fresh weight h−1 of incubation). Shoot samples were collected 24 h after spray. ACO activity was measured following the method of Bulens [62]. Polyvinylpolypyrrolidone (50 mg), 0.5 g crushed frozen sample, and 1 mL MOPS extraction buffer (400 mM, pH 7.2), MOPS, glycerol (10% v/v), and ascorbic acid sodium salt (30 mM) were vortexed until a homogenous mixture was obtained. Samples were incubated in thermomixer for 10 min at 4 °C, followed by centrifugation at 22,000 for 30 min at the same temperature. Supernatants were allowed to react with MOPS reaction buffer (50 mM, pH 7.2), MOPS, glycerol (10% v/v), ascorbic acid sodium salt (5 mM), sodium bicarbonate (20 mM), iron sulfate (0.02 mM), ACC (1 mM), and DTT (1 mM) in a glass vial having a rubber stopper on the water bath at 30 °C for 1 h. After incubation, headspace gas was withdrawn by syringe, and ethylene was measured by the GC system following the method described earlier. ACO activity of samples was calculated by subtracting the quantity of non-enzymatic ethylene production from reaction buffer.

4.8. Cyanide Detoxification by β-CAS

The β-CAS activity was determined to find the difference in cyanide detoxification by R and S biotypes. Germinated seeds of five biotypes were cultured in Kasugai nutrient solution (hydroponically) till 3–4 leaf stage. The growth conditions of the incubator were the same as described in Section 4.3.1. At this stage, quinclorac (50 μmol L−1 (μM)) was added to the nutrient solution. Plant samples were collected 0, 12, and 24 h after adding quinclorac. The β-CAS activity was determined by the previously described procedure [63]. Then, 0.1 M Tris-HCl buffer (pH 8.5) was used to extract the powdered shoots. The supernatant was used in enzyme analysis after centrifuging it for 10 min at 4 °C and 10,000× g. Enzyme extract (0.2 mL) was incubated at 35 °C for 30 min with the same extraction buffer containing 3 mM L-cysteine and 25 mM NaCN in a total volume of 1 mL. Using standard (Na2S), absorbance was measured at 650 nm after adding 100 µL of each 30 mM FeCl3 in 1.2 N HCl and 20 mM N, N-dimethyl-p-phenylenediamine in 7.2 N HCl.

4.9. EcCAS Gene Sequence

Partial sequence of EcCAS in E. crus-galli var. mitis was determined by using primers (F-CCGTCCTTCAGCGTCAAA, R- ATGCCAACCAAAAGACCCT, TM = 55 °C), designed based on EcCAS cDNA sequence from E. crus-galli var. zaleyensis (KY922855.1). Plant Easy Spin RNA Miniprep Kit (Biomiga, San Diego, CA, USA) was used for the total RNA extraction, while cDNAs were synthesized by PrimeScript™ RT Reagent Kit with gDNA Eraser (TaKaRa, Otsu, Japan). Partial amplification was carried out in total volume of 50 µL (TaKaRa ExTaqTM 0.4 µL, 10× Taq Buffer 5 µL, MgCl2, and dNTP 4 µL each, cDNA, forward and reverse primers 2 µL each, ddH2O 30.6 µL) using TaKaRa PCR Thermal Cycler (TaKaRa, Otsu, Japan) with PCR profile consisting of denaturation at 94 °C for 4 min, then 28 cycles at 94 °C, 55 °C, and 72 °C for 30, 30, and 60 s, respectively, followed by 10 min at 72 °C. The PCR product was gel-purified by Gel/PCR Extraction Kit (Biomiga, San Diego, CA, USA). The purified cDNA was cloned in E. coli DH5α Competent Cells (Clontech, Mountain View, CA, USA) by pMDTM 19-T Vector Cloning Kit (Clontech, Mountain View, CA, USA) and sent to Sangon Biotech (Shanghai, China) for sequencing.
Rapid Amplification of cDNA Ends (RACE) was carried out using SMARTer® RACE 5′/3′ Kit (Clontech, Mountain View, CA, USA) using the primers (5′-RACE-CCCTTKTTTTCAGCATCTTCCAACATTGAA, 3′-RACE-AAAGTGAGGATGCTGKTAAGATGGCTCGAGA, TM =< 70 °C) and following the instructions provided by the company. PCR product was gel purified and sent to the company for sequencing. Sequences were aligned by using BioEdit Sequence Alignment Editor [64]. To find the ORF of the EcCAS gene. the ORF finder function was used on the NCBI website (https://www.ncbi.nlm.nih.gov/orffinder/). Then, it was amplified by primers (F- CACACACAAAAACAGCGAGT, R- ACACAGTTGCCAGGAAGTTT, TM = 54 °C) and sequenced (4 individual plants and 6 clones from each replicate) from the company following the same procedure as described above.

4.10. Computational Study of β-CAS Binding with PLP and Its Structure Stability

Homology modeling of quinclorac-resistant and susceptible β-CAS structure was carried out using 3VBE as a template protein. Protein Homology/Analogy Recognition Engine (Phyre2) [65] was used to construct the 3D structure. The PLP structure was downloaded from PubChem (CID: 1051). AutoDock Tools v. 1.5.6 (Molecular Graphics Laboratory, The Scripps Research Institute, San Diego, CA, USA) was used to prepare both structures for docking. Docking of β-CAS and PLP was carried out using AutoDock Vina v. 1.1.2 (Molecular Graphics Laboratory, The Scripps Research Institute, San Diego, CA, USA). Docking grid box size (Å) was X:44.36, Y:70.57, and Z:54.19 for the quinclorac-susceptible β-CAS enzyme, and X:63.35, Y:51.03, and Z:44.69 for the resistant ones. Docking results were viewed and extracted by PyMOL v. 2.3.3 (Schrödinger, Inc New York, NY, USA). SDM [66] was employed to compute the Gibbs free energy {ΔΔGsusceptible→resistant(kcal mol−1} of the β-CAS enzyme structure.

4.11. Real-Time PCR Based Expression Analysis of ACS, ACO, and CAS Genes

Seeds of five biotypes were grown as described in Section 4.8. Plant samples were collected 0, 6, 12, and 24 h after adding quinclorac and stored at −70 °C until further analysis. Six genes (four ACO and two ACS) were selected based on the previous study on E. crus-galli var. zaleyensis [19] as well as the EcCAS gene (Genbank accession no. MN815009 and MN815010) sequenced in the present study. cDNA sequence of EcACS7 (KY963550), EcACS-like (KY963549), EcACO-like (KY963552), EcACO homolog 4 (KY963556), EcACO1 (KY963554), and EcACO5-like (KY963548) were obtained from the NCBI website (www.ncbi.nlm.nih.gov/nuccore/) and further used for primer designing (Table 4). The reference gene used in this study was EcActin (HQ395760; Table 4). cDNA was synthesized as described in Section 4.9. Gene expression analysis of five biotypes of E. crus-galli var. mitis was performed by using SYBR® Premix Ex TaqTM (Tli RNAaseH Plus; TaKaRa, Otsu, Japan) on real-time PCR (Eppendorf Mastercycler® Realplex2, Eppendorf North America Inc, Hauppauge, NY, USA). The reaction was conducted in a total volume of 10 µL, containing 5 µL SYBR® Premix Ex TaqTM, 0.4 µL primers, 0.8 µL cDNA (adjusted to the same concentration), and 3.8 µL ddH2O. PCR profile was as follows: 95 °C for 30 s, 40 cycles at 95 °C for 5 s, and 60 °C or 30 s. Relative transcript levels were calculated by the ΔΔCt method [67] with three biological and four technical replicates. Up- or down-regulation of gene expressions triggered by quinclorac application was determined by the t-test (p < 0.05) and fold change (threefold).

4.12. Statistical Analysis

Dose–response assays (Petri plate and pot assay) were conducted twice in triplicate. The experiments related to ethylene concentration, ACC contents, ACS, ACO, and β-CAS activities were conducted twice in quadruplicate. A completely randomized design was used for all experiments. Percent of shoot length/fresh weight reduction in relation to the untreated control was calculated and further used for calculations. EC50 (Petri plate assay) and GR50 (pot assay) values (effective concentration to inhibit growth by 50%) were calculated in Origin Pro 8 SR0 (v. 8.0724 (B724), Origin Labs Corporations. MA 01060. USA. http/:www.originlab.com) by using the dose–response function (growth/sigmoidal).
y = A 1 + A 2 A 1 1 + 10 ^ ( l o g x 0 x ) p
where A1 and A2 are bottom and top asymptote, respectively, X is quinclorac dose, Xo is quinclorac dose required to cause 50% growth inhibition, and p is the slope.
Resistance level was calculated by dividing the GR50 of each R population with GR50 of S population. EC50 ratio is the ratio between EC50 of each R population with S population. Primer Premier 5 (PREMIER Biosoft International, San Francisco, CA, USA) was used to design primers. Microsoft Excel 2019 was used to draw the graphs. SPSS version 24 (SPSS, Chicago, IL, USA) was used for Pearson correlation analysis and to construct ANOVA.

5. Conclusions

Vivid induction of expressions of EcACS7, EcACS-like, EcACO1, EcACO-like, and EcACO5-like genes in quinclorac-susceptible biotype (FJ01-S) of E. crus-galli var. mitis after herbicide treatment gave rise to ACC synthase and ACC oxidase enzyme activities, which resulted in increased ethylene biosynthesis. On the other hand, the quinclorac-resistant biotype (JS01-R) did not show any remarkable increase in the relative expression of these genes. Hence, low activities of ACC synthase and ACC oxidase enzymes were observed, which led to low ethylene biosynthesis and possibly caused quinclorac resistance. FJ01-S depicted a decline in the transcript level of the EcCAS gene post-treatment with quinclorac; hence, cyanides produced during ethylene biosynthesis were accumulated due to lower β-CAS activity. Mutations in the EcCAS gene of resistant biotypes resulted in enzyme structure alteration, thus decreased binding free energy and helped them to maintain gene transcript levels as well as upsurge the β-CAS activity; hence, cyanide was degraded efficiently. The other biotypes were found less resistant as compared to JS01-R. This can be justified by a slight induction of EcACS7, EcACS-like, EcACO1, EcACO-like, and EcACO5-like gene expression. This caused a little increase in ACC synthase and ACC oxidase enzyme activities as well as ethylene levels. However, this overall increase was far lower than in the FJ01-S biotype, hence causing a moderate quinclorac resistance in these biotypes. However, further investigations are required, whether quinclorac induces a lesser amount of ethylene first or directly inducing the EcACS7, EcACS-like, EcACO1, EcACO-like, and EcACO5-like genes upregulation by acting as a signaling substance.

Supplementary Materials

Supplementary materials can be found at https://www.mdpi.com/1422-0067/21/5/1573/s1.

Author Contributions

Conceptualization, M.Z.U.H. and Q.S.; validation, M.Z.U.H., Z.Z., J.W. and Q.S.; formal analysis, M.Z.U.H., Z.Z., J.W. and S.Q.; investigation, M.Z.U.H.; resources, Z.Z., J.W.; data curation, M.Z.U.H. and J.W.; writing—original draft preparation, M.Z.U.H.; writing—review and editing, S.Q.; visualization, M.Z.U.H., Z.Z., J.W. and S.Q.; supervision, S.Q.; project administration, S.Q.; funding acquisition, S.Q. All authors have read and agreed to the published version of the manuscript.

Funding

This work was supported by the National Key Research and Development Program of China (2016YFD0200805).

Acknowledgments

The authors are thankful to Yu Qin (Australian Herbicide Resistance Initiative, School of Agriculture and Environment, University of Western Australia, WA 6009, Australia) for her valuable comments on the manuscript. Authors thank Yang Xiang Hong (Doctoral Student, Weed Research Laboratory, College of Life Sciences, Nanjing Agricultural University, Nanjing 210095, China) for his guidance in molecular work.

Conflicts of Interest

The authors declare no conflicts of interest.

Abbreviations

ACC1-aminocyclopropane-1-carboxylic acid
ACS1-aminocyclopropane-1-carboxylic acid synthase
ACO1-aminocyclopropane-1-carboxylic acid oxidase
β-CASβ-cyanoalanine synthase
EcCASEchinochloa crus-galli var. mitis β-cyanoalanine synthase
AsnAsparagine
LysLysine
GlnGlutamine
GluGlutamic acid
GlyGlycine
ValValine
TSRTarget-site resistance
NTSRNon-target-site resistance
Aux/IAAAuxin/Indole-3-Acetic Acid
HCNHydrogen cyanide
PLPPyridoxal phosphate
ALSAcetolactate synthase
EC50Effective dose responsible for 50 % inhibitory response
GR50Effective dose responsible for 50% inhibition in growth
RIResistance Index
HATHours after treatment
ORFOpen Reading Frame
IleIsoleucine
ThrThreonine
AspAspartic acid
PhePhenylalanine
LeuLeucine
SDMSite-Directed Mutator
ΔΔGGibbs free energy
SAMS-Adenosyl-L-methionine
CNcyanides
SNPSingle nucleotide polymorphism
MOPS3-(N-morpholino)propanesulfonic acid
DDTDithiothreitol
hhours
SSusceptible
RResistant

References

  1. Agrios, G.N. Plant Pathology, 5th ed.; Academic Press: Waltham, MA, USA, 2005; p. 952. [Google Scholar]
  2. Oerke, E.C. Crop losses to pests. J. Agric. Sci. 2005, 144, 31–43. [Google Scholar] [CrossRef]
  3. Peterson, M.A.; McMaster, S.A.; Riechers, D.E.; Skelton, J.; Stahlman, P.W. 2,4-D past, present, and future: A review. Weed Technol. 2016, 30, 303–345. [Google Scholar] [CrossRef]
  4. Gould, F.; Brown, Z.S.; Kuzma, J. Wicked evolution: Can we address the sociobiological dilemma of pesticide resistance? Science 2018, 360, 728–732. [Google Scholar] [CrossRef] [PubMed] [Green Version]
  5. Kreiner, J.M.; Stinchcombe, J.R.; Wright, S.I. Population genomics of herbicide resistance: Adaptation via evolutionary rescue. Annu. Rev. Plant Biol. 2018, 69, 611–635. [Google Scholar] [CrossRef] [Green Version]
  6. Heap, I.M. The International Survey of Herbicide Resistant Weeds. Available online: http://www.weedscience.com (accessed on 21 October 2019).
  7. Powles, S.B.; Yu, Q. Evolution in action: Plants resistant to herbicides. Annu. Rev. Plant Biol. 2010, 61, 317–347. [Google Scholar] [CrossRef] [Green Version]
  8. Koo, D.H.; Molin, W.T.; Saski, C.A.; Jiang, J.; Putta, K.; Jugulam, M.; Friebe, B.; Gill, B.S. Extrachromosomal circular DNA-based amplification and transmission of herbicide resistance in crop weed Amaranthus palmeri. Proc. Natl. Acad. Sci. USA 2018, 115, 3332–3337. [Google Scholar] [CrossRef] [Green Version]
  9. Patzoldt, W.L.; Hager, A.G.; McCormick, J.S.; Tranel, P.J. A codon deletion confers resistance to herbicides inhibiting protoporphyrinogen oxidase. Proc. Natl. Acad. Sci. USA 2006, 103, 12329–12334. [Google Scholar] [CrossRef] [Green Version]
  10. Yu, Q.; Jalaludin, A.; Han, H.; Chen, M.; Sammons, R.D.; Powles, S.B. Evolution of a double amino acid substitution in the 5-enolpyruvylshikimate- 3-phosphate synthase in Eleusine indica conferring high-level glyphosate resistance. Plant Physiol. 2015, 167, 1440–1447. [Google Scholar] [CrossRef] [Green Version]
  11. Délye, C. Unravelling the genetic bases of non-target-site-based resistance (NTSR) to herbicides: A major challenge for weed science in the forthcoming decade. Pest. Manag. Sci. 2013, 69, 176–187. [Google Scholar] [CrossRef]
  12. Yuan, J.S.; Tranel, P.J.; Stewart, C.N.J. Non-target-site herbicide resistance: A family business. Trends Plant Sci. 2007, 12, 6–13. [Google Scholar] [CrossRef]
  13. Cummins, I.; Cole, D.J.; Edwards, R. A role for glutathione transferases functioning as glutathione peroxidases in resistance to multiple herbicides in black-grass. Plant J. 1999, 18, 285–292. [Google Scholar] [CrossRef] [PubMed]
  14. Cummins, I.; Wortley, D.J.; Sabbadin, F.; He, Z.; Coxon, C.R.; Straker, H.E.; Sellars, J.D.; Knight, K.; Edwards, L.; Hughes, D.; et al. Key role for a glutathione transferase in multiple-herbicide resistance in grass weeds. Proc. Natl. Acad. Sci. USA 2013, 110, 5812–5817. [Google Scholar] [CrossRef] [PubMed] [Green Version]
  15. Iwakami, S.; Endo, M.; Saika, H.; Okuno, J.; Nakamura, N.; Yokoyama, M.; Watanabe, H.; Toki, S.; Uchino, A.; Inamura, T. Cytochrome P450 CYP81A12 and CYP81A21 are associated with resistance to two acetolactate synthase inhibitors in Echinochloa phyllopogon. Plant Physiol. 2014, 165, 618–629. [Google Scholar] [CrossRef] [PubMed] [Green Version]
  16. Beckie, H.J.; Tardif, F.J. Herbicide cross resistance in weeds. Crop. Protect. 2012, 35, 15–28. [Google Scholar] [CrossRef]
  17. Wang, Q.Y.; Qiao, L.Y.; Wei, J.G.; Dong, L.Y.; Li, Y.H. A study on tolerance to pretilachlor in eight species of Echinochloa. Rice Sci. 2004, 11, 331–335. [Google Scholar]
  18. Xu, J.Y.; Lv, B.; Wang, G.; Li, J.; Dong, L.Y. A resistance mechanism dependent upon the inhibition of ethylene biosynthesis. Pest. Manag. Sci. 2013, 69, 1407–1414. [Google Scholar] [CrossRef] [PubMed]
  19. Gao, Y.; Li, J.; Pan, X.; Liu, D.; Napier, R.; Dong, L. Quinclorac resistance induced by the suppression of the expression of 1- aminocyclopropane-1-carboxylic acid (ACC) synthase and ACC oxidase genes in Echinochloa crus-galli var. zelayensis. Pestic. Biochem. Physiol. 2018, 146, 25–32. [Google Scholar] [CrossRef] [Green Version]
  20. Heap, I.M. International Survey of Herbicide-Resistant Weeds: Lessons and Limitations. In Proceedings of the Brighton Crop Protection Conference, Brighton, UK, 15–18 November 1999; pp. 769–776. [Google Scholar]
  21. He, H.B.; Wang, H.B.; Fang, C.X.; Lin, Z.H.; Yu, Z.M.; Lin, W.X. Separation of allelopathy from resource competition using rice/barnyardgrass mixed-cultures. PLoS ONE 2012, 7, e37201. [Google Scholar] [CrossRef] [Green Version]
  22. Grossmann, K. Quinclorac belongs to a new class of highly selective auxin herbicides. Weed Sci. 1998, 46, 707–716. [Google Scholar] [CrossRef]
  23. Grossmann, K. Auxin herbicides: Current status of mechanism and mode of action. Pest. Manag. Sci. 2010, 66, 113–120. [Google Scholar] [CrossRef]
  24. Busi, R.; Goggin, D.E.; Heap, I.M.; Horak, M.J.; Jugulam, M.; Masters, R.A.; Napier, R.M.; Riar, D.S.; Satchivi, N.M.; Westra, P.; et al. Weed resistance to synthetic auxin herbicides. Pest Manag. Sci. 2018, 74, 2265–2276. [Google Scholar] [CrossRef] [PubMed]
  25. Valverde, B.E.; Itoh, K. World rice and herbicide resistance. In Herbicide Resistance in World Grains; Powles, S.R., Shaner, D., Eds.; CRC Press: Boca Raton, FL, USA, 2001; pp. 145–249. [Google Scholar]
  26. Valverde, B.E. Status and management of grass–weed herbicide resistance in Latin America. Weed Technol. 2007, 21, 310–323. [Google Scholar] [CrossRef]
  27. Lopez-Martinez, N.; Marshall, G.; DePrado, R. Resistance of barnyardgrass to atrazine and quinclorac. Pestic. Sci. 1997, 51, 171–175. [Google Scholar] [CrossRef]
  28. Malik, M.S.; Burgos, N.R.; Talbert, R.E. Confirmation and control of propanil-resistant and quinclorac-resistant barnyardgrass (Echinochloa crus-galli) in rice. Weed Technol. 2010, 24, 226–233. [Google Scholar] [CrossRef]
  29. Rahman, M.M.; Sahid, I.B.; Juraimi, A.Z. Study on resistant biotypes of Echinochloa crus-galli in Malaysia. Aust. J. Crop. Sci. 2010, 4, 107–115. [Google Scholar]
  30. Yasuor, H.; Milan, M.; Eckert, J.W.; Fischer, A.J. Quinclorac resistance: A concerted hormonal and enzymatic effort in Echinochloa phyllopogon. Pest. Manag. Sci. 2012, 68, 108–115. [Google Scholar] [CrossRef]
  31. Gomez de Barreda, D.; Carretero, J.L.; del Busto, A.; Asins, M.J.; Carbonell, E.A.; Lorenzo, E. Response of Echinochloa spp. (barnyardgrass) populations to quinclorac. In Proceedings of the International Symposium on Weed and Crop Resistance to Herbicides, Cordoba, Spain, 3–6 April 1995; pp. 157–158. [Google Scholar]
  32. Kepinski, S.; Leyser, O. The Arabidopsis TIR1 protein is an auxin receptor. Nature 2005, 435, 446–451. [Google Scholar] [CrossRef]
  33. Ikegaya, H.; Iwase, H.; Hatanaka, K.; Sakurada, K.; Yoshida, K.; Takatori, T. Diagnosis of cyanide intoxication by measurement of cytochrome c oxidase activity. Toxicol. Lett. 2001, 119, 117–123. [Google Scholar] [CrossRef]
  34. Bleecker, A.B.; Kende, H. Ethylene: A gaseous signal molecule in plants. Rev. Cell Dev. Biol. 2003, 16, 1–18. [Google Scholar] [CrossRef] [Green Version]
  35. Lai, K.W.; Yau, C.P.; Tse, Y.C.; Jiang, L.W.; Yip, Y.K. Heterologous expression analyses of rice OsCAS in Arabidopsis and in yeast provide evidence for its roles in cyanide detoxification rather than in cysteine synthesis in vivo. J. Exp. Bot. 2009, 60, 993–1008. [Google Scholar] [CrossRef] [Green Version]
  36. Grossmann, K.; Kwiatkowski, J. The mechanism of quinclorac selectivity in grasses. Pestic. Biochem. Physiol. 2000, 66, 83–91. [Google Scholar] [CrossRef]
  37. Gao, Y.; Pan, L.; Sun, Y.; Zhang, T.; Dong, L.; Li, J. Resistance to quinclorac caused by the enhanced ability to detoxify cyanide and its molecular mechanism in Echinochloa crus-galli var. zelayensis. Pestic. Biochem. Physiol. 2017, 143, 231–238. [Google Scholar] [CrossRef] [PubMed]
  38. Chayapakdee, P.; Sunohara, Y.; Endo, M.; Yamaguchi, T.; Fan, L.; Uchino, A.; Matsumotoa, H.; Iwakamie, S. Quinclorac resistance in Echinochloa phyllopogon is associated with reduced ethylene synthesis rather than enhanced cyanide detoxification by β-cyanoalanine synthase. Pest. Manag. Sci. 2019. [Google Scholar] [CrossRef] [PubMed]
  39. Mdodana, N.T.; Jewell, J.F.; Phiri, E.E.; Smith, M.L.; Oberlander, K.; Mahmoodi, S.; Kossmann, J.; Lloyd, J.R. Mutations in glucan, water dikinase afect starch degradation and gametophore development in the moss Physcomitrella patens. Sci. Rep. 2019, 9, 15114. [Google Scholar] [CrossRef] [PubMed] [Green Version]
  40. Van Eerd, L.L.; Stephenson, G.R.; Kwiatkowski, J.; Grossmann, K.; Hall, J.C. Physiological and biochemical characterization of quinclorac resistance in a false cleaver (Galium spurium L.) biotype. J. Agric. Food Chem. 2005, 53, 1144–1151. [Google Scholar] [CrossRef] [PubMed]
  41. Lovelace, M.L.; Talbert, R.E.; Hoagland, R.E.; Scherder, E.F. Quinclorac absorption and translocation characteristics in quinclorac- and propanil-resistant and-susceptible barnyardgrass (Echinochloa crusgalli) biotypes. Weed Technol. 2007, 21, 683–687. [Google Scholar] [CrossRef]
  42. Tresch, S.; Grossmann, K. Quinclorac does not inhibit cellulose (cell wall) biosynthesis in sensitive barnyard grass and maize roots. Pestic. Biochem. Physiol. 2003, 75, 73–78. [Google Scholar] [CrossRef]
  43. Bonow, J.F.L.; Lamego, F.P.; Andres, A.; Avila, L.A.; Teló, G.M.; Egewarth, K. Resistance of Echinochloa crusgalli var. mitis to imazapyr+imazapic herbicide an alternative control in irrigated rice. Planta Daninha 2018, 36, e018168627. [Google Scholar] [CrossRef] [Green Version]
  44. Grossmann, K.; Retzlaff, G. Bioregulatory effects of the fungicidal strobilurin kresoxim-methyl in wheat (Triticum aestivum L.). Pestic. Sci. 1997, 50, 11–20. [Google Scholar] [CrossRef]
  45. Vasilakoglou, I.B.; Eleftherohorinos, I.G.; Dhima, K.V. Propanil-resistant barnyardgrass (Echinochloa crus-galli) biotypes found in Greece. Weed Technol. 2000, 14, 524–529. [Google Scholar] [CrossRef]
  46. Grossmann, K.; Kwiatkowski, J. Evidence for a causative role of cyanide, derived from ethylene biosynthesis, in the herbicidal mode of action of quinclorac in barnyard grass. Pestic. Biochem. Physiol. 1995, 51, 150–160. [Google Scholar] [CrossRef]
  47. Abdallah, I.; Fischer, A.J.; Elmore, C.L.; Saltveit, M.E.; Zaki, M. Mechanism of resistance to quinclorac in smooth crabgrass (Digitaria ischaemum). Pestic. Biochem. Physiol. 2006, 84, 38–48. [Google Scholar] [CrossRef]
  48. Chutichude, P.; Chutichude, B.; Boontiang, K. Influence of 1-MCP fumigation on flowering weight loss, water uptake, longevity, anthocyanin content and colour of patumma (Curcuma alismatifolia) cv. Chiang Mai Pink. Int. J. Agric. Res. 2011, 6, 29–39. [Google Scholar] [CrossRef]
  49. Grossmann, K. A role for cyanide, derived from ethylene biosynthesis, in the development of stress symptoms. Physiol. Plant 1996, 97, 772–775. [Google Scholar] [CrossRef]
  50. Grossmann, K.; Scheltrup, F. Selective induction of 1- Aminocyclopropane-1-carboxylic acid (ACC) synthase activity is involved in the selectivity of the auxin herbicide quinclorac between barnyardgrass and rice. Pestic. Biochem. Physiol. 1997, 58, 145–153. [Google Scholar] [CrossRef]
  51. Grossmann, K. The mode of action of quinclorac: A case study of a new auxin-type herbicide. In Herbicides and their Mechanism of Action; Cobb, A.H., Kirkwood, R.C., Eds.; Sheffield Academic Press: Sheffield, UK, 2000; pp. 181–214. [Google Scholar]
  52. Yamagami, T.; Tsuchisaka, A.; Yamada, K.; Haddon, W.F.; Harden, L.A.; Theologis, A. Biochemical diversity among the 1-amino-cyclopropane-1-carboxylate synthase isozymes encoded by the Arabidopsis gene family. J. Biol. Chem. 2003, 278, 49102–49112. [Google Scholar] [CrossRef] [PubMed] [Green Version]
  53. Iwakami, S.; Uchino, A.; Kataoka, Y.; Shibaike, H.; Watanabe, H.; Inamura, T. Cytochrome P450 genes induced by bispyribac- sodium treatment in a multiple herbicide- resistant biotype of Echinochloa phyllopogon. Pest. Manag. Sci. 2014, 70, 549–558. [Google Scholar] [CrossRef]
  54. Stepanova, A.N.; Yun, J.; Likhacheva, A.V.; Alonso, J.M. Multilevel interactions between ethylene and auxin in Arabidopsis roots. Plant Cell 2007, 19, 2169–2185. [Google Scholar] [CrossRef] [Green Version]
  55. Yi, H.; Juergens, M.; Jez, J.M. Structure of soybean β-cyanoalanine synthase and the molecular basis for cyanide detoxification in plants. Plant Cell 2012, 24, 2696–2706. [Google Scholar] [CrossRef] [Green Version]
  56. Cargill, M.; Altshuler, D.; Ireland, J.; Sklar, P.; Ardlie, K.; Patil, N.; Lane, C.R.; Lim, E.P.; Kalyanaraman, N.; Nemesh, J.; et al. Characterization of single-nucleotide polymorphisms in coding regions of human genes. Nat. Genet. 1999, 22, 231–238. [Google Scholar] [CrossRef]
  57. Zhang, X.; Myers, A.M.; James, M.G. Mutations affecting starch synthase III in Arabidopsis alter leaf starch structure and increase the rate of starch synthesis. Plant Physiol. 2005, 138, 663–674. [Google Scholar] [CrossRef] [PubMed] [Green Version]
  58. Chae, H.S.; Faure, F.; Kieber, J.J. The eto1, eto2, and eto3 mutations and cytokinin treatment increase ethylene biosynthesis in Arabidopsis by increasing the stability of ACS protein. Plant Cell 2003, 15, 545–559. [Google Scholar] [CrossRef] [PubMed] [Green Version]
  59. Wu, J.; de Paz, A.; Zamft, B.M.; Marlbestone, A.H.; Boyden, E.S.; Kording, K.P.; Tyo, K.E.J. DNA binding strength increases the processivity and activity of a Y-Family DNA polymerase. Sci. Rep. 2017, 7, 4756. [Google Scholar] [CrossRef] [PubMed]
  60. Tokuriki, N.; Tawfik, D.S. Stability effects of mutations and protein evolvability. Curr. Opin. Struct. Biol. 2009, 19, 596–604. [Google Scholar] [CrossRef]
  61. Lizada, M.C.C.; Yang, S.F. A simple and sensitive assay for 1- aminocyclopropane-1-carboxylic acid. Anal. Biochem. 1979, 100, 140–145. [Google Scholar]
  62. Bulens, I.; Van de Poel, B.; Hertog, M.L.A.T.M.; De Proft, M.P.; Geeraerd, A.H.; Nicolaï, B.M. Protocol: An updated integrated methodology for analysis of metabolites and enzyme activities of ethylene biosynthesis. Plant Methods 2011, 7, 17–26. [Google Scholar] [CrossRef] [Green Version]
  63. Chon, N.M.; Nishikawa-Koseki, N.; Takeuchi, Y.; Abe, H. Role of ethylene in abnormal shoot growth induced by high concentration of brassinolide in rice seedlings. J. Pestic. Sci. 2008, 33, 67–72. [Google Scholar] [CrossRef] [Green Version]
  64. Hall, T.A. BioEdit: A user-friendly biological sequence alignment editor and analysis program for Windows 95/98/NT. Nucleic Acids. Symp. Ser. 1999, 41, 95–98. [Google Scholar]
  65. Kelly, L.A.; Mezulis, S.; Yates, C.M.; Wass, M.N.; Sternberg, M.J. The Phyre2 web portal for protein modeling, prediction and analysis. Nat. Protoc. 2015, 10, 845–858. [Google Scholar] [CrossRef] [Green Version]
  66. Pandurangan, A.P.; Ochoa-Montaño, B.; Ascher, D.B.; Blundell, T.L. SDM: A server for predicting effects of mutations on protein stability. Nucleic Acids Res. 2017, 45, W229–W235. [Google Scholar] [CrossRef] [Green Version]
  67. Livak, K.J.; Schmittgen, T.D. Analysis of relative gene expression data using real-time quantitative PCR and the 2(−Delta Delta C(T)) method. Methods 2001, 25, 402–408. [Google Scholar] [CrossRef] [PubMed]
Figure 1. Dose–response curve of quinclorac-susceptible and resistant biotypes of Echinochloa crus-galli var. mitis. Survival rate (left) and fresh weight reduction (right; %) were measured three weeks after quinclorac application (0, 75, 150, 300, 600, and 1200 g a.i. ha−1). Dose–response curve was generated in Sigma Plot v.14.0 by employing logistic equation (four parameters).
Ijms 21 01573 g001
Figure 2. Quinclorac induced growth reduction (3 weeks after spraying in pot assay and 9 days after incubating the seeds with the quinclorac solution in Petri plate assay) in four resistant and one susceptible biotypes of Echinochloa crus-galli var. mitis.
Ijms 21 01573 g002
Figure 3. Ethylene concentration (% of mean untreated control) in quinclorac-resistant and susceptible biotypes of Echinochloa crus-galli var. mitis as influenced by different quinclorac dose rates (a; 0, 150, 300, and 600 g a.i. ha−1) at 24 h after treatment (HAT) and sampling times (b; 0, 12, 24, 48, and 96 HAT) at 300 g a.i. ha−1 quinclorac treatment. Vertical bars above mean represents the standard error of four replicates.
Ijms 21 01573 g003
Figure 4. The correlation between (a) ethylene production, (b) 1-aminocyclopropane-1-carboxylic acid (ACC) contents, (c) 1-aminocyclopropane-1-carboxylic acid synthase (ACS) activity, (d) 1-aminocyclopropane-1-carboxylic acid oxidase (ACO) activity, and fresh weight (% of mean control) of Echinochloa crus-galli var. mitis plants after the application of 0, 150, 300, 600 g a.i. ha−1 quinclorac. Plant fresh weight was calculated 7 days after quinclorac application, and ethylene concentration, ACC content, ACS, and ACO activities were determined 24 h after quinclorac application. R2 = coefficient of determination, r = correlation coefficient, * and ** represent the correlation significance at p ≤ 0.05 and 0.01, respectively.
Ijms 21 01573 g004
Figure 5. ACC content (% of mean untreated control) in quinclorac-resistant and susceptible biotypes of Echinochloa crus-galli var. mitis as influenced by different quinclorac dose rates (a; 0, 150, 300, and 600 g a.i. ha−1) at 24 HAT and sampling times (b; 0, 12, 24, 48, and 96 HAT) at 300 g a.i. ha−1 quinclorac treatment. Vertical bars above mean represents the standard error of four replicates. ACC = 1-Aminocyclopropane−1-carboxylic acid.
Ijms 21 01573 g005
Figure 6. β-CAS activity (a), and EcCAS gene relative expression levels (b) measured at different time intervals after quinclorac application from five biotypes of Echinochloa crus-galli var. mitis. Data are mean of four biological replicates, and significance (p ≤ 0.05) at the same time level is described by (a–d) regarding the β-CAS activity (a). X-and Y-axis represents the time after quinclorac application and relative transcription level to susceptible biotype (0 h, prior to quinclorac application), respectively. Data presented are the mean of three biological and four technical replicates, and * represents upregulation more than 3-fold regarding EcCAS gene relative expression levels. Vertical bars above mean represent the standard error (b).
Ijms 21 01573 g006
Figure 7. Open reading frame (ORF)-generated amino acid sequence of the EcCAS gene from quinclorac-resistant (EcCAS1:4) and susceptible (EcCAS1:1) Echinochloa crus-galli var. mitis. Three nucleotide mutations (Asn-105-Lys, Gln-195-Glu, and Gly-298-Val) among resistant and susceptible biotypes are indicated by a boxed codon. These mutations are similar to the rice OsCAS gene.
Ijms 21 01573 g007
Figure 8. Ribbon diagram presenting the β-CAS structure of (a) quinclorac-susceptible, and (b) resistant Echinochloa crus-galli var. mitis. Molecular docking of PLP in active sites of (c) quinclorac-susceptible, and (d) resistant β-CAS.
Ijms 21 01573 g008
Figure 9. The ACS (EcACS7, EcACS-like) and ACO (EcACO-like, EcACO homolog 4, EcACO, EcACO5-like) genes relative expression levels in five biotypes of Echinochloa crus-galli var. mitis observed at 0, 6, 12, and 24 h after quinclorac application. X-and Y-axis represents the time after quinclorac application and relative transcription level to susceptible biotype (0 h, prior to quinclorac application), respectively. Data presented are the mean of three biological and four technical replicates. Vertical bars above mean represent the standard error. An underlined gene name represents upregulation of more than 10-fold.
Ijms 21 01573 g009
Table 1. EC50, GR50, and RI of quinclorac-resistant and sensitive biotypes of Echinochloa crus-galli var. mitis.
PopulationsDose–Response Analysis
EC50 (mg L−1)r2RI (EC50 Ratio)GR50 (g a.i. ha−1)r2RI (GR50 Ratio)
FJ01-S118.69 (7.82)0.98126.83 (1.02)0.9991
JS01-R4116.36 (76.65)0.9935733.73 (26.96)0.99927
JS02-R2604.65 (35.61)0.9922447.1 (14.73)0.99917
AH01-R2953.82 (37.78)0.9625484.22 (19.42)0.9818
JX01-R1605.25 (12.56)0.9814313.82 (11.08)0.9912
EC50 = effective dose responsible for 50% inhibitory response, GR50 = effective dose responsible for 50% inhibition in growth, RI (Resistance Index) = ratio of EC50 R over EC50 S or GR50 R over GR50 S, r2 = coefficient, p < 0.05. Standard errors are in parenthesis.
Table 2. ACS activity (pmol g−1 fresh weight h−1) exhibited by different biotypes of Echinochloa crus-galli var. mitis after 24 h of quinclorac treatment (0, 150, 300, 600 g a.i. ha−1).
Dose
(g a.i. ha−1)
Populations
FJ01-SJS01-RJS02-RAH01-RJX01-R
054.51 ± 2.55 cA40.65 ± 2.99 aB45.33 ± 2.10 cAB42.74 ± 1.06 bB44.73 ± 3.10 cAB
15069.81 ± 4.19 cA44.69 ± 3.14 aC51.71 ± 1.03 bcBC49.72 ± 2.86 abBC58.28 ± 2.66 bAB
30086.20 ± 3.01 bA46.10 ± 2.44 aD58.37 ± 3.34 abC52.83 ± 1.26 aCD69.54 ± 1.48 aB
600120.69 ± 4.64 aA49.13 ± 1.57 aD66.42 ± 2.13 aBC56.26 ± 2.25 aCD76.43 ± 1.70 aB
Data are means ± standard errors of four replicates. a–c showing the significant difference between different doses in one population, A–D representing significant difference among different populations under the same dose. ACS = 1-aminocyclopropane−1-carboxylic acid synthase.
Table 3. ACO activity (pmol g−1 fresh weight h−1) exhibited by different biotypes of Echinochloa crus-galli var. mitis after 24 h of quinclorac treatment (0, 150, 300, 600 g a.i. ha−1).
Dose
(g a.i. ha−1)
Populations
FJ01-SJS01-RJS02-RAH01-RJX01-R
0303.93 ± 8.58 dA158.72 ± 16.33 cC222.29 ± 24.77 bBC192.76 ± 7.33 cBC240.43 ± 18.53 dAB
150538.21 ± 21.05 cA204.82 ± 8.95 bC303.31 ± 18.52 abB222.87 ± 5.51 bcC322.69 ± 4.18 cB
300749.73 ± 18.69 bA230.83 ± 5.45 bD340.32 ± 37.29 aBC267.16 ± 12.92 bCD412.75 ± 27.77 bB
6001055.19 ± 22.68 aA276.18 ± 5.09 aD403.30 ± 13.61 aC369.14 ± 15.60 aC603.23 ± 5.89 aB
Data are means ± standard errors of four replicates. a–d showing the significant difference between different doses in one population, A–D representing significant difference among different populations under the same dose. ACO = 1-aminocyclopropane-1-carboxylic acid oxidase.
Table 4. Primers sequence used for the amplification of ACS, ACO, and CAS genes in Echinochloa crus-galli var. mitis.
GeneForward Primer (5′-3′)Reserve Primer (5′-3′)Annealing Temperature (°C)Length of Product
EcActinTACTCCTTCACCACAACCGCTGATGACCTGTCCATCAGGC60154
EcACS7TCGCGAGGATGAGCAGATTCACCCAAGGTAGTATTATTTACCCTC60124
EcACS-likeGATGCTGTCGGACCACGAGGTCCATCCACGAGAAGAGCC60148
EcACO homolog 4CATCTTCCCGCACACGGACGATGGAAACCCTTGGCTCGT60250
EcACO1AGTCCCAGGTTTGGAGTTTCTGATTATGGCGTCAGCACCAGG60207
EcACO-likeCCGGAGTTCAAGGAGACCATTGACCTTGGTGCCGAAGAAG60163
EcACO5-likeGCACATGGCGGTGAACTACTCACGCTCTTGTAGCGGTCAT60229
EcCASTGCCGTCATACACCAGTCTTCCAATCCCCATCACARAAA56253

