Functional Aspects of Early Light-Induced Protein (ELIP) Genes from the Desiccation-Tolerant Moss Syntrichia caninervis

 ,
, 
Abstract
1. Introduction
2. Results
2.1. Multiple Sequence Alignment and Phylogenetic Analysis
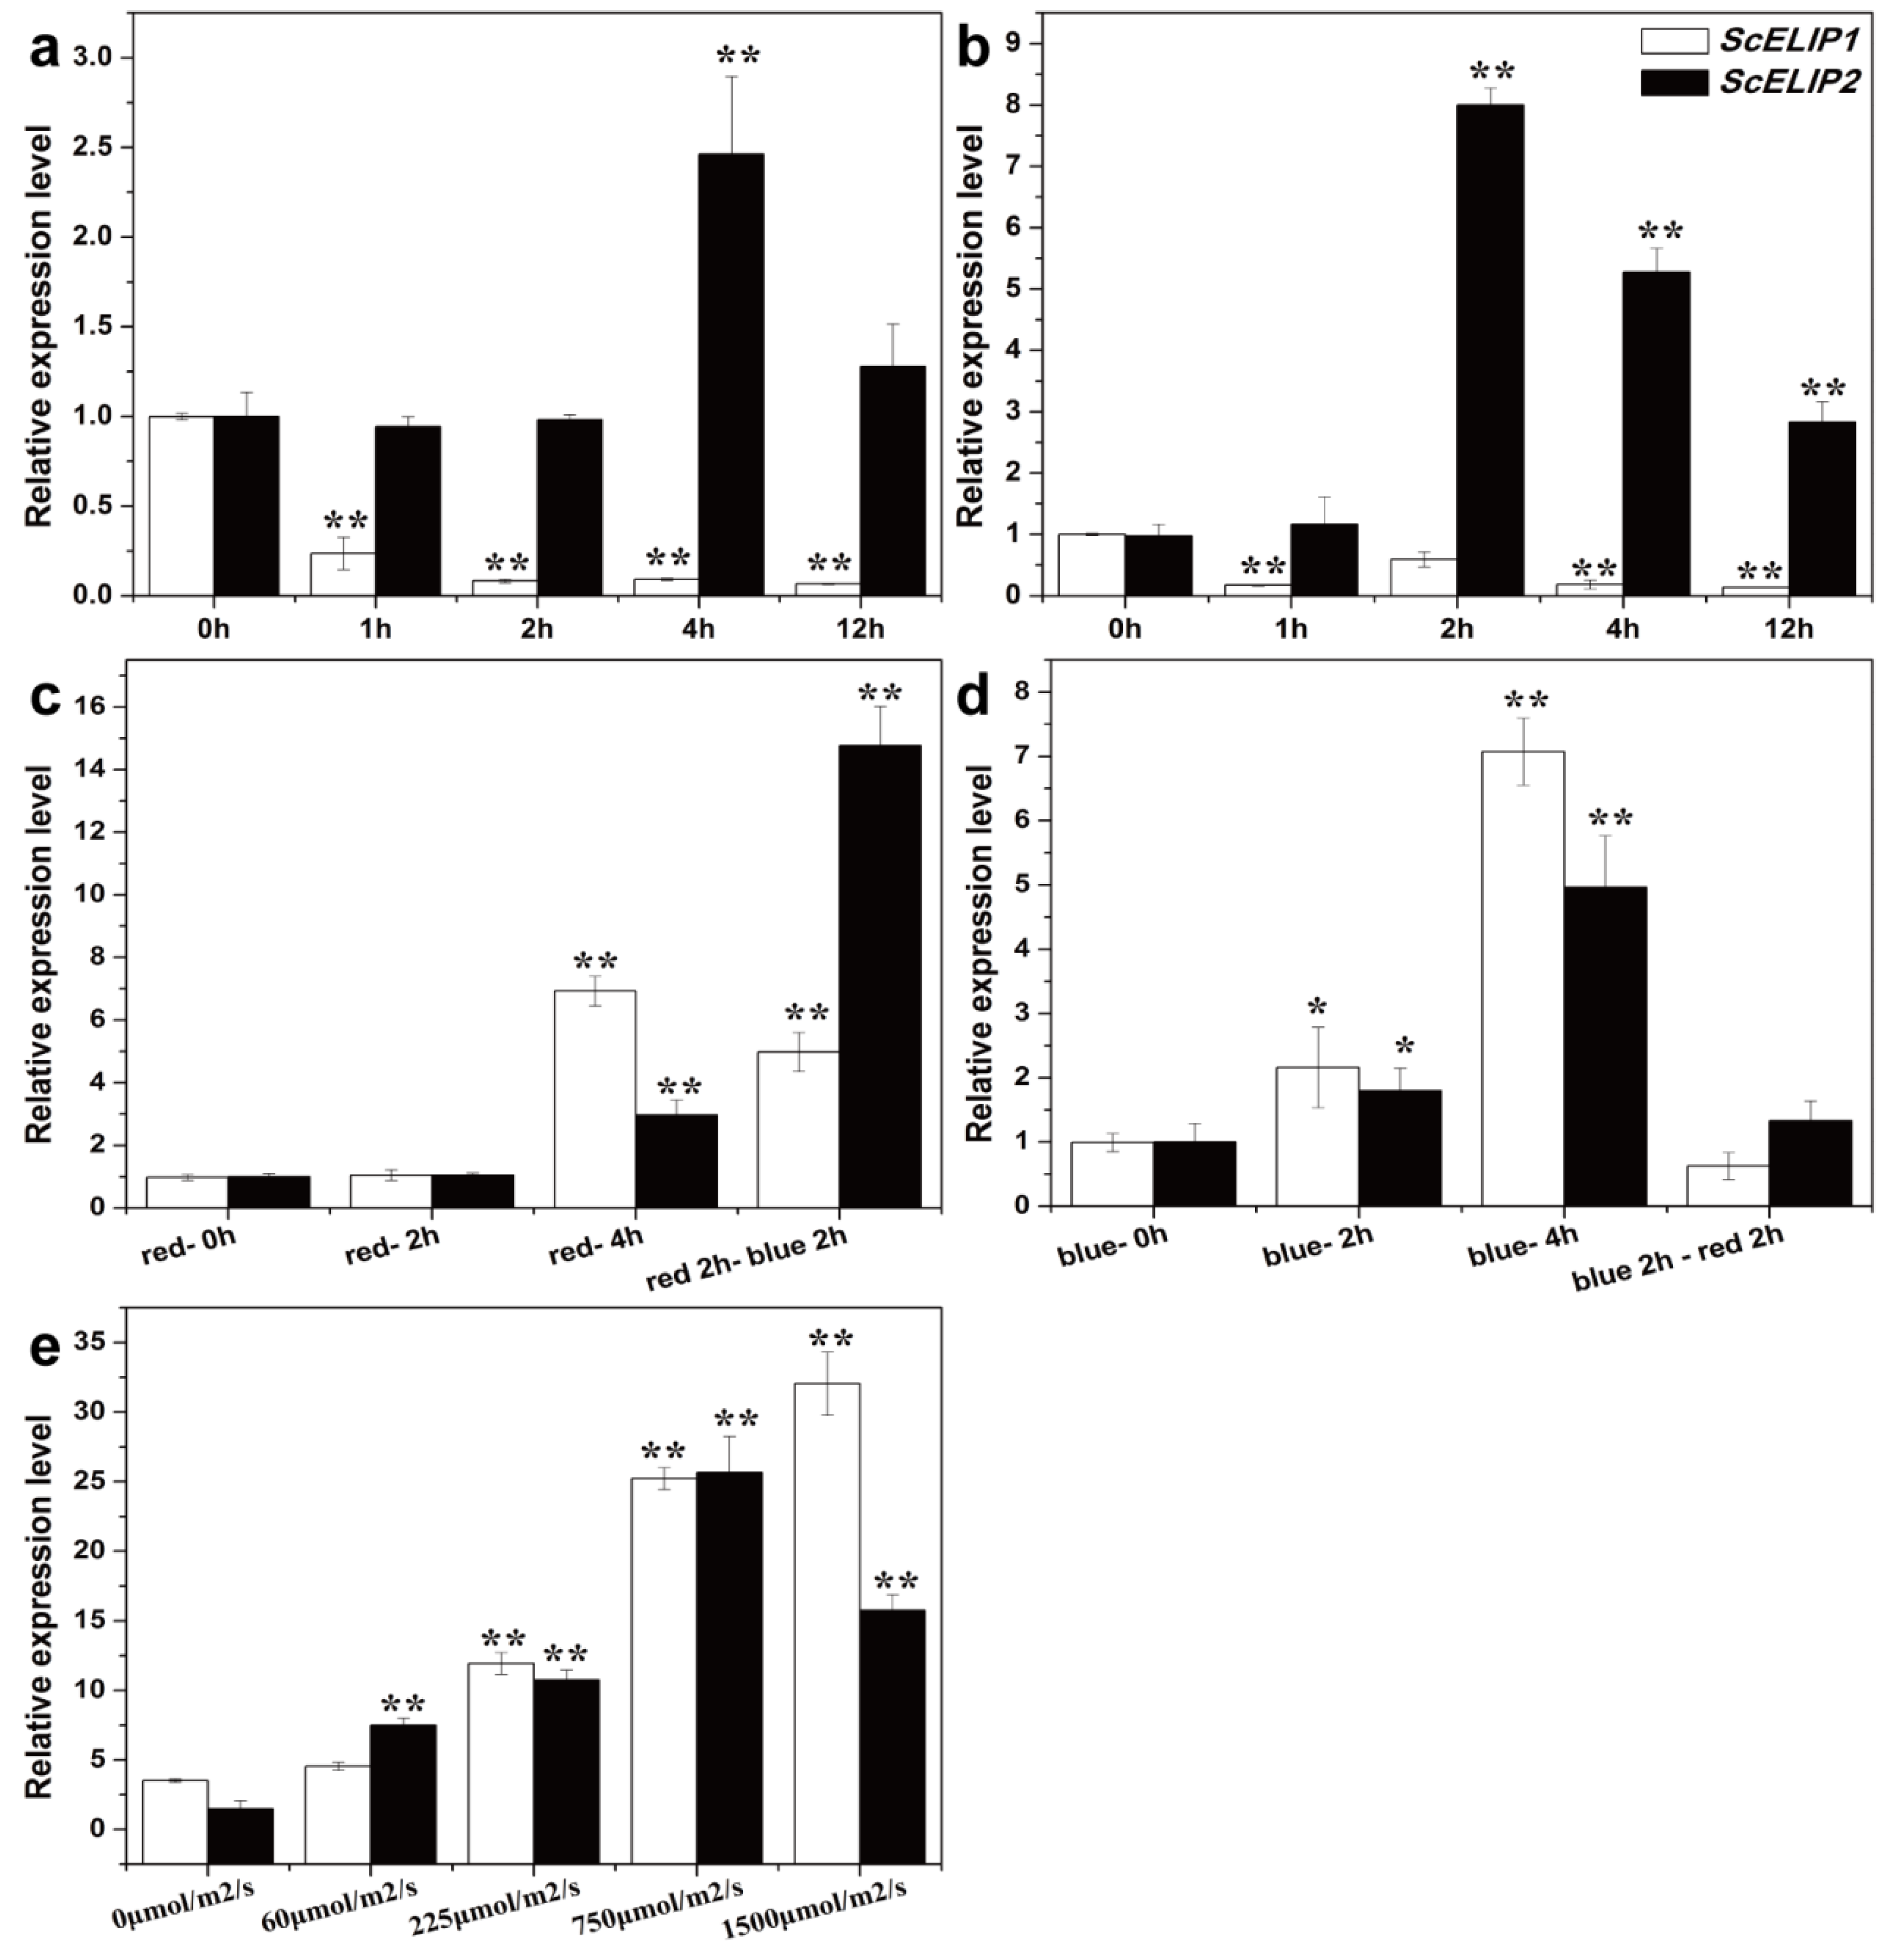
2.2. Gametophytic Expression of ScELIPs in Response to Light Treatments
2.3. Transgenic Lines
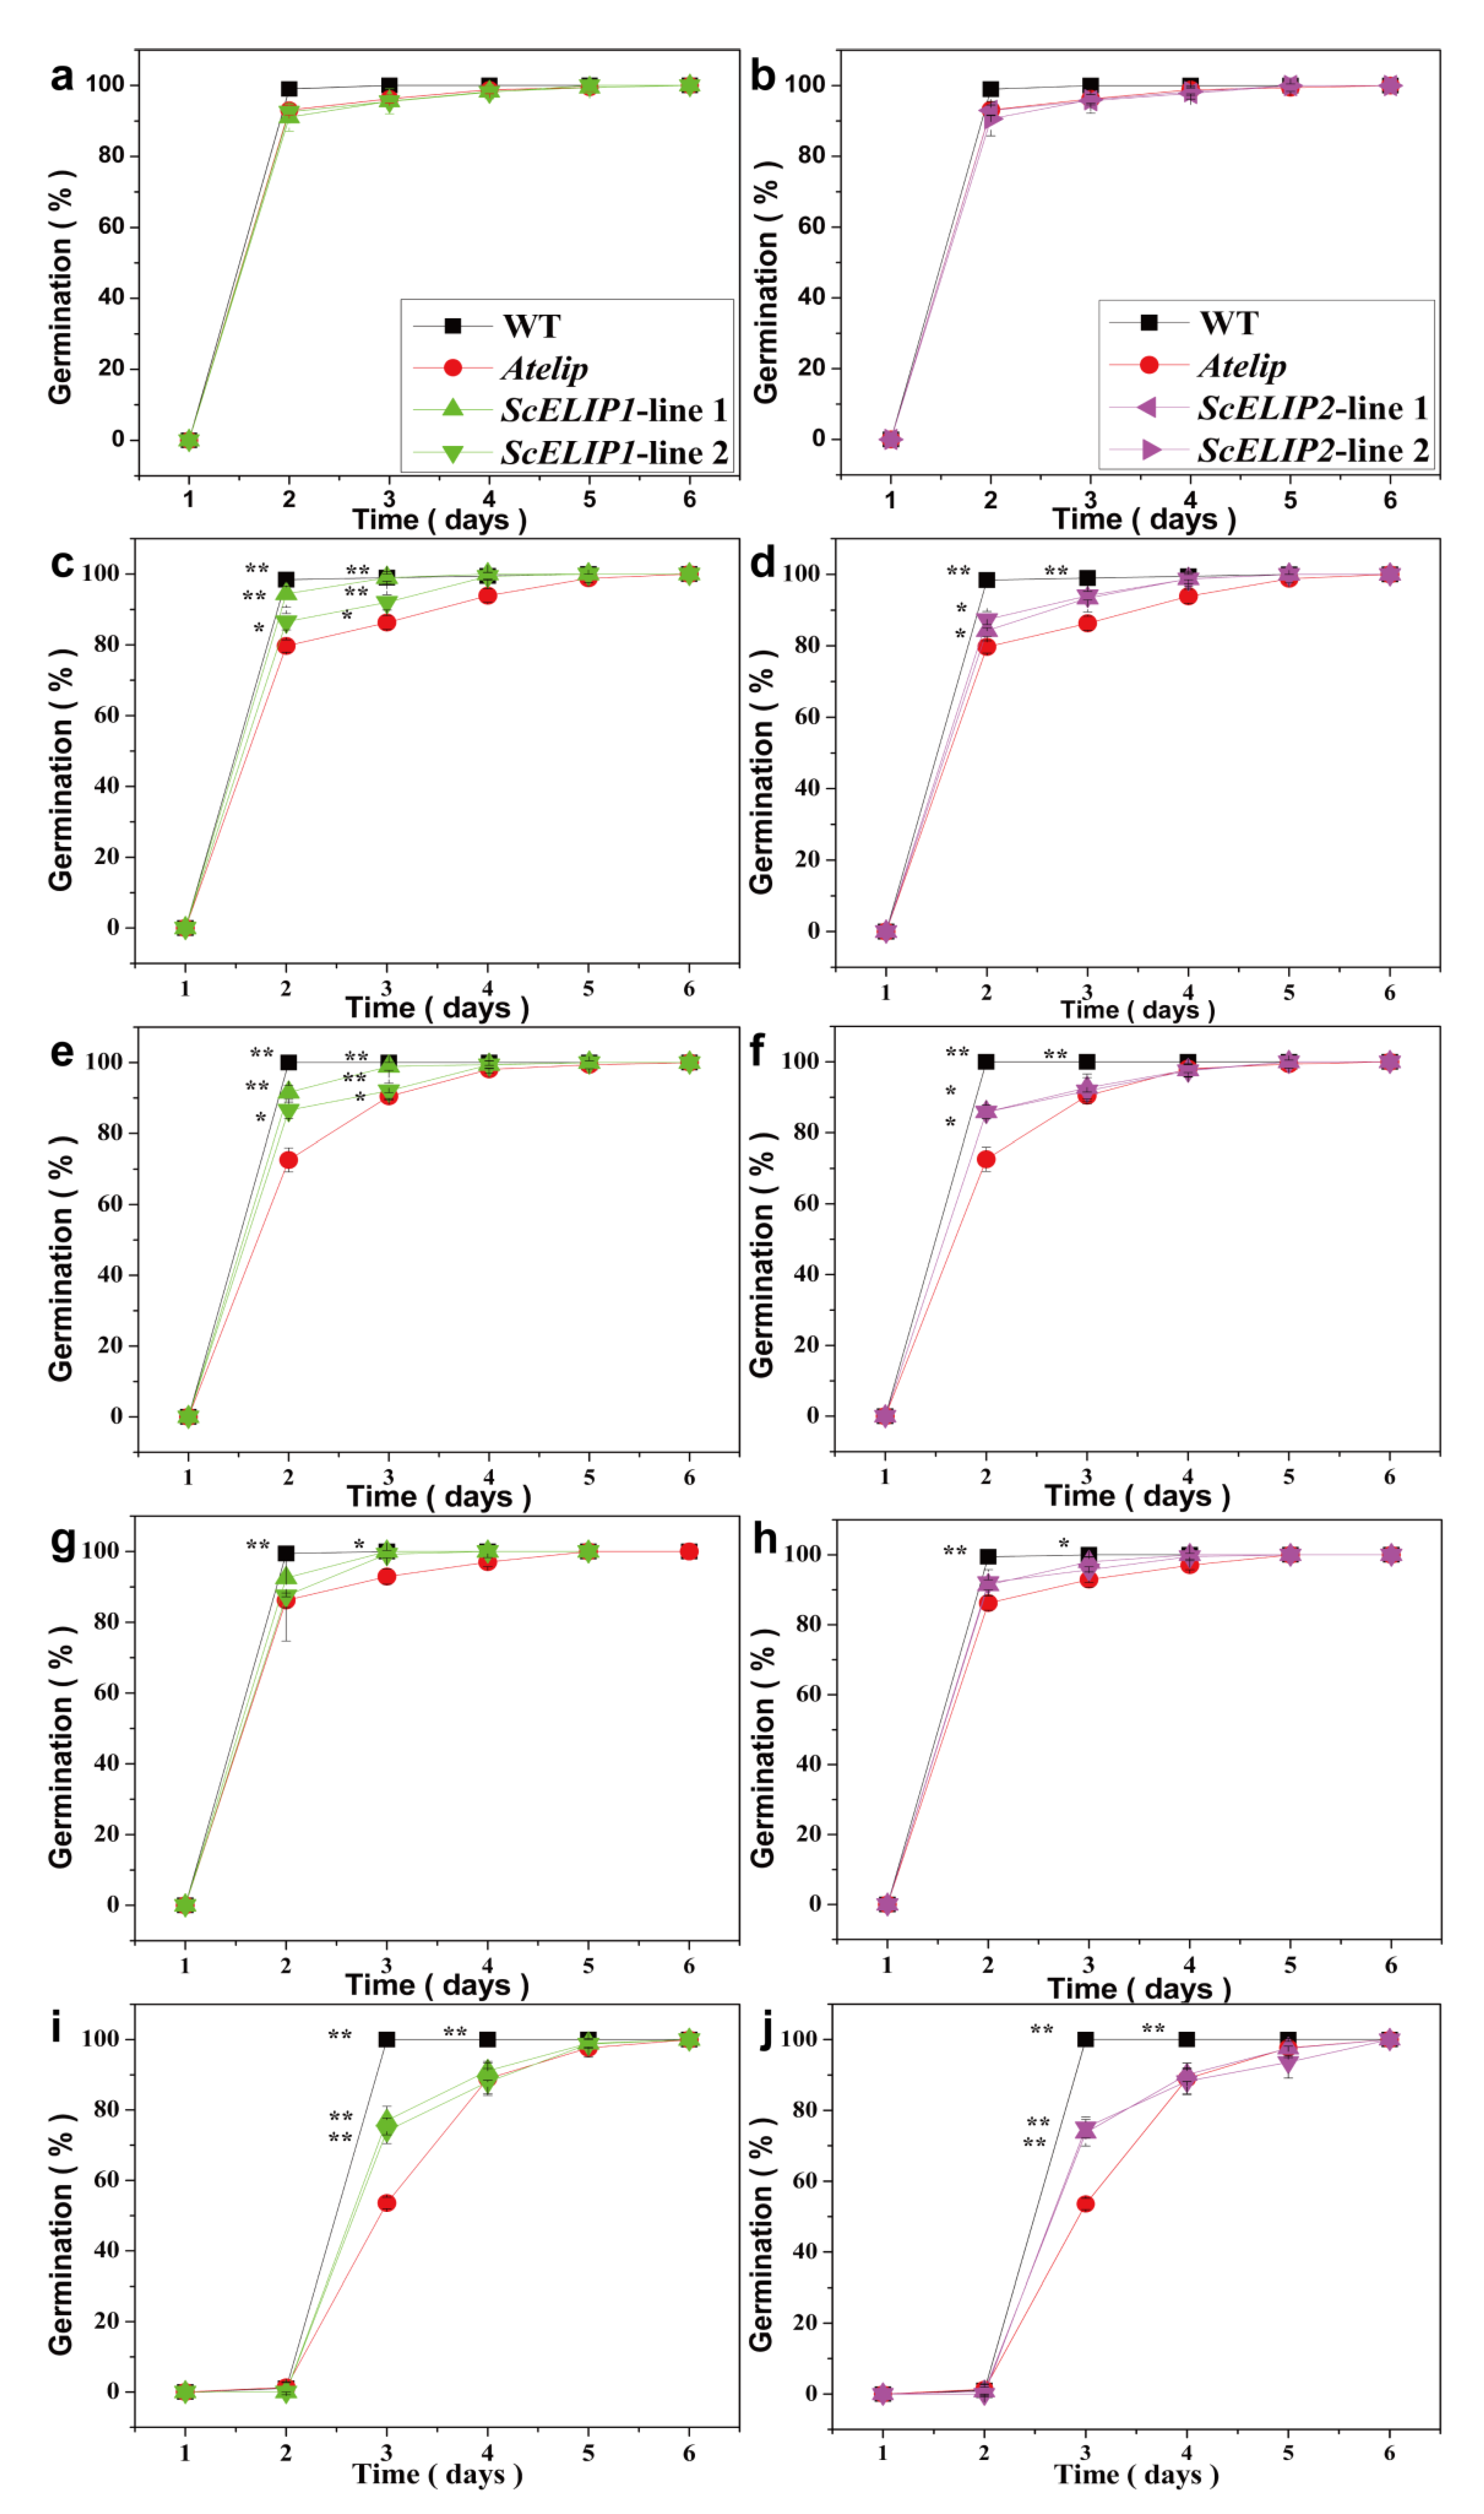
2.4. Germination and Early Seedling Growth under Different Light Treatments
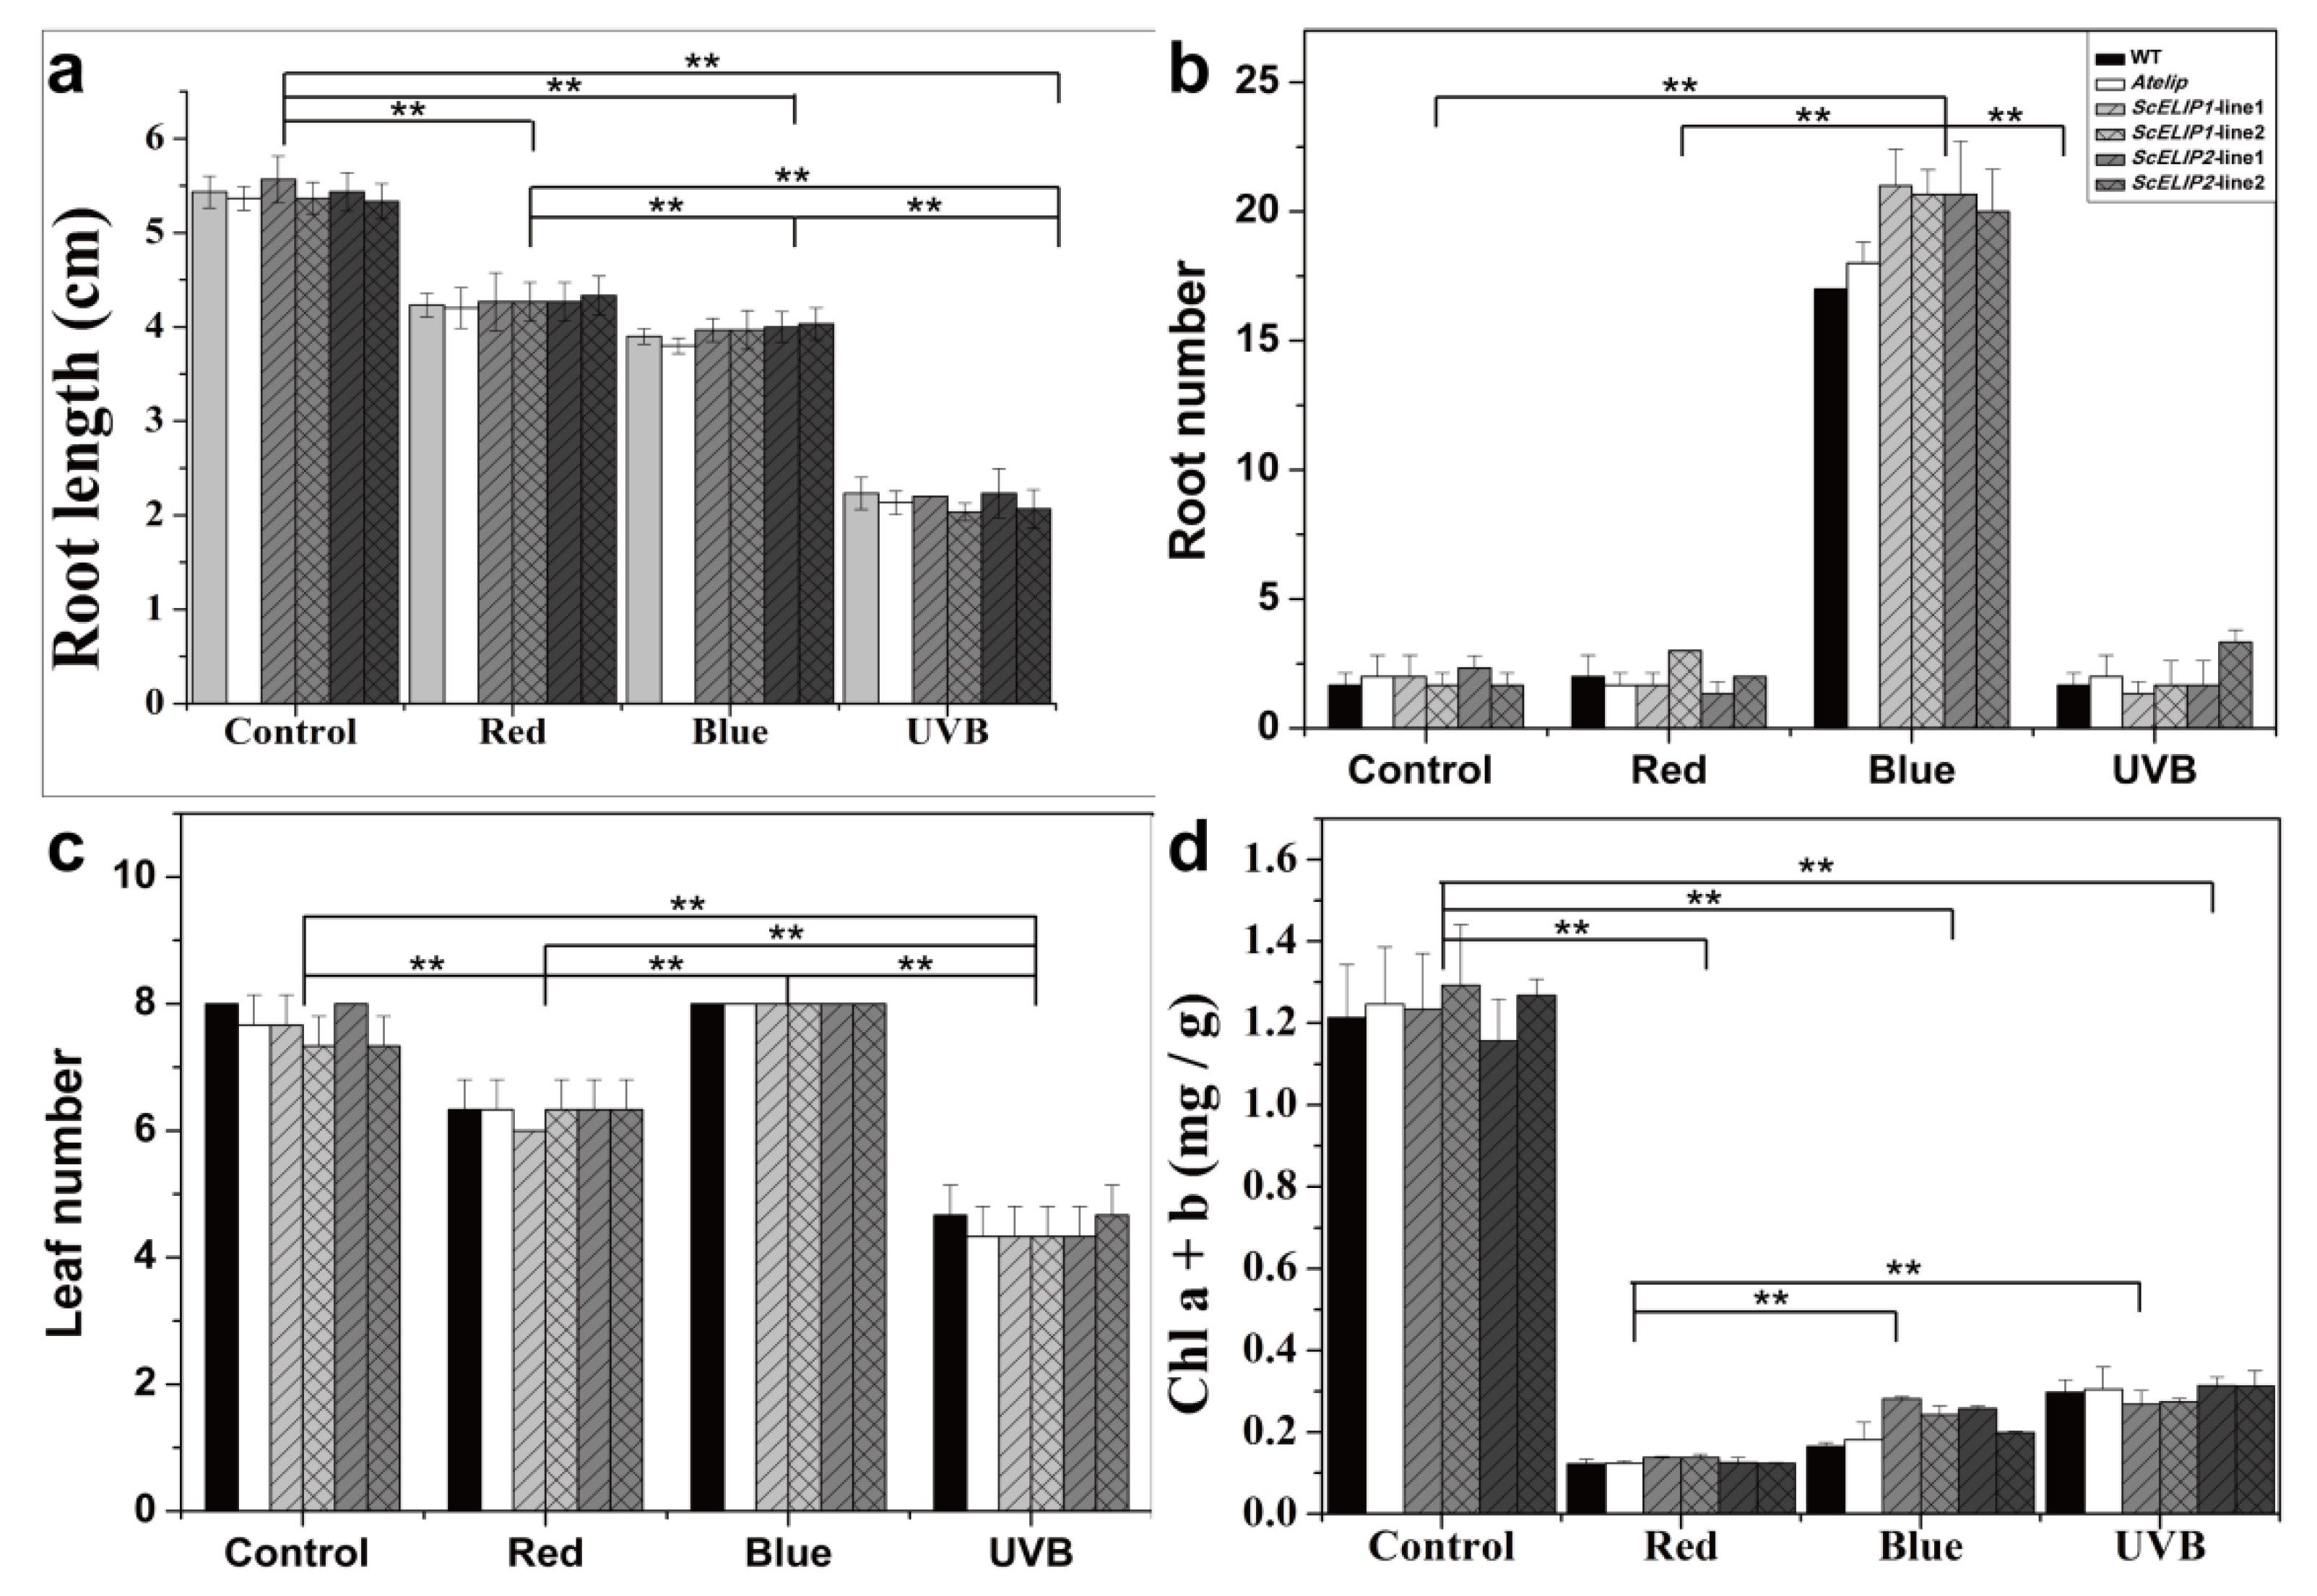
2.5. Light Treatment Effects on 7-Day Old Seedling Growth and Morphology
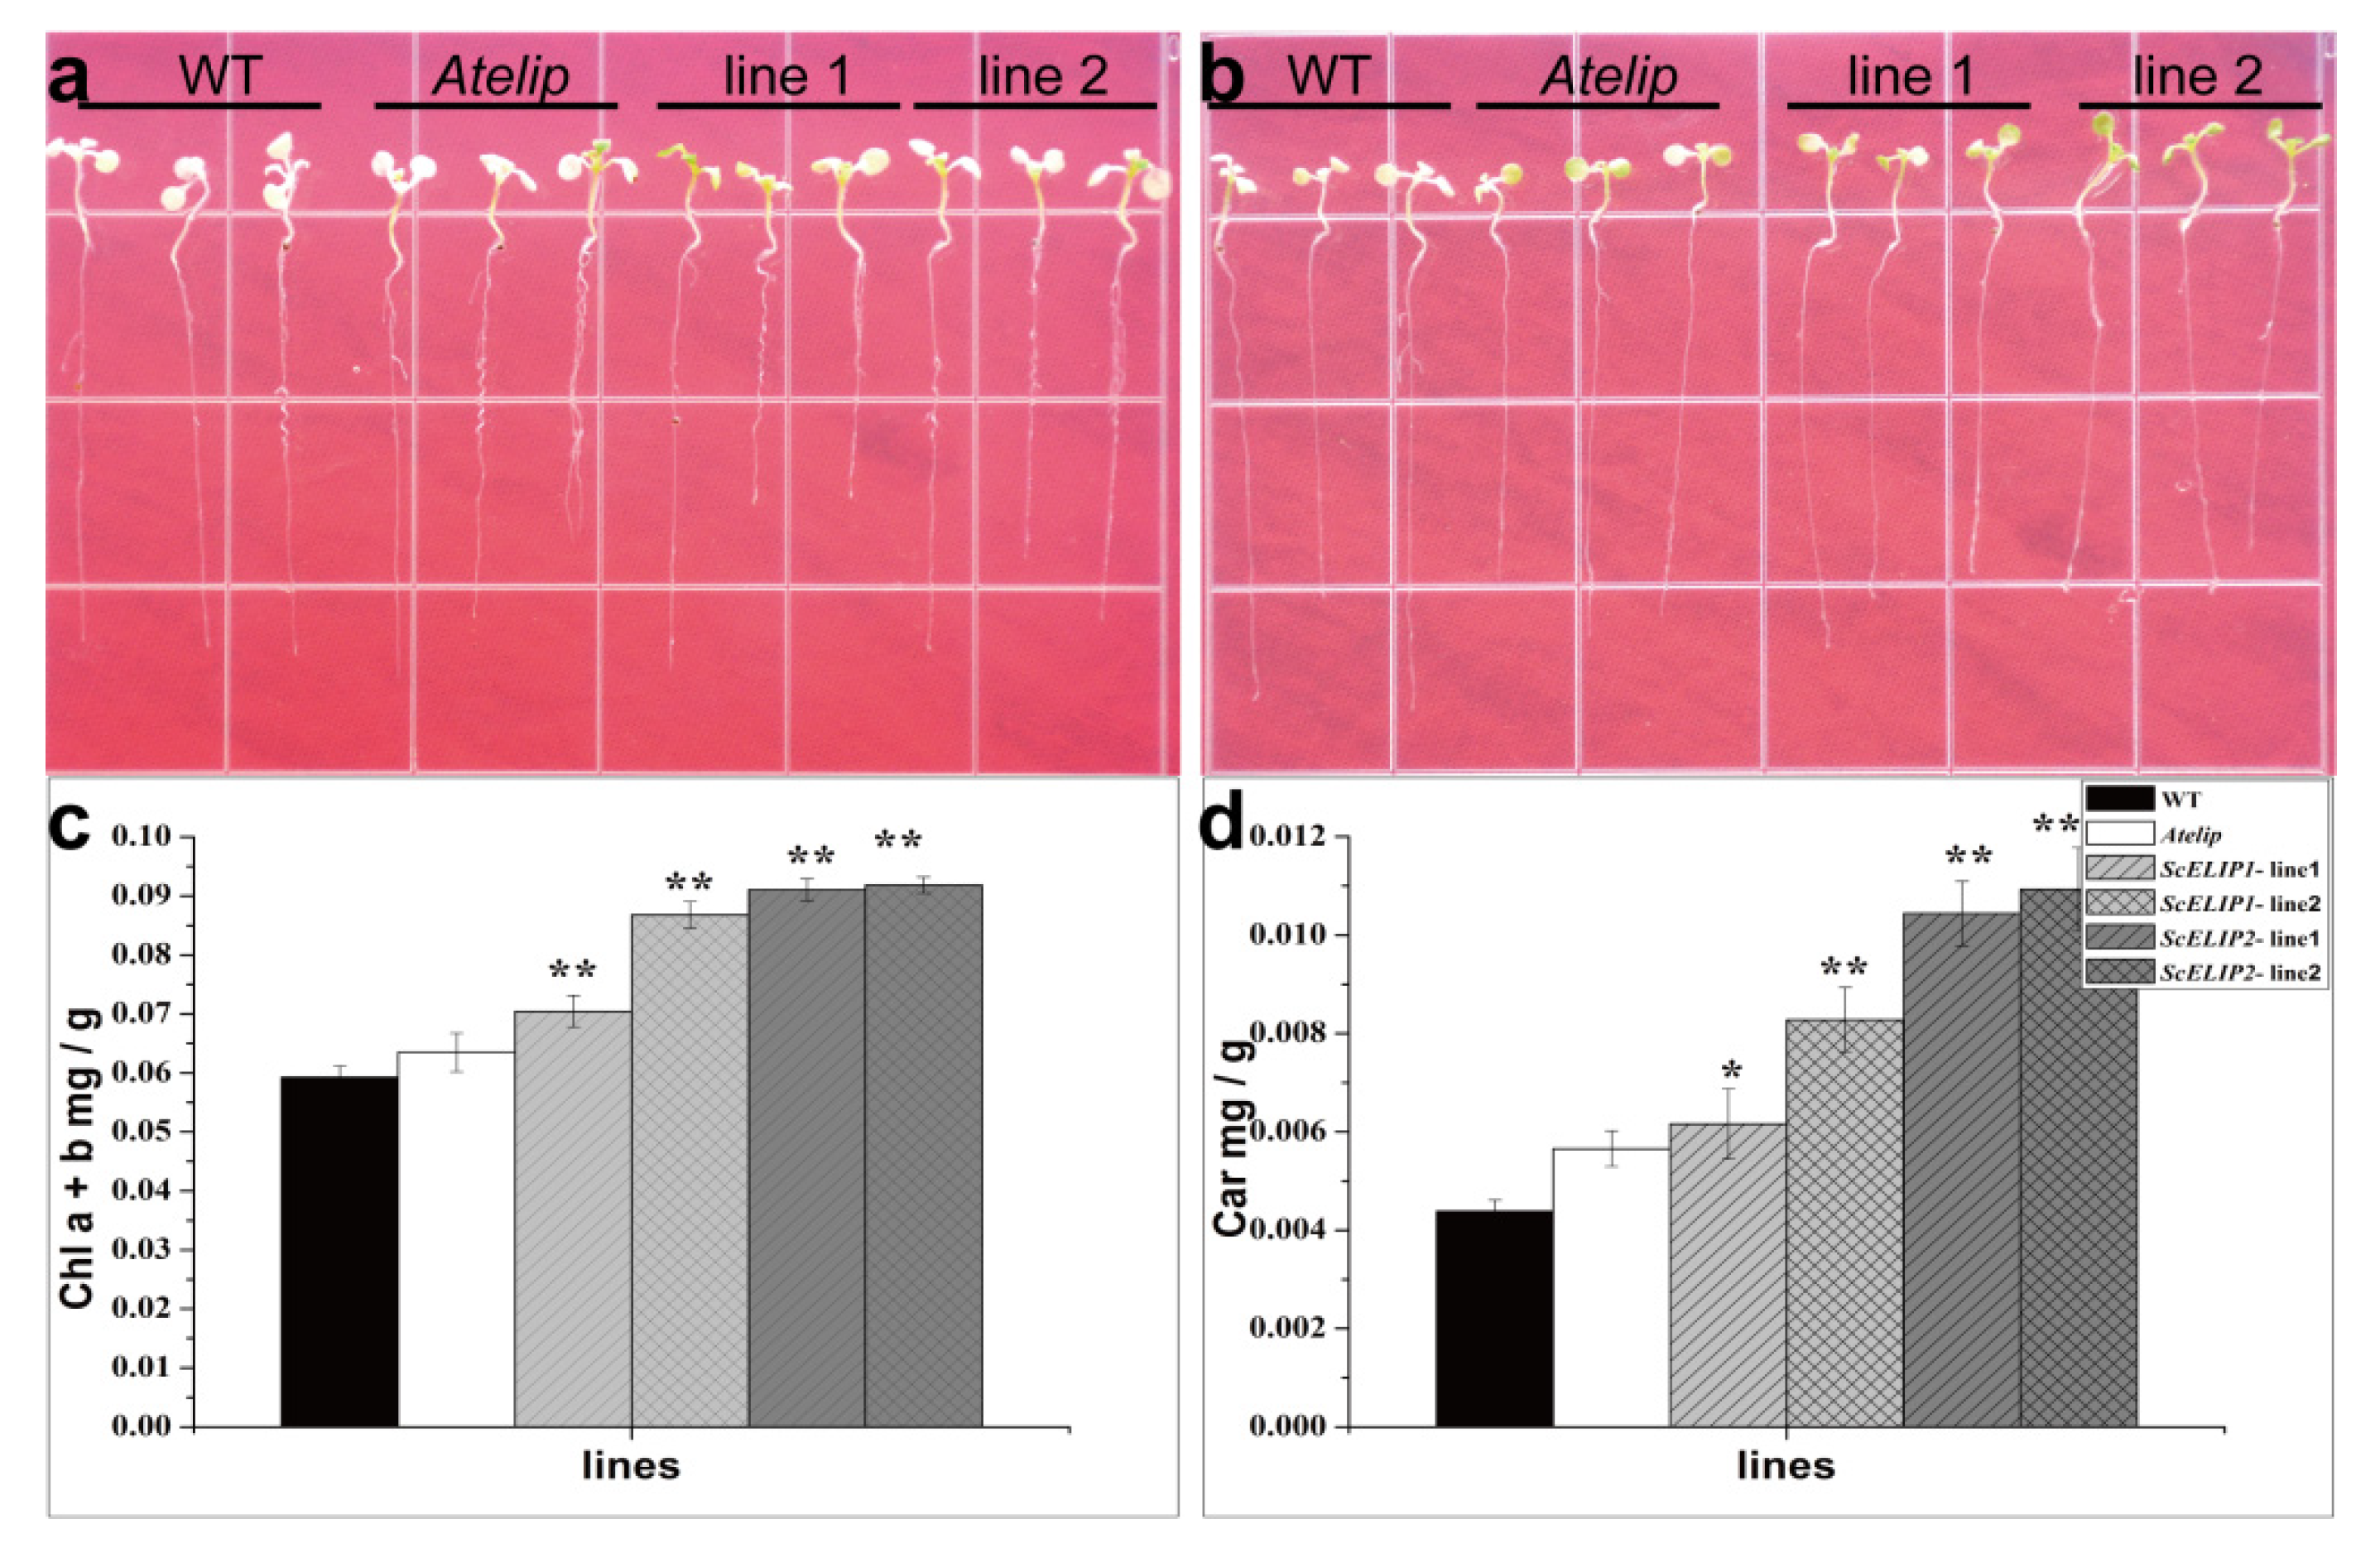
2.6. Seedling Growth of WT and Transgenic Lines under High-Light Conditions
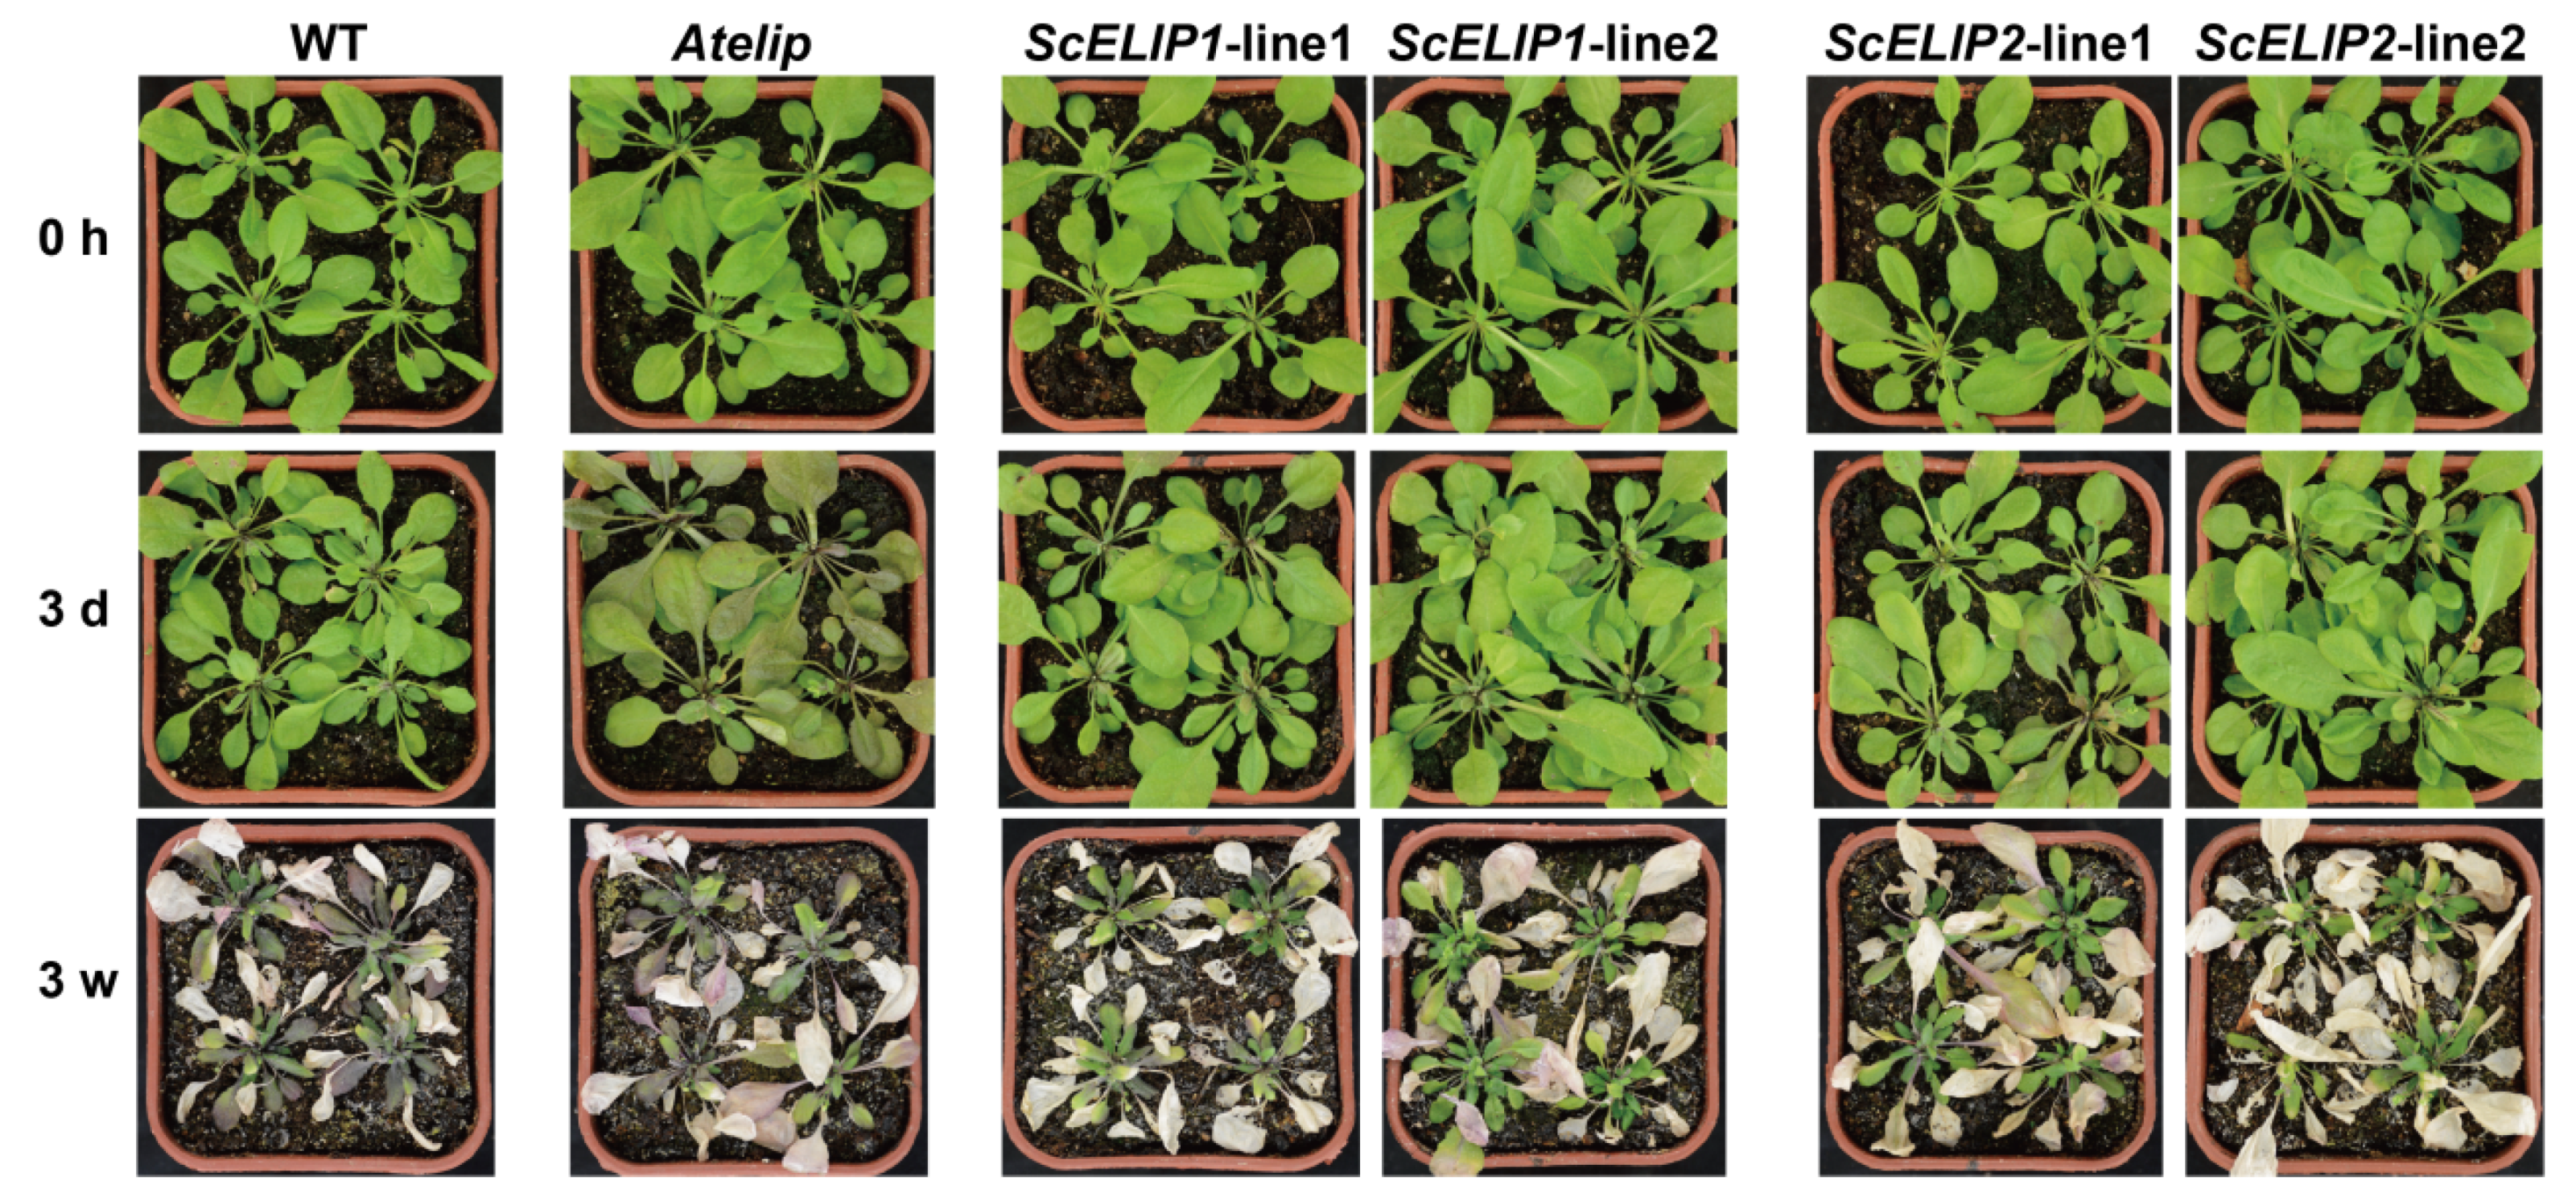
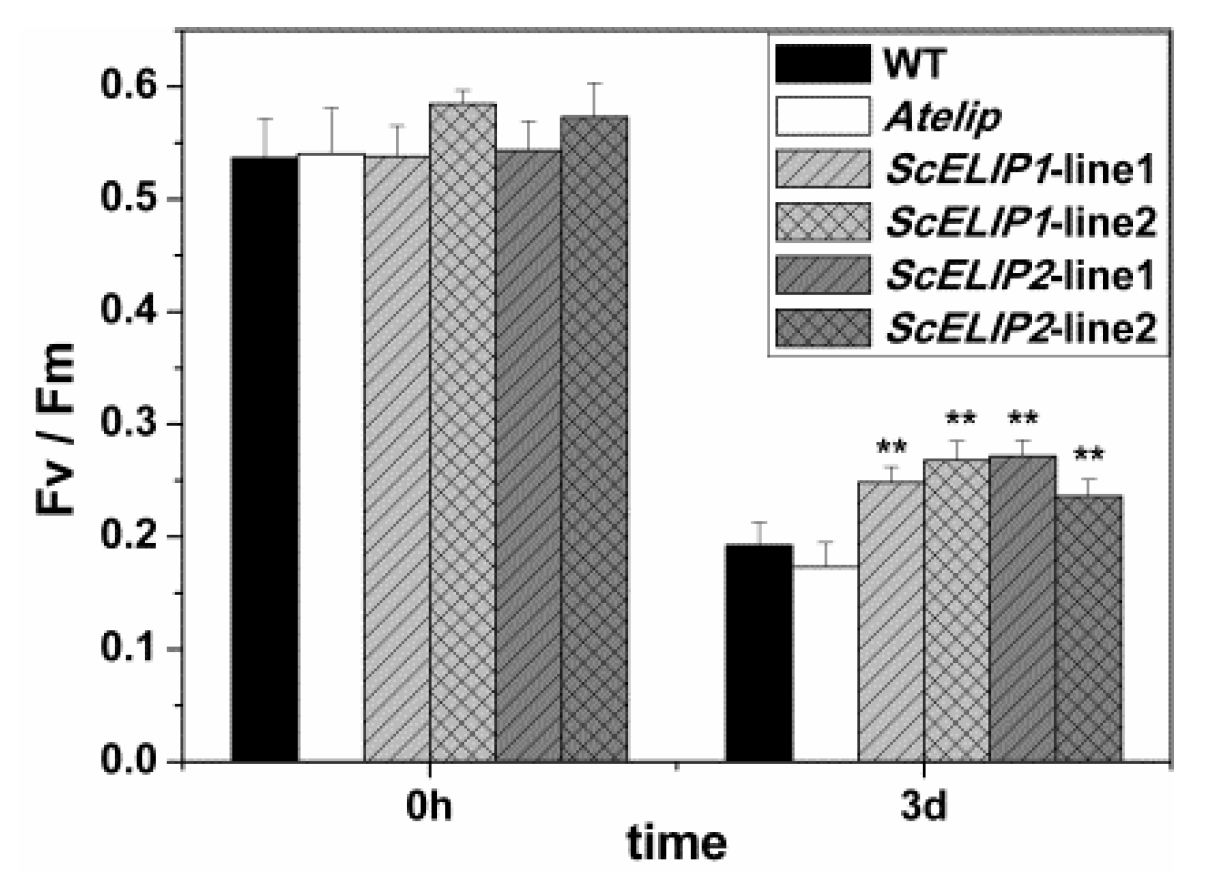
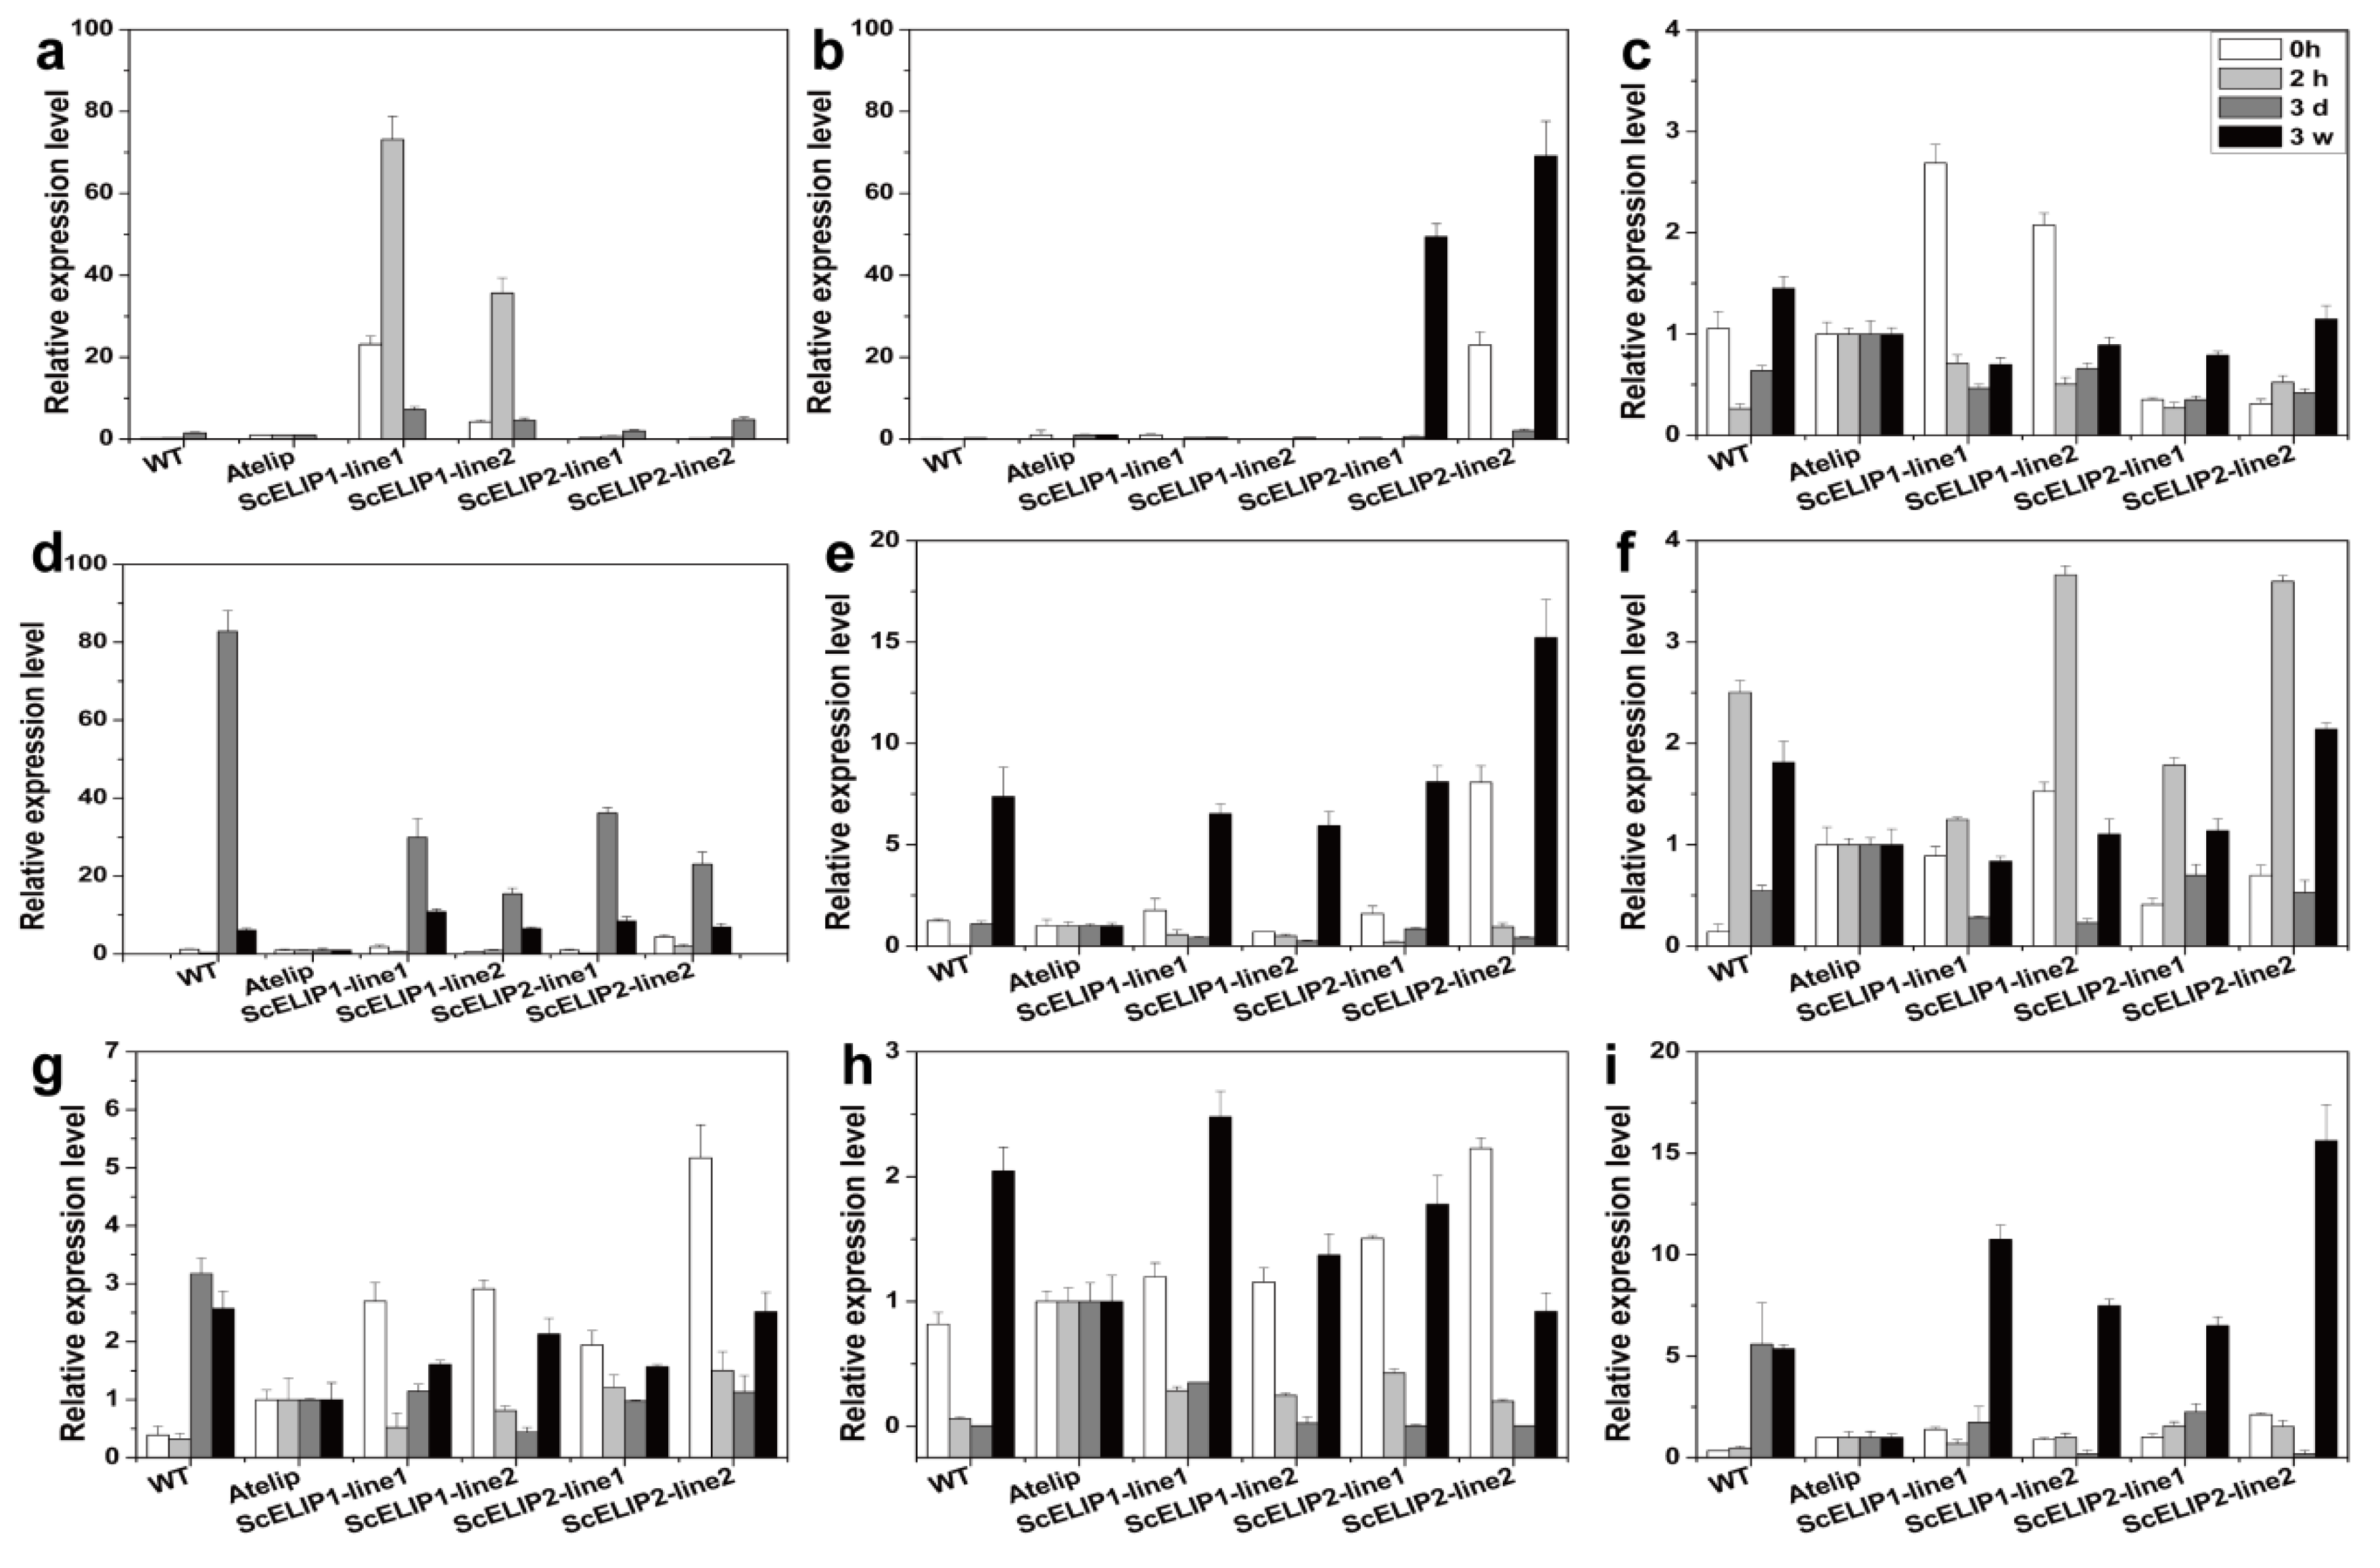
2.7. The Effect of High-Light Stress on Arabidopsis Plantlets
3. Discussion
4. Materials and Methods
4.1. Plant Material and Growth Conditions
4.2. Bioinformatic Analysis of Syntrichia Caninervis ELIP Sequences
4.3. Extraction of RNA and RT-qPCR Based Expression Analysis
4.4. Cloning of ScELIP Genes and Establishment of Transgenic Lines
4.5. Transformation of A. Thaliana
4.6. Seed Germination Assay
4.7. Phenotypic Analysis of Transgenic A. Thaliana
4.8. High-Light Treatment of Plantlets
4.9. Pigment Analysis
4.10. Fluorometric Assessment of Photosynthetic Performance
4.11. Statistical Analyses
5. Conclusions
Supplementary Materials
Author Contributions
Funding
Acknowledgments
Conflicts of Interest
References
- Li, Z.R.; Wakao, S.; Fischer, B.B.; Niyogi, K.K. Sensing and Responding to Excess Light. Annu. Rev. Plant Biol. 2009, 60, 239–260. [Google Scholar] [CrossRef] [PubMed]
- Gill, S.S.; Tuteja, N. Reactive oxygen species and antioxidant machinery in abiotic stress tolerance in crop plants. Plant Physiol. Biochem. 2010, 48, 909–930. [Google Scholar] [CrossRef] [PubMed]
- Demmig Adams, B.; Adams, W.W. Photoprotection and other responses of plants to high light stress. Annu. Rev. Plant Phys. 1992, 43, 599–626. [Google Scholar] [CrossRef]
- Choudhury, N.K.; Behera, R.K. Photoinhibition of photosynthesis: Role of carotenoids in photoprotection of chloroplast constituents. Photosynthetica 2001, 39, 481–488. [Google Scholar] [CrossRef]
- Yamakawa, H.; Itoh, S. Dissipation of Excess Excitation Energy by Drought-Induced Nonphotochemical Quenching in Two Species of Drought-Tolerant Moss: Desiccation-Induced Acceleration of Photosystem II Fluorescence Decay. Biochemistry 2013, 52, 4451–4459. [Google Scholar] [CrossRef] [PubMed]
- Stark, L.R.; Greenwood, J.L.; Brinda, J.C.; Oliver, M.J. The desert moss Pterygoneurum lamellatum (Pottiaceae) exhibits an inducible ecological strategy of deciccation toterance: Effects of rate of dying on shoot damage and regenertion. Am. J. Bot. 2013, 100, 1522–1531. [Google Scholar] [CrossRef]
- Zhang, Y.M.; Chen, J.; Wang, L.; Wang, X.Q.; Gu, Z.H. The spatial distribution patterns of biological soil crusts in the Gurbantunggut Desert, Northern Xinjiang, China. J. Arid Environ. 2007, 68, 599–610. [Google Scholar] [CrossRef]
- Li, J.H.; Li, X.R.; Chen, C.Y. Degradation and reorganization of thylakoid protein complexes of Bryum argenteum in response to dehydration and rehydration. Bryologist 2014, 117, 110–118. [Google Scholar] [CrossRef]
- Gao, B.; Li, X.S.; Zhang, D.Y.; Liang, Y.Q.; Yang, H.L.; Chen, M.X.; Zhang, Y.M.; Zhang, J.H.; Wood, A.J. Desiccation tolerance in bryophytes: The dehydration and rehydration transcriptomes in the desiccation-tolerant bryophyte Bryum argenteum. Sci. Rep. 2017, 7, 7571–7584. [Google Scholar] [CrossRef]
- Gao, B.; Zhang, D.; Li, X.; Yang, H.; Wood, A.J. De novo assembly and characterization of the transcriptome in the desiccation-tolerant moss Syntrichia caninervis. BMC Res. Notes 2014, 7, 490. [Google Scholar] [CrossRef]
- Proctor, M.C.F.; Oliver, M.J.; Wood, A.J.; Alpert, P.; Stark, L.R.; Cleavitt, N.L.; Mishler, B.D. Desiccation-tolerance in bryophytes: A review. Bryologist 2007, 110, 595–621. [Google Scholar] [CrossRef]
- Li, Y.; Wang, Z.B.; Xu, T.H.; Tu, W.F.; Liu, C.; Zhang, Y.M.; Yang, C.H. Reorganization of photosystem II is involved in the rapid photosynthetic recovery of desert moss Syntrichia caninervis upon rehydration. J. Plant Physiol. 2010, 167, 1390–1397. [Google Scholar] [CrossRef] [PubMed]
- Hutin, C.; Nussaume, L.; Moise, N.; Moya, I.; Kloppstech, K.; Havaux, M. Early light-induced proteins protect Arabidopsis from photooxidative stress. Proc. Natl. Acad. Sci. USA 2003, 100, 4921–4926. [Google Scholar] [CrossRef] [PubMed]
- Meyer, G.; Kloppstech, K. A Rapidly Light-Induced Chloroplast Protein with a High Turnover Coded for by Pea Nuclear-DNA. Eur J. Biochem. 1984, 138, 201–207. [Google Scholar] [CrossRef]
- Grimm, B.; Kloppstech, K. The early light-inducible proteins of Barley characterization of 2 families of 2-h-specific nuclear-coded chloroplast proteins. Eur J. Biochem 1987, 167, 493–499. [Google Scholar] [CrossRef]
- Adamska, I. The Elip family of stress proteins in the thylakoid membranes of pro- and eukaryota. Regul. Photosynth. 2001, 11, 487–505. [Google Scholar]
- Rizza, A.; Boccaccini, A.; Lopez-Vidriero, I.; Costantino, P.; Vittorioso, P. Inactivation of the ELIP1 and ELIP2 genes affects Arabidopsis seed germination. New Phytol. 2011, 190, 896–905. [Google Scholar] [CrossRef]
- Harari-Steinberg, O.; Ohad, I.; Chamovitz, D.A. Dissection of the light signal transduction pathways regulating the two early light-induced protein genes in Arabidopsis. Plant. Physiol. 2001, 127, 986–997. [Google Scholar] [CrossRef]
- Montane, M.H.; Kloppstech, K. The family of light-harvesting-related proteins (LHCs, ELIPs, HLIPs): Was the harvesting of light their primary function? Gene 2000, 258, 1–8. [Google Scholar] [CrossRef]
- Chen, C.; Bai, L.H.; Qiao, D.R.; Xu, H.; Dong, G.L.; Ruan, K.; Huang, F.; Cao, Y. Cloning and expression study of a putative carotene biosynthesis related (cbr) gene from the halotolerant green alga Dunaliella salina. Mol. Biol. Rep. 2008, 35, 321–327. [Google Scholar] [CrossRef]
- Zeng, O.; Chen, X.B.; Wood, A.J. Two early light-indudible protein (ELIP) cDNAs from the resurrection plant Tortula ruralis are differentially expressed in response to desiccation, rehydration, salinity, and high light. J. Exp. Bot. 2002, 53, 1197–1205. [Google Scholar] [CrossRef] [PubMed]
- Rensing, S.A.; Lang, D.; Zimmer, A.D.; Terry, A.; Salamov, A.; Shapiro, H.; Nishiyama, T.; Perroud, P.F.; Lindquist, E.A.; Kamisugi, Y.; et al. The Physcomitrella genome reveals evolutionary insights into the conquest of land by plants. Science 2008, 319, 64–69. [Google Scholar] [CrossRef] [PubMed]
- Adamska, I.; Ohad, I.; Kloppstech, K. Synthesis of the early light-inducible protein is controlled by blue-light and related to light stress. Proc. Natl. Acad. Sci. USA 1992, 89, 2610–2613. [Google Scholar] [CrossRef] [PubMed]
- Adamska, I.; Kloppstech, K. Low temperature increases the abundance of early light-inducible transcript under light stress conditions. J. Biol. Chem. 1994, 269, 30221–30226. [Google Scholar] [PubMed]
- Humbeck, K.; Kloppstech, K.; Krupinska, K. Expression of early light-inducible proteins in flag leaves of field-crown barley. Plant. Physiol. 1994, 105, 1217–1222. [Google Scholar] [CrossRef][Green Version]
- Heddad, M.; Adamska, I. Light stress-regulated two-helix proteins in Arabidopsis thaliana related to the chlorophyll a/b-binding gene family. Proc. Natl. Acad. Sci. USA 2000, 97, 3741–3746. [Google Scholar] [CrossRef]
- Shimosaka, E.; Sasanuma, T.; Handa, H. A wheat cold-regulated cDNA encoding an early light-inducible protein (ELIP): Its structure, expression and chromosomal location. Plant. Cell Physiol. 1999, 40, 319–325. [Google Scholar] [CrossRef]
- Bartels, D.; Hanke, C.; Schneider, K.; Michel, D.; Salamini, F. A desiccation-related ELIP-like gene from the resurrection plant craterostigma-plantagineum is regulated by light and ABA. Embo J. 1992, 11, 2771–2778. [Google Scholar] [CrossRef]
- Montane, M.H.; Dreyer, S.; Triantaphylides, C.; Kloppstech, K. Early light-inducible proteins during long-term acclimation of barley to photooxidative stress caused by light and cold: High level of accumulation by posttranscriptional regulation. Planta 1997, 202, 293–302. [Google Scholar] [CrossRef]
- Pinto, F.; Berti, M.; Olivares, D.; Sierralta, W.D.; Hinrichsen, P.; Pinto, M. Leaf development, temperature and light stress control of the expression of early light-inducible proteins (ELIPs). Vitis vinifera L. Environ. Exp. Bot. 2011, 72, 278–283. [Google Scholar] [CrossRef]
- Lee, J.; Kim, T.J.; Lim, Y.P.; Bang, J.W.; Hur, Y. Molecular cloning and characterization of an early light-inducible gene, BrELIP, from Brassica rapa, and its overexpression protects Arabidopsis. Korean J. Genet. 2006, 28, 207–220. [Google Scholar]
- Zhuo, C.L.; Cai, J.L.; Guo, Z.F. Overexpression of Early Light-Induced Protein (ELIP) Gene from Medicago sativa ssp. falcata Increases Tolerance to Abiotic Stresses. Agron. J. 2013, 105, 1433–1440. [Google Scholar] [CrossRef]
- VanBuren, R.; Pardo, J.; Wai, C.M.; Evans, S.; Bartels, D. Massive tandem proliferation of ELIPs supports convergent evolution of desiccation tolerance across land plants. Plant. Physiol. 2019, 179, 1040–1049. [Google Scholar] [CrossRef] [PubMed]
- Green, B.R.; Kuhlbrandt, W. Sequence conservation of light-harvesting and stress-response proteins in relation to the 3-dimensional molecular-structure of LHCII. Photosynth. Res. 1995, 44, 139–148. [Google Scholar] [CrossRef] [PubMed]
- Alexandrov, N.N.; Brover, V.V.; Freidin, S.; Troukhan, M.E.; Tatarinova, T.V.; Zhang, H.Y.; Swaller, T.J.; Lu, Y.P.; Bouck, J.; Flavell, R.B.; et al. Insights into corn genes derived from large-scale cDNA sequencing. Plant. Mol. Biol. 2009, 69, 179–194. [Google Scholar] [CrossRef] [PubMed]
- Adamska, I.; Kloppstech, K.; Ohad, I. UV-light stress induces the synthesis of the early light-inducible protein and prevent its degradation. J. Biol. Chem. 1992, 267, 24732–24737. [Google Scholar] [PubMed]
- Wang, H.L.; Cao, F.L.; Li, G.P.; Yu, W.W.; Aitken, S.N. The transcript profiles of a putative early light-induced protein (ELIP) encoding gene in Ginkgo biloba L. under various stress conditions. Acta Physiol Plant 2015, 37, 1720–1732. [Google Scholar] [CrossRef]
- Hayami, N.; Sakai, Y.; Kimura, M.; Saito, T.; Tokizawa, M.; Iuchi, S.; Kurihara, Y.; Matsui, M.; Nomoto, M.; Tada, Y.; et al. The Responses of Arabidopsis Early Light-Induced Protein2 to Ultraviolet B, High Light, and Cold Stress Are Regulated by a Transcriptional Regulatory Unit Composed of Two Elements. Plant. Physiol. 2015, 169, 840–855. [Google Scholar] [CrossRef]
- Jansson, S. A guide to the Lhc genes and their relatives in Arabidopsis. Trends Plant. Sci. 1999, 4, 236–240. [Google Scholar] [CrossRef]
- Rossel, J.B.; Wilson, I.W.; Pogson, B.J. Global changes in gene expression in response to high light in Arabidopsis. Plant Physiol. 2002, 130, 1109–1120. [Google Scholar] [CrossRef]
- Li, J.G.; Yang, L.; Jin, D.; Nezames, C.D.; Terzaghi, W.; Deng, X.W. UV-B-induced photomorphogenesis in Arabidopsis. Protein Cell 2013, 4, 485–492. [Google Scholar] [CrossRef] [PubMed]
- Sharma, A.; Sharma, B.; Hayes, S.; Kerner, K.; Hoecker, U.; Jenkins, G.I.; Franklin, K.A. UVR8 disrupts stabilisation of PIF5 by COP1 to inhibit plant stem elongation in sunlight. Nat. Commun. 2019, 10, 4417–4426. [Google Scholar] [CrossRef] [PubMed]
- Adamska, I.; Kloppstech, K.; Ohad, I. Early light-inducible protein in pea is stable during light stress but is degraded during recovery at low light-intensity. J. Biol. Chem. 1993, 268, 5438–5444. [Google Scholar] [PubMed]
- Linsmaier, E.M.; Skoog, F. Organic Growth Factor Requirements of Tobacco Tissue Cultures. Physiol. Plant. 1965, 18, 100–127. [Google Scholar] [CrossRef]
- Alonso, J.M.; Stepanova, A.N.; Leisse, T.J.; Kim, C.J.; Chen, H.M.; Shinn, P.; Stevenson, D.K.; Zimmerman, J.; Barajas, P.; Cheuk, R.; et al. Genome-wide Insertional mutagenesis of Arab. thaliana. Science 2003, 301, 653–657. [Google Scholar] [CrossRef]
- Kumar, S.; Nei, M.; Dudley, J.; Tamura, K. MEGA: A biologist-centric software for evolutionary analysis of DNA and protein sequences. Brief. Bioinform. 2008, 9, 299–306. [Google Scholar] [CrossRef]
- Bustin, S.A.; Benes, V.; Garson, J.A.; Hellemans, J.; Huggett, J.; Kubista, M.; Mueller, R.; Nolan, T.; Pfaffl, M.W.; Shipley, G.L.; et al. The MIQE Guidelines: Minimum Information for Publication of Quantitative Real-Time PCR Experiments. Clin. Chem. 2009, 55, 611–622. [Google Scholar] [CrossRef]
- Hoekema, A.; Hirsch, P.R.; Hooykaas, P.J.J.; Schilperoort, R.A. A Binary Plant Vector Strategy Based on Separation of Vir-Region and T-Region of the Agrobacterium-Tumefaciens Ti-Plasmid. Nature 1983, 303, 179–180. [Google Scholar] [CrossRef]
- Clough, S.J.; Bent, A.F. Floral dip: A simplified method for Agrobacterium-mediated transformation of Arab. thaliana. Plant. J. 1998, 16, 735–743. [Google Scholar] [CrossRef]
- Ritchie, R.J. Consistent sets of spectrophotometric chlorophyll equations for acetone, methanol and ethanol solvents. Photosynth. Res. 2006, 89, 27–41. [Google Scholar] [CrossRef]
- Zhang, J.; Zhang, Y.M.; Downing, A.; Wu, N.; Zhang, B.C. Photosynthetic and cytological recovery on remoistening Syntrichia caninervis Mitt., a desiccation-tolerant moss from Northwestern China. Photosynthetica 2011, 49, 13–20. [Google Scholar] [CrossRef]


| Gene Name | ScELIP12 | ScELIP23 |
|---|---|---|
| Length of coding sequence (bp) | 995 | 904 |
| ORF (bp) | 711 | 624 |
| Predicted number of amino acids | 236 | 207 |
| Predicted molecular mass (kDa) | 25.68 | 21.69 |
| Predicted pI | 9.33 | 9.57 |
© 2020 by the authors. Licensee MDPI, Basel, Switzerland. This article is an open access article distributed under the terms and conditions of the Creative Commons Attribution (CC BY) license (http://creativecommons.org/licenses/by/4.0/).
Share and Cite
Liu, X.; Zhang, Y.; Yang, H.; Liang, Y.; Li, X.; Oliver, M.J.; Zhang, D. Functional Aspects of Early Light-Induced Protein (ELIP) Genes from the Desiccation-Tolerant Moss Syntrichia caninervis. Int. J. Mol. Sci. 2020, 21, 1411. https://doi.org/10.3390/ijms21041411
Liu X, Zhang Y, Yang H, Liang Y, Li X, Oliver MJ, Zhang D. Functional Aspects of Early Light-Induced Protein (ELIP) Genes from the Desiccation-Tolerant Moss Syntrichia caninervis. International Journal of Molecular Sciences. 2020; 21(4):1411. https://doi.org/10.3390/ijms21041411
Chicago/Turabian StyleLiu, Xiujin, Yigong Zhang, Honglan Yang, Yuqing Liang, Xiaoshuang Li, Melvin J. Oliver, and Daoyuan Zhang. 2020. "Functional Aspects of Early Light-Induced Protein (ELIP) Genes from the Desiccation-Tolerant Moss Syntrichia caninervis" International Journal of Molecular Sciences 21, no. 4: 1411. https://doi.org/10.3390/ijms21041411
APA StyleLiu, X., Zhang, Y., Yang, H., Liang, Y., Li, X., Oliver, M. J., & Zhang, D. (2020). Functional Aspects of Early Light-Induced Protein (ELIP) Genes from the Desiccation-Tolerant Moss Syntrichia caninervis. International Journal of Molecular Sciences, 21(4), 1411. https://doi.org/10.3390/ijms21041411