Abstract
We investigated structural changes and astrocyte responses of the lateral geniculate nucleus (LGN) in a ferret model of ocular hypertension (OH). In 10 ferrets, OH was induced via the injection of cultured conjunctival cells into the anterior chamber of the right eye; six normal ferrets were used as controls. Anterograde axonal tracing with cholera toxin B revealed that atrophic damage was evident in the LGN layers receiving projections from OH eyes. Immunohistochemical analysis with antibodies against NeuN, glial fibrillary acidic protein (GFAP), and Iba-1 was performed to specifically label neurons, astrocytes, and microglia in the LGN. Significantly decreased NeuN immunoreactivity and increased GFAP and Iba-1 immunoreactivities were observed in the LGN layers receiving projections from OH eyes. Interestingly, the changes in the immunoreactivities were significantly different among the LGN layers. The C layers showed more severe damage than the A and A1 layers. Secondary degenerative changes in the LGN were also observed, including neuronal damage and astrocyte reactions in each LGN layer. These results suggest that our ferret model of OH is valuable for investigating damages during the retina–brain transmission of the visual pathway in glaucoma. The vulnerability of the C layers was revealed for the first time.
1. Introduction
Glaucoma is a leading cause of irreversible blindness worldwide, and it is characterized by the death of retinal ganglion cells [1,2]. Additionally, glaucoma optic neuropathy (GON) leads to secondary damage to the central visual system, which processes vision via the optic nerve, the lateral geniculate nucleus (LGN), and the primary visual cortex (V1) [3,4,5,6]. In experimentally induced glaucoma in monkeys, neuronal degeneration was observed in the magnocellular, parvocellular, and koniocellular pathways in the LGN, and these changes were related to the increase in intraocular pressure (IOP) and severity of optic nerve damage [7,8]. These secondary degenerations in the central nervous system may indicate that GON is a complicated, irreversible, and progressive disease.
Anatomically, conventional rodent models, such as rats and mice, do not have the lamination of the LGN and the numbers of the LGN lamina in these models differ from those in carnivores and primates [9,10,11,12,13,14,15,16,17,18,19,20,21,22,23,24,25]. Therefore, an experimental monkey model of glaucoma has been anticipated to be an ideal model for the evaluation of central visual system changes in glaucoma. However, performing numerous experiments in monkeys is significantly challenging. Thus, we have previously reported on the development of a ferret model of ocular hypertension (OH) [26]. Ferrets possess highly developed binocular vision compared with rodents, and electrophysiological and morphological data of the ferret visual system have been accumulated [27,28,29,30,31,32,33,34,35,36,37,38,39,40].
In our ferret model of OH, damage to the optic tract projected from the OH eye was apparent and damage to the optic tract of the untreated eye was also significant [26]. Thus, secondary degeneration of the optic tract accompanied by the degeneration of the glaucomatous optic nerve may be investigated in this ferret model.
Retinal ganglion cells are functionally divided into three cell types—magno, parvo, and konio cells—in primates, including humans, and the corresponding types in ferrets are known as X, Y, and W cells [27]. Among these, konio cells have been analyzed in detail because damage to konio cells, which perform blue/yellow chromatic processing, was reported to occur earlier than that to other cell types in early stage glaucoma [4,5,41]. So far, there have been few reports regarding damage to konio cells during glaucoma pathogenesis. It seemed possible that these different susceptibilities of three types of LGN cells to trans-synaptic degeneration were caused by anatomical retinal connectivity. Another possibility is that konio cells in the LGN are more sensitive to OH than magno and parvo cells in the LGN.
The analysis of W cells in ferrets would be interesting. While konio cells project to the interlayer of the LGN in primates, the corresponding W cells project to the C layer, which clearly and independently localized in the dorsal area of the ferret LGN [4,5,30,31,33].
In this study, we aimed to analyze the changes of neurons, astrocytes, and microglia in the LGN in our ferret model of OH using immunohistochemistry.
2. Results
2.1. IOP of the OH Model
Elevation of IOP was observed in 10 ferrets from the first week after cell injection.
In OH ferrets, at baseline, average IOP in the right and left eyes were 18.8 ± 2.0 and 17.7 ± 3.0 mmHg, respectively. At 13 weeks, Average IOP in the right (treated; G1) and left (untreated; G2) eyes was 50.0 ± 17.0 and 14.5 ± 3.9 mmHg, respectively. The IOP of treated eyes was significantly higher than the IOP of untreated eyes (n = 10, paired t-test, p < 0.05; Figure 1A).
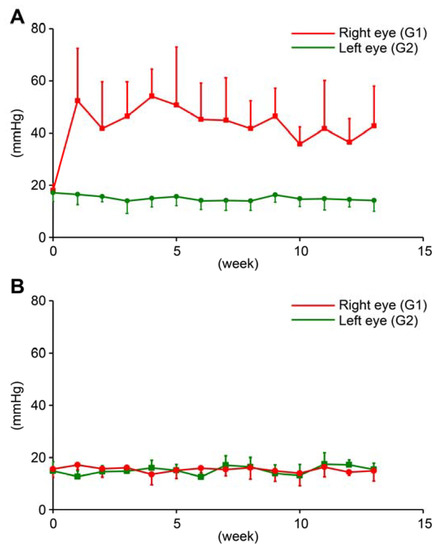
Figure 1.
Intraocular pressure (IOP) of ocular hypertension (OH) eyes (G1), contralateral untreated eyes of OH ferret (G2), and normal eyes of control ferret (G3). (A): Red line indicates IOP of right OH eyes, and green line indicates IOP of contralateral left untreated eyes in OH ferret (mean ± S.D.). (B): Red and green line indicate IOP of right and left eyes in control ferret (mean ± S.D.).
In normal ferrets, IOP of untreated normal ferrets was recorded for 13 weeks. At baseline, average IOP in the right and left eyes (G3) were 15.6 ± 3.1 and 14.8 ± 3.6 mmHg, respectively in normal ferrets. At 13 weeks, average IOP in the right and left eyes were 14.9 ± 3.9 and 15.4 ± 2.4 mmHg, respectively in normal ferrets. There was no significant difference between right and left eyes in untreated normal ferrets. (n = 6, paired t-test, p > 0.05; Figure 1B).
2.2. Microscopic Analysis of the Visual Tract in the OH Model
2.2.1. Histological Analysis
In normal ferrets, CTB conjugated to Alexa 555 (red label) and Alexa 488 (green label) injected into the right and left eyes, respectively, were distributed in A, A1, and C layers of both the LGNs (Figure 2A); the A layer receives contralateral afferent projections, whereas the A1 layer receives ipsilateral projections. Therefore, the A layer was stained with red CTB in the left LGN and green CTB in the right LGN, while the A1 layer was stained with green CTB in the left LGN and red CTB in the right LGN (Figure 2A). C layers contain both contralateral and ipsilateral projections (Figure 2A).
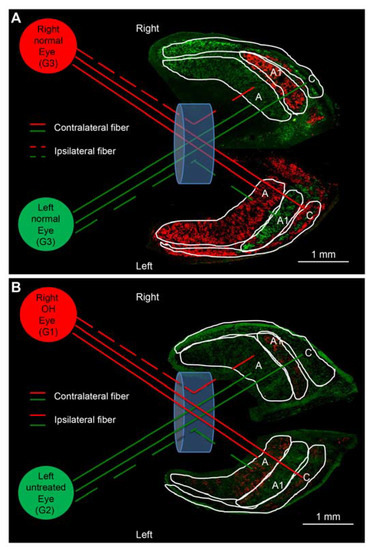
Figure 2.
Axonal projection from the eye to lateral geniculate nucleus (LGN) layers in the normal and OH ferret. (A): A and C layers project to the contralateral side, whereas A1 layer projects to the ipsilateral side. Red and green CTB injected into the right and left eyes, respectively, are projected on both sides of LGN in control ferrets and looks similar staining intensity (white bar = 1 mm). (B): In OH ferrets, left A and C layers and right A1 layers of LGN projecting from the right OH eye (G1) showed weaker CTB staining intensity compared to those from the left untreated contralateral eyes (G2; white bar = 1 mm).
In the OH ferrets in which OH was induced only in the right eye (OH period, 13 weeks), apparently weakened CTB red projections were observed in the left A and C layers and right A1 layers of the LGN, which received afferent projections from the right OH eyes (G1). Similarly, apparently weakened CTB green projections were observed in the right A and C layers and left A1 layer of the LGN, which received afferent projections from the left untreated eyes (G2; Figure 2B).
2.2.2. Quantitative Analysis of A, A1, and C Layers of the LGN in the OH Model
Quantitative analysis of the immunointensity of CTB was performed in the LGN of normal and OH ferrets (OH period, 13 weeks; normal, n =6; OH, n = 10). The intensity of CTB red in the left A, right A1, and left C layers from the right OH eyes (G1) compared with that in normal ferrets (G3) was reduced by 66.7%, 71.5%, and 80.9%, respectively (Figure 3A). The immunointensity of CTB in each LGN layers from the right OH eyes (G1) was significantly decreased compared with that in the corresponding LGN layers in the eyes of the control ferrets (G3; unpaired t-test, p < 0.01; Figure 3A).
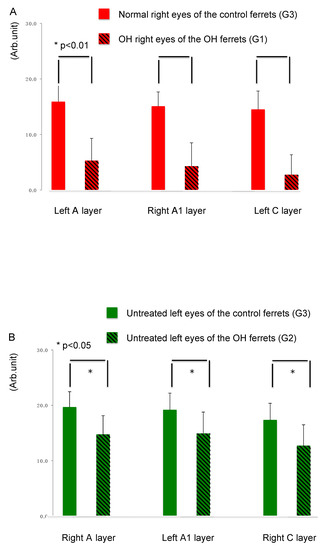
Figure 3.
Comparison of axon damage in LGN layers of the OH ferret and the control ferret. (A): The immunointensity of CTB in each LGN layer projected from the OH right eyes (G1) of OH ferrets was significantly decreased than in corresponding LGN layers in the untreated right eyes of control ferrets (G3; n = 10, unpaired t-test, p < 0.01). (B): The immunointensity of CTB in each LGN layer projected from the contralateral untreated left eyes (G2) of OH ferrets was significantly decreased than in corresponding LGN layers in the untreated left eyes of control ferrets (G3; n = 10, unpaired t-test, p < 0.05).
The intensity of CTB green in the right A, left A1, and right C layers from the left untreated eyes (G2) compared with that of normal ferrets (G3) were reduced by 25.1%, 22.1%, and 26.8%, respectively (Figure 3B). The immunointensity of CTB in LGN layers from the left untreated eyes (G2) of treated ferrets was significantly decreased compared with that in the corresponding LGN layers in the eyes of control ferrets (G3; unpaired t-test, p < 0.05; Figure 3B).
2.3. Immunological Analysis of the Visual Tract
2.3.1. Neurons
Next, we investigated the expression of NeuN in the LGN as a neuronal cell marker since it is observed in most neuronal cell types throughout the nervous system. NeuN immunoreactivity was observed in the A, A1, and C layers in both control and OH ferrets (Figure 4A).
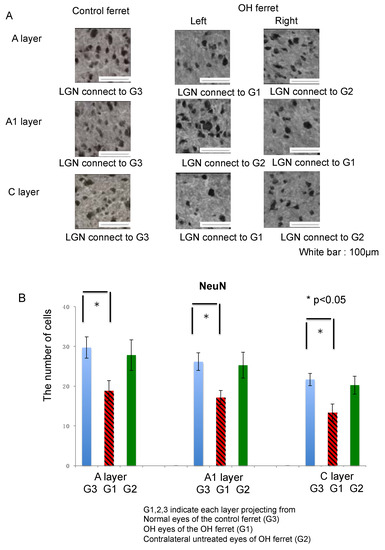
Figure 4.
Immunohistological images of neurons in LGN of the OH (G1) and the untreated contralateral eyes (G2) of the OH ferret, and the normal eyes (G3) of the control ferret. (A): NeuN staining indicating neuronal cells. (200 μm × 200 μm square; white bar = 100 μm). (B) Comparison of neurons in LGN layers projecting from the OH (G1) and the untreated contralateral eyes (G2) of the OH ferret, and the normal eyes (G3) of the control ferret. B: The number of NeuN immunoreactive neuronal cells. Significant decrease of the number of NeuN-immunoreactive cells was observed in A, A1, and C layers of G1, compared with those layers of G3 (n = 10, paired t-test, p < 0.01).
Quantitative analysis of NeuN-immunoreactive cells in the A, A1, and C LGN layers of normal and OH ferrets (OH period, 13 weeks; normal, n = 6; OH, n = 10) was performed to elucidate the nature and extent of neuronal damage to the LGN. There was no significant difference in the numbers of NeuN-immunoreactive cells in the A, A1, and C layers of the LGN on either side in normal ferrets. In OH ferrets, significant decreases in the number of NeuN-immunoreactive cells in the A, A1, and C layers of the LGN projecting from the OH eyes (right; G1) were observed compared with those from the eyes of the control ferrets (G3; unpaired t-test, p < 0.01; Figure 4B). However, no significant decrease in the number of NeuN-immunoreactive cells in the right A, left A1, and right C layers of the LGN projecting from the untreated eyes of OH ferrets (G2), was observed compared with those from eyes of the control ferrets (G3; unpaired t-test, p > 0.05; Figure 4B).
In each LGN layer, the number of NeuN-positive cells was compared between normal and OH ferrets, and the reduction compared with normal ferrets was calculated. The number of NeuN-positive cells decreased by 36.6% in the left A, 34.6% in the right A1, and 38.4% in the left C layers of the LGN projecting from the OH eyes (G1). Decrease in the number of NeuN-positive cells was the highest in the C layer projecting from the OH eyes (G1). The number of NeuN-positive cells decreased by 6.4% in the right A, 3.5% in the left A1, and 6.6% in the right C layers of the LGN, which were projected from the contralateral untreated eyes (G2; Table 1).

Table 1.
Quantitative analysis of projecting axons and neuroglial responses in A, A1, and C layers of OH ferret LGN.
2.3.2. Astrocytes
GFAP-immunoreactive cells in the LGN showed small, stellate cell bodies with short, thin processes characteristic to nonreactive astrocytes. In the LGN of normal ferrets, GFAP immunoreactivity was present and evenly distributed across the three layers (Figure 5A).
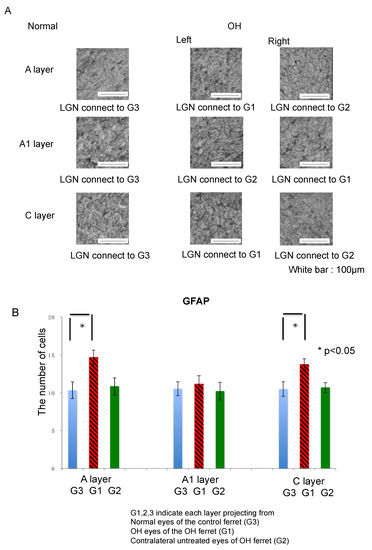
Figure 5.
Immunohistological images of neuroglial cells in LGN of the OH (G1) and the untreated contralateral eyes (G2) of the OH ferret, and the normal eyes (G3) of the control ferret. (A): GFAP staining indicating microglia. (200 μm × 200 μm square; white bar = 100 μm). Comparison of neuroglial cells in LGN layers projecting from the OH (G1) and the untreated contralateral eyes (G2) of the OH ferret, and the normal eyes (G3) of the control ferret. (B): The number of GFAP immunoreactive glial cells. Significant increase of the number of GFAP-1-immunoreactive cells were observed in the A and C layers of G1, compared with those of G3 (n = 10, paired t-test, p < 0.05).
There were no significant differences in GFAP immunoreactivity in the A, A1, and C layers of the LGN on either side in normal ferrets. In OH ferrets, GFAP immunoreactivity was increased and evenly distributed across all layers and reactive astrocytes were observed.
The number of GFAP-positive cells in the A, A1, and C layers of the LGN in the normal and OH ferrets were calculated to investigate glial activation in the LGN (OH period, 13 weeks; OH, n = 10; normal, n = 6). The numbers of GFAP-positive cells were increased in the A, A1, and C layers projecting from OH eyes (G1) compared with those from the untreated eyes (G2) and the normal eyes (G3). Among them, the numbers of GFAP-positive cells in the left A layer and left C layer were significantly increased (unpaired t-test, p < 0.05; Figure 5B).
Next, the number of GFAP positive cells in each LGN layer was compared between normal and OH ferrets. The number of GFAP positive cells increased by 42.3%, 6.4%, and 30.4% in the left A, right A1, and left C layers of the LGN, respectively, which were projected from the right OH eyes (G1). The number of GFAP positive cells increased by 4.9%, −3.1%, and 1.6% in the right A, left A1, and right C layers of the LGN, respectively, which were projected from the untreated eyes (G2; Table 1).
2.3.3. Microglia
Iba-1 is a selective marker for microglia. In the LGN of normal ferrets, Iba-1 immunoreactivity was mainly observed in cell body and was evenly distributed across layers A, A1, and C (Figure 6A).
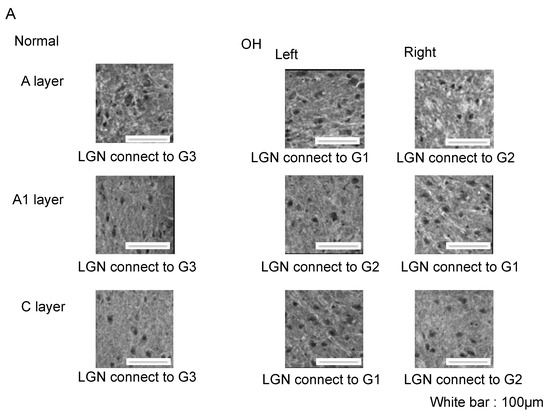

Figure 6.
Immunohistological images of neuroglial cells in LGN of the OH (G1) and the untreated contralateral eyes (G2) of the OH ferret, and the normal eyes (G3) of the control ferret. (A): Iba-1 staining indicating microglia. (200 μm × 200 μm square; white bar = 100 μm). Comparison of neuroglial cells in LGN layers projecting from the OH (G1) and the untreated contralateral eyes (G2) of the OH ferret, and the normal eyes (G3) of the control ferret. (B): The number of Iba-1 immunoreactive microglial cells. A significant increase of the number of Iba-1-immunoreactive cells was observed in A, A1, and C layers of G1, compared with those of G3 (n = 10, paired t-test, p < 0.05).
The number of Iba-1-positive cells in the A, A1, and C layers of the LGN in the normal and OH ferrets were calculated to investigate microglial activation in the LGN (OH period, 13 weeks; OH, n = 10; normal, n = 6). In the LGN of OH ferrets, a remarkable increase of Iba-1 immunoreactivity was observed, with strongly stained cell bodies. Iba-1-immunoreactive cells showed similar spatial and temporal distribution patterns to Iba-1 immunoreactivity in the control and glaucomatous LGN, and immunoreactivity was significantly elevated in the glaucomatous layers. Significantly increased Iba-1 immunoreactivity was observed in the A, A1, and C layers projecting from OH eyes (G1) compared with those from the untreated eyes (G2) and the normal eyes (G3; unpaired t-test, p < 0.05; Figure 6B).
The number of Iba-1-positive cells in each LGN layer was compared between normal and OH ferrets, and the rate of change compared with normal ferrets was calculated. The numbers of Iba-1-positive cells were increased by 16.2% in left A, 22.1% in right A1, and 27.5% in left C layers, which were projected from the right OH eye (G1), compared with that in the eyes of normal ferrets (G3). The numbers of Iba-1 positive cells increased by −3.2%, −2.3%, and 3.3%, respectively, in the right A, left A1, and right C layers, which were projected from the untreated eyes (G2). This increase in the number of Iba-1-positive cells was prominent in the C layer projected from the right OH eye (G1). Moreover, there was a marked decrease in the number of neurons in the C layer, suggesting that the neuronal damage and reactive glial response were the most severe in the C layer (Table 1).
3. Discussion
Ferrets have abundant non-cross fibers in the optic nerve, unlike mice and rats, and the C layer projected from W cells (konio cells in humans and monkeys) is easily observed as independent layers. In this study, we examined glaucomatous optic neuropathy and associated central neuropathy in the LGN using a ferret model of OH.
This is the first report of the analysis of the LGN in a ferret glaucoma model. We uncovered decreased numbers of neurons and increased activity of glial cells in the A, A1, and C layers of the LGN, projected from OH eyes. In addition, we found that the damage to the C layer was the greatest, suggesting that W cells projecting to the C layer were more sensitive and vulnerable to OH-induced neuronal damage compared with X and Y cells projecting to the A and A1 layers.
Since the LGN of mice and rats does not form a layered structure, they are not suitable animal models for analyzing glaucoma-induced CNS changes [11]. Furthermore, distinction among magno, parvo, and konio cells is unclear in mice, and therefore detailed examination cannot be conducted in rodents. In humans and monkeys, the LGN shows a six-layered structure, but the diffuse structure of konio cells across layers of the LGN makes it difficult to observe konio cells in detail [5,8]. Thus, the use of ferrets has a significant advantage in that we can observe distinct LGN layers. Similar to konio cells in monkeys and humans, W cells in the LGN project to the C layers, which exist as independent layers [30,31,33].
Our results clearly showed that damage due to OH is greater in the C layer than in the A and A1 layers, suggesting that our ferret model of OH is useful for the analysis of W cells, which correspond to konio cells in humans and monkeys.
Previous reports on central nervous system disorders in experimental animal models of OH are summarized in Table 2. In our ferret model of OH, axonal injury of the optic nerve was observed based on decreased fluorescence intensity of CTB in the LGN. Interestingly, we also found injury of axons projected from normal eyes as decreased CTB fluorescence intensity in the LGN. So far, there have been no detailed reports on bilateral LGN damage due to unilateral OH in the animal OH model. Here, we report for the first time that axonal injury from unilateral OH disturbed bilaterally in all three LGN layers. However, this model showed more acute damage than is observed in primary open angle glaucoma (POAG); therefore, it is questionable whether similar neuronal disturbances and glial activation are induced in POAG eyes [42,43,44]. A chronic OH model is required for the analysis of the secondary degeneration of CNS in POAG.
Table 2.
Comparison of LGN damage induced by OH in ferrets, monkeys, and rats.
The number of NeuN-positive cells was decreased in all the layers (A, A1, and C) projected from the OH eyes (Table 1 and Table 2). Previously, decreased the number of neurons in the LGN in monkeys [7,44,45] and decreased LGN volume in humans [46] has been reported. Our findings in ferrets corroborate these results.
Astrocytes and microglia were activated in A, A1, and C layers, which were projected from the OH eyes (Figure 5B and Figure 6B). While some studies have reported that glial cells were activated during severe glaucomatous optic neuropathy [45,47,48,49,50], other did not observe this [44]. These differences may be due to differences in OH duration. In this study, because we analyzed the LGN at 13 weeks from optic nerve axonal injury due to OH, the activity of glial cells may have been retained. The relationship of IOP and the stain intensity is an interesting point, but unfortunately our study had only 13 ferrets in this experiment. The analysis of this point was difficult for this time. In order to clarify the relationship between LGN neuronal degeneration and glial activation, it would be better to observe both neuronal degeneration and glial activation as a time-course after injection of conjunctival cells. Although activated astrocytes and microglia are usually observed as cells with radial processes, such cells are not found in this experiment. In our experiments, fresh-frozen sections were used for immuno-staining because fresh-frozen sections had better reactivity to antibodies compared to sections made from perfusion-fixed tissue. In general, fine structures in fresh-frozen sections were less visible than those in perfusion-fixed sections. This seems to be the reason why it was difficult to recognize processes. In addition, we used thin 14 µm sections for immuno-staining, and it was often difficult to observe fine processes in thin sections.
There were some disadvantages of our ferret OH model. First, injection of conjunctival cells elicited intracameral inflammation, which may elicit retinal and axonal degeneration and subsequently histological changes of LGN mimicking inflammatory glaucoma unlike POAG. Second, it was hard to regulate IOP to establish a mild glaucoma model such as POAG. Thus, it may be difficult to discern if activation of astrocytes and microglia in LGN was caused by chronic IOP-dependent mimicking open angle glaucoma or subacute ischemic-damage of axons mimicking primary angle closure glaucoma. In the future, we need to overcome these disadvantages of OH ferrets models.
In conclusion, we, for the first time, examined the neuroglial responses in LGN using a ferret model of OH. Axonal injury was observed in the area of the both LGN projecting from the OH eyes. We found that W cells in the C layer, corresponding to konio cells in humans and monkeys, were greatly affected. Following a decrease in the number of neurons, glial cells were activated in LGN layers projecting from the OH eyes. Our ferret model of OH was useful for analyzing pressure-dependent CNS changes.
4. Materials and Methods
4.1. Animals
All animal experiments were performed according to the ethical guidelines for animal experimentation of the Graduate School of Medicine and Faculty of Medicine at the University of Tokyo (approval number: 1795, approval date: 10 February 2010), and all animal experiments were performed in accordance with the Guidelines for the ARVO Statement for the Use of Animals in Ophthalmic and Vision Research.
A total of 16 adult (age, 16–32 weeks) female Marshall ferrets were obtained from Marshall BioResources (New York, USA). The animals were housed at of 23 °C with a 12-h light/12-h dark cycle and were provided food and water ad libitum.
4.2. Preparation of Conjunctival Cells
A 1 mm × 2 mm rectangle of conjunctival tissue was excised from a ferret, minced in phosphate buffered saline with 100 µg/mL streptomycin, and cultured under standard conditions (moist atmosphere, 5 % CO2, 37 °C) in Dulbecco’s Minimum Essential Medium (DMEM) supplemented with 20 % fetal bovine serum (FBS), and 100 µg/mL streptomycin for 8 weeks. At this time, the cells were fully confluent and transformed into fibroblasts. Cultured fibroblasts were repeatedly cultured every 7 days after achieving full confluent.
4.3. Injection of Cultured Cells and Treatment of Eyes
Before the cells were fully confluent, a trypsinized cell suspension (3.3 × 10⁴ cell/mL: 50 μL) was injected into the anterior chamber of the right eye with a 32-gauge needle in 15 ferrets, and the left eye was untreated. After injection, the corneas of the injected OH right eye and non-treated left eye were treated with an ointment of 0.3 % ofloxacin.
4.4. Development of the Ferret Model of OH
The right eyes of 10 ferrets were established as OH eyes (G1) by injecting cultured conjunctival cells into the anterior chamber aiming the angle closure synechia [26], and the contralateral left eyes were untreated and used as a control against the right OH eye (G2). Twelve eyes of 6 ferrets with normal ocular pressure were used as controls (G3). IOP was measured every week for 13 weeks after the injection of conjunctival cells, using the TonoLab® (Tiolat, Helsinki, Finland).
4.5. Tracer Injection
To detect the connection and degeneration of the visual system from the eye to LGN, dyes were injected as described previously [30,31]. Briefly, 5 μL Cholera toxin B (CTB) conjugated to Alexa 555 (red label) or Alexa 488 (green label) was injected into the vitreous body with a 33-gauge needle at pars plana. Red and green CTB were injected into the right and left eyes of each ferret, respectively.
4.6. Microscopic Analysis of the Visual Tract in the OH Model
Brains were isolated 4 days after CTB injection, embedded in optimal cutting temperature compound, and frozen. Horizontal sections including the LGN (14-μm thick) were obtained using a cryostat. Sections were fixed in 4% paraformaldehyde (PFA) in PBS for 10 min and observed using a fluorescence microscope.
To compare the average fluorescence intensities between the normal and OH ferrets, photographs of (200 × 200 μm2) of the A, A1, and C layers in the LGN were obtained. We obtained all of the images under the same procedure, same imaging conditions, and same contrast. In order to increase the reliability of the quantification, we used two different locations (medial and lateral locations) in layers A, A1, and C at a size of 200 × 200 μm2. Fluorescence intensity was measured using ImageJ®. The average intensity of each layer of LGN was compared between OH (n = 10) and normal ferrets (n = 6). Next, fluorescence intensities were compared between 3 LGN layers (A, A1, and C) of G1, G2, and G3, and the increase of intensities of G1 and G2 was calculated in comparison with G3.
4.7. Immunohistochemistry of the Visual Tract in the OH Model
Immunohistochemistry was performed as described previously with slight modifications [30,31]. In the current study, we conducted a preliminary experiment and it was confirmed that astrocytes, and microglia was stained well using the GFAP monoclonal antibody (G3893; Sigma-Aldrich, St. Louis, MO, USA) and the Iba-1 polyclonal antibody (019-19741; Wako, Osaka, Japan), respectively (Supplemental data 1) [32].
Furthermore, these findings were observed in G3. Immunostaining was performed under an identical same procedure, same imaging condition, and same contrast condition, and the procedures were processed with the same protocol by the same person, we used the same antibody lot and the same immunohistochemistry was done in the same day. Horizontal sections (14-μm thick) were made using a cryostat, fixed in 4% PFA for 10 min, permeabilized with 0.1% Triton X-100/PBS, and washed with 0.01 M PBS (pH 7.4). They were then pre-incubated with 10% normal goat serum in 0.01 M PBS for 30 min and incubated for 1 day at 4 °C with primary antibodies, which included mouse anti-NeuN monoclonal antibody (1:1000 dilution; MAB377; Chemicon, USA), mouse anti-glial fibrillary acidic protein (GFAP) monoclonal antibody (1:600 dilution) (G3893; Sigma, USA), and rabbit anti-ionized calcium-binding adaptor molecule 1 (Iba-1) polyclonal antibody (1: 600 dilution; 019-19741; Wako, Osaka, Japan) in a solution of 10% normal goat serum in 0.01 M PBS containing 0.3% Triton X-100. Horizontal sections were then washed with PBS and incubated with biotinylated anti-mouse or anti-rabbit IgG before being incubated with avidin–biotin–peroxidase complex for 30 min at room temperature. Finally, diaminobenzidine was used as a peroxidase substrate for visualization.
4.8. Quantification
To quantify NeuN, GFAP, and Iba-1-positive cells, a photograph of (200 × 200 μm2) of the A, A1, and C layers of the LGN was obtained. In order to increase the reliability of the quantification, we use two different locations (medial and lateral locations) in layers A, A1, and C at a size of 200 × 200 μm2. The numbers of NeuN, GFAP, and Iba-1-positive cells were counted using ImageJ®.
4.9. Statistics
All data are shown as mean and standard deviation. Differences in IOP between injected and control eyes were statistically evaluated using a paired t-test with Bonferroni correction. Difference in the numbers of the NeuN- and Iba-1-positive cells in the A, A1, and C layers of the LGN between the injected and control eyes were evaluated using a paired t-test. Difference in the intensity of GFAP staining in the A, A1, and C layers of the LGN between the injected and control eyes were evaluated using a paired t-test.
Supplementary Materials
Supplementary materials can be found at https://www.mdpi.com/1422-0067/21/4/1339/s1.
Author Contributions
Conceptualization, T.F., H.K., R.Y. and M.A.; methodology, T.F. and M.H.; software, T.F. and H.K.; validation, T.F., M.H., and M.A.; formal analysis, T.F., H.K., and R.Y.; investigation, T.F. and R.Y.; resources, T.F. and H.K.; data curation, T.F., H.K. and R.Y.; writing—original draft preparation, T.F., M.H., H.K., and M.A.; writing—review and editing, M.H., H.K., R.Y., R.A. and M.A.; visualization, T.F., and H.K.; supervision, H.K. and M.A.; project administration, M.A.; funding acquisition, T.F. All authors have read and agreed to the published version of the manuscript.
Funding
This research was funded by Japan Society for the Promotion of Science KAKENHI, grant number JP 19K09946.
Conflicts of Interest
The authors declare no conflict of interest. The funders had no role in the design of the study; in the collection, analyses, or interpretation of data; in the writing of the manuscript, or in the decision to publish the results.
Abbreviations
| LGN | lateral geniculate nucleus |
| OH | ocular hypertension |
| GFAP | glial fibrillary acidic protein |
| GON | glaucoma optic neuropathy |
| IOP | intraocular pressure |
| POAG | primary open angle glaucoma |
| CNS | Central nervous system |
| DMEM | Dulbecco’s Minimum Essential Medium |
| FBS | fetal bovine serum |
| PFA | paraformaldehyde |
| GFAP | anti-glial fibrillary acidic protein |
References
- Weinreb, R.N.; Friedman, D.S.; Fechtner, R.D.; Cioffi, G.A.; Coleman, A.L.; Girkin, C.A.; Liebmann, J.M.; Singh, K.; Wilson, M.R.; Wilson, R.; et al. Risk assessment in the management of patients with ocular hypertension. Am. J. Ophthalmol. 2004, 138, 458–467. [Google Scholar] [CrossRef] [PubMed]
- Quigley, H.A.; Broman, A.T. The number of people with glaucoma worldwide in 2010 and 2020. Br. J. Ophthalmol. 2006, 90, 262–267. [Google Scholar] [CrossRef] [PubMed]
- Gupta, N.; Ly, T.; Zhang, Q.; Kaufman, P.L.; Weinreb, R.N.; Yücel, Y.H. Chronic ocular hypertension induces dendrite pathology in the lateral geniculate nucleus of the brain. Exp. Eye Res. 2007, 84, 176–184. [Google Scholar] [CrossRef] [PubMed]
- Ito, Y.; Shimazawa, M.; Chen, Y.N.; Tsuruma, K.; Yamashima, T.; Araie, M.; Hara, H. Morphological changes in the visual pathway induced by experimental glaucoma in Japanese monkeys. Exp. Eye Res. 2009, 89, 246–255. [Google Scholar] [CrossRef]
- Yücel, Y.H.; Zhang, Q.; Weinreb, R.N.; Kaufman, P.L.; Gupta, N. Effects of retinal ganglion cell loss on magno-, parvo-, koniocellular pathways in the lateral geniculate nucleus and visual cortex in glaucoma. Prog. Retin. Eye Res. 2003, 22, 465–481. [Google Scholar] [CrossRef]
- Sasaoka, M.; Nakamura, K.; Shimazawa, M.; Ito, Y.; Araie, M.; Hara, H. Changes in visual fields and lateral geniculate nucleus in monkey laser-induced high intraocular pressure model. Exp. Eye Res. 2008, 86, 770–782. [Google Scholar] [CrossRef]
- Weber, A.J.; Chen, H.; Hubbard, W.C.; Kaufman, P.L. Experimental glaucoma and cell size, density, and number in the primate lateral geniculate nucleus. Investig. Ophthalmol. Vis. Sci. 2000, 41, 1370–1379. [Google Scholar]
- Yücel, Y.H.; Zhang, Q.; Gupta, N.; Kaufman, P.L.; Weinreb, R.N. Loss of neurons in magnocellular and parvocellular layers of the lateral geniculate nucleus in glaucoma. Arch. Ophthalmol. 2000, 118, 378–384. [Google Scholar] [CrossRef]
- Sun, X.; Cheng, F.; Meng, B.; Yang, B.; Song, W.; Yuan, H. Pregnenolone sulfate decreases intraocular pressure and changes expression of sigma receptor in a model of chronic ocular hypertension. Mol. Biol. Rep. 2012, 39, 6607–6614. [Google Scholar] [CrossRef]
- Hains, B.C.; Waxman, S.G. Neuroprotection by sodium channel blockade with phenytoin in an experimental model of glaucoma. Investig. Ophthalmol. Vis. Sci. 2005, 46, 4164–4169. [Google Scholar] [CrossRef][Green Version]
- Aihara, M. The use of mice in glaucoma research-to clarify the mechanism of intraocular pressure regulation and retinal ganglion cell damage. Nihon Ganka Gakkai Zasshi 2010, 114, 217–246. [Google Scholar]
- Aihara, M.; Lindsey, J.D.; Weinreb, R.N. Experimental mouse ocular hypertension: Establishment of the model. Investig. Ophthalmol. Vis. Sci. 2003, 44, 4314–4320. [Google Scholar] [CrossRef]
- Aihara, M.; Lindsey, J.D.; Weinreb, R.N. Ocular hypertension in mice with a targeted type I collagen mutation. Investig. Ophthalmol. Vis. Sci. 2003, 44, 1581–1585. [Google Scholar] [CrossRef]
- Yu, S.; Tanabe, T.; Yoshimura, N. A rat model of glaucoma induced by episcleral vein ligation. Exp. Eye Res. 2006, 83, 758–770. [Google Scholar] [CrossRef]
- Gross, R.L.; Ji, J.; Chang, P.; Pennesi, M.E.; Yang, Z.; Zhang, J.; Wu, S.M. A mouse model of elevated intraocular pressure: Retina and optic nerve findings. Trans. Am. Ophthalmol. Soc. 2003, 101, 163–169. [Google Scholar]
- Grozdanic, S.D.; Betts, D.M.; Sakaguchi, D.S.; Allbaugh, R.A.; Kwon, Y.H.; Kardon, R.H. Laser-induced mouse model of chronic ocular hypertension. Investig. Ophthalmol. Vis. Sci. 2003, 44, 4337–4346. [Google Scholar] [CrossRef]
- Ji, J.; Chang, P.; Pennesi, M.E.; Yang, Z.; Zhang, J.; Li, D.; Wu, S.M.; Gross, R.L. Effects of elevated intraocular pressure on mouse retinal ganglion cells. Vis. Res. 2005, 45, 169–179. [Google Scholar] [CrossRef] [PubMed]
- Ruiz-Ederra, J.; Verkman, A.S. Mouse model of sustained elevation in intraocular pressure produced by episcleral vein occlusion. Exp. Eye Res. 2006, 82, 879–884. [Google Scholar] [CrossRef] [PubMed]
- Sawada, A.; Neufeld, A.H. Confirmation of the rat model of chronic, moderately elevated intraocular pressure. Exp. Eye Res. 1999, 69, 525–531. [Google Scholar] [CrossRef] [PubMed]
- Tsuruga, H.; Murata, H.; Araie, M.; Aihara, M. A model for the easy assessment of pressure-dependent damage to retinal ganglion cells using cyan fluorescent protein-expressing transgenic mice. Mol. Vis. 2012, 18, 2468–2478. [Google Scholar] [PubMed]
- Urcola, J.H.; Hernández, M.; Vecino, E. Three experimental glaucoma models in rats: Comparison of the effects of intraocular pressure elevation on retinal ganglion cell size and death. Exp. Eye Res. 2006, 83, 429–437. [Google Scholar] [CrossRef] [PubMed]
- Lam, D.Y.; Kaufman, P.L.; Gabelt, B.T.; To, E.C.; Matsubara, J.A. Neurochemical correlates of cortical plasticity after unilateral elevated intraocular pressure in a primate model of glaucoma. Investig. Ophthalmol. Vis. Sci. 2003, 44, 2573–2581. [Google Scholar] [CrossRef] [PubMed]
- Weber, A.J.; Zelenak, D. Experimental glaucoma in the primate induced by latex microspheres. J. Neurosci. Methods 2001, 111, 39–48. [Google Scholar] [CrossRef]
- Huberman, A.D.; Stellwagen, D.; Chapman, B. Decoupling eye-specific segregation from lamination in the lateral geniculate nucleus. J. Neurosci. 2002, 22, 9419–9429. [Google Scholar] [CrossRef] [PubMed]
- Shimazawa, M.; Tomita, G.; Taniguchi, T.; Sasaoka, M.; Hara, H.; Kitazawa, Y.; Araie, M. Morphometric evaluation of changes with time in optic disc structure and thickness of retinal nerve fibre layer in chronic ocular hypertensive monkeys. Exp. Eye Res. 2006, 82, 427–440. [Google Scholar] [CrossRef] [PubMed]
- Fujishiro, T.; Kawasaki, H.; Aihara, M.; Saeki, T.; Ymagishi, R.; Atarashi, T.; Mayama, C.; Araie, M. Establishment of an experimental ferret ocular hypertension model for the analysis of central visual pathway damage. Sci. Rep. 2014, 4, 6501. [Google Scholar] [CrossRef]
- Dunn, D.G.; Harris, R.K.; Meis, J.M.; Sweet, D.E. A histomorphologic and immunohistochemical study of chordoma in twenty ferrets (Mustela putorius furo). Vet. Pathol. 1991, 28, 467–473. [Google Scholar] [CrossRef]
- Hoffmann, K.P.; Garipis, N.; Distler, C. Optokinetic deficits in albino ferrets (Mustela putorius furo): A behavioral and electrophysiological study. J. Neurosci. 2004, 24, 4061–4069. [Google Scholar] [CrossRef]
- Kawasaki, H.; Crowley, J.C.; Livesey, F.J.; Katz, L.C. Molecular organization of the ferret visual thalamus. J. Neurosci. 2004, 24, 9962–9970. [Google Scholar] [CrossRef][Green Version]
- Iwai, L.; Ohashi, Y.; van der List, D.; Usrey, W.M.; Miyashita, Y.; Kawasaki, H. FoxP2 is a parvocellular-specific transcription factor in the visual thalamus of monkeys and ferrets. Cereb. Cortex. 2013, 23, 2204–2212. [Google Scholar] [CrossRef]
- Nigel, I.C. Neuroanatomy of the ferret brain. In Biology and Disease of the Ferret; Games, G.F., Ed.; Wiley-Blackwell: Hoboken, NJ, USA, 1998; pp. 71–102. [Google Scholar]
- Mizuguchi, K.; Horiike, T.; Matsumoto, N.; Ichikawa, Y.; Shinmyo, Y.; Kawasaki, H. Distribution and Morphological Features of Microglia in the Developing Cerebral Cortex of Gyrencephalic Mammals. Neurochem. Res. 2018, 43, 1075–1085. [Google Scholar] [CrossRef]
- Thompson, I.D.; Morgan, J.E. The development of retinal ganglion cell decussation patterns in postnatal pigmented and albino ferrets. Eur. J. Neurosci. 1993, 5, 341–356. [Google Scholar] [CrossRef] [PubMed]
- Montiani-Ferreira, F.; Mattos, B.C.; Russ, H.H. Reference values for selected ophthalmic diagnostic tests of the ferret (Mustela putorius furo). Vet. Ophthalmol. 2006, 9, 209–213. [Google Scholar] [CrossRef] [PubMed]
- Sapienza, J.S.; Porcher, D.; Collins, B.R.; Gum, G.G.; Brooks, D.E. Tonometry in clinically normal ferrets (Mustela putorius furo). Prog. Vet. Comp. Ophthalmol. 1991, 1, 291–294. [Google Scholar]
- Blanco, R.; Martinez-Navarrete, G.; Pérez-Rico, C.; Valiente-Soriano, F.J.; Avilés-Trigueros, M.; Vicente, J.; Fernandez, E.; Vidal-Sanz, M.; de la Villa, P. A Chronic Ocular-Hypertensive Rat Model induced by Injection of the Sclerosant Agent Polidocanol in the Aqueous Humor Outflow Pathway. Int. J. Mol. Sci. 2019, 20, 13. [Google Scholar] [CrossRef] [PubMed]
- Di Girolamo, N.; Andreani, V.; Guandalini, A.; Selleri, P. Evaluation of intraocular pressure in conscious ferrets (Mustela putorius furo) by means of rebound tonometry and comparison with applanation tonometry. Vet. Rec. 2013, 172, 396. [Google Scholar] [CrossRef]
- Hernández-Guerra, A.M.; Rodilla, V.; López-Murcia, M.M. Ocular biometry in the adult anesthetized ferret (Mustela putorius furo). Vet. Ophthalmol. 2007, 10, 50–52. [Google Scholar] [CrossRef]
- Cucchiaro, J.B. Early development of the retinal line of decussation in normal and albino ferrets. J. Comp. Neurol. 1991, 312, 193–206. [Google Scholar] [CrossRef]
- Korth, M.J.; Jünemann, A.M.; Horn, F.K.; Bergua, A.; Cursiefen, C.; Velten, I.; Budde, W.M.; Wisse, M.; Martus, P. Synopsis of various electrophysiological tests in early glaucoma diagnosis--temporal and spatiotemporal contrast sensitivity, light- and color-contrast pattern-reversal electroretinogram, blue-yellow VEP. Klin. Monbl. Augenheilkd. 2000, 216, 360–368. [Google Scholar] [CrossRef]
- Sato, C.; Iwai-Takekoshi, L.; Ichikawa, Y.; Kawasaki, H. Cell type-specific expression of FoxP2 in the ferret and mouse retina. Neurosci. Res. 2017, 117, 1–13. [Google Scholar] [CrossRef]
- Yen, M.Y.; Cheng, C.Y.; Wang, A.G. Retinal nerve fiber layer thickness in unilateral amblyopia. Investig. Ophthalmol. Vis. Sci. 2004, 45, 2224–2230. [Google Scholar] [CrossRef] [PubMed]
- Shimazawa, M.; Ito, Y.; Inokuchi, Y.; Yamanaka, H.; Nakanishi, T.; Hayashi, T.; Ji, B.; Higuchi, M.; Suhara, T.; Imamura, K.; et al. An alteration in the lateral geniculate nucleus of experimental glaucoma monkeys: In vivo positron emission tomography imaging of glial activation. PLoS ONE 2012, 7, e30526. [Google Scholar] [CrossRef] [PubMed]
- Lam, D.; Jim, J.; To, E.; Rasmussen, C.; Kaufman, P.L.; Matsubara, J. Astrocyte and microglial activation in the lateral geniculate nucleus and visual cortex of glaucomatous and optic nerve transected primates. Mol. Vis. 2009, 15, 2217–2229. [Google Scholar] [PubMed]
- Dai, Y.; Sun, X.; Yu, X.; Guo, W.; Yu, D. Astrocytic responses in the lateral geniculate nucleus of monkeys with experimental glaucoma. Vet. Ophthalmol. 2012, 15, 23–30. [Google Scholar] [CrossRef] [PubMed]
- Schmidt, M.A.; Knott, M.; Heidemann, R.; Michelson, G.; Kober, T.; Dörfler, A.; Engelhorn, T. Investigation of lateral geniculate nucleus volume and diffusion tensor imaging in patients with normal tension glaucoma using 7 tesla magnetic resonance imaging. PLoS ONE 2018, 13, e0198830. [Google Scholar] [CrossRef]
- Liu, M.; Guo, L.; Salt, T.E.; Cordeiro, M.F. Dendritic changes in rat visual pathway associated with experimental ocular hypertension. Curr. Eye Res. 2014, 39, 953–963. [Google Scholar] [CrossRef]
- Sapienza, A.; Raveu, A.L.; Reboussin, E.; Roubeix, C.; Boucher, C.; Dégardin, J.; Godefroy, D.; Rostène, W.; Reaux-Le Goazigo, A.; Baudouin, C.; et al. Bilateral neuroinflammatory processes in visual pathways induced by unilateral ocular hypertension in the rat. J. Neuroinflamm. 2016, 13, 44. [Google Scholar] [CrossRef]
- Gallego, B.I.; Salazar, J.J.; de Hoz, R.; Rojas, B.; Ramírez, A.I.; Salinas-Navarro, M.; Ortín-Martínez, A.; Valiente-Soriano, F.J.; Avilés-Trigueros, M.; Villegas-Perez, M.P.; et al. IOP induces upregulation of GFAP and MHC-II and microglia reactivity in mice retina contralateral to experimental glaucoma. J. Neuroinflamm. 2012, 9, 92. [Google Scholar] [CrossRef]
- Wang, X.; Sam-Wah Tay, S.; Ng, Y.K. Nitric oxide, microglial activities and neuronal cell death in the lateral geniculate nucleus of glaucomatous rats. Brain Res. 2000, 878, 136–147. [Google Scholar] [CrossRef]


© 2020 by the authors. Licensee MDPI, Basel, Switzerland. This article is an open access article distributed under the terms and conditions of the Creative Commons Attribution (CC BY) license (http://creativecommons.org/licenses/by/4.0/).