Abstract
Plant architecture is an important factor for crop production. Plant height, tiller pattern, and panicle morphology are decisive factors for high grain yield in rice. Here, we isolated and characterized a T-DNA insertion rice mutant Osdmt1 (Oryza sativa dwarf and multi-tillering1) that exhibited a severe dwarf phenotype and multi-tillering. Molecular cloning revealed that DMT1 encodes a plasma membrane protein that was identified as a putative Ca2+ permeable mechanosensitive channel. The transcript expression level was significantly higher in the dmt1 mutant compared to wild type (WT). Additionally, the dmt1 homozygous mutant displayed a stronger phenotype than that of the WT and heterozygous seedlings after gibberellic acid (GA) treatment. RNA-seq and iTRAQ-based proteome analyses were performed between the dmt1 mutant and WT. The transcriptome profile revealed that several genes involved in GA and strigolactone (SL) biosyntheses were altered in the dmt1 mutant. Ca2+ and other ion concentrations were significantly enhanced in the dmt1 mutant, suggesting that DMT1 contributes to the accumulation of several ions in rice. Moreover, several EF-hand Ca2+ sensors, including CMLs (CaM-like proteins) and CDPKs (calcium-dependent protein kinases), displayed markedly altered transcript expression and protein levels in the dmt1 mutant. Overall, these findings aid in the elucidation of the multiply regulatory roles of OsDMT1/OsMCA1 in rice.
1. Introduction
Plant architecture is a complex of crucial agronomic traits that determine grain yield. In rice, plant architecture is mainly determined by several factors, including plant height, branching pattern, and leaf and panicle morphologies [1,2]. Moderate plant height is an important basis for rice breeding, and the substantial increase in rice yield during the “green revolution” benefited from the recessive semi-dwarf gene 1 (sd1) [3]. A number of dwarf and semi-dwarf mutants have been reported and functionally isolated in rice. In particular, several DWARF genes, such as D3, D10, D17, and D27, have been proven to be involved in biosynthesis and signaling pathways of strigolactones (SLs), leading to a change in tiller number or/and plant height in rice [4,5,6,7]. Rice tiller number is considered to be one of the most crucial factors for ideal rice architecture because tiller number per plant determines the number of panicles, which is a key component of grain yield [8]. Several key quantitative trait loci (QTLs) and/or genes that regulate tiller bud formation and outgrowth were identified and functionally characterized in rice such as MONOCULM1(MOC1), MOC2, and MOC3 [8,9,10]. However, the mechanism underlying plant architecture is not completely understood.
Plant hormones are a group of naturally occurring substances, which play a prominent role in regulating plant development and signaling networks at quite low concentrations [11], including jasmonates (JA), cytokinins (CK), auxin (IAA), gibberellins (GA), abscisic acid (ABA), salicylic acid (SA), ethylene (ET), brassinosteroids (BR), and strigolactones(SL). Over the past decades, plant hormones, particularly GA, BR, and SL, have been proven to extensively participate in the regulation of plant architecture. GA and BR are two predominant hormones that determine plant height and leaf angle by regulating cell elongation [12,13,14,15]. Mutants that are deficient in GA or BR result in reduced plant growth and dwarfism. Although it has been known that GA and BR function redundantly in many developmental processes [16], emerging evidence shows that BR-GA crosstalk regulates plant growth and development [12,16]. The SLs comprise a group of terpenoid lactones that play important roles in the inhibition of shoot branching, leading to changes in tillering. Several SL biosynthesis and signaling components have been identified in various plant species, such as MORE AXILLARY GROWTH (MAX) in Arabidopsis, DWARF (D) in rice [17,18].
Ca2+ ions act as a vital second messenger in plant cells during various developmental processes and in response to environmental stimuli, including pathogens, hormones, and abiotic stresses. Plants have evolved a diversity of Ca2+-binding proteins (CBPs) that serve as Ca2+ sensors that bind to Ca2+ with the evolutionarily conserved EF-hand motif, which consists of helix-loop-helix structures [19,20]. In plants, the three largest categories of EF-hand Ca2+ sensors were identified, include CaMs (calmodulins), CMLs (CaM-like proteins) and CDPKs (calcium-dependent protein kinases) [21]. It is now well acknowledged that these Ca2+ sensors are extensively linked to hormone response and stress signaling. Notably, emerging evidence has also shown that Ca2+ is involved in various developmental processes, such as embryogenesis, seed germination, and flowering. For example, transgenic Arabidopsis plants with reduced expression of CML24 exhibited resistance to ABA inhibition of germination and seedling growth; moreover, a defect in long-day induction of the transition to flowering was detected in CML24-underexpressing transgenic Arabidopsis plants [22].
Herein, to identify genes regulating plant architecture in rice, a dwarf and multi-tillering1 (dmt1) mutant was isolated and characterized by T-DNA insertion lines with Zhonghua 11 (japonica) background. The dmt1 mutant exhibited severely defective plant architecture, such as dwarfism, high tiller numbers, and decreased grain length and width. The DMT1 gene encodes a plasma membrane protein, OsMCA1. Transcriptome and proteome profiles revealed that GA and SL biosyntheses were altered in the dmt1 mutant; moreover, EF-hand Ca2+ sensors, including CMLs (CaM-like proteins) and CDPKs (calcium-dependent protein kinases) were also markedly altered in transcript expression and protein levels in the dmt1 mutant. Further study revealed that the Ca2+ concentration was significantly enhanced in the dmt1 mutant than in the wild type (WT), indicating that OsDMT1 was potentially involved in ion transport or/and accumulation in rice. Taken together, the present study provides a better understanding of the mechanisms underlying the plant architecture of rice.
2. Results
2.1. Rice dmt1 Mutant Exhibits Sever Dwarf and More Tillers
To identify new regulators of plant architecture in rice, a dwarf and multi-tillering1 (dmt1) mutant was isolated from a T-DNA insertion population with Zhonghua 11 (japonica) background. The dmt1 mutant displayed a severe dwarf phenotype during the tillering and reproductive stages (Figure 1a,b). The plant height and length of the primary panicle of the homozygous dmt1 mutant were approximately 59.5% and 48.6% lower than those of the WT, respectively (Figure 1c,f,g). Additionally, other phenotypic differences were observed between the dmt1 mutant and the WT, such as grain length and width, effective panicles, and spikelet number per panicle (Figure 1d,e; Figure S1). Notably, an inverse effect between plant height and tiller number was detected in the dmt1 mutant, namely, dmt1 produced more tillers than that by the WT (Figure 1h). Overall, the results indicated that the mutation of dmt1 led to abnormal development in rice, particularly in the plant architecture, including dwarfism and a greater number of tillers.
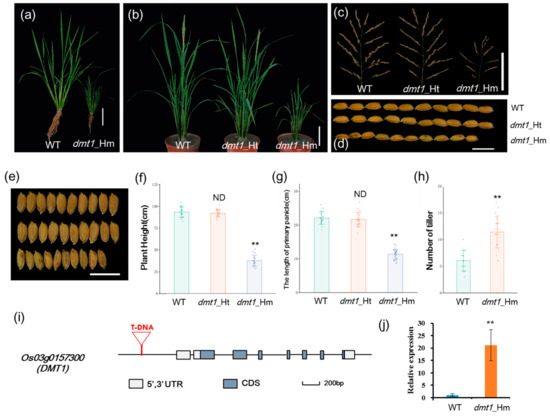
Figure 1.
Characterization of the rice dwarf and multi-tillering1 (dmt1) mutant plants. (a) dmt1 homozygous mutant exhibited a dwarf phenotype in the tillering stage. Scale bar: 10 cm. (b) dmt1 homozygous mutants exhibited dwarf and multi-tillering phenotypes compared with those of the wild type (WT) and heterozygous mutants during the reproductive stage. Scale bar: 10 cm. (c) The phenotype of panicle branching in the WT (left), dmt1 heterozygous mutant (middle), and dmt1 homozygous mutant (right). Scale bar: 10 cm. (d,e) Seed length and width in the WT (upper), dmt1 heterozygous mutant (middle), and dmt1 homozygous mutant (bottom). Scale bar: 1 cm. (f,g) Statistical analysis of plant height (f) and primary panicle length (g) in the WT, dmt1 heterozygous mutant, and dmt1 homozygous mutant. Values represented by means ± SE. ∗∗ p < 0.01, Student’s t-test, n = 30; (h) Statistical analysis of the number of tillers in the WT and dmt1 homozygous mutant. Values are expressed is represented by means ± SE. ∗∗ p < 0.01, Student’s t-test; n = 30. (i) Schematic diagram of DMT1. DMT1 consisted of eight exons and seven introns. T-DNA inserted into the promoter region. Boxes and lines represent exons and introns, respectively. (j) DMT1 transcripts were detected in the dmt1 mutant and the WT using qRT-PCR. ACTIN1 was used for a control. ** p < 0.01, Student’s t-test.
Hygromycin resistance test showed that the dmt1 cosegregate with the resistance maker in the T3 population. Of 517 T3 individuals, the progeny of plants exhibited phenotypic segregation of normal height to dwarf of ~3:1 (389:128), indicating that the mutant phenotype was controlled by a single recessive gene. To isolate the gene disrupted in the dmt1 mutant, Inverse polymerase chain reaction (IPCR) was used to separate the T-DNA flanking region [23]. Sequence analysis revealed that T-DNA was inserted in 1949 bp upstream of the start codon Os03g0157300 (Figure S2), which was predicted to be a plasma membrane protein OsMCA1 (Mid1-complementing activity1). Os03g0157300 was potentially the gene responsible for the dmt1 mutant phenotype and was designated as DWARF AND MULTI-TILLERING1 (DMT1). The OsDMT1 gene consisted of eight exons and seven introns (Figure 1i). qRT-PCR was performed to examine DMT1 transcript levels in the mutant and WT. The result showed that the expression of DMT1 was significantly higher (~21 fold) in the dmt1 mutant than in the WT (Figure 1j).
2.2. Transcriptome and Proteomic Analysis of the dmt1 Mutant
To investigate the molecular basis of the phenotype of the dmt1 mutant and the WT, the RNA expression profiles of the dmt1 mutant and WT were analyzed and compared in three biological replicates. Moreover, owing to protein abundance levels that were not always consistent with mRNA expression levels, the iTRAQ-based proteome profile was also identified in the dmt1 mutant and WT to provide a deeper insight into post-transcriptional modifications. Because the most obvious phenotypic differences were observed during the tillering stage, the transcriptome and proteome were analyzed in the dmt1 mutant and WT at the tillering stage. In total, 33,746 genes and 3663 proteins were detected using RNA-seq and iTRAQ, respectively (Tables S2 and S3). Differentially expressed genes (DEGs) were determined using the DESeq2 package with the criteria of q value < 0.005 and |log2 (fold change) |> 1 set as thresholds. For protein quantitative analysis, fold changes >1.5 and <0.67 were set to differentially abundant proteins (DAPs) with up- and down-regulated, respectively, with a q value < 0.05. Notably, the DMT1 gene displayed significantly upregulated in dmt1 mutant compared to WT in RNA-seq (Table S4), which consistent with qRT-PCR result (Figure 1j).
Global analysis of the correlation between transcriptome and proteome data was performed between dmt1 mutant and WT (Figure S3). Among all identified genes and protein species, 1304 DEGs (1069 upregulated and 235 downregulated) and 147 DAPs (43 upregulated and 104 downregulated) were identified (Figure 2a,b). Overall, the number of upregulated DEGs was greater than that of downregulated ones, whereas the number of upregulated DAPs was lower than the number of downregulated ones, suggesting that posttranscriptional regulation affected the abundance of protein species. To investigate the functions of DEGs, pathway enrichment analysis was performed based on the Kyoto Encyclopedia of Genes and Genomes (KEGG) pathway, results showed the significantly enriched pathways were related to several metabolic pathways, such as phenylpropanoid biosynthesis, starch and sucrose metabolism and photosynthesis in dmt1 mutant compared to WT (Figure 2c). To further obtain the insight of the functional categories, the identified DEGs and DAPs were classified into different groups based on cellular component, molecular function, and biological process (Figure 2d–i). According to the Gene Ontology (GO) terms of the cellular component, the major categories included extracellular region, cell wall and external encapsulating structure (Figure 2d). As for the Gene Ontology enrichment analyses, results showed that single-organism metabolic process, response to endogenous stimulus, and metabolic process were the major categories annotated for the biological process (Figure 2f). Additionally, proteomic analysis revealed that DAPs were mostly involved in transmembrane transport, single-organism transport (Figure 2i).
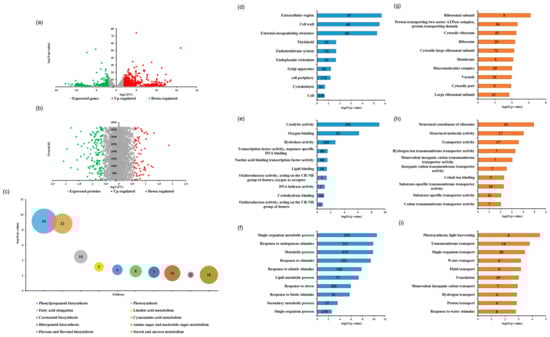
Figure 2.
Transcriptome and proteomic analysis of the dmt1 mutant and WT. (a) Volcano plot of genes that were differentially expressed between the dmt1 mutant and WT in RNA-seq (1069 upregulated and 235 downregulated). The red dots in the right of the plot represent significantly upregulated genes, and the green dots in the left of the plot represent significantly downregulated genes. (b) Differentially abundant proteins (DAPs) in iTRAQ. Red spots indicate 43 upregulated proteins, and green spots indicate 104 downregulated proteins in the dmt1 mutant compared to the WT. (c) Top 10 pathway enrichments of DEGs, the ordinate indicates -log10 (p-value), bubble size and date labels indicate gene numbers. (d–f) Top 10 GO ontology enrichment of DEGs based on cellular component (d), molecular function (e), and biological process (f). The abscissa indicates -log10 (p-value), and the number in the data labels indicate the gene numbers. (g–i) Top-10 GO ontology enrichment of DAPs based on cellular component (g), molecular function (h), and biological process (i). The abscissa indicates -log10 (p-value), the number in the data labels indicate gene numbers.
2.3. OsDMT1 Involved in GA Metabolism
GA, an important phytohormone stimulating plant growth and development, plays an important role in determining plant height [24,25]. Because the dmt1 mutant displayed a severe dwarf phenotype during the tillering and heading stages, it encouraged us to explore whether the dmt1 mutant is involved in GA biosynthesis. To examine the dmt1 mutant response to GA, 10-day-old WT, dmt1 homozygous, and heterozygous seedlings were sprayed with either 0 μM or 10 μM gibberellin, the results showed that the length of shoots increased after exogenous GA treatment in WT, homozygous, and heterozygous seedlings (Figure 3a). Notably, the dmt1 mutant displayed a stronger phenotype compared with that of the WT and heterozygous seedlings after GA treatment The length of shoots in the WT increased by 1.15-fold, whereas the increase was 1.30-fold in the dmt1 homozygous mutant after GA treatment (Figure 3b), a more detailed analysis, such as GA level quantitation is required to build a robust link between DMT1 and GA biosynthesis.
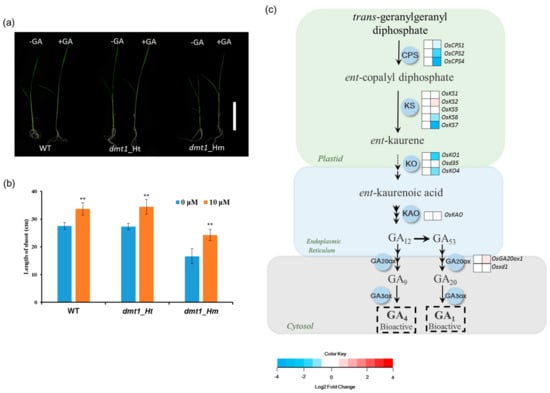
Figure 3.
OsDMT1 involved in GA metabolism (a) GA response in the WT (left), heterozygous mutant (middle), and homozygous mutant (right). The 10-day-old WT, dmt1 homozygous, and heterozygous seedlings were sprayed with 0 μM or 10 μM gibberellin three times every 2 days, and the lengths of the shoots were measured on the 7th day after the first treatment. Scale bar: 10 cm. (b) Quantitative measurements of the lengths of the shoot after GA treatment on the 7th day in the WT, dmt1 heterozygous mutant and homozygous mutant. Values represented by means ± SE. ∗∗ p < 0.01, Student’s t-test; (c) Gene expression in the GA biosynthesis pathway between the dmt1 mutant and the WT. In the heatmap for each gene, two cells represent the WT and dmt1 mutant (left to right). Gene expression levels in the dmt1 mutant are indicated in the heatmaps by the log2 fold change relative to that of the WT. The dashed arrow represents several enzymatic reactions. CPS: ent-copalyl diphosphate synthase; KS: ent-kaurene synthase; KO: ent-kaurene oxidase; KAO: ent-kaurenoic acid oxidase; GA20ox: gibberellin 20-oxidase; GA3ox: gibberellin 3-oxidase; IPT: adenylate dimethylallyltransferase.
Given that the dmt1 mutant was potentially involved in the GA metabolism in rice, we systematically analyzed the expression of GA biosynthesis genes using the RNA-seq dataset. GA biosynthesis starts with geranyl geranyl diphosphate which is converted to ent-kaurene by the action of CPS (ent-copalyl diphosphate synthase) and KS (ent-kaurene synthase) in the plastid. Several CPS and KS genes displayed significantly downregulated in the dmt1 mutant, such as OsCPS4 and OsKS7 (Figure 3c, Table S5). KO (ent-kaurene oxidase) and KAO (ent-kaurenoic acid oxidase) are two key enzymes to convert ent-kaurene to GA12, which considered as the common precursor of all GAs in plants [26]. The transcript of KO2 was more downregulated in the dmt1 mutant than in the WT (Figure 3c, Table S5). These results indicate that dmt1 was potentially involved in GA metabolism in rice.
2.4. DWARF 14 (D14) and D17, Two Strigolactones (SLs)-Related Genes, Displayed Decreased Expression in the dmt1 Mutant
Apart from the severe dwarf phenotype detected in the dmt1 mutant, the number of tillers was higher in the dmt1 mutant than in the WT. Strigolactones (SLs) are a class of important plant hormones regulating rice tillering [27]; thus, we examined the expression patters of several genes involved in SL biosynthesis and perception in rice, such as DWARF3 (D3), D10, D14, and D17. As depicted in Figure 4, D14 and D17 were significantly lower in the dmt1 mutant than in the WT, whereas D3 and D10 were not significantly different between the dmt1 mutant and the WT (Figure 4), indicating that D14 and D17 are potentially involved in tiller formation in the dmt1 mutant.
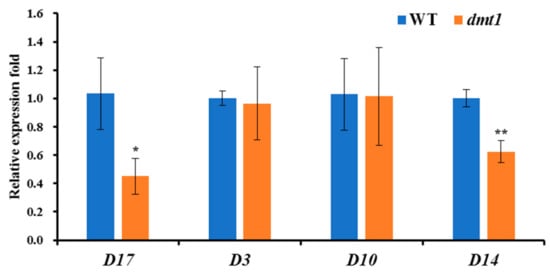
Figure 4.
The expression patterns of DWARF3 (D3), D10, D14, and D17 between the dmt1 mutant and the WT. ACTIN1 was used for a control. * p < 0.05, ** p < 0.01, Student’s t-test.
2.5. Several Ions Accumulated in the dmt1 Mutant
Considering that OsMCA1 is a plasma membrane protein and identified as a putative Ca2+ permeable mechanosensitive channel in Arabidopsis and rice [28], to investigate whether DMT1 was involved in ion uptake in rice, Ca2+ concentrations between the dmt1 mutant and the WT were measured. As depicted in Table 1, Ca2+ was significantly higher in the dmt1 mutant than in the WT. We also measured the level of other ions, and the results showed that Mg2+, Mn2+, and Zn2+ were also significantly increased in the dmt1 mutant, whereas there was no significant difference in Al3+ and Cu2+ (Table 1), suggesting that DMT1 contributed to the accumulation several ions in rice.

Table 1.
Several ions accumulate in the dmt1 mutant and the WT at the tilling stage.
2.6. Ca Sensor Genes Displayed Distinct Differential Expression in the dmt1 Mutant
In plants, three largest categories of EF-hand Ca2+ sensors are CaMs (calmodulins), CMLs (CaM-like proteins) and CDPKs (calcium-dependent protein kinase) [21]. The expression profiles of CaMs, CMLs, and CDPKs were examined with the RNA-seq dataset. The results showed that all five OsCaMs were not significantly different between the dmt1 mutant and the WT (Figure 5a, Table S5). Similarly, the expression of most of OsCDPKs were not significantly different between the dmt1 mutant and the WT (Figure 5b). However, several OsCMLs were significantly differentially expressed (either upregulated or downregulated) in the dmt1 mutant (Figure 5c); for example, OsCML2 and OsCML11 were significantly higher in the dmt1 mutant than in the WT, whereas some OsCMLs, such as OsCML15 and OsCML16 were significantly downregulated (Figure 5c, Table S5). The expression patterns of several OsCMLs were confirmed with qRT-PCR (Figure 5d). Several proteins were also detected in the dmt1 mutant and the WT with iTRAQ in the proteome database, such as OsCaM1-3, OsCBL6, OsCDPK13, and OsCDPK19 (Figure 5a–c,e, Table S5). Generally, the protein level change trend was consistent with the transcript expression level. Furthermore, we analyzed the expression patterns of calcineurin B-like (CBL) proteins in the dmt1 mutant. CBLs are a group of calcium sensors present in plants and believed to perceive fluctuations in the cellular calcium level [29]. The majority of OsCBLs were not significantly different between the dmt1 mutant and the WT (Figure 5e). Overall, the above results suggested that OsCMLs might be involved in Ca2+ signal transduction in the dmt1 mutant.

Figure 5.
Expression patterns of Ca sensor genes and proteins between the dmt1 mutant and the WT. (a–c) Expression patterns of CaMs (a), CDPKs (b), and CMLs (c) in the transcriptome and proteome. In the heatmap for each gene, the first two cells represented the WT and the dmt1 mutant (left to right) within the transcriptome, and the third and fourth cells represented the WT and the dmt1 mutant (left to right) within the proteome. (d) The expression of OsCML15, OsCML16, and OsCML31 was validated by qRT-PCR; ACTIN1 was used for a control, ** p < 0.01, Student’s t-test; (e) Expression patterns of CBLs in the transcriptome and proteome. In the heatmap for each gene, the first two cells represented the WT and the dmt1 mutant (left to right) within the transcriptome, and the third and fourth cells represented the WT and the dmt1 mutant (left to right) within the proteome.
3. Discussion
Plant architecture directly regulates biomass in plants. Identification and characterization of mutants that displayed defects in plant architecture allowed us to elucidate the underlying molecular mechanisms [30]. In the present study, a mutant defect in plant height and tiller number termed dwarf and multi-tillering1 (dmt1) was isolated in T-DNA insertion lines in the rice cultivar Zhonghua 11 (ZH11). Transfer DNA (T-DNA) of Agrobacterium tumefaciens has been proven to be a successful and effective tool for gene identification in various plant species. The homozygous dmt1 mutant displayed severe dwarfism and increased tiller number during the tillering and heading stages. Moreover, other phenotypic differences were observed between the dmt1 mutant and the WT, such as grain length and width and number of effective panicles. Our results further showed that DMT1 encodes a plasma membrane protein, MCA1 [31,32]. Kurusu et al. (2012a) revealed that OsMCA1 is expressed throughout different developmental stages, and OsMCA1-suppressed lines exhibited slower growth in transgenic plants [31]. This was further examined by Liu et al. (2015), who reported that a single nucleotide polymorphism (SNP) in OsMCA1 led to plant architecture defects in rice; moreover, the expression of OsMCA1/PAD was significantly decreased in young and mature leaves in the pad mutant, and OsMCA1/PAD-overexpressing plants do not exhibit an obvious phenotype in rice [32]. Notably, in our study, the expression of OsDMT1 was significantly higher in the dmt1 mutant than in the WT (Figure 1j), this might be due to the function of enhancer elements in the T-DNA region. Recently Several gain-of-function rice T-DNA insertion mutants were identified, such as OsHKT1;4, OsDOF24, OsBG1 [33,34,35]. For example, OsHKT1;4, the T-DNA inserted approximately 3kb upstream of the initiation codon of OsHKT1;4, leading to increased expression of OsHKT1;4 and displayed lower concentrations of Na+ in the homozygous mutant young leave and stems [34]. In Arabidopsis, overexpression of AtMCA1 caused severe developmental defects, including short stems, small rosettes, and no petals [28]. The above results indicate that MCA1 regulates plant growth and development in a dose-dependent manner. To investigate the molecular basis of the phenotype of the dmt1 mutant and the WT given that the most obvious phenotypic differences were detected in the tillering stage, an integrated omics approach combining the transcriptome and proteomics was performed between the dmt1 mutant and the WT at the tillering stage. Totally, 1304 DEGs (1069 upregulated and 235 downregulated) and 147 DAPs (43 upregulated and 104 downregulated) were identified, respectively (Figure 2a,b). Functional analysis indicated that the abundance of DEGs was related to several metabolic processes, such as single-organism metabolic process, response to endogenous stimulus, and metabolic process, whereas abundance of DAPs was related to in transmembrane transport, single-organism transport. The expressions of several proteins involved in transmembrane transport were observed to markedly change in the proteomics profile. DMT1, which encodes a plasma membrane protein, was identified as a putative Ca2+ permeable mechanosensitive channel in plants. Alteration of DMT1 leads to the regulation of transmembrane transport. Overall, the integrated omics approach contributed to elucidation of the mechanisms responsible for plant architecture in rice.
Considering that the dmt1 mutant displayed a severe dwarf phenotype during the different developmental stages, we determined the response to GA between the dmt1 mutant and the WT. We used GA to treat WT, dmt1 homozygous, and dmt1 heterozygous seedlings and longer shoots were detected in the dmt1 homozygous compared to WT and heterozygous seedlings (Figure 3a,b). We further analyzed the expression of genes involved in GA biosynthesis, and the results showed that several key genes were downregulated in the dmt1 mutant, such as OsCPS2 and OsKS6 (Figure 3c). Phytohormone GAs are biosynthesized from geranylgeranyl diphosphate (GGDP), convert to ent-kaurene in two steps via the CPS (ent-copalyl diphosphate synthase) and KS (ent-kaurene synthase) [36]. In rice, OsCPS2 is contiguously clustered with three KS-like genes, namely, OsKS5, OsKS6, and OsKS7 [36]. Both CPS and KS are involved in the initial step of bioactive GA biosynthesis, suggesting that the early step of GA biosynthesis was more regulated in the dmt1 mutant than in the WT. We further explored the expression patterns of SL-related genes because the number of tillers was increased in the dmt1 mutant. DWARF14 (D14) and D17 displayed significantly lower dmt1 than that in the WT, whereas D3 and D10 did not differ significantly in dmt1 (Figure 4). Previous studies have shown that D14 inhibited tillering and acted as an important component of the SL-dependent branching inhibition pathway in rice [37,38,39]. Taken together, the present results suggested that some genes involved in GA and SL biosynthesis might be altered in the dmt1 mutant.
Calcium ions (Ca2+) play important roles during plant growth and development as an essential nutrient and second messenger. MCA1 is a plasma membrane protein and identified as a putative Ca2+ permeable mechanosensitive channel in plants [28,31]. A previous study showed that Ca2+ uptake is increased in rice OsMCA-overexpressing suspension-cultured cells [31], suggesting that MCA1/DMT1 plays a role during Ca2+ transport in plants. In Arabidopsis, AtMCA1 and AtMCA2 have distinct and overlapping roles in Ca2+ uptake in roots [40]. Additionally, NtMAC1 and NtMAC2 partially complemented Ca2+ uptake defects of yeast mutants, which lacked mechanosensitive Ca2+ channel components [41]. Recently, MCA1 and MCA2 were shown to be involved in a cold-induced increase in Ca2+ in Arabidopsis, and cold-induced Ca2+ in mca1 and mca2 mutants was markedly lower than that in the WT [42]. The present study revealed that Ca2+ concentration was significantly higher in the dmt1 mutant than in the WT. Apart from Ca2+, the levels of Mg2+, Mn2+ and Zn2+ were increased in the dmt1 mutant (Table 1), suggesting that DMT1 contributed to ion homeostasis in rice.
In eukaryotic cells, Ca2+ serves as a crucial mediator, whose intracellular concentration is tightly regulated by Ca2+ sensors in response to hormonal and environmental signals, including biotic and abiotic stresses. Here, we analyzed the expression patterns of the three largest categories of EF-hand proteins including CaMs (calmodulins), CMLs (CaM-like proteins) and CDPKs (calcium-dependent protein kinases) with transcriptome and proteome profiles. Several OsCML transcripts were significantly changed in the dmt1 mutant compared to the WT, such as OsCML2, OsCML11, OsCML15, whereas all five OsCaMs were not significantly different in the dmt1 mutant (Figure 5a–c). Previous studies showed that plants evolved a greatly expanded group of unique CMLs not found in animals, several CMLs have been proven to be Ca2+ sensors in response to biotic and abiotic stress in plants, such as AtCML24 and AtCML43 [22,43]. In the present study, several proteins were also detected in the dmt1 mutant and the WT with iTRAQ in the proteome database, such as OsCML7, OsCML16, OsCaM1-3 and OsCBL6. Generally, protein level change trends were consistent with transcript expression levels. The present results suggested that OsCMLs might be involved in Ca2+ signal transducers in the dmt1 mutant.
In conclusion, the present study revealed changes in gene and protein expression levels in the dmt1 mutant and the WT. A series of differentially expressed factors, including GA and SL biosynthesis, and the presence of Ca2+ sensor genes were identified, and Ca2+ accumulated in the dmt1 mutant. However, we have very limited knowledge of the mechanism underlying the plant architecture and Ca2+ uptake in the dmt1 mutant. Additional studies will be needed to better understand the regulatory role of DMT1 in ion homeostasis and plant architecture.
4. Materials and Methods
4.1. Plant Materials and Growth Conditions
The rice japonica cultivar Zhonghua 11 (ZH11) was used as the wild type in this study. The dmt1 mutant was obtained from a T-DNA insertion line with a ZH11 background from the Shanghai Institute of Plant Physiology and Ecology, Chinese Academy of Sciences [44]. All rice plants were grown in the experimental field of South China Agricultural University in Guangzhou, southern China. Agronomic characters were recorded during the natural growing seasons. For laboratory work, rice seeds were soaked in ddH2O for 24 h, transferred to Kimura B nutrient solution (36.60 μM KNO3, 73.11 μM Ca(NO3)2·4H2O, 109.55 μM MgSO4, 18.25 μM K2SO4, 72.95 μM (NH4)2SO4, 36.45 μM KH2PO4, 4.01 μM FeSO4, 4.43 μM Na2EDTA, 1.82 μM MnCl2, 0.15 μM ZnSO4, 0.06 μM CuSO4, 9.26 μM H3BO3, 0.03 μM (NH4)6Mo7O24), and grown in a climate chamber (Hongrun, Nanjing, China) under a 16 h light/8 h dark cycle with the given light intensity (1000 mmol m−2s−1) at 28 °C.
4.2. Analysis of the T-DNA Insertion Locus in dmt1 Mutant
Inverse polymerase chain reaction (IPCR) was used to isolate the flanking sequence of T-DNA. Nested primers of the T-DNA right border primers were C1 and C2, and those of the left border primers were H1 and H2 (Figure S2). Initially, the genomic DNA was digested by HindIII. Primers for testing of the T-DNA inserting locus were 46490+ and 5TF1 for the left site and 47295- and 5TR1 for the right. Primers sequences are listed in Supplementary Table S1.
4.3. Gibberellin Treatment
Ten-day-old rice dmt1 mutant and WT seedlings were sprayed with either 0 μM or 10 μM gibberellin (GA3, Solarbio, Beijing, China) three times every 2 days. The lengths of shoots were recorded on the 7th day after the first treatment.
4.4. RNA Sequencing
Leaves of the WT and dmt1 mutant during the tillering stage were harvested and preserved in liquid nitrogen and stored at −80 °C. TRIzol™ (Invitrogen™, Waltham, America) reagent was used to extract the total RNA of samples according to the manufacturer’s instructions. Three replicates were prepared for both WT and dmt1 mutant, approximately 0.5 g leaves used in each replication. The cDNA library was constructed by Illumian Truseq RNA sample prep Kit, and sequencing by Illumina HiSeq 2500 (Illumina, San Diego, America). Raw data (raw reads) in fastq format were firstly processed through in-house perl scripts. In this step, the clean data (clean reads) were obtained by removing reads containing adapters, poly-N, and low-quality reads from the raw data. At the same time, quality parameters of the clean data, including Q20, Q30, GC content, and sequence duplication level were used for data filtering. All the succeeding analyses were conducted using high-quality clean data. Reference genome and gene model annotation files were downloaded from The MSU Rice Genome Annotation Project Database website at http://rice.plantbiology.msu.edu/. An index of the reference genome was built using Bowtie2 v2.2.5 and paired-end clean reads were aligned to the reference genome using TopHat v2.0.14. TopHat was chosen as the mapping tool because it can generate a database of splice junctions based on the gene model annotation file, and thus, provided better mapping results than other non-splice mapping tools. All raw data have been deposited in the Sequence Read Archive data repository (accession PRJNA602017) of the NCBI.
4.5. Protein Preparation and Digestion
The iTRAQ assay was performed by the BGI Company. For each of three biological replicates of WT and dmt1 mutants, proteins were extracted from leaves in the tillering stage and approximately 1 g leaves used in each replication. Initially, leaf samples were ground into powder in liquid nitrogen, extracted with Lysis buffer (7 M Urea, 2 M Thiourea, 4% CHAPS, 40 mM Tris-HCl, pH 8.5) containing 1 mM PMSF and 2 mM EDTA (final concentration). After 5 min, 10 mM DTT (final concentration) was added to the samples. The suspension was sonicated at 200 W for 15 min and then centrifuged at 4 °C, 30,000× g for 15 min. The supernatant was mixed well with 5 × volume of chilled acetone containing 10% (v/v) TCA and incubated at -20 °C overnight. After centrifugation at 4 °C, 30,000× g, the supernatant was discarded. The precipitate was washed with chilled acetone three times. The pellet was air-dried and dissolved in Lysis buffer (7 M urea, 2 M thiourea, 4% NP40, 20mM Tris-HCl, pH 8.0–8.5). The suspension was sonicated at 200 W for 15 min and centrifuged at 4 °C, 30,000× g for 15 min. The supernatant was transferred to another tube. To reduce disulfide bonds in proteins of the supernatant, 10 mM DTT (final concentration) was added and incubated at 56 °C for 1 h. Subsequently, 55 mM IAM (final concentration) was added to block the cysteines, incubated for 1 h in the darkroom. The supernatant was mixed well with 55 × volume of chilled acetone for 2 h at −20 °C to precipitate proteins. After centrifugation at 4 °C, 30 000× g, the supernatant was discarded, and the pellet was air-dried for 5 min, dissolved in 500 μL 0.5 M TEAB (Applied Biosystems, Milan, Italy), and sonicated at 200 W for 15 min. Finally, samples were centrifuged at 4 °C, 30,000× g for 15 min. The supernatant was transferred to a new tube and quantified. The proteins in the supernatant were kept at −80 °C for further analysis. The proteins were quantified by Bradford method.
Total protein (100 μg) was taken out of each sample solution and then the protein was digested with Trypsin Gold (Promega, Madison, WI, USA) with the ratio of protein:trypsin = 30:1 at 37 °C for 16 h. After trypsin digestion, peptides were dried by vacuum centrifugation. Peptides were reconstituted in 0.5 M TEAB and processed according to the manufacture’s protocol for 8-plex iTRAQ reagent (Applied Biosystems, Waltham, America). Briefly, one unit of iTRAQ reagent was thawed and reconstituted in 24 μL isopropanol. The peptides were labeled with the isobaric tags, incubated at room temperature for 2 h. The labeled peptide mixtures were then pooled and dried by vacuum centrifugation. SCX chromatography was performed with an LC-20AB HPLC Pump system (Shimadzu, Kyoto, Japan). The iTRAQ-labeled peptide mixtures were reconstituted with 4 mL buffer A and loaded onto a 4.6 × 250 mm Ultremex SCX column containing 5 μm particles (Phenomenex). The peptides were eluted at a flow rate of 1 mL/min with a gradient of buffer A (25 mM NaH2PO4 in 25% ACN, pH 2.7) for 10 min, 5–60% buffer B for 27 min, 60–100% buffer B for 1 min. The system was then maintained in 100% buffer B (25mM NaH2PO4, 1 M KCl in 25% ACN, pH 2.7) for 1 min before equilibrating with buffer A for 10 min prior to the next injection. Elution was monitored by measuring the absorbance at 214 nm, and fractions were collected every 1 min. The eluted peptides were pooled into 20 fractions, desalted with a Strata X C18 column (Phenomenex) and vacuum dried.
4.6. LC-ESI-MS/MS Analysis Based on Triple TOF 5600
Each fraction was resuspended in buffer A (5% ACN, 0.1%FA) and centrifuged at 20,000× g for 10 min, the final concentration of peptide was about 0.5 μg/μL on average. 10 μL supernatant was loaded on a LC-20AD nanoHPLC (Shimadzu, Kyoto, Japan) by the autosampler onto a 2 cm C18 trap column. Then, the peptides were eluted onto a 10cm analytical C18 column (inner diameter 75 μm) packed in-house. The samples were loaded at 8 μL/min for 4min, then the 35min gradient was run at 300 nL/min starting from 2 to 35% B (95% ACN, 0.1% FA), followed by 5 min linear gradient to 60%, then, followed by 2 min linear gradient to 80%, and maintenance at 80% B for 4 min, and finally return to 5% in 1 min. Data acquisition was performed with a Triple TOF 5600 System (AB SCIEX, Concord, ON) fitted with a Nanospray III source (AB SCIEX, Concord, ON) and a pulled quartz tip as the emitter (New Objectives, Woburn, MA). Data were acquired using an ion spray voltage of 2.5 kV, curtain gas at 30 psi, nebulizer gas at 15 psi, and an interface temperature of 150 °C. The MS was operated with an RP ≥ 30 000 FWHM for TOF MS scans. For IDA, survey scans were acquired in 250 ms and as many as 30 product ion scans were collected if exceeding a threshold of 120 counts/s and with a 2+ to 5+ charge state. The total cycle time was fixed to 3.3 s. The Q2 transmission window was 100 Da for 100%. Four time bins were summed for each scan at a pulser frequency value of 11 kHz by monitoring the 40 GHz multichannel TDC detector with four-anode channel detection ions. A sweeping collision energy setting of 35 ± 5 eV coupled with iTRAQ adjusted to a rolling collision energy was applied to all precursor ions for collision-induced dissociation. Dynamic exclusion was set for 1/2 of peak width (15 s), and then the precursor was refreshed off the exclusion list.
4.7. Proteomic Data Analysis
The protein identification was performed using a Mascot search engine (Matrix Science, London, UK; version 2.3.02). For protein quantitation, it was required that a protein contained at least two unique spectra. The quantitative protein ratios were weighted and normalized by the median ratio in Mascot. We only used ratios with p-values < 0.05, and only fold changes of > 1.5 were considered to be a significant change. Functional annotations of the proteins were conducted using Blast2GO program against the non-redundant protein database (NR; NCBI). The KEGG database (http://www.genome.jp/kegg/) and the COG database (http://www.ncbi.nlm.nih.gov/COG/) were used to classify and group these identified proteins. The mass spectrometry proteomics data have been deposited in ProteomeXchange (submission No. PXD017197). Reviewer account details for ProteomeXchange (Username: reviewer04292@ebi.ac.uk; Password: 4FopczCR).
4.8. Expression Analysis by Real-Time PCR
Total RNA was extracted from different samples using TRIzol™ reagent (Invitrogen™, Waltham, America), Reverse transcription (RT) was performed using 5 × All-In-One RT MasterMix (abm®, Vancouver, Canada) according to manufacturer’s instruction. Quantitative real-time polymerase chain reaction (qRT-PCR) was performed as previously described [44]. The relative expression levels of target genes were normalized to that of rice ACTIN1. Real-time PCR gene expression data from three independent biological replicates. All primers used in qRT-PCR are listed in Supplemental Table S1.
4.9. Elemental Analysis by Inductively Coupled Plasma Optical Emission Spectrometer (ICP-OES)
Tissues were harvested during the tillering stage and dried in a 60 °C oven for 48 h, then the dried tissues were predigested overnight in borosilicate glass tubes with 4 mL of redistilled 98.8% HNO3. One milliliter of concentrated trace metal grade HClO4 was added to the predigested tissues and heated to 100 °C for 1 h, 150 °C for 1 h, 180 °C for 1 h, and then 210 °C to dryness (1–2 h). Digestions were performed using a heating block with an exhaust-collecting manifold. Digests were resuspended in 15 mL redistilled 2% HNO3. Concentrations of Al, Ca, K, Mg, P, Fe, Cu, Mn, and Zn were determined by inductively coupled plasma-optical emission spectroscopy. Element concentrations were expressed as mg/g dry weight (, c was element concentrations as measured by ICP-OES (Varian, California, America), V= 15 mL, and DW= 1 g).
Supplementary Materials
Supplementary materials can be found at https://www.mdpi.com/1422-0067/21/3/1097/s1.
Author Contributions
Z.Z. designed the experiments; J.L. performed most of the experiments and analyzed the RNA-seq dataset; Y.H. analyzed the iTRAQ datasets and performed LC-ESI-MS/MS analysis; Q.Z. maintained the materials in greenhouse and paddy field; Z.Z. and W.W. wrote the manuscript. All authors have discussed the results and approved the final manuscript.
Acknowledgments
This study was supported by Guangdong Province Key Research and Development Program (2018B020202012), and the Natural Science Foundation of China (31671645), and the Science and Technology Program of Guangzhou (201704020014).
Conflicts of Interest
The authors declare no conflict of interest. The funders had no role in the design of the study; in the collection, analyses, or interpretation of data; in the writing of the manuscript, or in the decision to publish the results.
References
- Xing, Y.; Zhang, Q. Genetic and molecular bases of rice yield. Annu. Rev. Plant Biol. 2010, 61, 421–442. [Google Scholar] [CrossRef]
- Zhao, L.; Tan, L.; Zhu, Z.; Xiao, L.; Xie, D.; Sun, C. PAY1 improves plant architecture and enhances grain yield in rice. Plant J. 2015, 83, 528–536. [Google Scholar] [CrossRef]
- Sasaki, A.; Ashikari, M.; Ueguchi-Tanaka, M.; Itoh, H.; Nishimura, A.; Swapan, D.; Kitano, H. Green revolution: A mutant gibberellin-synthesis gene in rice. Nature 2002, 416, 701. [Google Scholar] [CrossRef] [PubMed]
- Ishikawa, S.; Maekawa, M.; Arite, T.; Onishi, K.; Takamure, I.; Kyozuka, J. Suppression of tiller bud activity in tillering dwarf mutants of rice. Plant Cell Physiol. 2005, 46, 79–86. [Google Scholar] [CrossRef] [PubMed]
- Lin, H.; Wang, R.; Qian, Q.; Yan, M.; Meng, X.; Fu, Z.; Wang, Y. DWARF27, an iron-containing protein required for the biosynthesis of strigolactones, regulates rice tiller bud outgrowth. Plant Cell 2009, 21, 1512–1525. [Google Scholar] [CrossRef]
- Jiang, L.; Liu, X.; Xiong, G.; Liu, H.; Chen, F.; Wang, L.; Yi, W. DWARF 53 acts as a repressor of strigolactone signalling in rice. Nature 2013, 504, 401. [Google Scholar] [CrossRef] [PubMed]
- Ito, S.; Yamagami, D.; Umehara, M.; Hanada, A.; Yoshida, S.; Sasaki, Y.; Shirasu, K. Regulation of strigolactone biosynthesis by gibberellin signaling. Plant Physiol. 2017, 174, 1250–1259. [Google Scholar] [CrossRef] [PubMed]
- Li, X.; Qian, Q.; Fu, Z.; Wang, Y.; Xiong, G.; Zeng, D.; Yuan, M. Control of tillering in rice. Nature 2003, 422, 618. [Google Scholar] [CrossRef]
- Koumoto, T.; Shimada, H.; Kusano, H.; She, K.C.; Iwamoto, M.; Takano, M. Rice monoculm mutation moc2, which inhibits outgrowth of the second tillers, is ascribed to lack of a fructose-1, 6-bisphosphatase. Plant Biotechnol. 2013, 30, 47–56. [Google Scholar] [CrossRef]
- Lu, Z.; Shao, G.; Xiong, J.; Jiao, Y.; Wang, J.; Liu, G.; Li, J. MONOCULM 3, an ortholog of WUSCHEL in rice, is required for tiller bud formation. J. Genet. Genomics 2015, 42, 71–78. [Google Scholar] [CrossRef]
- Davies, P.J. The Plant Hormones: Their Nature, Occurrence, and Functions; Springer: Dordrecht, NY, USA, 2015; pp. 1–15. [Google Scholar]
- Tong, H.; Xiao, Y.; Liu, D.; Gao, S.; Liu, L.; Yin, Y.; Chu, C. Brassinosteroid regulates cell elongation by modulating gibberellin metabolism in rice. Plant Cell 2014, 26, 4376–4393. [Google Scholar] [CrossRef] [PubMed]
- Tang, Y.; Liu, H.; Guo, S.; Wang, B.; Li, Z.; Chong, K.; Xu, Y. OsmiR396d affects gibberellin and brassinosteroid signaling to regulate plant architecture in rice. Plant Physiol. 2018, 176, 946–959. [Google Scholar] [CrossRef] [PubMed]
- Ruan, J.; Zhou, Y.; Zhou, M.; Yan, J.; Khurshid, M.; Weng, W.; Zhang, K. Jasmonic acid signaling pathway in plants. Int. J. Mol. Sci. 2019, 20, 2479. [Google Scholar] [CrossRef] [PubMed]
- Zhang, Y.; Li, X. Salicylic acid: Biosynthesis, perception, and contributions to plant immunity. Curr. Opin. Plant Biol. 2019, 50, 29–36. [Google Scholar] [CrossRef]
- Unterholzner, S.J.; Rozhon, W.; Papacek, M.; Ciomas, J.; Lange, T.; Kugler, K.G.; Poppenberger, B. Brassinosteroids are master regulators of gibberellin biosynthesis in Arabidopsis. Plant Cell 2015, 27, 2261–2272. [Google Scholar] [CrossRef]
- Sang, D.; Chen, D.; Liu, G.; Liang, Y.; Huang, L.; Meng, X.; Qian, Q. Strigolactones regulate rice tiller angle by attenuating shoot gravitropism through inhibiting auxin biosynthesis. Proc. Natl. Acad. Sci. USA 2014, 111, 11199–11204. [Google Scholar] [CrossRef]
- Waters, M.T.; Gutjahr, C.; Bennett, T.; Nelson, D.C. Strigolactone signaling and evolution. Annu. Rev. Plant Biol. 2017, 68, 291–322. [Google Scholar] [CrossRef]
- Day, I.S.; Reddy, V.S.; Ali, G.S.; Reddy, A.S.N. Analysis of EF-hand-containing proteins in Arabidopsis. Genome Biol. 2002, 3, research0056-1. [Google Scholar] [CrossRef]
- Wang, X.; Hao, L.; Zhu, B.; Jiang, Z. Plant calcium signaling in response to potassium deficiency. IEEE J. Mol. Sci. 2018, 19, 3456. [Google Scholar] [CrossRef]
- DeFalco, T.A.; Bender, K.W.; Snedden, W.A. Breaking the code: Ca2+ sensors in plant signalling. Biochem. J. 2010, 425, 27–40. [Google Scholar] [CrossRef]
- Delk, N.A.; Johnson, K.A.; Chowdhury, N.I.; Braam, J. CML24, regulated in expression by diverse stimuli, encodes a potential Ca2+ sensor that functions in responses to abscisic acid, daylength, and ion stress. Plant Physiol. 2005, 139, 240–253. [Google Scholar] [CrossRef]
- Liu, Y.G.; Mitsukawa, N.; Oosumi, T.; Whittier, R.F. Efficient isolation and mapping of Arabidopsis thaliana T-DNA insert junctions by thermal asymmetric interlaced PCR. Plant J. 1995, 8, 457–463. [Google Scholar] [CrossRef] [PubMed]
- Sakamoto, T.; Matsuoka, M. Generating high-yielding varieties by genetic manipulation of plant architecture. Curr. Opin. Biotechnol. 2004, 15, 144–147. [Google Scholar] [CrossRef] [PubMed]
- Cho, S.H.; Kang, K.; Lee, S.H.; Lee, I.J.; Paek, N.C. OsWOX3A is involved in negative feedback regulation of the gibberellic acid biosynthetic pathway in rice (Oryza sativa). J. Exp. Bot. 2016, 7, 1677–1687. [Google Scholar] [CrossRef] [PubMed]
- Hedden, P.; Phillips, A.L. Gibberellin metabolism: New insights revealed by the genes. Trends Plant Sci. 2000, 5, 523–530. [Google Scholar] [CrossRef]
- Wang, X.M.; Liang, Y.Y.; Li, L.; Gong, C.W.; Wang, H.P.; Huang, X.X.; Li, P. Identification and cloning of tillering-related genes OsMAX1 in rice. Rice Sci. 2015, 22, 255–263. [Google Scholar]
- Nakagawa, Y.; Katagiri, T.; Shinozaki, K.; Qi, Z.; Tatsumi, H.; Furuichi, T.; Kato, T. Arabidopsis plasma membrane protein crucial for Ca2+ influx and touch sensing in roots. Proc. Natl. Acad. Sci. USA 2007, 104, 3639–3644. [Google Scholar] [CrossRef]
- Kanwar, P.; Sanyal, S.K.; Tokas, I.; Yadav, A.K.; Pandey, A.; Kapoor, S.; Pandey, G.K. Comprehensive structural, interaction and expression analysis of CBL and CIPK complement during abiotic stresses and development in rice. Cell Calcium 2014, 56, 81–95. [Google Scholar] [CrossRef]
- Wang, Y.; Li, J. Molecular basis of plant architecture. Annu. Rev. Plant Biol. 2008, 59, 253–279. [Google Scholar] [CrossRef]
- Kurusu, T.; Nishikawa, D.; Yamazaki, Y.; Gotoh, M.; Nakano, M.; Hamada, H.; Shinozaki, K. Plasma membrane protein OsMCA1 is involved in regulation of hypo-osmotic shock-induced Ca2+ influx and modulates generation of reactive oxygen species in cultured rice cells. BMC Plant Biol. 2012, 12, 11. [Google Scholar] [CrossRef]
- Liu, Z.; Cheng, Q.; Sun, Y.; Dai, H.; Song, G.; Guo, Z.; Yang, D. A SNP in OsMCA1 responding for a plant architecture defect by deactivation of bioactive GA in rice. Plant Mol. Biol. 2015, 87, 17–30. [Google Scholar] [CrossRef] [PubMed]
- Liu, L.; Tong, H.; Xiao, Y.; Che, R.; Xu, F.; Hu, B.; Chu, C. Activation of Big Grain1 significantly improves grain size by regulating auxin transport in rice. Proc. Natl. Acad. Sci. USA 2015, 112, 11102–11107. [Google Scholar] [CrossRef] [PubMed]
- Oda, Y.; Kobayashi, N.; Tanoi, K.; Ma, J.; Itou, Y.; Katsuhara, M.; Horie, T. T-DNA tagging-based gain-of-function of OsHKT1; 4 reinforces Na exclusion from leaves and stems but triggers Na toxicity in roots of rice under salt stress. Int. J. Mol. Sci. 2018, 19, 235. [Google Scholar] [CrossRef] [PubMed]
- Shim, Y.; Kang, K.; An, G.; Paek, N.C. Rice DNA-binding one zinc finger 24 (OsDOF24) delays leaf senescence in a jasmonate-mediated pathway. Plant Cell Physiol. 2019, 60, 2065–2076. [Google Scholar] [CrossRef] [PubMed]
- Sakamoto, T.; Miura, K.; Itoh, H.; Tatsumi, T.; Ueguchi-Tanaka, M.; Ishiyama, K.; Miyao, A. An overview of gibberellin metabolism enzyme genes and their related mutants in rice. Plant Physiol. 2004, 134, 1642–1653. [Google Scholar] [CrossRef] [PubMed]
- Arite, T.; Umehara, M.; Ishikawa, S.; Hanada, A.; Maekawa, M.; Yamaguchi, S.; Kyozuka, J. d14, a strigolactone-insensitive mutant of rice, shows an accelerated outgrowth of tillers. Plant Cell Physiol. 2009, 50, 1416–1424. [Google Scholar] [CrossRef]
- Zhou, F.; Lin, Q.; Zhu, L.; Ren, Y.; Zhou, K.; Shabek, N.; Ma, W. D14–SCF D3-dependent degradation of D53 regulates strigolactone signalling. Nature 2013, 504, 406. [Google Scholar] [CrossRef] [PubMed]
- Seto, Y.; Yasui, R.; Kameoka, H.; Tamiru, M.; Cao, M.; Terauchi, R.; Umehara, M. Strigolactone perception and deactivation by a hydrolase receptor DWARF14. Nat. Commun. 2019, 10, 191. [Google Scholar] [CrossRef]
- Yamanaka, T.; Nakagawa, Y.; Mori, K.; Nakano, M.; Imamura, T.; Kataoka, H.; Shinozaki, K. MCA1 and MCA2 that mediate Ca2+ uptake have distinct and overlapping roles in Arabidopsis. Plant Physiol. 2010, 152, 1284–1296. [Google Scholar] [CrossRef]
- Kurusu, T.; Yamanaka, T.; Nakano, M.; Takiguchi, A.; Ogasawara, Y.; Hayashi, T.; Kuchitsu, K. Involvement of the putative Ca2+-permeable mechanosensitive channels, NtMCA1 and NtMCA2, in Ca2+ uptake, Ca2+-dependent cell proliferation and mechanical stress-induced gene expression in tobacco (Nicotiana tabacum) BY-2 cells. J. Plant Res. 2012, 125, 555–568. [Google Scholar] [CrossRef]
- Mori, K.; Renhu, N.; Naito, M.; Nakamura, A.; Shiba, H.; Yamamoto, T.; Miura, K. Ca 2+-permeable mechanosensitive channels MCA1 and MCA2 mediate cold-induced cytosolic Ca 2+ increase and cold tolerance in Arabidopsis. Sci. Rep. 2018, 8, 550. [Google Scholar] [CrossRef] [PubMed]
- Bender, K.W.; Dobney, S.; Ogunrinde, A.; Chiasson, D.; Mullen, R.T.; Teresinski, H.J.; Snedden, W.A. The calmodulin-like protein CML43 functions as a salicylic-acid-inducible root-specific Ca2+ sensor in Arabidopsis. Biochem. J. 2014, 457, 127–136. [Google Scholar] [CrossRef] [PubMed]
- Chen, Q.; Xie, Q.; Gao, J.; Wang, W.; Sun, B.; Liu, B.; Wang, J. Characterization of Rolled and Erect Leaf 1 in regulating leave morphology in rice. J. Exp. Bot. 2015, 66, 6047–6058. [Google Scholar] [CrossRef] [PubMed]


© 2020 by the authors. Licensee MDPI, Basel, Switzerland. This article is an open access article distributed under the terms and conditions of the Creative Commons Attribution (CC BY) license (http://creativecommons.org/licenses/by/4.0/).