Improving Stability of Tear Film Lipid Layer via Concerted Action of Two Drug Molecules: A Biophysical View

 ,
,  and
and 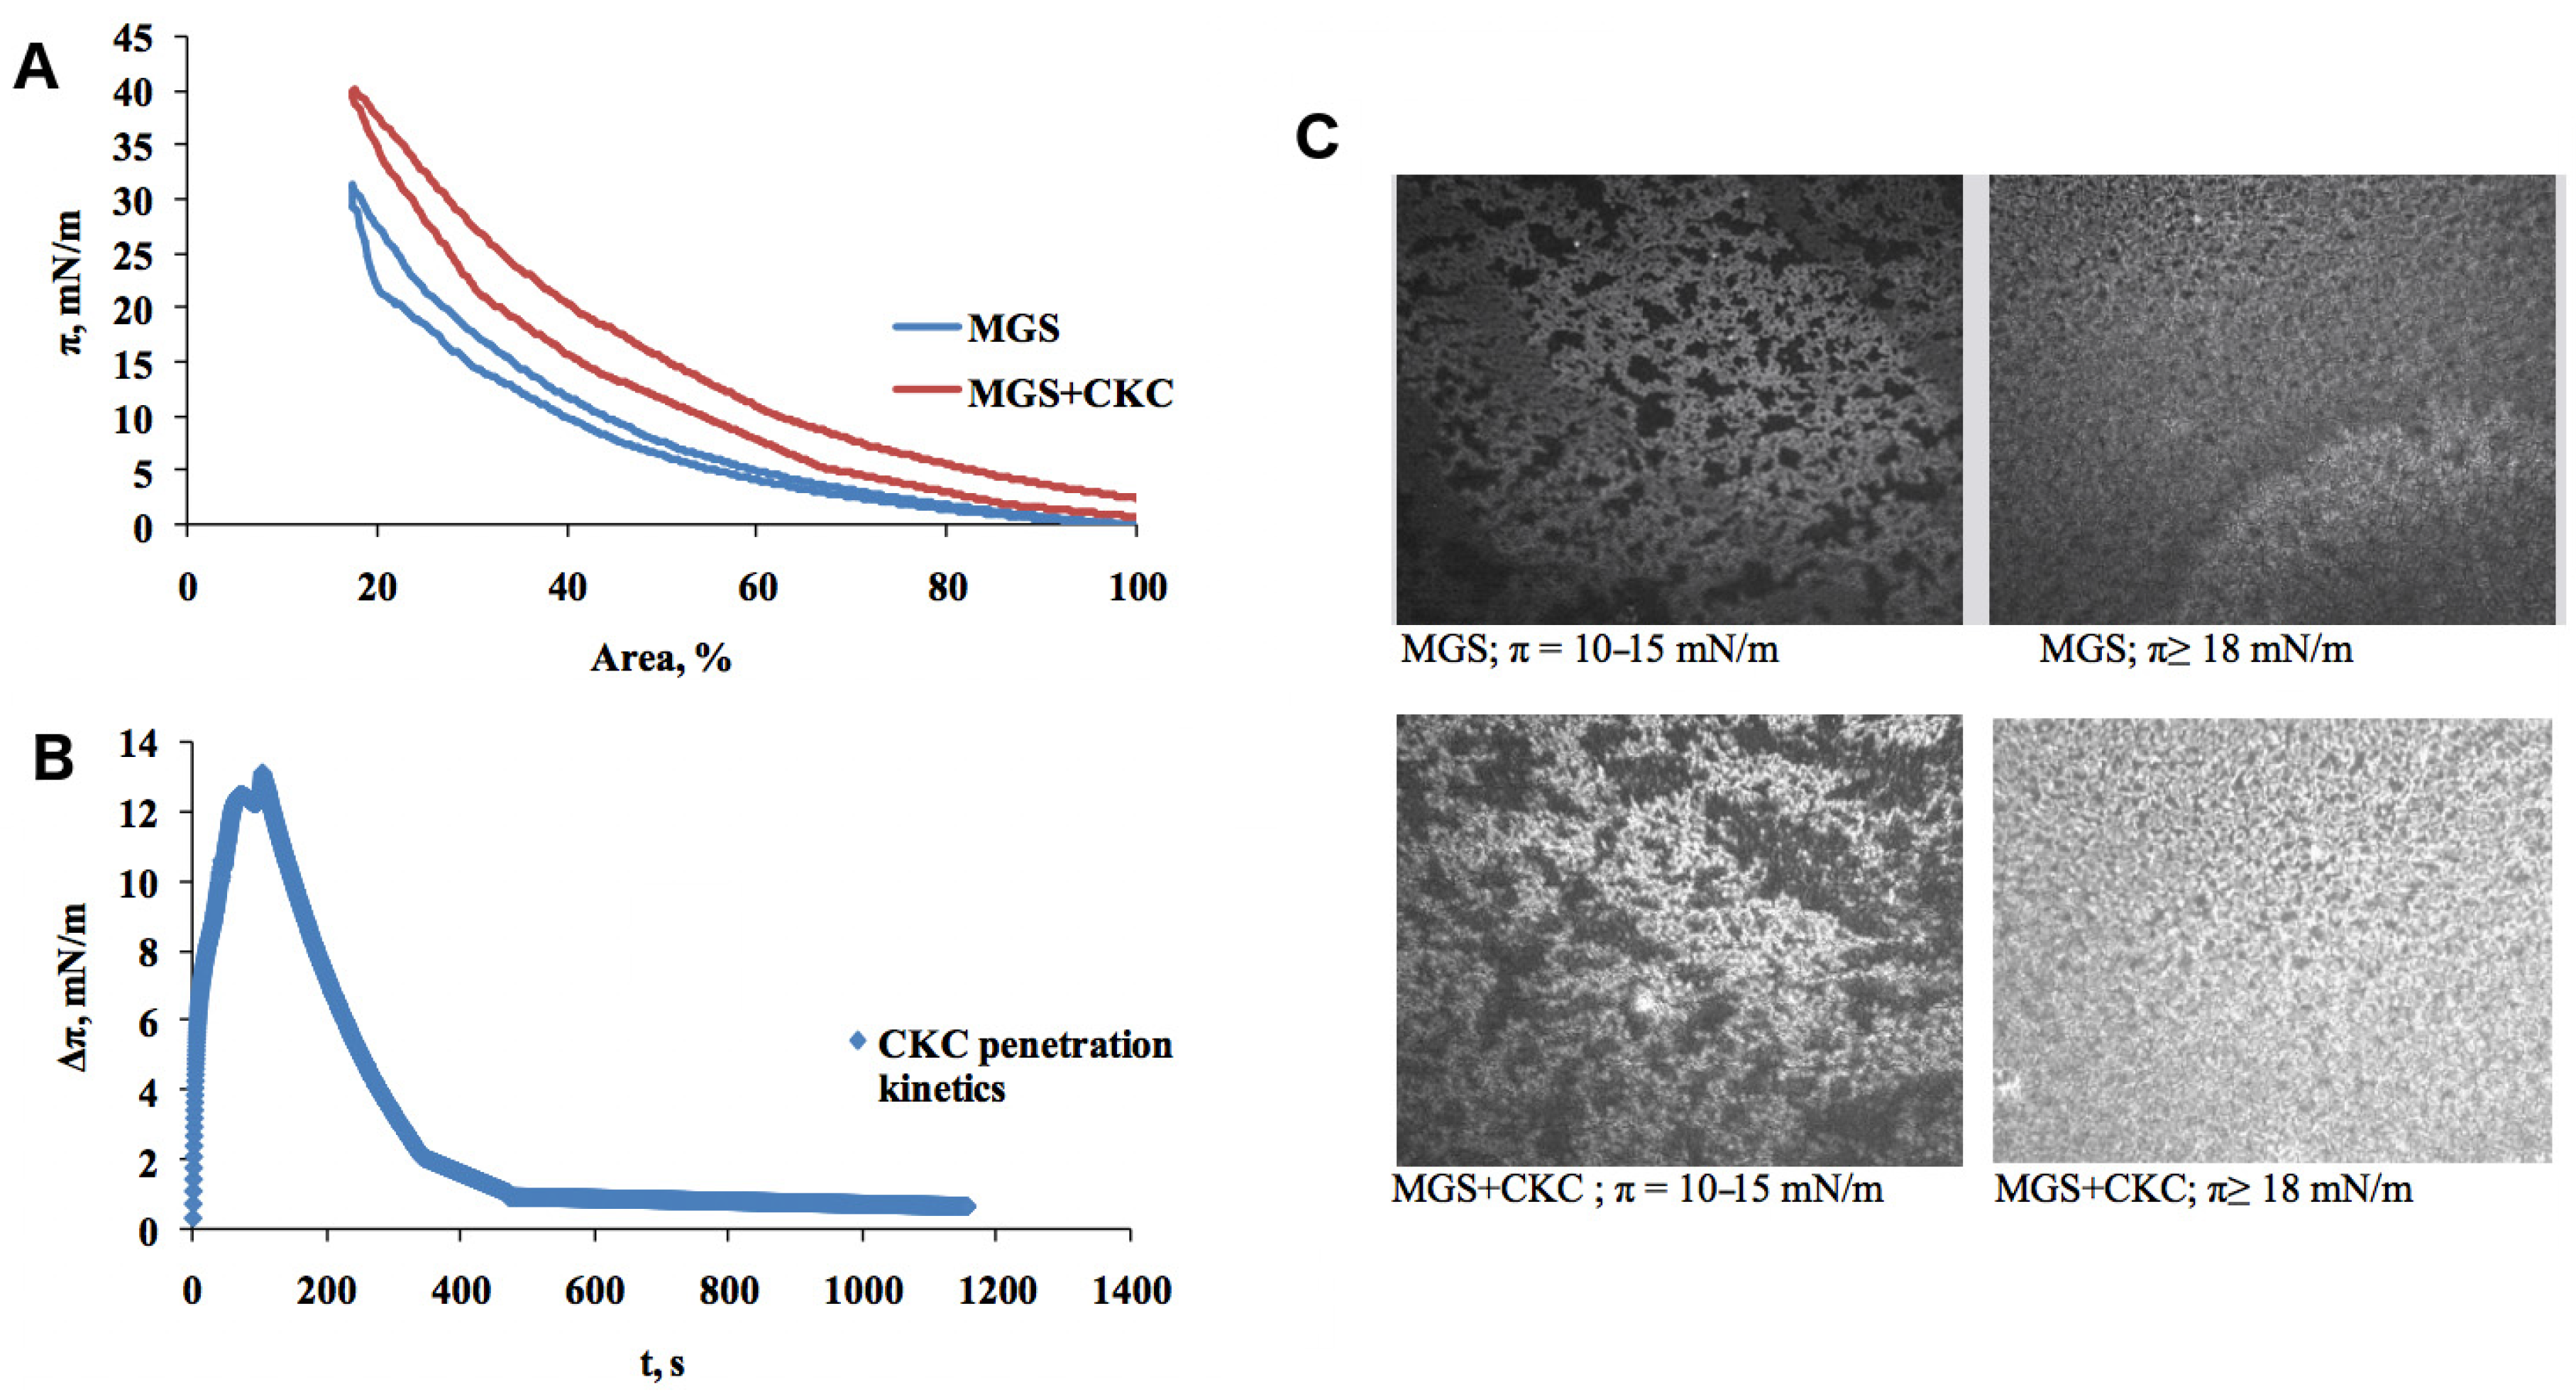
Abstract
:1. Introduction
2. Results and Discussion
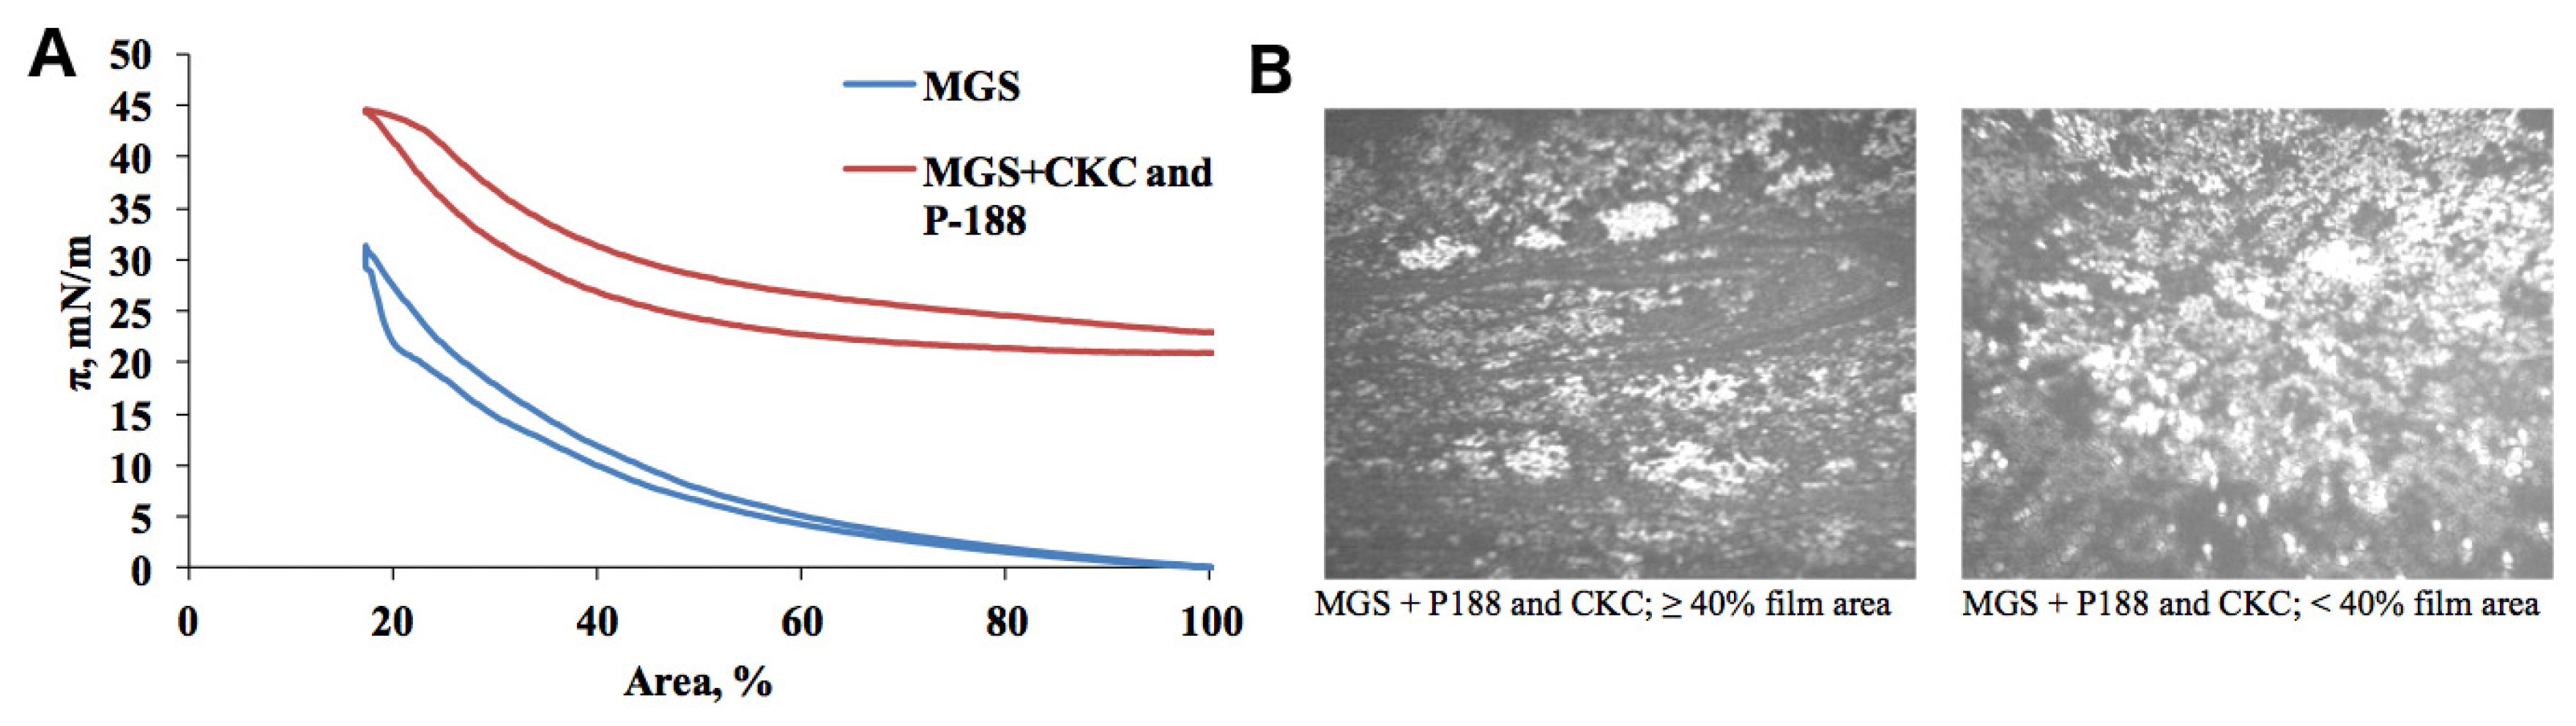
2.1. Meibomian Gland Secretion
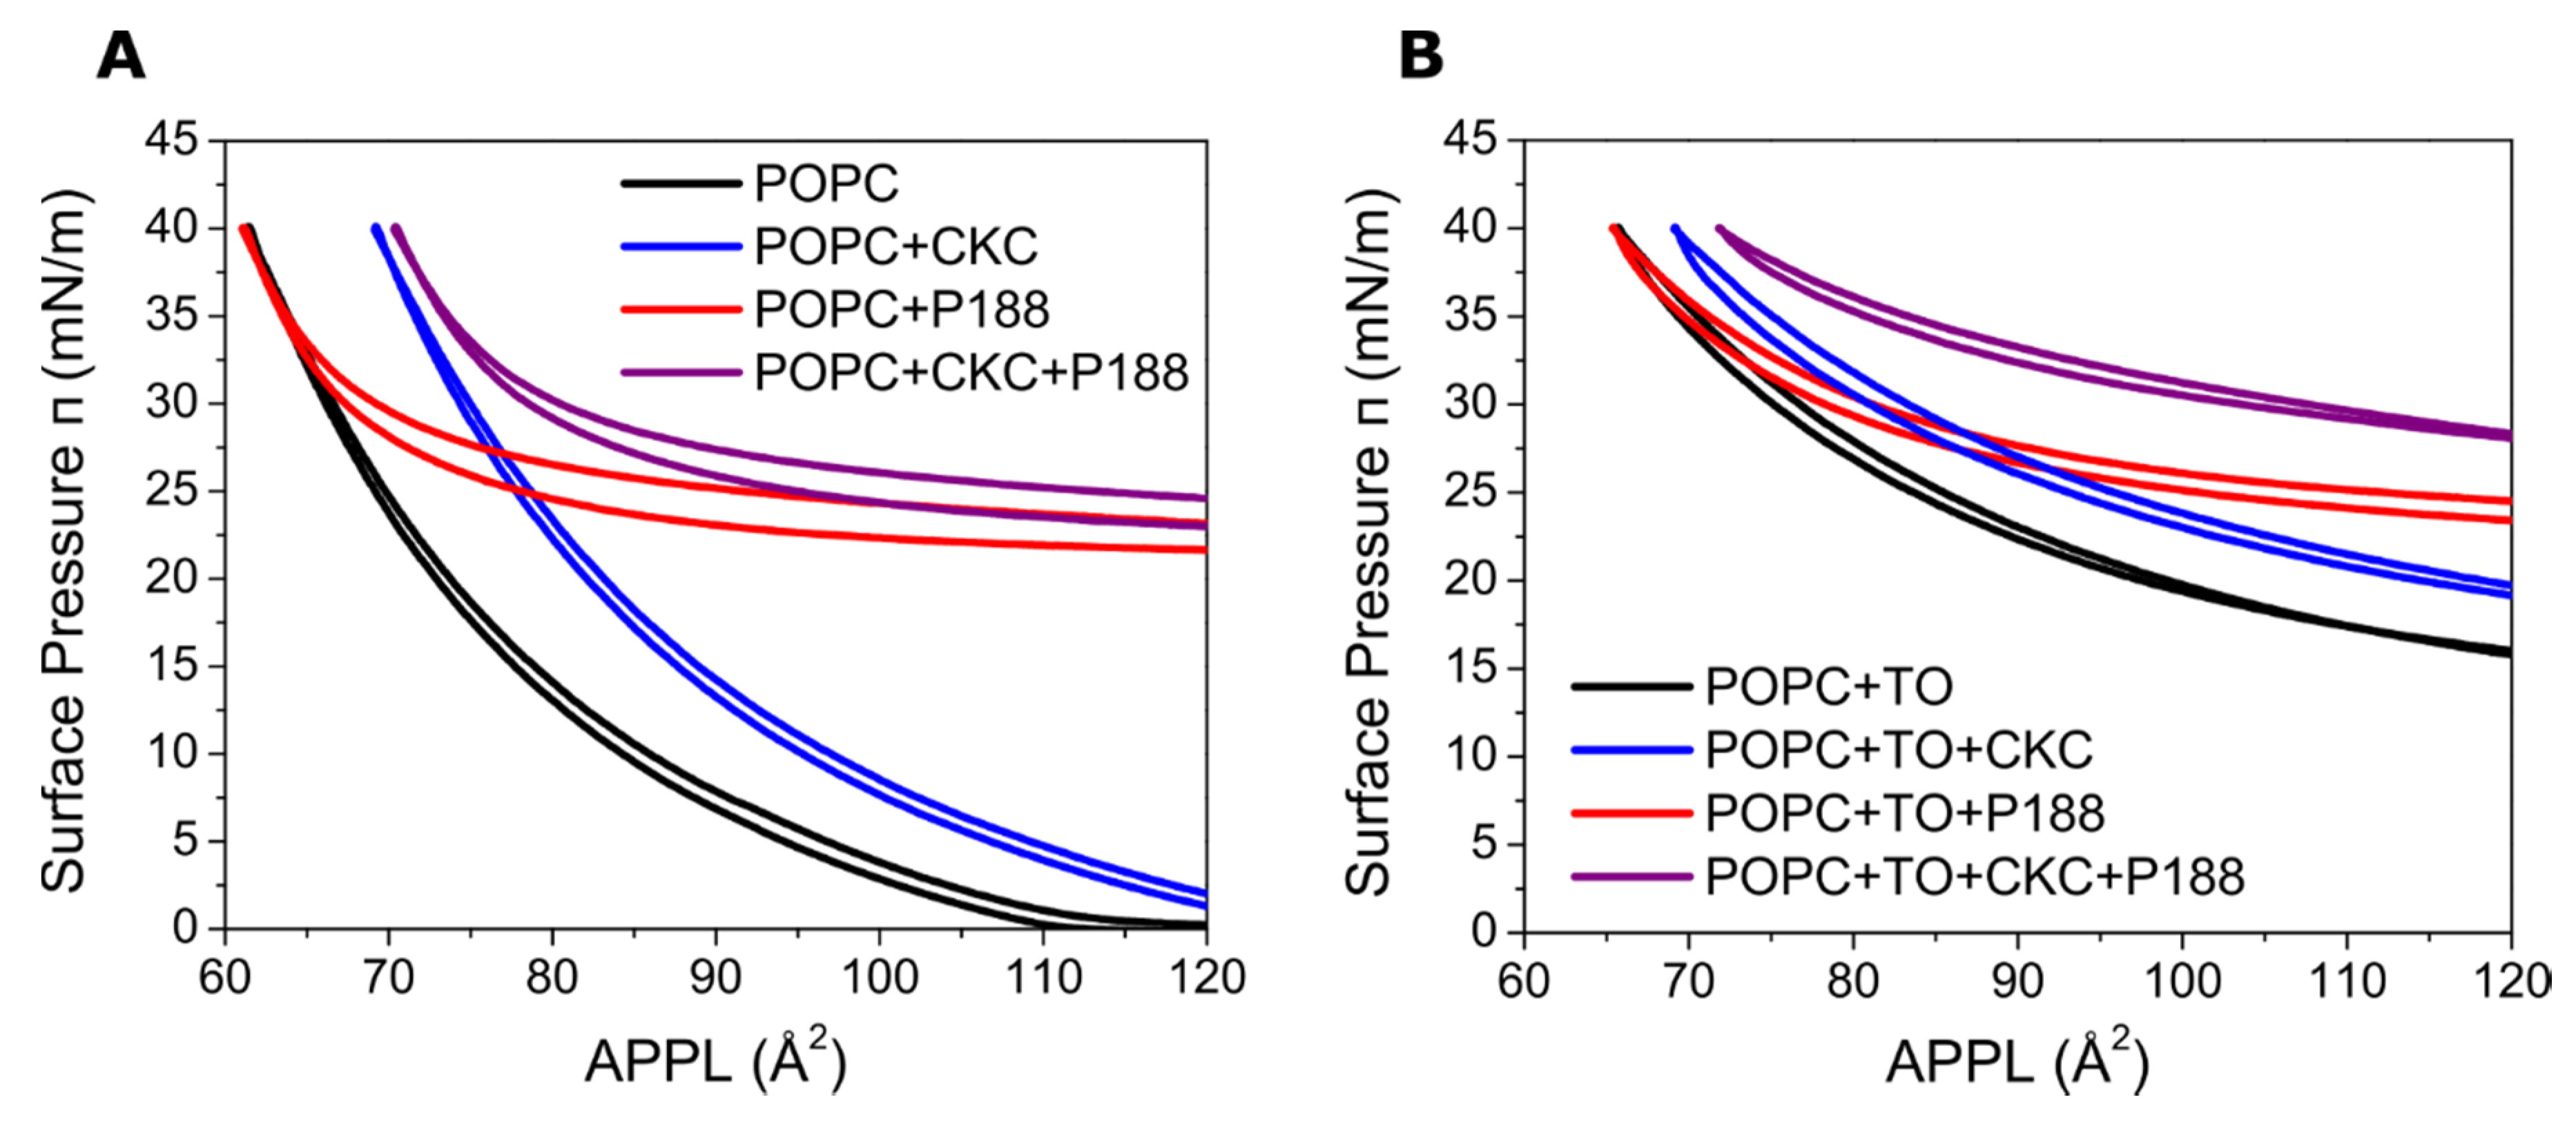
2.2. Synthetic Lipid Films
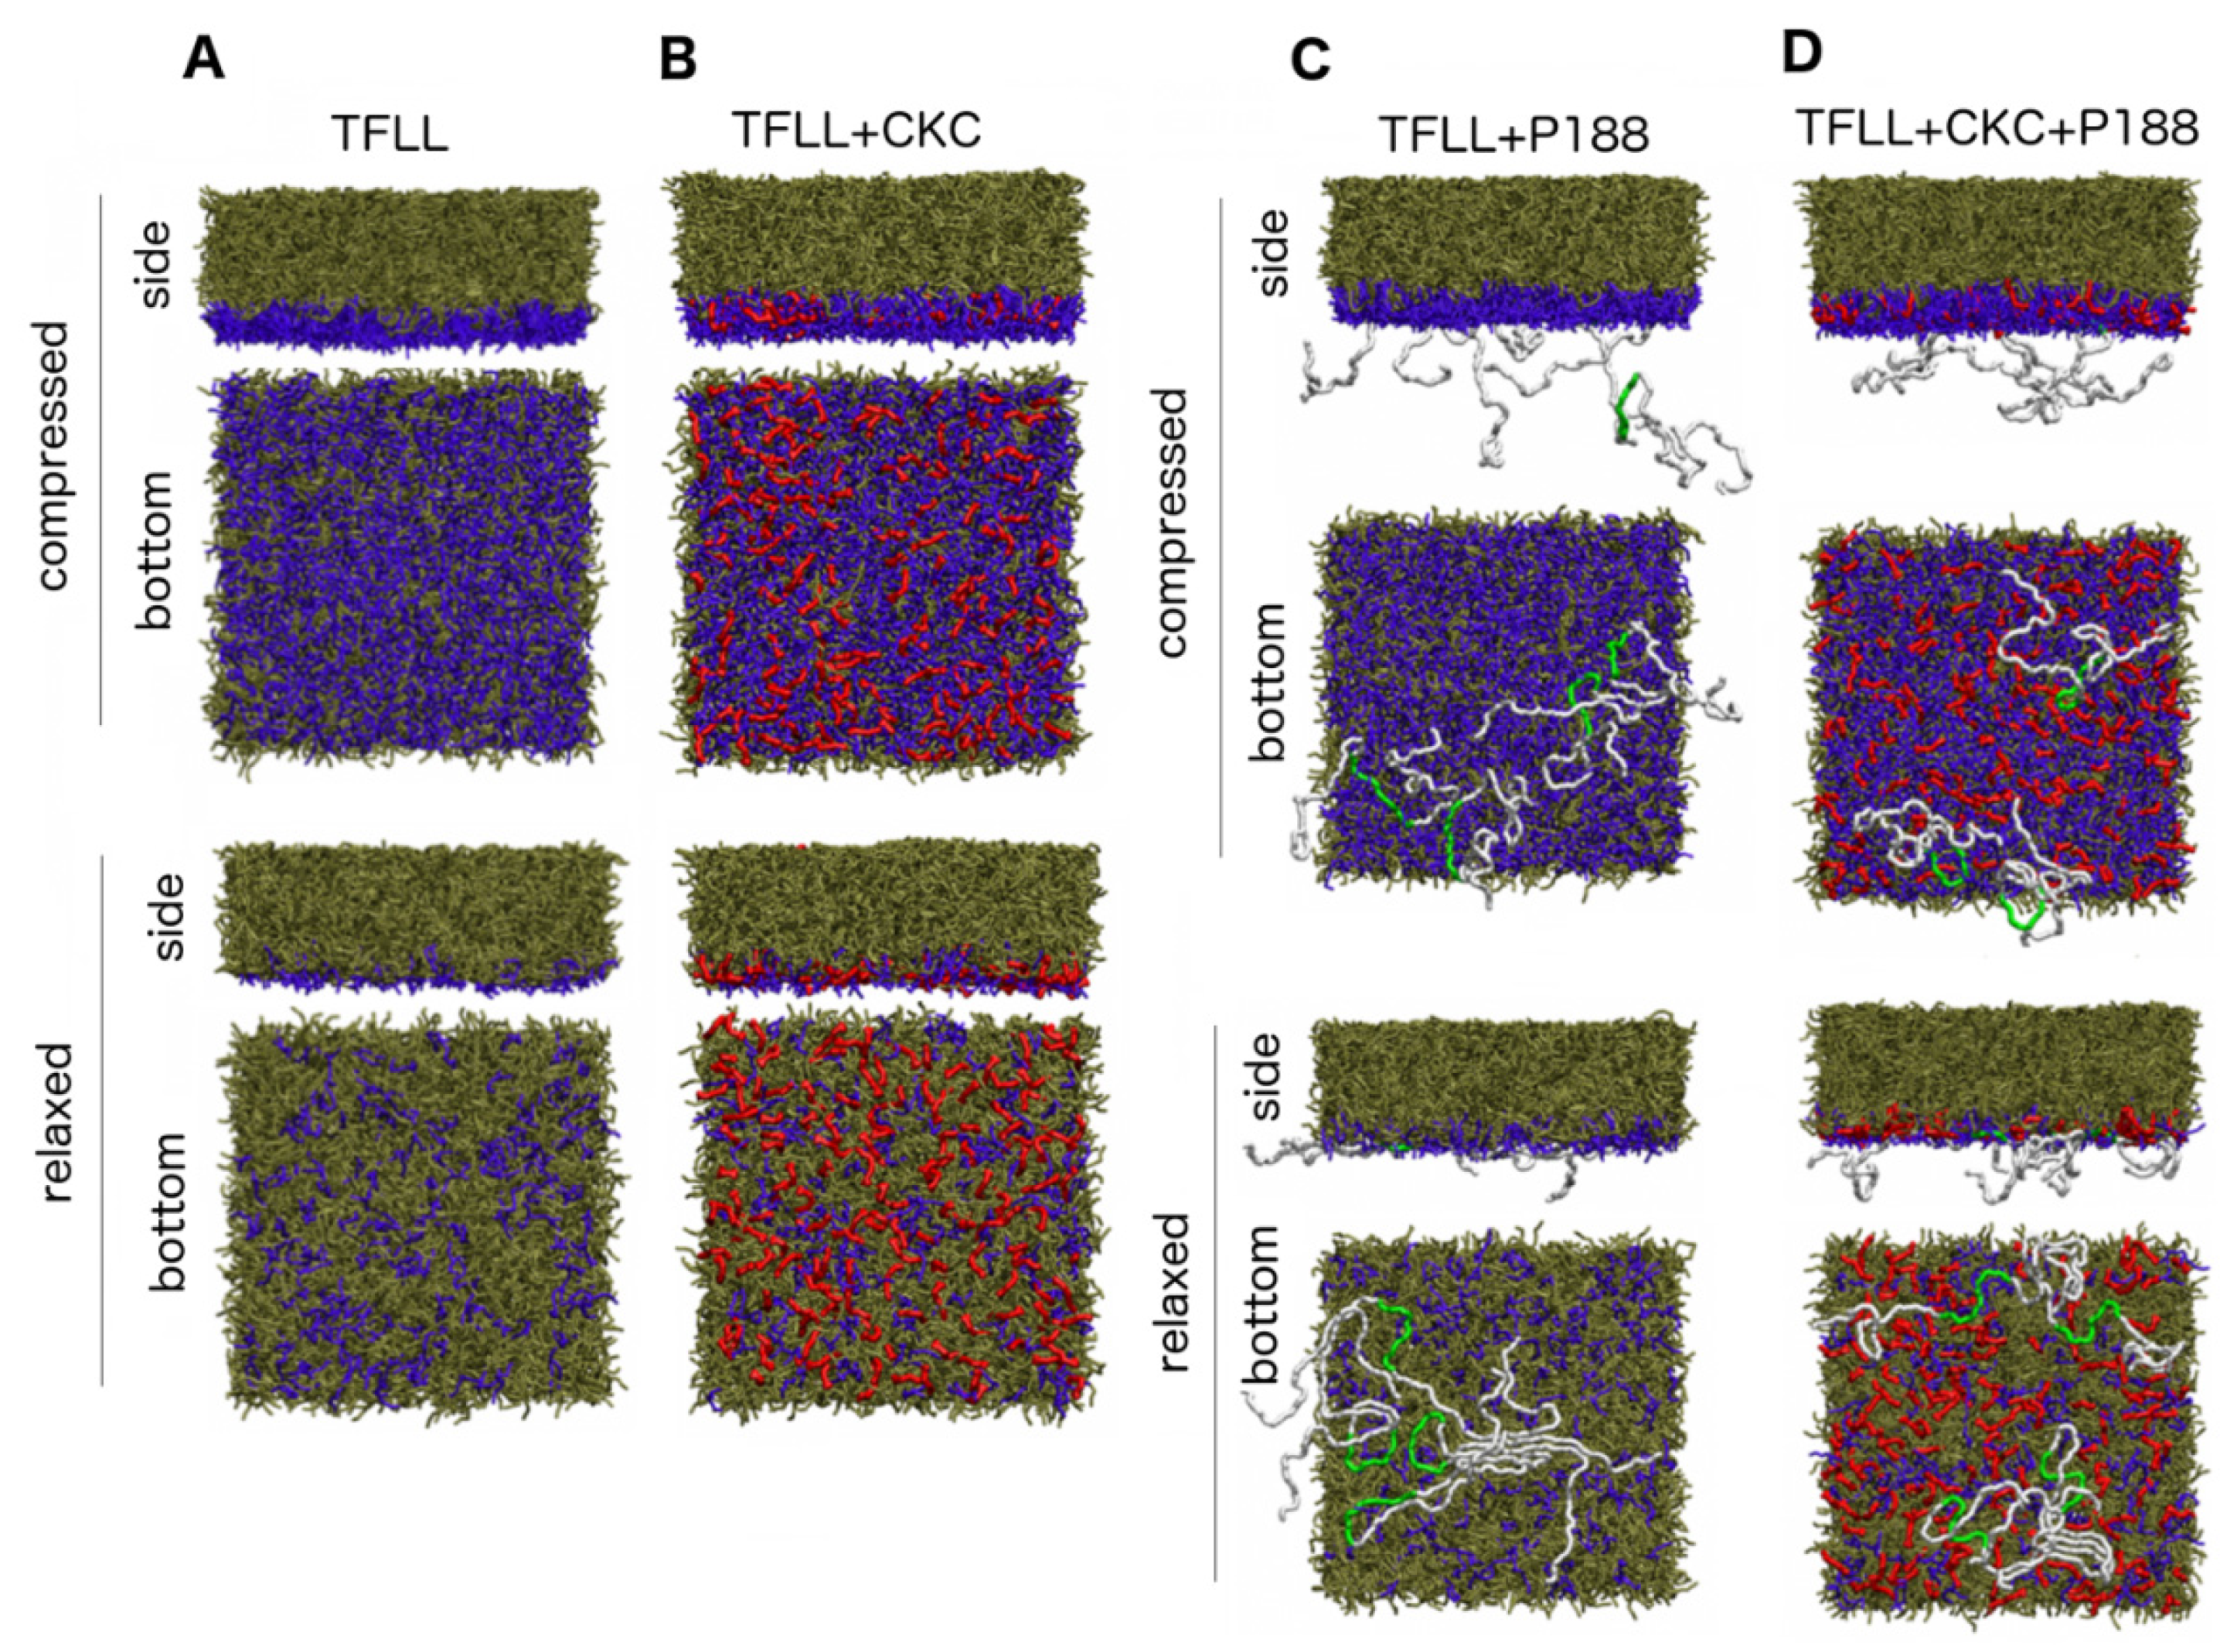
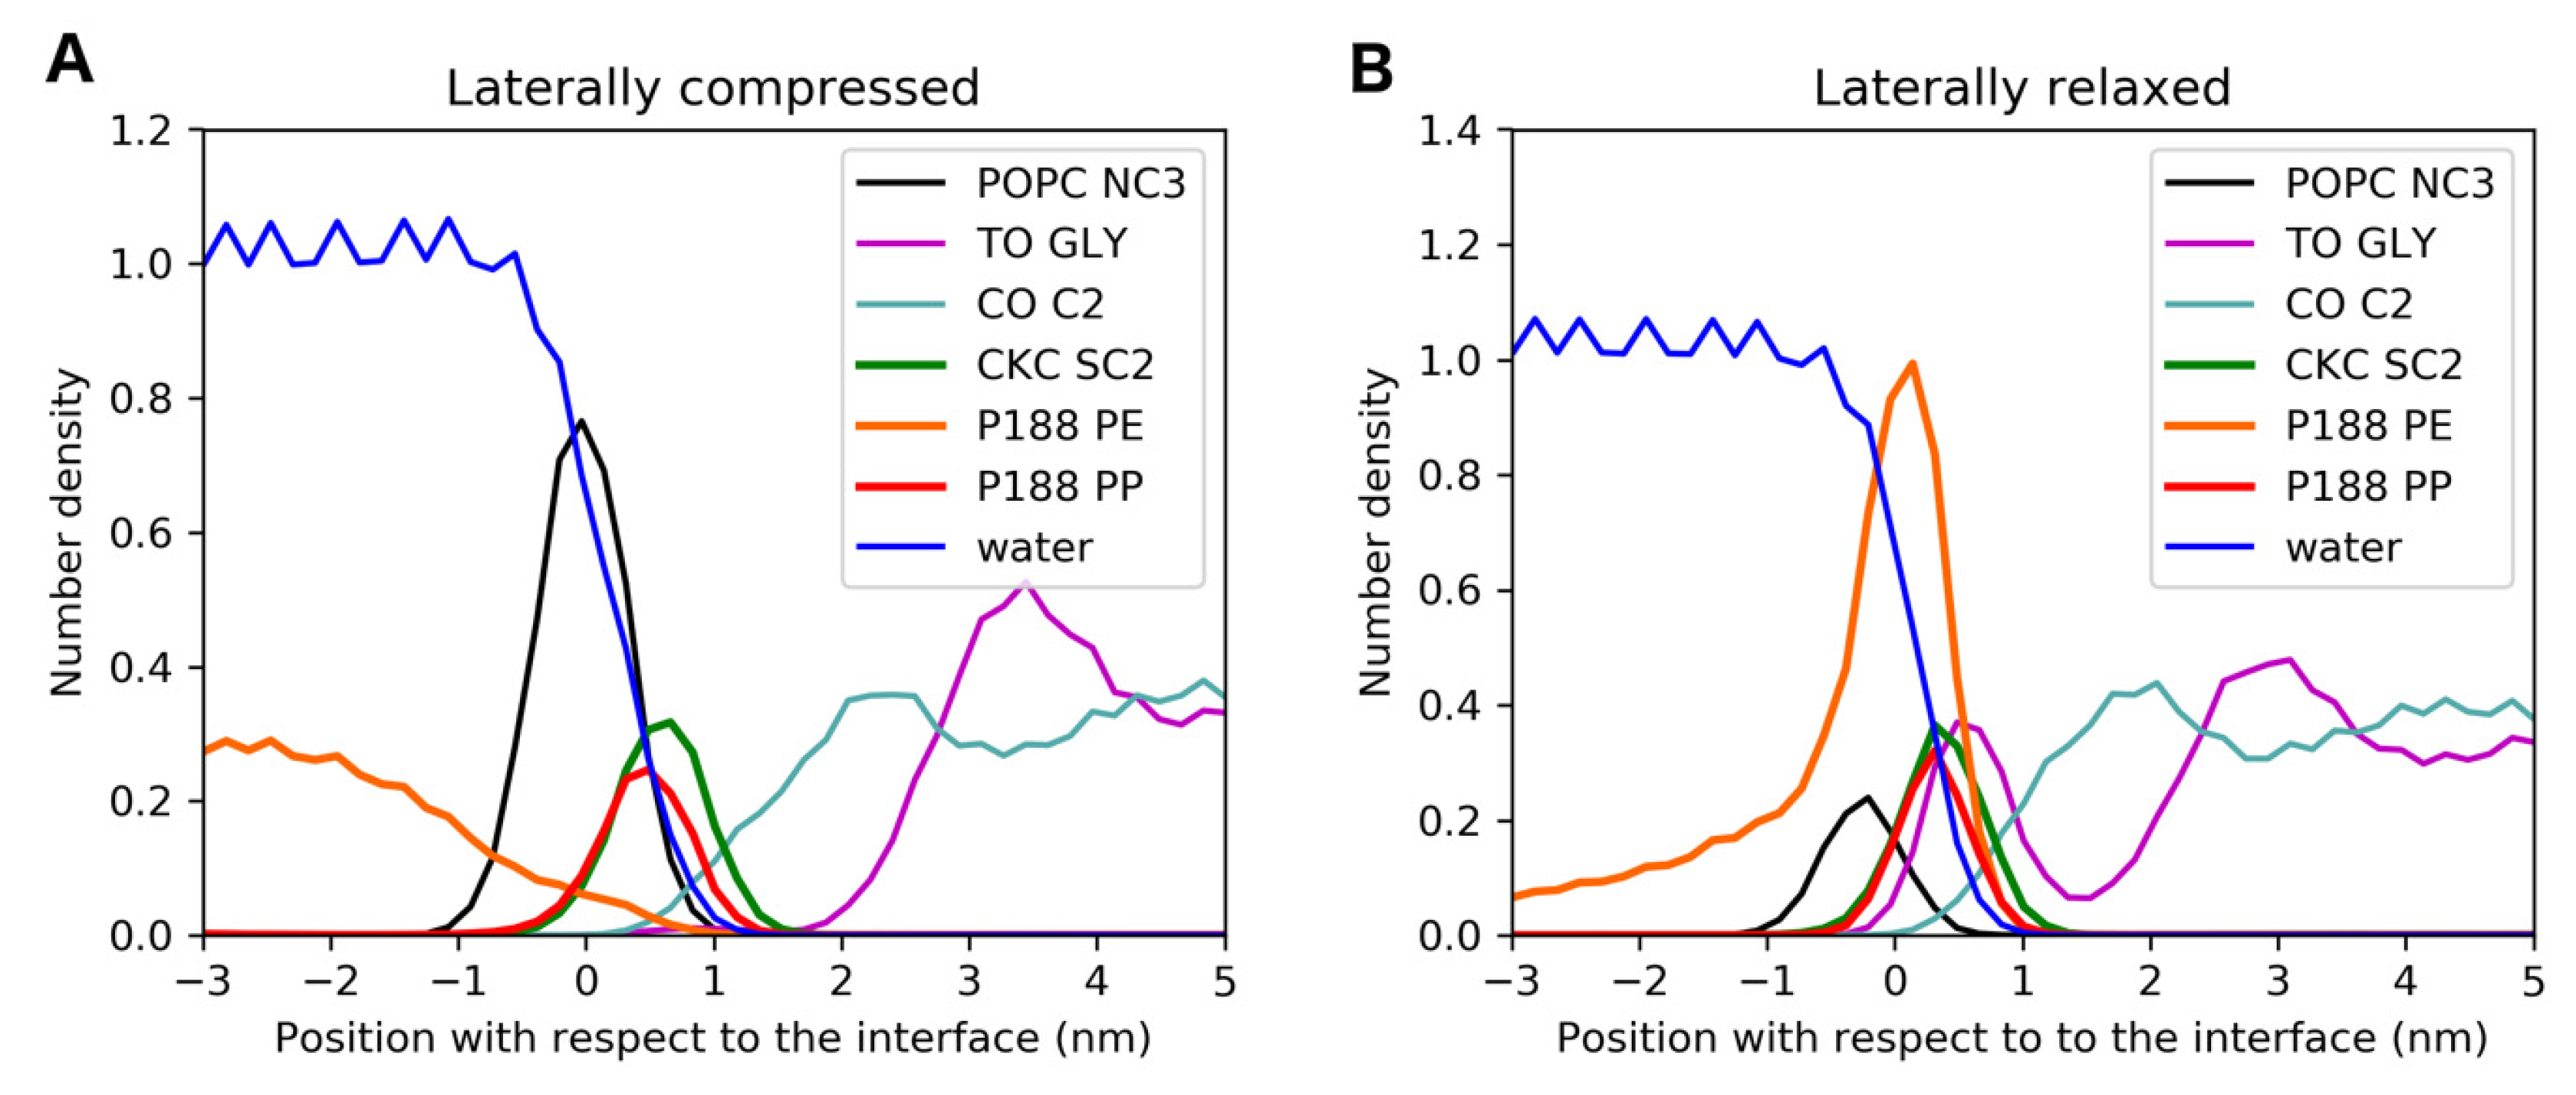
2.3. MD Simulations
3. Materials and Methods
3.1. Meibomian Gland Extracts
3.1.1. Compression Isotherms
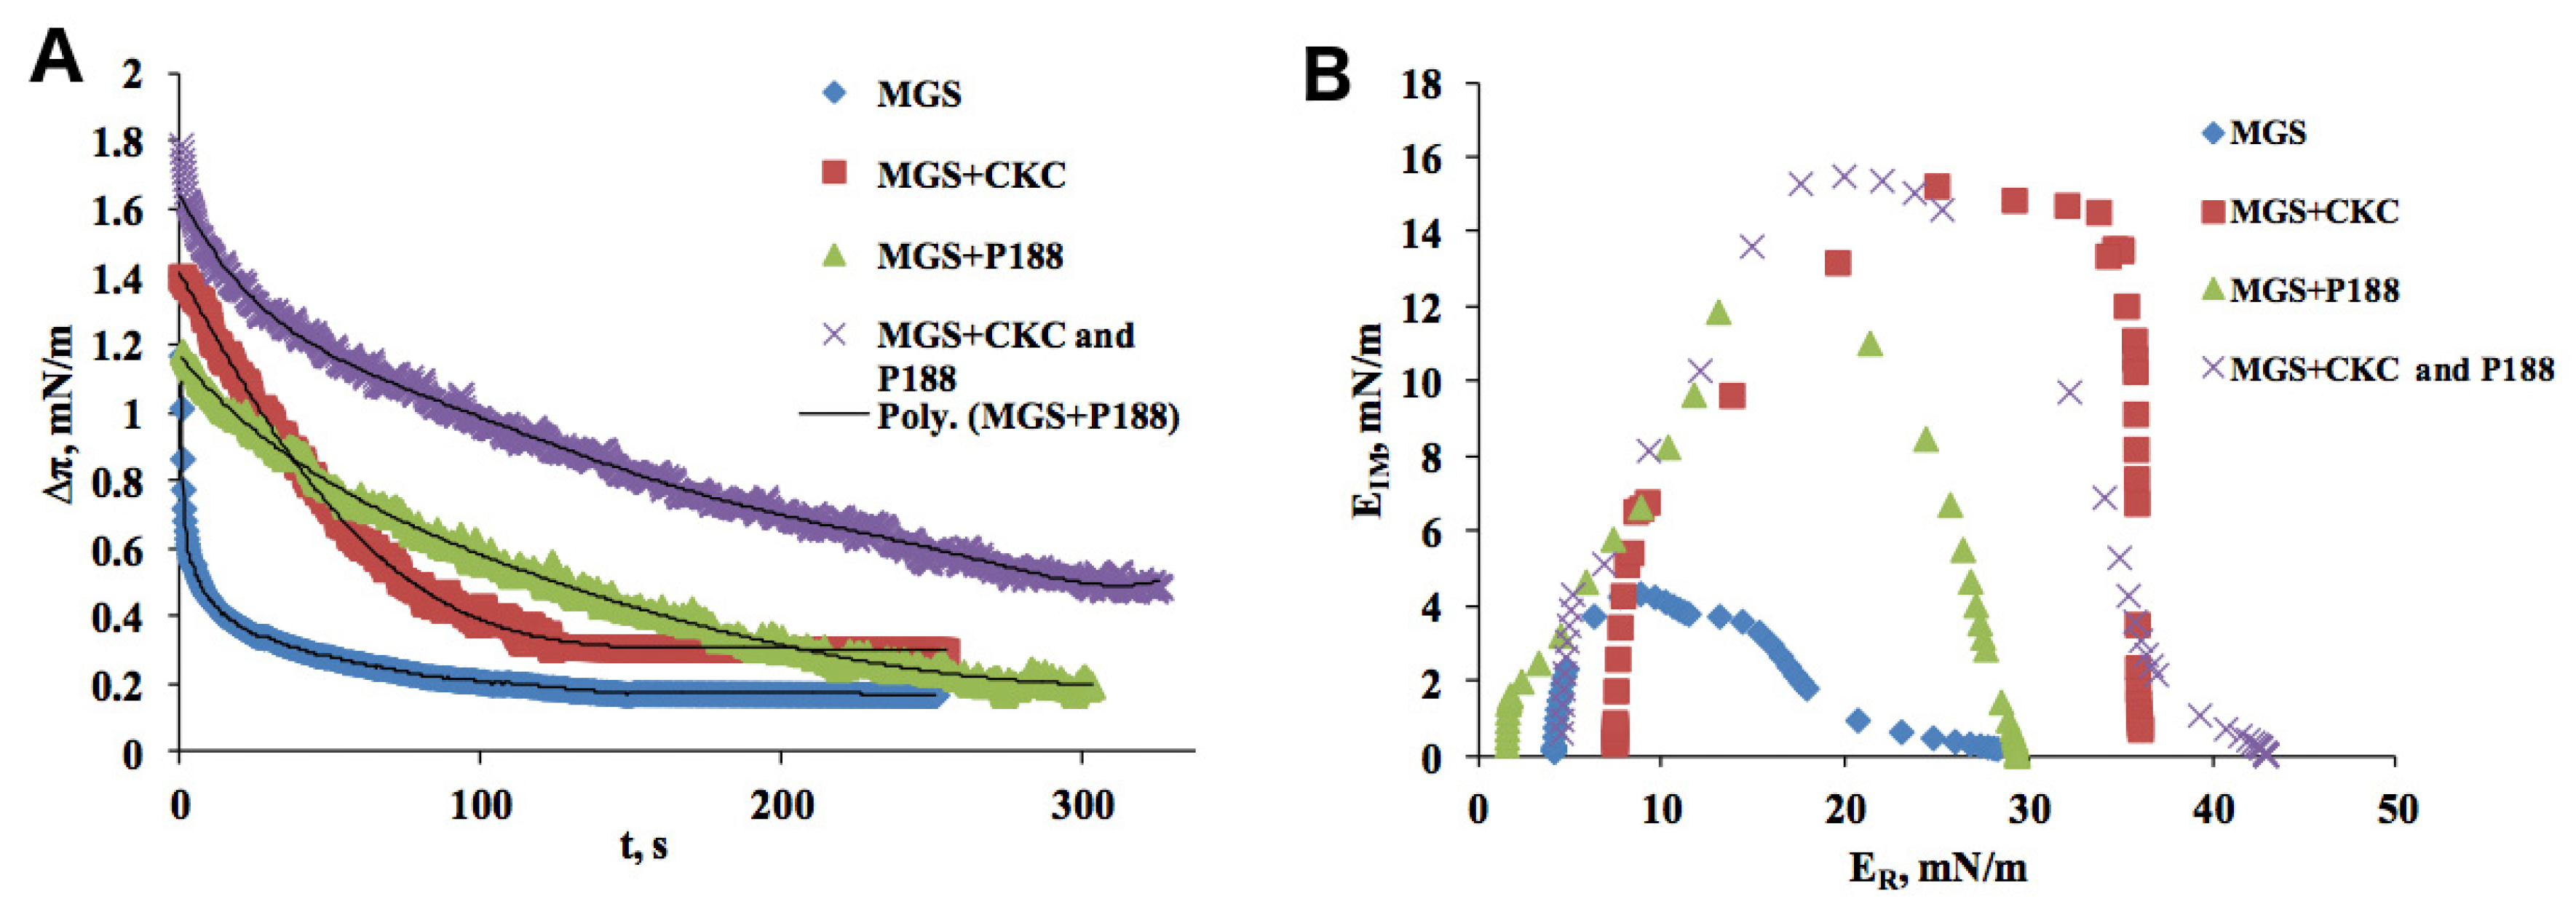
3.1.2. Stress–Relaxation Studies via the Small Deformations Method
3.2. Compression Isotherms and Epifluorescence Imaging of Synthetic Lipid Films
3.3. MD Simulations
4. Conclusions
Supplementary Materials
Author Contributions
Funding

Conflicts of Interest
References
- Willcox, M.D.; Argüeso, P.; Georgiev, G.A.; Holopainen, J.M.; Laurie, G.W.; Millar, T.J.; Papas, E.B.; Rolland, J.P.; Schmidt, T.A.; Stahl, U. Tfos dews ii tear film report. Ocul. Surf. 2017, 15, 366–403. [Google Scholar] [CrossRef] [Green Version]
- Cwiklik, L. Tear film lipid layer: A molecular level view. BBA-Biomembranes 2016, 1858, 2421–2430. [Google Scholar] [CrossRef]
- Georgiev, G.A.; Eftimov, P.; Yokoi, N. Structure-function relationship of tear film lipid layer: A contemporary perspective. Exp. Eye Res. 2017, 163, 17–28. [Google Scholar] [CrossRef]
- Baudouin, C. The vicious circle in dry eye syndrome: A mechanistic approach. J. Fr. Ophtalmol. 2007, 30, 239–246. [Google Scholar] [CrossRef]
- Bron, A.J.; de Paiva, C.S.; Chauhan, S.K.; Bonini, S.; Gabison, E.E.; Jain, S.; Knop, E.; Markoulli, M.; Ogawa, Y.; Perez, V. Tfos dews ii pathophysiology report. Ocul. Surf. 2017, 15, 438–510. [Google Scholar] [CrossRef]
- Yokoi, N.; Takehisa, Y.; Kinoshita, S. Correlation of tear lipid layer interference patterns with the diagnosis and severity of dry eye. Am. J. Ophthalmol. 1996, 122, 818–824. [Google Scholar] [CrossRef]
- Baudouin, C.; Messmer, E.M.; Aragona, P.; Geerling, G.; Akova, Y.A.; Benítez-del-Castillo, J.; Boboridis, K.G.; Merayo-Lloves, J.; Rolando, M.; Labetoulle, M. Revisiting the vicious circle of dry eye disease: A focus on the pathophysiology of meibomian gland dysfunction. Br. J. Ophthalmol. 2016, 100, 300–306. [Google Scholar] [CrossRef]
- Chan, T.C.Y.; Chow, S.S.W.; Wan, K.H.N.; Yuen, H.K.L. Update on the association between dry eye disease and meibomian gland dysfunction. Hong Kong Med. J. 2019, 25, 38–47. [Google Scholar] [CrossRef] [Green Version]
- Llorens-Quintana, C.; Rico-Del-Viejo, L.; Syga, P.; Madrid-Costa, D.; Iskander, D.R. Meibomian gland morphology: The influence of structural variations on gland function and ocular surface parameters. Cornea 2019, 38, 1506–1512. [Google Scholar] [CrossRef]
- Garrigue, J.-S.; Amrane, M.; Faure, M.-O.; Holopainen, J.M.; Tong, L. Relevance of lipid-based products in the management of dry eye disease. J. Ocul. Pharmacol. Ther. 2017, 33, 647–661. [Google Scholar] [CrossRef]
- Robert, P.-Y.; Cochener, B.; Amrane, M.; Ismail, D.; Garrigue, J.-S.; Pisella, P.-J.; Baudouin, C. Efficacy and safety of a cationic emulsion in the treatment of moderate to severe dry eye disease: A randomized controlled study. Eur. J. Ophthalmol. 2016, 26, 546–555. [Google Scholar] [CrossRef]
- Daull, P.; Amrane, M.; Ismail, D.; Georgiev, G.; Cwiklik, L.; Baudouin, C.; Leonardi, A.; Garhofer, G.; Garrigue, J.-S. Cationic emulsion-based artificial tears as a mimic of functional healthy tear film for restoration of ocular surface homeostasis in dry eye disease. J. Ocul. Pharmacol. Ther. 2020. [Google Scholar] [CrossRef]
- Amrane, M.; Creuzot-Garcher, C.; Robert, P.-Y.; Ismail, D.; Garrigue, J.-S.; Pisella, P.-J.; Baudouin, C. Ocular tolerability and efficacy of a cationic emulsion in patients with mild to moderate dry eye disease–a randomised comparative study. J. Fr. Ophtalmol. 2014, 37, 589–598. [Google Scholar] [CrossRef] [PubMed]
- Georgiev, G.A.; Yokoi, N.; Nencheva, Y.; Peev, N.; Daull, P. Surface chemistry interactions of cationorm with films by human meibum and tear film compounds. Int. J. Mol. Sci. 2017, 18, 1558. [Google Scholar] [CrossRef] [PubMed] [Green Version]
- Tiffany, J.; Winter, N.; Bliss, G. Tear film stability and tear surface tension. Curr. Eye Res. 1989, 8, 507–515. [Google Scholar] [CrossRef] [PubMed]
- Nagyova, B.; Tiffany, J.M. Components responsible for the surface tension of human tears. Curr. Eye Res. 1999, 19, 4–11. [Google Scholar] [CrossRef]
- Miller, D. Measurement of the surface tension of tears. Arch. Ophthalmol. 1969, 82, 368–371. [Google Scholar] [CrossRef]
- Zhao, J.; Wollmer, P. Surface activity of tear fluid in normal subjects. Acta Ophthalmol. Scand. 1998, 76, 438–441. [Google Scholar] [CrossRef] [Green Version]
- Tiffany, J. Tears in health and disease. Eye 2003, 17, 923–926. [Google Scholar] [CrossRef]
- Zhao, J.; Wollmer, P. Air pollutants and tear film stability–a method for experimental evaluation. Clin. Physiol. 2001, 21, 282–286. [Google Scholar] [CrossRef]
- Georgiev, G.A.; Yokoi, N.; Koev, K.; Kutsarova, E.; Ivanova, S.; Kyumurkov, A.; Jordanova, A.; Krastev, R.; Lalchev, Z. Surface chemistry study of the interactions of benzalkonium chloride with films of meibum, corneal cells lipids, and whole tears. Investig. Ophthalmol. Vis. Sci. 2011, 52, 4645–4654. [Google Scholar] [CrossRef] [PubMed] [Green Version]
- Georgiev, G.A.; Yokoi, N.; Ivanova, S.; Krastev, R.; Lalchev, Z. Surface chemistry study of the interactions of pharmaceutical ingredients with human meibum films. Investig. Ophthalmol. Vis. Sci. 2012, 53, 4605–4615. [Google Scholar] [CrossRef] [PubMed] [Green Version]
- Georgiev, G.A.; Yokoi, N.; Ivanova, S.; Dimitrov, T.; Andreev, K.; Krastev, R.; Lalchev, Z. Surface chemistry study of the interactions of hyaluronic acid and benzalkonium chloride with meibomian and corneal cell lipids. Soft Matter 2013, 9, 10841–10856. [Google Scholar] [CrossRef]
- Borchman, D.; Foulks, G.N.; Yappert, M.C.; Milliner, S.E. Differences in human meibum lipid composition with meibomian gland dysfunction using nmr and principal component analysis. Investig. Ophthalmol. Vis. Sci. 2012, 53, 337–347. [Google Scholar] [CrossRef]
- Leiske, D.L.; Miller, C.E.; Rosenfeld, L.; Cerretani, C.; Ayzner, A.; Lin, B.; Meron, M.; Senchyna, M.; Ketelson, H.A.; Meadows, D.; et al. Molecular structure of interfacial human meibum films. Langmuir 2012, 28, 11858–11865. [Google Scholar] [CrossRef]
- Olżyńska, A.; Wizert, A.; Štefl, M.; Iskander, D.R.; Cwiklik, L. Mixed polar-nonpolar lipid films as minimalistic models of tear film lipid layer: A langmuir trough and fluorescence microscopy study. BBA-Biomembranes 2020, 183300. [Google Scholar]
- Wizert, A.; Iskander, D.R.; Cwiklik, L. Organization of lipids in the tear film: A molecular-level view. PLoS ONE 2014, 9, e92461. [Google Scholar] [CrossRef] [Green Version]
- Olżyńska, A.; Cwiklik, L. Behavior of sphingomyelin and ceramide in a tear film lipid layer model. Ann. Anat. 2017, 210, 128–134. [Google Scholar] [CrossRef]
- Wizert, A.; Iskander, D.R.; Cwiklik, L. Interaction of lysozyme with a tear film lipid layer model: A molecular dynamics simulation study. BBA-Biomembranes 2017, 1859, 2289–2296. [Google Scholar] [CrossRef]
- Bland, H.; Moilanen, J.; Ekholm, F.S.; Paananen, R. Investigating the role of specific tear film lipids connected to dry eye syndrome: A study on o-acyl-ω-hydroxy-fatty acids and diesters. Langmuir 2019, 35, 3545–3552. [Google Scholar] [CrossRef]
- Paananen, R.O.; Viitaja, T.; Olżyńska, A.; Ekholm, F.S.; Moilanen, J.; Cwiklik, L. Interactions of polar lipids with cholesteryl ester multilayers elucidate tear film lipid layer structure. Ocul. Surf. 2020, 18, 545–553. [Google Scholar] [CrossRef] [PubMed]
- Humphrey, W.; Dalke, A.; Schulten, K. Vmd: Visual molecular dynamics. J. Mol. Graph. 1996, 14, 33–38. [Google Scholar] [CrossRef]
- Skrzypiec, M.; Georgiev, G.A.; Rojewska, M.; Prochaska, K. Interaction of polyhedral oligomeric silsesquioxanes and dipalmitoylphosphatidylcholine at the air/water interface: Thermodynamic and rheological study. BBA-Biomembranes 2017, 1859, 1838–1850. [Google Scholar] [CrossRef] [PubMed]
- Roylance, D. Engineering Viscoelasticity; Department of Materials Science and Engineering–Massachusetts Institute of Technology: Cambridge, MA, USA, 2001; Volume 2139, pp. 1–37. [Google Scholar]
- Rantamaki, A.H.; Seppanen-Laakso, T.; Oresic, M.; Jauhiainen, M.; Holopainen, J.M. Human tear fluid lipidome: From composition to function. PLoS ONE 2011, 6, e19553. [Google Scholar] [CrossRef] [Green Version]
- Hezaveh, S.; Samanta, S.; De Nicola, A.; Milano, G.; Roccatano, D. Understanding the interaction of block copolymers with dmpc lipid bilayer using coarse-grained molecular dynamics simulations. J. Phys. Chem. B 2012, 116, 14333–14345. [Google Scholar] [CrossRef]
- Abraham, M.J.; Murtola, T.; Schulz, R.; Páll, S.; Smith, J.C.; Hess, B.; Lindahl, E. Gromacs: High performance molecular simulations through multi-level parallelism from laptops to supercomputers. SoftwareX 2015, 1, 19–25. [Google Scholar] [CrossRef] [Green Version]
- Leonardi, A.; Van Setten, G.; Amrane, M.; Ismail, D.; Garrigue, J.S.; Figueiredo, F.C.; Baudouin, C. Efficacy and safety of 0.1% cyclosporine a cationic emulsion in the treatment of severe dry eye disease: A multicenter randomized trial. Eur. J. Ophthalmol. 2016, 26, 287–296. [Google Scholar] [CrossRef]


Publisher’s Note: MDPI stays neutral with regard to jurisdictional claims in published maps and institutional affiliations. |
© 2020 by the authors. Licensee MDPI, Basel, Switzerland. This article is an open access article distributed under the terms and conditions of the Creative Commons Attribution (CC BY) license (http://creativecommons.org/licenses/by/4.0/).
Share and Cite
Eftimov, P.; Olżyńska, A.; Melcrová, A.; Georgiev, G.A.; Daull, P.; Garrigue, J.-S.; Cwiklik, L. Improving Stability of Tear Film Lipid Layer via Concerted Action of Two Drug Molecules: A Biophysical View. Int. J. Mol. Sci. 2020, 21, 9490. https://doi.org/10.3390/ijms21249490
Eftimov P, Olżyńska A, Melcrová A, Georgiev GA, Daull P, Garrigue J-S, Cwiklik L. Improving Stability of Tear Film Lipid Layer via Concerted Action of Two Drug Molecules: A Biophysical View. International Journal of Molecular Sciences. 2020; 21(24):9490. https://doi.org/10.3390/ijms21249490
Chicago/Turabian StyleEftimov, Petar, Agnieszka Olżyńska, Adéla Melcrová, Georgi As. Georgiev, Philippe Daull, Jean-Sebastien Garrigue, and Lukasz Cwiklik. 2020. "Improving Stability of Tear Film Lipid Layer via Concerted Action of Two Drug Molecules: A Biophysical View" International Journal of Molecular Sciences 21, no. 24: 9490. https://doi.org/10.3390/ijms21249490