Article

SPInDel Analysis of the Non-Coding Regions of cpDNA as a More Useful Tool for the Identification of Rye (Poaceae: Secale) Species

1
Institute of Biology, University of Szczecin, 13 Wąska, 71-415 Szczecin, Poland
2
The Centre for Molecular Biology and Biotechnology, University of Szczecin, 13 Wąska, 71-415 Szczecin, Poland
3
Department of Mathematical and Statistical Methods, Faculty of Agronomy and Bioengineering, Poznań University of Life Sciences, 28 Wojska Polskiego, 60-637 Poznań, Poland
*
Author to whom correspondence should be addressed.
Int. J. Mol. Sci. 2020, 21(24), 9421; https://doi.org/10.3390/ijms21249421
Submission received: 21 November 2020 / Revised: 7 December 2020 / Accepted: 8 December 2020 / Published: 10 December 2020
(This article belongs to the Special Issue Chloroplast Development and Function)

Abstract

:
Secale is a small but very diverse genus from the tribe Triticeae (family Poaceae), which includes annual, perennial, self-pollinating and open-pollinating, cultivated, weedy and wild species of various phenotypes. Despite its high economic importance, classification of this genus, comprising 3–8 species, is inconsistent. This has resulted in significantly reduced progress in the breeding of rye which could be enriched with functional traits derived from wild rye species. Our previous research has suggested the utility of non-coding sequences of chloroplast and mitochondrial DNA in studies on closely related species of the genus Secale. Here we applied the SPInDel (Species Identification by Insertions/Deletions) approach, which targets hypervariable genomic regions containing multiple insertions/deletions (indels) and exhibiting extensive length variability. We analysed a total of 140 and 210 non-coding sequences from cpDNA and mtDNA, respectively. The resulting data highlight regions which may represent useful molecular markers with respect to closely related species of the genus Secale, however, we found the chloroplast genome to be more informative. These molecular markers include non-coding regions of chloroplast DNA: atpB-rbcL and trnT-trnL and non-coding regions of mitochondrial DNA: nad1B-nad1C and rrn5/rrn18. Our results demonstrate the utility of the SPInDel concept for the characterisation of Secale species.

1. Introduction

Rye (Secale cereale L.) is commonly grown in the fields of Northern and Eastern Europe. S. cereale L. is highly tolerant to diverse environmental stresses, as drought and frost [1,2]. It contains genes conferring biotic stress resistance against various diseases (e.g., stem rust, leaf rust, and yellow rust [3] or powdery mildew [4]. In view of that the wild and weedy forms may crossbreed with cultivated rye [5], these taxa, along with the landraces, constitute gene pools for desirable genes. They can be regarded as genetic resource reservoirs for new niches and future breeding programs of wheat, triticale and other crops [6].
In spite of the high economic value of rye, its huge genome size (2n = 2 × = 14, 1Cx ~ 7.9 Gbp) [7] (the largest among the diploid species of Poaceae family) and highly repetitive genome 92% [8] have prevented the utilization of its genome information for crop improvement. Hence understanding genetic structuring of the genus Secale and distribution of genetic diversity within the genus is extremely important.
Unfortunately, the phylogenetic relationships within the genus Secale remain unclear. A division of the genus Secale into 15 different species has even been adopted [9,10], while Frederiksen and Petersen [11,12] recognized only three Secale species: Secale sylvestre, Secale strictum and S. cereale. According to the newest classification [13] the genus Secale is classified into four species: S. cereale—an annual allogamous species, S. sylvestre and vavilovii—an annual autogamous species and S. strictum—a perennial wild-type allogamous species [14]. Moreover, S. cereale also comprises eight subspecies, S. strictum—5. S. cereale ssp. cereale is the only cultivated species, although S. strictum may have been used as a forage crop [15]. Probably the most distant species is Secale sylvestre [15,16,17,18,19,20,21,22,23] due to its low crossability with other species, the lowest amount of t-heterochromatin [16] and the smallest genome (7.23 pg) [17]. For rye breeding S. vavilovii is attractive. It is characterized by high self-fertility, sprouting and sterilising cytoplasm, high protein content, resistance to diseases such as fusarium ear blight, septoria leaf blotch. Chromosomes of S. strictum are sources for resistance to yellow rust, Russian wheat aphid, grain hardness, increased protein and arabinoxylan content.
A number of studies on rye genetic diversity have been conducted using different marker systems, which include AFLP (Amplified Fragment Length Polymorphism) [24], SSR (Simple Sequence Repeats) [16,25,26,27,28,29], DArT (Diversity Arrays Technology) [30,31], and recently SNPs (Single nucleotide polymorphism) [32] and GWAS (Genome-wide association study) [33]. These markers tested individually or as a set of loci were unsuccessful in the study of the genetic variability of the genus Secale. The conducted studies only confirmed the lack of monophyletism in the Secale sp. subspecies, which resulted from a similar inter- and intraspecific distance. This proves that gene flow continues between rye species and the recent evolution, which does not allow the full formation of isolation mechanisms [34].
The results of several studies on the genus Secale indicate non-coding sequences as a source of markers for the differentiation of rye species. The non-coding sequences evolves faster than the coding region and due to this provides more information for phylogenetic analysis because of the higher variation rate [35,36,37]. The SpinDel program is often used for this type of analysis.
The theoretical basis of SPInDel (Species Identification by Insertions/Deletions) is the analysis of hypervariable regions with variable lengths having a large number of insertions/deletions (indels) interspersed with significantly conserved regions (Figure 1). A unique numeric profile for each species is defined by the combination of fragment lengths, allowing its identification.
Similarly, our previous research, which relied on analyzes of the coding and non-coding sequences of the mitochondrial, chloroplast and nuclear genomes, supports these results [38]. These studies demonstrated a better suitability of cpDNA for the analysis of Secale species. This has also been confirmed by several other authors in other land plants [39,40,41,42,43,44,45]. The cpDNA of plants is particularly suitable for the application of the SPInDel concept by having several coding regions (usually conserved) interspersed with large non-coding domains such as introns or intergenic spacers (usually rich in indels). Unfortunately, there are no data on the mitochondrial genome so far. Here we tested the use of the SPInDel concept for the identification of 35 accessions of the genus Secale, representing 13 most often distinguished species and subspecies, originating from various seed collections in the world. We also checked which organelle genome is more informative for the genus Secale.

2. Results

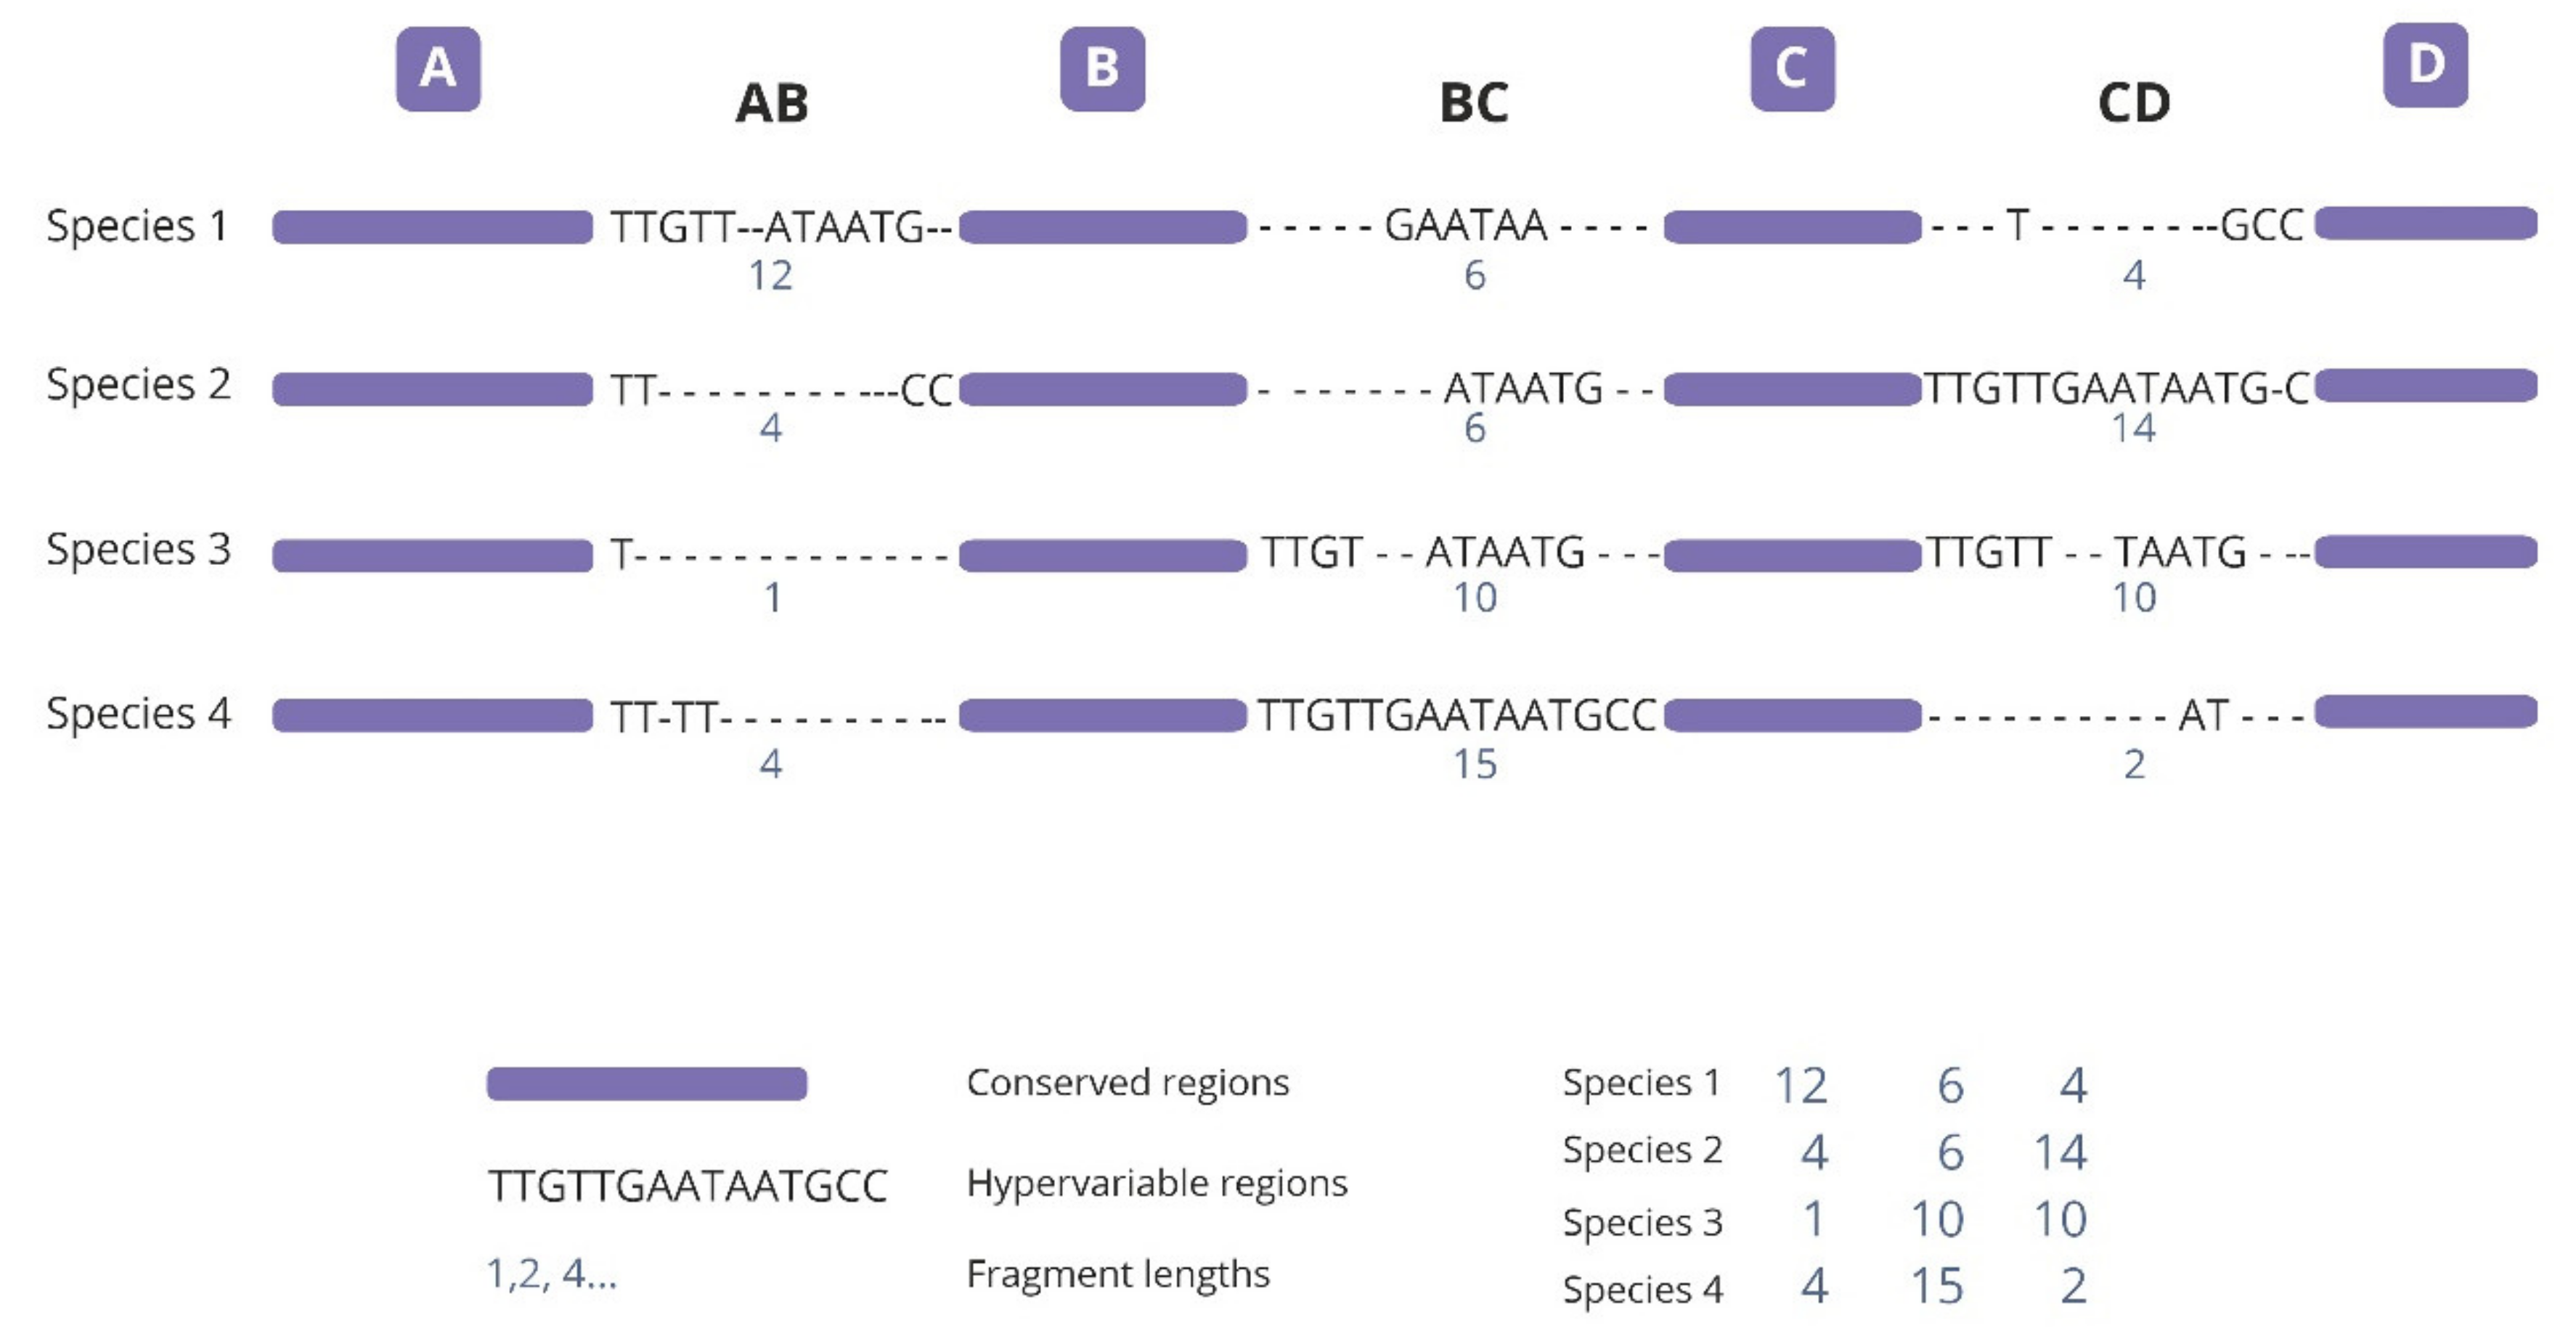
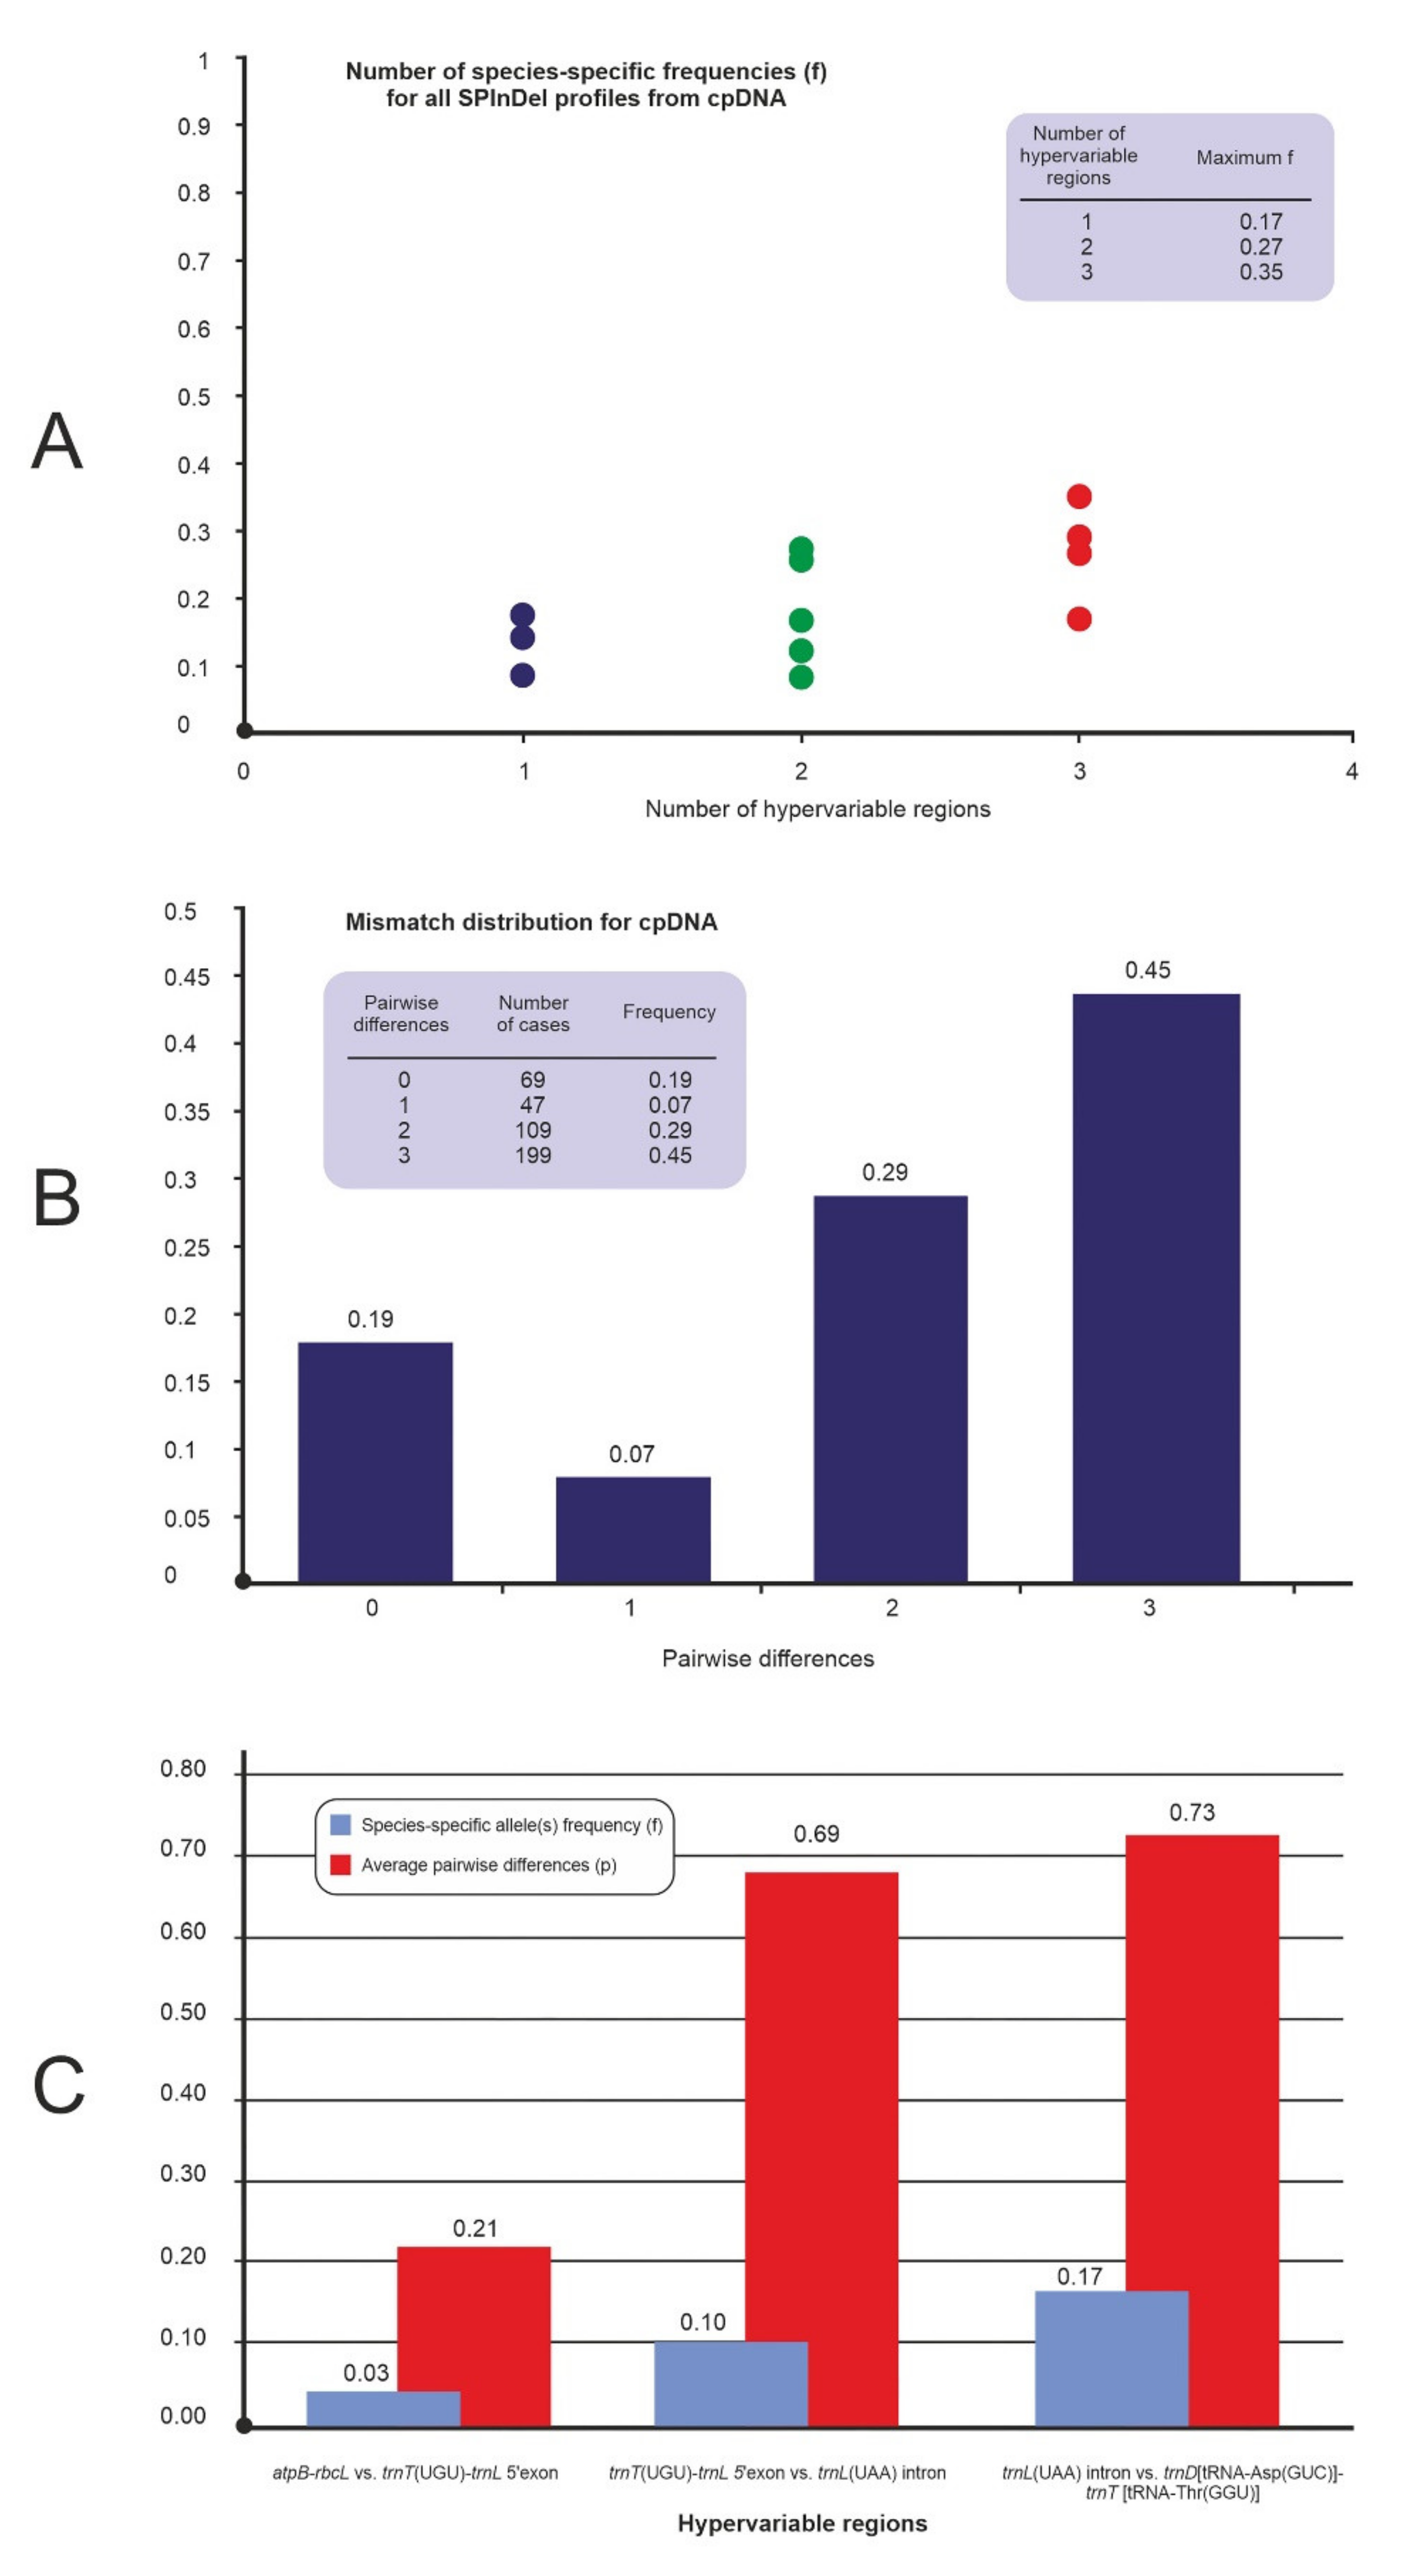
2.1. Analysis of Variable-Length cpDNA Sequences

A total of 3031 bp from 140 sequences were analyzed. The species and characteristic of each target region is described in Table S1.
The potential use of SPInDel profiles for species identification purposes requires the existence of ‘species-specific SPInDel profiles’: those that are only found in one species within a taxonomic group and allow their unequivocal identification. The mean number of species-specific profiles (Nsp) was 2.5 (from 1 to 4), while the mean number of species with shared profiles (N(species)sh) was 3.25 (varied from 2 to 4) (Table 1), i.e., almost all regions in this group had specific profile. If all profiles were specific, Nsp will be equal to the number of different profiles (N). If some profiles are shared, then N > Nsp. A profile can be shared between two or more species, therefore the number of species with shared profile can be higher than the number of species-shared profiles.
The frequency of species-specific profiles is 1.00, indicating that all species have a unique SPInDel profile. The mean frequency of species-specific profiles (fsp) was 0.83, ranging from 0.72 to 0.91 (Table 1). This result suggests that all cpDNA regions had almost unique combination of fragments lengths.
All species from the Secale genus have different profiles, and the average numbers of pairwise differences among hypervariable ranging from 0.44 (S. s. ssp. africanum; atpB-rbcL and S. c. ssp. afghanicum; trnT(UGU)-trnL(UAA)) to 4.17 (S. c. ssp. segetale; trnL(UAA) (Tables S2–S4). The discrimination of all species is possible with maximum four hypervariable regions (S. sylvestre atpB-rbcL; S. c. ssp. ancestrale, S. c. ssp. segetale, S. s. ssp. kuprijanovii trnL(UAA); S. s. ssp. anatolicum trnD-trnT) (Tables S2–S5). Most species have one hypervariable region: six species in 3 cpDNA regions and five in 1 (trnD-trnT) (Table S5), average from 1.77 in atpB-rbcL to 2.08 in trnD[tRNA-Asp(GUC)]-trnT[tRNA-Thr(GGU)] (Tables S2–S5).
If we consider species analysis, the mean number of species-specific profiles (Nsp) was 11.69 (from 4 to 16), and the mean number of species with shared profiles (N(species)sh) was 0 (Tables S2–S5), i.e., no species in this group had shared profile. All analyzed sequences were species specific, whether or not they represented a subspecies group, therefore the mean frequency of species-specific profiles (fsp) was 1.
The four non-coding cpDNA regions from 35 accessions were concatenated. The maximum frequency of species-specific profiles of the concentration (fsp = 0.35) was reached with the use of hypervariable regions trnT(UGU)-trnL5’exon (Figure 2A). The average number of pairwise differences for the concatenated regions was 7.73, a value close to the maximum that can be obtained with four hypervariable regions. A total of 455 pairwise comparisons yielded differences in the four hypervariable regions, while 384 cases (84%) had four differences. Only 116 cases were different by less than two hypervariable regions (Figure 2B). Figure 2C shows the ‘region by region’ analysis for the concatenated for cpDNA. The regions trnL(UAA) intron vs. trnD[tRNA-Asp(GUC)]-trnT [tRNA-Thr(GGU)] had the highest average pairwise differences, with p = 0.73.

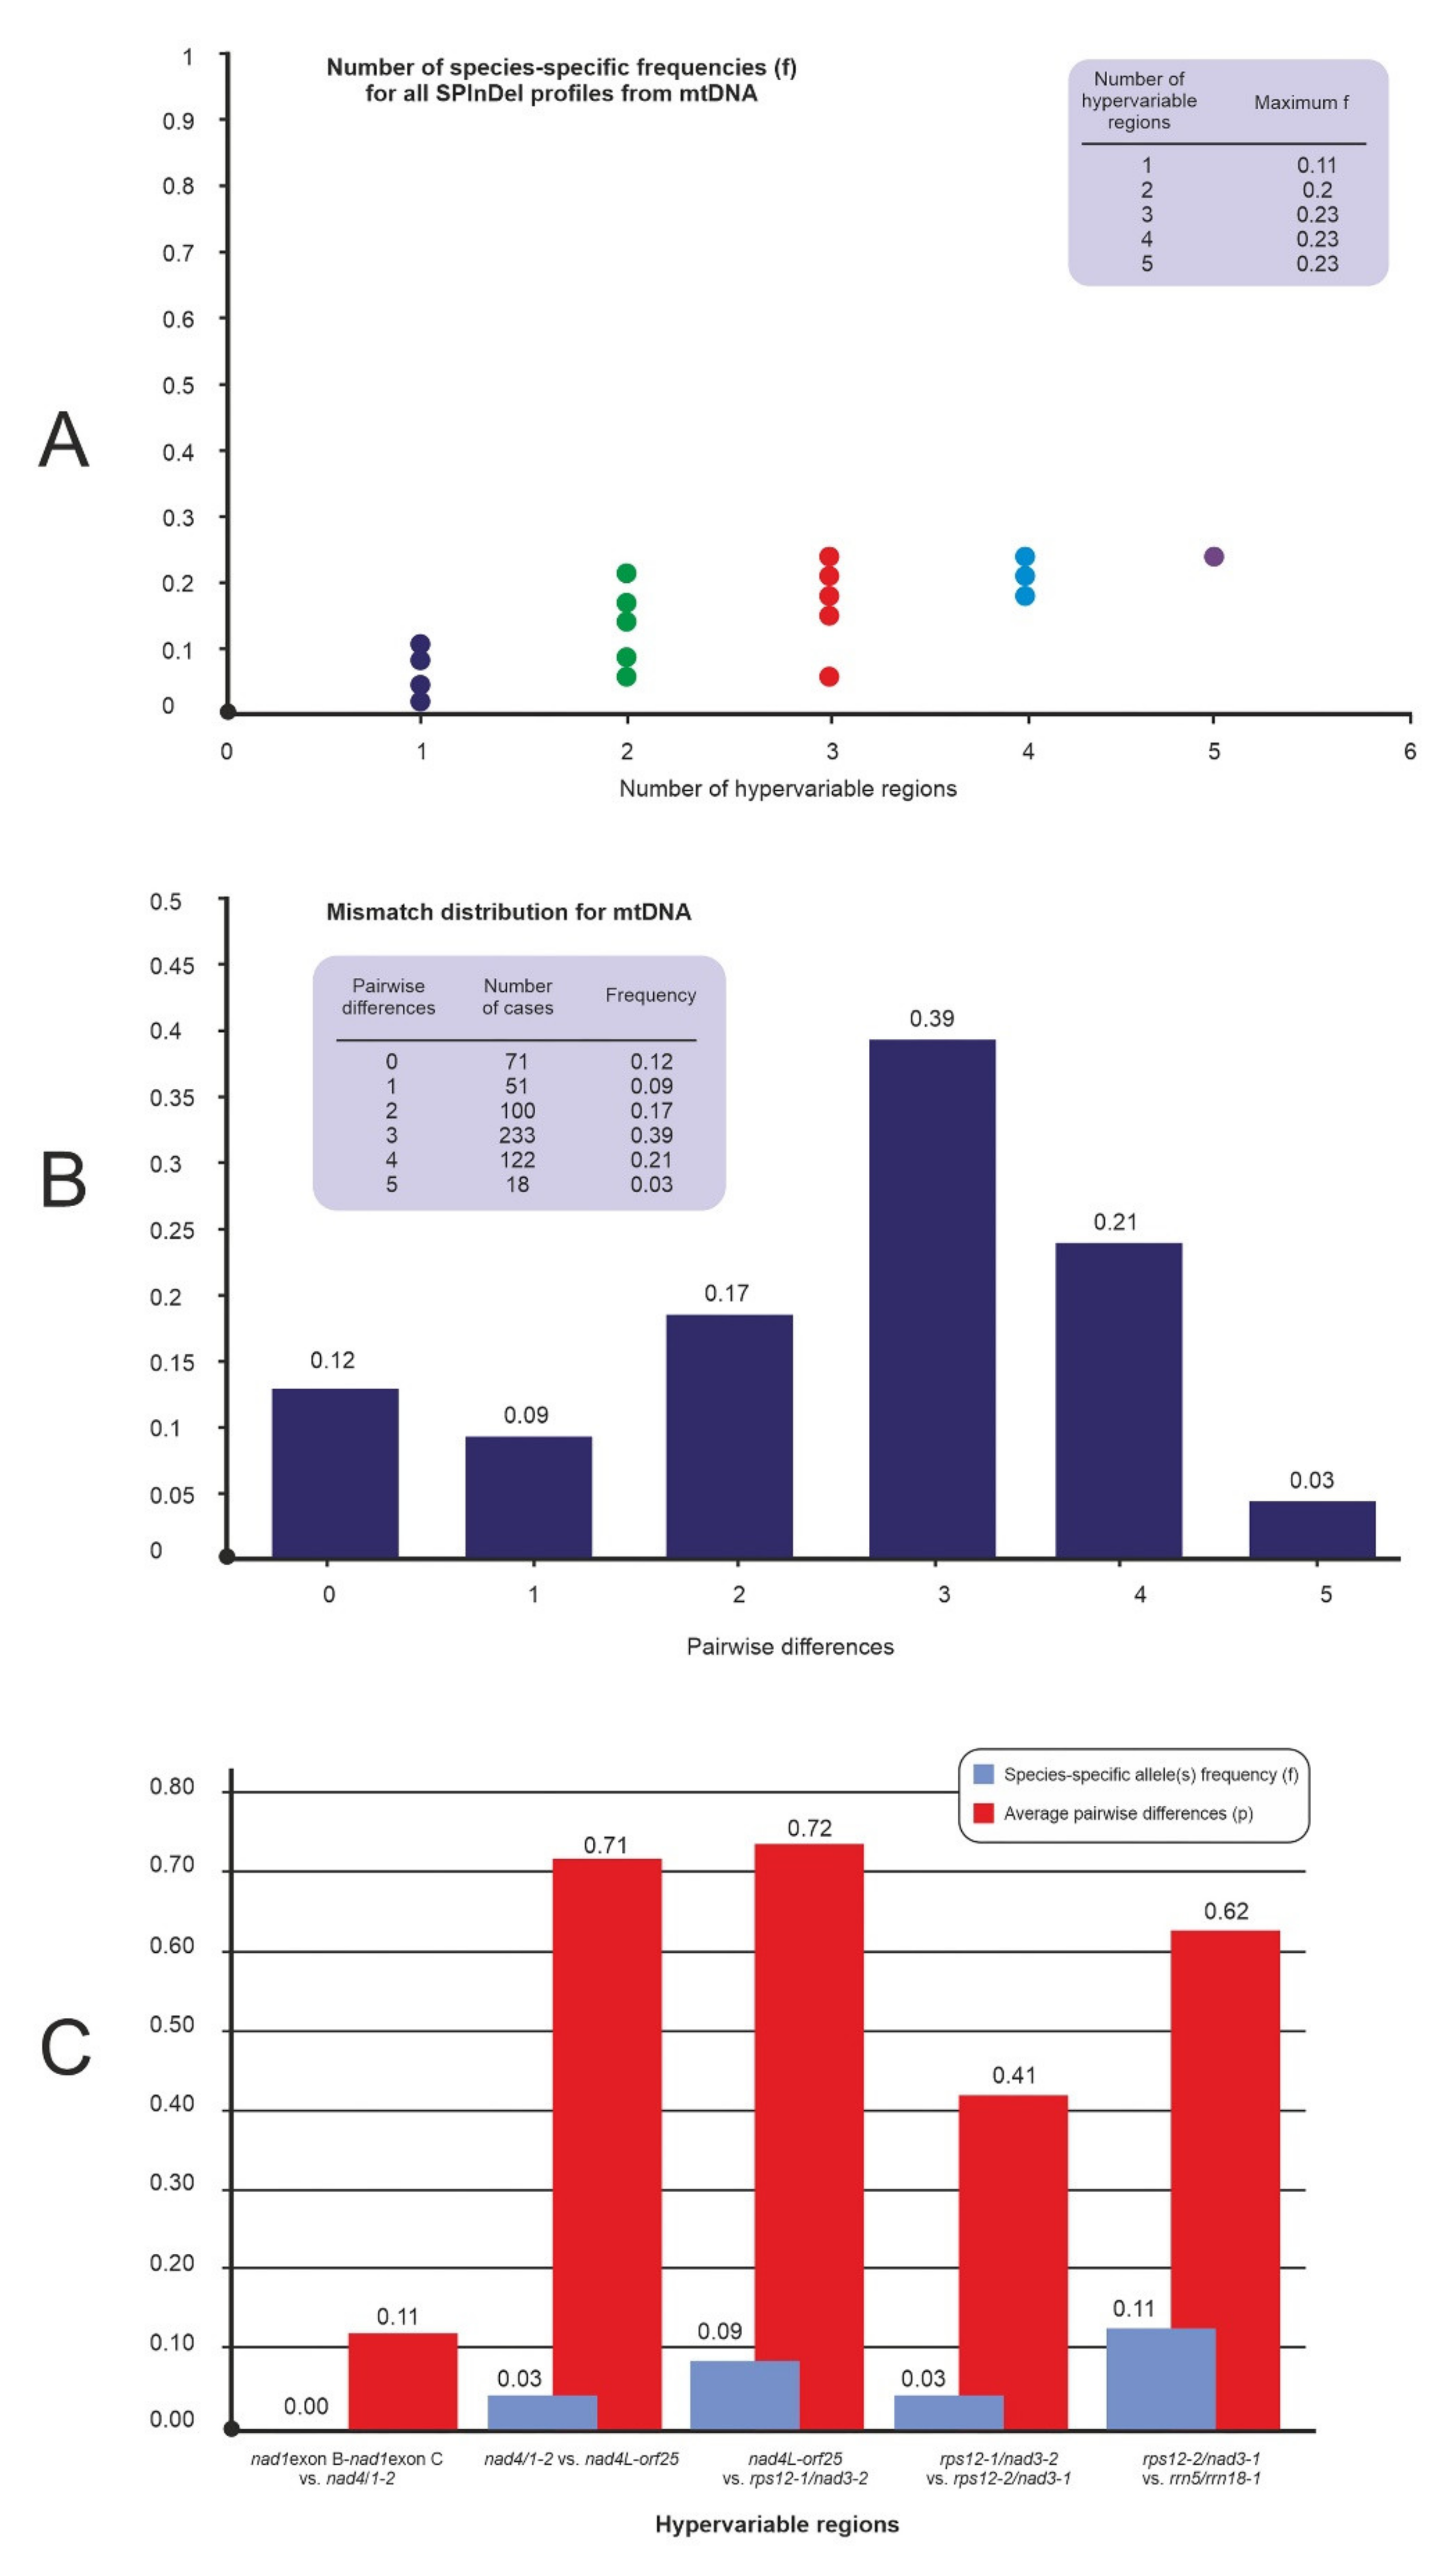
2.2. Analysis of Variable-Length mtDNA Sequences

A total of 4.171 bp from 210 sequences were analyzed. The species and characteristic of each target region is described in Table S1.
The mean number of species-specific profiles (Nsp) was 2.67 (from 1 to 7), while the mean number of species with shared profiles (N(species)sh) was 2.17 (varied from 1 to 4) (Table 1). The mean frequency of species-specific profiles (fsp) was 0.73, ranging from 0.45 to 0.89 (Table 1). i.e., almost all regions in this group had specific profile.
If we consider species analysis, the mean number of species-specific profiles (Nsp) was 17.54 (from 6 to 24), and the mean number of species with shared profiles (N(species)sh) was 0 (Tables S6–S11), i.e., no species in this group had shared profile. All analyzed sequences were species specific, whether or not they represented a subspecies group, therefore the mean frequency of species-specific profiles (fsp) was 1.
All species from the Secale genus have different profiles, and the average numbers of pairwise differences among hypervariable ranging from 0.42 (S. s. ssp. ciliatoglume; nad4/1-2) to 5.54 (S. c. ssp. ancestrale; rps12-2/nad3-1) (Tables S7 and S10).
The discrimination of all species is possible with maximum seven hypervariable regions (S. s. ssp. kuprijanovii, S. vavilovii; nad1exonB-nad1exonC) (Table S6).
Most species have more than one hypervariable region (about 74%), average from 2.62 in nad4/1-2 to 3.69 in nad1exonB-nad1exonC (Tables S5 and S6).
The six non-coding mtDNA regions from 35 accessions were concatenated. The maximum frequency of species-specific profiles of the concentration for mtDNA (fsp = 0.23) was reached with the use of hypervariable regions rps12-1/nad3-2, rps12-2/nad3-1 and rrn5/rrn18-1 (Figure 3A). The average number of pairwise differences for the concatenated regions was 6.61, a value close to the maximum that can be obtained with five hypervariable regions. A total of 595 pairwise comparisons yielded differences in the five hypervariable regions, while 455 cases (76%) had three differences. Only 122 cases were different by less than two hypervariable regions (Figure 3B). Figure 3C shows the ‘region by region’ analysis for the concatenated for mtDNA. The regions nad4L-orf25 vs. rps12-1/nad3-2 and nad4/1-2 vs. nad4L-orf25 had the highest average pairwise differences, with p equal, respectively, 0.72 and 0.71.

3. Discussion

The cpDNA and mtDNA regions are widely used as markers in phylogenetic and phylogeographic studies [46,47]. Additionally, for most species, including rye, the data is incomplete. So far, S. cereale chloroplast genome sequence has been published [48], while rye mtDNA has not been fully sequenced.
The cpDNA appears to have much more stable structure than the mitochondrial genome of plants in case of intramolecular rearrangement. The plastid genome substitution rate is 3–4 times higher than that of plant mtDNA [49]. In cpDNA noncoding regions most of the variability observed concerns insertion-deletion (indel) mutations. As stated by other authors, however, they should be treated with caution as they may indicate heteroplasmy [50]. Nevertheless, indels were analyzed in the following studies due to the fact that they were found to be common and often phylogenetically informative [51,52,53].
The cpDNA shows a much more stable structure in case of intramolecular rearrangement than the mitochondrial genome of plants. The rate of plastid genome substitution is 3–4 times higher than that of plant mtDNA [49]. Most of the variability observed in cpDNA noncoding regions concerns insertion-deletion (indel) mutations, but, as stated by other authors, they should be treated with caution as they may indicate heteroplasmy [50]. However, indels were analyzed in the following studies due to the fact that they were found to be common and often phylogenetically informative [51,52,53].
The multiple insertions and deletions (indels), which are present in the target genomic regions is generally regarded as a problem, as it introduces ambiguities in sequence alignments. However, in a few recent works a high level of species discrimination is attainable in all taxa of life by considering the length of hypervariable regions defined by indel variants has been shown [54]. Each species is tagged with a numeric profile of fragment lengths.
Indels are less prone to back and recurrent mutations, and thanks to that the probability of misclassifications is greatly reduced. Genomic regions with have multiple indels was used for species-identification procedures with high efficiency not only in plants chloroplast trnL(UAA) intron [55], but also in bacteria [56], fungi [57] and animals [58,59]. Unfortunately, there is no such information on the species of rye.
For indel detection several software tools are available [60,61]. In the present study a multifunctional computational workbench (named SPInDel for SPecies Identification by Insertions/Deletions) was used. The SPInDel approach relies on the analysis of multiple loci, which presents a clear advantage over methods targeting a single locus, therefore the occurrence of intraspecific or intraindividual variability in hypervariable regions does not pose serious problems [62,63,64]. A correct identification is still possible based on the information from the remaining loci even in cases where one (or more) SPInDel hypervariable region(s) have a different from the reference length.
In our previous studies the phylogenetic indels context were not analysed because algorithms describing substitution models are not able to model indel-type changes and they are removed by tree-creating programs. However, basic data on length and number of indels were obtained [38]. The number of identified indels in cpDNA was not very high compared to the results presented by other authors [65]. While the number of identified indels in mtDNA was comparable to the results of other authors in mtDNA of plants [66,67].
The occurrence of deletions and insertions as well as numerous nucleotide substitutions is a common phenomenon in the atpB-rbcL region. The majority of non-coding regions rich in these base pairs show a low number of functions [68]. SPinDel analysis of this regions showed the highest frequency of species-specific profiles (fsp = 0.91) (Table 1), which means that almost all species have a unique profile.
The region trnT(UGU)-trnL(UAA)5′exon shows a high frequency of insertions or deletions, depending on the species, which makes it possible to use them as genetic markers [38].
The mean fsp of the species analysed for this region (fsp = 0.83) was very close to the mean fsp for the atpB-rbcL region (Table 1).
One of analysed regions, the chloroplast trnL(UAA) intron, is known for its potential as species-specific marker due to low intra- and higher inter-specific genetic variation [32,55]. Our results show that trnL does not represent the most variable non-coding region of chloroplast DNA (Table 1).
We detected maximum diversity values in the intraspecific data sets for all target regions (Figure 2C). This is the first analysis performed using the SPInDel program, indicating the usefulness of the analyzed regions in Secale species.
Sequences from these cpDNA regions are often used in combination with other sequences in order to obtain additional data and a better resolution for phylogenetic studies [37,69,70,71,72]. Our results also showed that the regions trnL(UAA) intron vs. trnD[tRNA-Asp(GUC)]-trnT[tRNA-Thr(GGU)] had the highest average pairwise differences (Figure 2B). Moreover, the trnD[tRNA-Asp(GUC)]—trnT[tRNA-Thr(GGU)] region in our previous studies showed the greatest variability of rye species compared to the entire pool of analyzed cpDNA regions, which predisposed it to study closely related species.
Indels polymorphisms have a sufficiently rapid evolutionary rate of accumulation despite the low intra-specific diversity in cpDNA genes, that allows for discrimination between closely related taxa [73]. The frequency of species-specific SPInDel cpDNA profiles reached the maximal possible value (fsp = 1) in the intraspecific level (Tables S2–S5) and 0.91 for the atpB-rbcL region (Table 1). The real potential of the SPInDel concept was revealed by the concatenation of the cpDNA target regions (Figure 2, Table 1). The results of this study confirmed this, because they focus on the high variability of the studied regions of the chloroplast genome in the majority of taxa (Table 1). The trnT(UGU)-trnL(UAA)5′exon and trnD[tRNA-Asp(GUC)]-trnT[tRNA-Thr(GGU)] regions were used to the greatest extent for the analysis of closely related species species, which gave the best results in combination.These regions should be a useful tool as molecular markers for the study of closely related species, especially at the interspecies level of the genus Secale.
The mitochondrial genomes of plants are characterized by the presence of a relatively large number of group II introns compared to fungal and baterial mtDNA [74,75]. Group I introns, which are located in the coxI gene, are also contained in several plant genera, including Peperomia and Marchantia [76]. However, there is no correlation between phylogenesis and the presence of this intron, indicating that it was introduced by horizontal gene transfer. Fungal species were probably the donor.
In our previous study, a total of 45 indels in mtDNA have been identified [38]. It is comparable to the results of other authors in plant mtDNA. Rye mtDNA sequence data are not available. Only the winter wheat (Triticum aestivum cv. Chinese Yumai) mtDNA sequence was was published and was found to be very similar to the spring wheat sequence (T. aestivum cv. Chinese Spring) [77]. We determined 0 to 40 (in nad4/1-2) indels with sizes ranging from 1 bp to 5 bp in the rps12-nad3(2) and nad4/1-2 regions, respectively [38].
Mitochondrial nad1B-nad1C region, which is located in exon b and c [78], has highly conserved nature whithin this group of introns [38]. Nevertheless, the nad1 intron region may serve as a useful molecular marker in population studies. SPinDel analysis of this regions showed the highest frequency of species-specific profiles (fsp = 0.89) (Table 1), meaning that almost all species have a unique profile.
The region located within subunit 4 of the nad4 gene is considered to be a slowly evolving mitochondrial marker. Its evolution occurs 23 times slower than that of the ITS rDNA sequence [79]. Thus, it could be a useful insightful tool in deliberating on phylogenetic relationships. The research has shown that among all tested mtDNA sequences nad4/1-2 region proved to be the most informative [38]. Unfortunately, our analysis showed that frequency of insertions or deletions is not very high (fsp = 0.72) (Table 1).
Another analyzed intergenic region, nad4L-orf25 shows the lowest frequency of species-specific profiles (fsp = 0.45) among all analyzed regions, both mtDNA and cpDNA (Table 1). This confirms our earlier research [38] and the data on sugar beet [80].
Two different combinations of primers were used to amplify the intergenic sequences of the rps12-nad3 region: the first amplified only the intergenic region, the second–the intergenic region and the nad3 gene. These regions were described as variable regions, while the first region proved conserved in Secale species and subspecies [38]. Similarly, SPinDel analysis of this regions showed great differences between them: frequency of species-specific profiles was lower in the rps12-1/nad3-2 region than in the rps12-2/nad3-1 (fsp = 0.67and fsp = 81, respectively) (Table 1).
The mean fsp of the species analysed for this the rrn5-rrn18 region (fsp = 0.86) was very close to the mean fsp for the nad1B-nad1C region (Table 1). It was confirmed that sequences of this regions proved to be the most informative among all tested mtDNA sequences.
The frequency of species-specific SPInDel cpDNA profiles reached the maximal possible value (fsp = 1) in the intraspecific level (Tables S6–S11) and 0.91 for the atpB-rbcL region (Table 1).
The concatenated analysis showed slightly lower frequency of species-specific profiles of the concentration for mtDNA (fsp = 0.23), than for cpDNA (fsp = 0.35) (Figure 2A). The maximum frequency was reached with the use of 3 regions rps12-1/nad3-2, rps12-2/nad3-1 and rrn5/rrn18-1 (Figure 3A). The average number of pairwise differences for the concatenated regions was also lower compared to cpDNA (6.61 and 7.73, respectively). The concatenated mtDNA analysis of other values were also lower than in cpDNA (Figure 2B,C), despite the greater number of analyzed regions.

4. Materials and Methods

The plant material consisted of 35 accessions of the genus Secale, 13 cultivated and non-cultivated species and subspecies of rye. They were obtained from several world collections (Center for Biological Diversity Conservation in Powsin—Warsaw, Poland; United States Department of Agriculture—Agricultural Research Service in Beltsville, Maryland, USA; Nordic Genetic Resource Center in Alnarp, Sweden). The list of species, as well as the accession numbers for each sample, is given in Table S1.

4.1. DNA Extraction, PCR Amplification, and DNA Sequencing

For the amplification of the cpDNA 6 non-coding (intron) regions and mtDNA 6 non-coding (intron) regions, genomic DNA was isolated and amplified as described in previous study [38].
The sequences analysed in this paper have been deposited in the NCBI Genbank nucleotide sequence database with the accession numbers MH893827-MH894176 [38] (Table S1).

4.2. SPInDel Analyses

The analysis for cpDNA and mtDNA regions were performed independently. The sequence alignments of each family for the four different cpDNA regions (atpB-rbcL intergenic spacer, trnT(UGU)-trnL5′exon intergenic spacer, trnL(UAA) intron intergenic spacer and trnD[tRNA-Asp(GUC)]-trnT[tRNA-Thr(GGU)]) as well as six different mtDNA regions (nad1 exon B-nad1 exon C intron intergenic spacer, nad4/1-2 intergenic spacer, nad4L-orf25 intergenic spacer, rps12-1/nad3-2 intergenic spacer, rps12-2/nad3-1 intergenic spacer and rrn5/rrn18-1 intergenic spacer) were submitted to the SPInDel workbench in order to perform diverse calculations [81]. 35 species were selected for the assessment of intra-species diversity (Table S1). The alignments were analysed in the SPInDel workbench using the same conserved regions defined previously for the family of each species. The SPInDel concept is based on the combination of sequence lengths from different genomic regions. Therefore, in order to perform the diverse statistical analyses available on the SPInDel workbench, the alignments were concatenated of different cpDNA and mtDNA regions. The concatenated alignments were exported to the SPInDel workbench and analysed as previously described using the conserved regions defined for the individual regions. In these analyses, we have excluded the hypervariable regions defined by the peripheral conserved region of adjacent targets since they are not close to each other in the cpDNA and mtDNA. Therefore, the obtained profiles are only composed of the hypervariable regions inside each target region.

5. Conclusions

The results obtained in this study clearly indicated disproportions in the available information regarding various non-coding cpDNA and mtDNA regions used in phylogenetic studies, and some of them—due to high variability—can be successfully used in the analyses of closely related species.
The results indicate regions that may be useful molecular markers in studies on closely related species of the genus Secale. These include the non-coding regions of chloroplast DNA: atpB-rbcL and trnT (UGU)-trnL(UAA)5′exon and non-coding regions of mitochondrial DNA: nad1exonB-nad1exonC and rrn5/rrn18-1.
In general, our method was able to unambiguously discriminate closely related species in well-supported monophyletic clades.
In summary, the SPInDel approach can be used for the identification of Secale species, however the chloroplast genome is more informative. These results suggest that this method can be used for taxonomic classification of Secale species as long as appropriate conserved regions are selected.

Supplementary Materials

The following are available online at https://www.mdpi.com/1422-0067/21/24/9421/s1. Table S1, The list of species, along with the accession numbers for each sample. Table S2, General description of standard SPInDel profiles from the atpB-rbcL cpDNA region. Table S3, General description of standard SPInDel profiles from the trnT(UGU)-trnL(UAA)5′exon cpDNA region. Table S4, General description of standard SPInDel profiles from the trnL(UAA) intron cpDNA region. Table S5, General description of standard SPInDel profiles from the trnD[tRNA-Asp(GUC)]-trnT[tRNA-Thr(GGU)] cpDNA region. Table S6, General description of standard SPInDel profiles from the nad1exon B-nad1exon C intron mtDNA region. Table S7, General description of standard SPInDel profiles from the nad4/1-2 mtDNA region. Table S8, General description of standard SPInDel profiles from the nad4L-orf25 mtDNA region. Table S9, General description of standard SPInDel profiles from the rps12-1/nad3-2 mtDNA region. Table S10, General description of standard SPInDel profiles from the rps12-2/nad3-1 mtDNA region. Table S11, General description of standard SPInDel profiles from the rrn5/rrn18-1 mtDNA region.

Author Contributions

Conceptualization, L.S.; performing the experiments, E.F. and I.S.; data analysis, J.B.; software, J.B.; writing—original draft preparation, L.S.; writing—review and editing, L.S. and E.F.; visualization, J.B. All authors have read and agreed to the published version of the manuscript.

Funding

This research received no external funding.

Conflicts of Interest

The authors declare no conflict of interest.

References

  1. Alptekin, B.; Langridge, P.; Budak, H. Abiotic stress miRNomes in the Triticeae. Funct. Integr. Genom. 2017, 17, 145–170. [Google Scholar] [CrossRef] [Green Version]
  2. Madej, L.J. Worldwide trends in rye growing and breeding. Vortraege Fuer Pflanz. 1996, 35, 1–6. [Google Scholar]
  3. Mago, R.; Spielmeyer, W.; Lawrence, G.; Lagudah, E.; Ellis, J.; Pryor, A. Identification and mapping of molecular markers linked to rust resistance genes located on chromosome 1RS of rye using wheat-rye translocation lines. Theor. Appl. Genet. 2002, 104, 1317–1324. [Google Scholar] [CrossRef]
  4. Hurni, S.; Brunner, S.; Buchmann, G.; Herren, G.; Jordan, T.; Krukowski, P.; Wicker, T.; Yahiaoui, N.; Mago, R.; Keller, B. Rye Pm8 and wheat Pm3 are orthologous genes and show evolutionary conservation of resistance function against powdery mildew. Plant J. 2013, 76, 957–969. [Google Scholar] [CrossRef]
  5. Broda, Z.; Tomkowiak, A.; Mikolajczyk, S.; Weigt, D.; Górski, F.; Kurasiak-Popowska, D. The genetic polymorphism between the wild species and cultivars of rye Secale cereale L. Acta Agrobot. 2016, 69. [Google Scholar] [CrossRef] [Green Version]
  6. Schlegel, R. Rye (Secale cereale L)—A younger crop plant with bright future. In Genetic Resources, Chromosome Engineering, and Crop Improvement: Vol II Cereals; Sing, R.J., Jauhar, P., Eds.; CRC Press: Boca Raton, FL, USA, 2006; pp. 365–394. [Google Scholar]
  7. Bartoš, J.; Paux, E.; Kofler, R.; Havránková, M.; Kopecký, D.; Suchánková, P.; Šafář, J.; Šimková, H.; Town, C.D.; Lelley, T.; et al. A first survey of the rye (Secale cereale) genome composition through BAC end sequencing of the short arm of chromosome 1R. BMC Plant Biol. 2008, 8, 95. [Google Scholar] [CrossRef]
  8. Flavell, R.B.; Bennett, M.D.; Smith, J.B.; Smith, D.B. Genome size and the proportion of repeated nucleotide sequence DNA in plants. Biochem. Genet. 1974, 12, 257–269. [Google Scholar] [CrossRef]
  9. Roshevitz, R.Y. A monograph of the wild, weedy and cultivated species of rye. Acta Inst. Bot. Nomine Acad. Sci. USSR Ser. 1947, 1, 105–163. [Google Scholar]
  10. Delipavlov, D. Secale rhodopaeum Delipavlov—A new species of rye from the Rhodope Mountains. Dokl. Bolg. Akad. Nauk 1962, 15, 407–411. [Google Scholar]
  11. Frederiksen, S.; Petersen, G. Morphometrical analyses of Secale (Triticeae, Poaceae). Nord. J. Bot. 1997, 17, 185–198. [Google Scholar] [CrossRef]
  12. Frederiksen, S.; Petersen, G. A taxonomic revision of Secale (Triticeae, Poaceae). Nord. J. Bot. 1998, 18, 399–420. [Google Scholar] [CrossRef]
  13. GRIN National Plant Germplasm System ARS. Germplasm Resources Information Network (GRIN-Taxonomy); National Germplasm Resources Laboratory: Beltsville, MD, USA, 2019. Available online: http://npgsweb.ars-grin.gov/gringlobal/taxon/taxonomysearchcwr.aspx (accessed on 8 December 2020).
  14. Shang, H.-Y.; Wei, Y.-M.; Long, H.; Yan, Z.-H.; Zheng, Y.-L. Identification of LMW Glutenin-Like Genes from Secale sylvestre Host. Russ. J. Genet. 2005, 41, 1372–1380. [Google Scholar] [CrossRef]
  15. Hammer, K.; Skolimowska, E.; Knüpffer, H. Vorarbeiten zur monographischen Darstellung von Wildpflanzensortimenten: Secale L. Die Kult. 1987, 35, 135–177. [Google Scholar] [CrossRef]
  16. Singh, R.J.; Röbbelen, G. Identification by Giemsa technique of the translocations separating cultivated rye from three wild species of Secale. Chromosoma 1977, 59, 217–225. [Google Scholar] [CrossRef]
  17. Bennett, M.D.; Gustafson, J.P.; Smith, J.B. Variation in nuclear DNA in the genus Secale. Chromosoma 1977, 61, 149–176. [Google Scholar] [CrossRef]
  18. Murai, K.; Naiyu, X.T.K. Studies on the origin of crop species by restriction endonuclease analysis of organellar DNA. III. Chloroplast DNA variation and interspecific relationships in the genus Secale. Jpn. J. Genet. 1989, 64, 36–47. [Google Scholar] [CrossRef] [Green Version]
  19. Petersen, G.; Doebley, J.F. Chloroplast DNA variation in the genus Secale (Poaceae). Plant Syst. Evol. 1993, 187, 115–125. [Google Scholar] [CrossRef]
  20. Cuadrado, A.; Jouve, N. Evolutionary Trends of Different Repetitive DNA Sequences during Speciation in the Genus Secale. J. Hered. 2002, 93, 339–345. [Google Scholar] [CrossRef] [Green Version]
  21. Zhou, J.; Yang, Z.; Li, G.; Liu, C.; Tang, Z.; Zhang, Y.; Ren, Z. Diversified chromosomal distribution of tandemly repeated sequences revealed evolutionary trends in Secale (Poaceae). Plant Syst. Evol. 2010, 287, 49–56. [Google Scholar] [CrossRef]
  22. Chikmawati, T.; Skovmand, B.; Gustafson, J.P. Phylogenetic relationships among Secale species revealed by amplified fragment length polymorphisms. Genome 2005, 48, 792–801. [Google Scholar] [CrossRef] [Green Version]
  23. Fowler, D.B.; Limin, A.E. Exploitable genetic variability for cold tolerance in commercially grown cereals. Can. J. Plant Sci. 1987, 67, 278. [Google Scholar]
  24. Cuadrado, A.; Schwarzacher, T. The chromosomal organization of simple sequence repeats in wheat and rye genomes. Chromosoma 1998, 107, 587–594. [Google Scholar] [CrossRef]
  25. Maraci, Ö.; Özkan, H.; Bilgin, R. Phylogeny and genetic structure in the genus Secale. PLoS ONE 2018, 13, e0200825. Available online: https://pubmed.ncbi.nlm.nih.gov/30024916 (accessed on 8 December 2020). [CrossRef]
  26. Hagenblad, J.; Oliveira, H.R.; Forsberg, N.E.G.; Leino, M.W. Geographical distribution of genetic diversity in Secale landrace and wild accessions. BMC Plant Biol. 2016, 16, 23. [Google Scholar] [CrossRef] [Green Version]
  27. Santos, E.; Matos, M.; Silva, P.; Figueiras Am Benito, C.; Pinto-Carnide, O. Molecular diversity and genetic relationships in Secale. J. Genet. 2016, 95, 273–281. [Google Scholar] [CrossRef] [Green Version]
  28. Al-Beyroutiová, M.; Sabo, M.; Sleziak, P.; Dušinský, R.; Birčák, E.; Hauptvogel, P.; Kilian, A.; Švec, M. Evolutionary relationships in the genus Secale revealed by DArTseq DNA polymorphism. Plant Syst. Evol. 2016, 302, 1083–1091. [Google Scholar] [CrossRef]
  29. Jones, J.D.G.; Flavell, R.B. The structure, amount and chromosomal localisation of defined repeated DNA sequences in species of the genus Secale. Chromosoma 1982, 86, 613–641. [Google Scholar] [CrossRef]
  30. Doebley, J.; von Bothmer, R.; Larson, S. Chloroplast DNA Variation and the Phylogeny of Hordeum (Poaceae). Am. J. Bot. 1992, 79, 576–584. [Google Scholar] [CrossRef]
  31. Fuchs, J.; Kühne, M.; Schubert, I. Assignment of linkage groups to pea chromosomes after karyotyping and gene mapping by fluorescent in situ hybridization. Chromosoma 1998, 107, 272–276. [Google Scholar] [CrossRef]
  32. Cuadrado, A.; Jouve, N. Distribution of highly repeated DNA sequences in species of the genus Secale. Genome 1997, 40, 309–317. [Google Scholar] [CrossRef]
  33. Sidhu, J.S.; Ramakrishnan, S.M.; Ali, S.; Bernardo, A.; Bai, G.; Abdullah, S.; Girma Ayana, G.; Sehgal, S.K. Assessing the genetic diversity and characterizing genomic regions conferring Tan Spot resistance in cultivated rye. PLoS ONE 2019, 14, e0214519. [Google Scholar] [CrossRef] [PubMed]
  34. Tarkowski, C. Biologia Żyta; PWN: Warsaw, Poland, 1983. [Google Scholar]
  35. Palmer, J.D.; Jansen, R.K.; Michaels, H.J.; Chase, M.W.; Manhart, J.R. Chloroplast DNA Variation and Plant Phylogeny. Ann. Missouri. Bot. Gard. 1988, 75, 1180–1206. Available online: http://www.jstor.org/stable/2399279 (accessed on 8 December 2020). [CrossRef]
  36. Clegg, M.T.; Gaut, B.S.; Learn, G.H.; Morton, B.R. Rates and patterns of chloroplast DNA evolution. Proc. Natl. Acad. Sci. USA 1994, 91, 6795–6801. Available online: http://www.pnas.org/content/91/15/6795.abstract (accessed on 8 December 2020). [CrossRef] [PubMed] [Green Version]
  37. Wang, X.-R.; Tsumura, Y.; Yoshimaru, H.; Nagasaka, K.; Szmidt, A.E. Phylogenetic relationships of Eurasian pines (Pinus, Pinaceae) based on chloroplast rbcL, matk, rpl20-rps18 spacer, and trnv intron sequences. Am. J. Bot. 1999, 86, 1742–1753. [Google Scholar] [CrossRef] [PubMed]
  38. Skuza, L.; Szućko, I.; Filip, E.; Strzała, T. Genetic diversity and relationship between cultivated, weedy and wild rye species as revealed by chloroplast and mitochondrial DNA non-coding regions analysis. PLoS ONE 2019, 14, e0213023. [Google Scholar] [CrossRef] [PubMed]
  39. Chase, M.W.; Fay, M.F. Barcoding of Plants and Fungi. Science 2009, 325, 682–683. Available online: http://science.sciencemag.org/content/325/5941/682.abstract (accessed on 8 December 2020). [CrossRef] [PubMed]
  40. Ford, C.S.; Ayres, K.L.; Toomey, N.; Haider, N.; Van Alphen Stahl, J.; Kelly, L.J.; Wikström, N.; Hollingsworth, P.M.; Duff, R.J.; Hoot, S.B.; et al. Selection of candidate coding DNA barcoding regions for use on land plants. Bot. J. Linn. Soc. 2009, 159, 1–11. [Google Scholar] [CrossRef] [Green Version]
  41. Hollingsworth, P.M.; Graham, S.W.; Little, D.P. Choosing and using a plant DNA barcode. PLoS ONE 2011, 6, e19254. Available online: https://pubmed.ncbi.nlm.nih.gov/21637336 (accessed on 26 May 2011). [CrossRef]
  42. Suo, Z.; Zhang, C.; Zheng, Y.; He, L.; Jin, X.; Hou, B.; Li, J. Revealing genetic diversity of tree peonies at micro-evolution level with hyper-variable chloroplast markers and floral traits. Plant Cell Rep. 2012, 31, 2199–2213. [Google Scholar] [CrossRef]
  43. Dong, W.; Xu, C.; Li, D.; Jin, X.; Li, R.; Lu, Q.; Suo, Z. Comparative analysis of the complete chloroplast genome sequences in psammophytic Haloxylon species (Amaranthaceae). PeerJ 2016, 4, e2699. [Google Scholar] [CrossRef] [Green Version]
  44. Wang, M.; Xie, X.; Yan, B.; Yan, X.; Luo, J.; Liu, Y.; Qiu, Q. The completed chloroplast genome of Ostrya trichocarpa. Conserv. Genet. Resour. 2018, 10, 579–581. [Google Scholar] [CrossRef]
  45. Xu, C.; Dong, W.; Li, W.; Lu, Y.; Xie, X.; Jin, X.; Shi, J.; He, K.; Suo, Z. Comparative analysis of six Lagerstroemia complete chloroplast genomes. Front. Plant Sci. 2017, 8, 15. [Google Scholar] [CrossRef] [PubMed] [Green Version]
  46. Scarcelli, N.; Barnaud, A.; Eiserhardt, W.; Treier, U.A.; Seveno, M.; d’Anfray, A.; Vigouroux, Y.; Pintaud, J.-C. A Set of 100 Chloroplast DNA Primer Pairs to Study Population Genetics and Phylogeny in Monocotyledons. PLoS ONE 2011, 6, e19954. Available online: https://pubmed.ncbi.nlm.nih.gov/21637837 (accessed on 26 May 2011). [CrossRef] [PubMed] [Green Version]
  47. Patwardhan, A.; Ray, S.; Roy, A. Molecular markers in phylogenetic studies-a review. J. Phylogenetics Evol. Biol. 2014. [Google Scholar] [CrossRef]
  48. Middleton, C.P.; Senerchia, N.; Stein, N.; Akhunov, E.D.; Keller, B.; Wicker, T. Sequencing of chloroplast genomes from wheat, barley, rye and their relatives provides a detailed insight into the evolution of the Triticeae tribe. PLoS ONE 2014, 9, e85761. [Google Scholar] [CrossRef] [Green Version]
  49. Avise, J.C. Phylogeography: Retrospect and prospect. J. Biogeogr. 2009, 36, 3–15. [Google Scholar] [CrossRef] [Green Version]
  50. Yamane, K.; Kawahara, T. Intra- and interspecific phylogenetic relationships among diploid Triticum-Aegilops species (Poaceae) based on base-pair substitutions, indels, and microsatellites in chloroplast noncoding sequences. Am. J. Bot. 2005, 92, 1887–1898. [Google Scholar] [CrossRef]
  51. Gielly, L.; Taberlet, P. The use of chloroplast DNA to resolve plant phylogenies: Noncoding versus rbcL sequences. Mol. Biol. Evol. 1994, 11, 769–777. [Google Scholar] [CrossRef]
  52. Golenberg, E.M.; Clegg, M.T.; Durbin, M.L.; Doebley, J.; Ma, D.P. Evolution of a Noncoding Region of the Chloroplast Genome. Mol. Phylogenetics Evol. 1993, 2, 52–64. Available online: http://www.sciencedirect.com/science/article/pii/S1055790383710067 (accessed on 8 December 2020). [CrossRef]
  53. Morton, B.R.; Clegg, M.T. A chloroplast DNA mutational hotspot and gene conversion in a noncoding region near rbcL in the grass family (Poaceae). Curr. Genet. 1993, 24, 357–365. [Google Scholar] [CrossRef]
  54. Schilbert, H.M.; Rempel, A.; Pucker, B. Comparison of read mapping and variant calling tools for the analysis of plant NGS data. Plants 2020, 9, 439. [Google Scholar] [CrossRef] [PubMed] [Green Version]
  55. Taberlet, P.; Coissac, E.; Pompanon, F.; Gielly, L.; Miquel, C.; Valentini, A.; Vermat, T.; Corthier, G.; Brochmann, C.; Willerslev, E. Power and limitations of the chloroplast trnL (UAA) intron for plant DNA barcoding. Nucleic Acids Res. 2007, 35, e14. [Google Scholar] [CrossRef] [PubMed] [Green Version]
  56. Sogin, M.L.; Morrison, H.G.; Huber, J.A.; Welch, D.M.; Huse, S.M.; Neal, P.R.; Arrieta, J.M.; Herndl, G.J. Microbial Diversity in the Deep Sea and the Underexplored “Rare Biosphere”. Proc. Natl. Acad. Sci. USA 2006, 103, 12115–12120. Available online: http://www.pnas.org/content/103/32/12115.abstract (accessed on 8 December 2020). [CrossRef] [PubMed] [Green Version]
  57. Zinger, L.; Gury, J.; Alibeu, O.; Rioux, D.; Gielly, L.; Sage, L.; Pompanon, F.; Geremia, R.A. CE-SSCP and CE-FLA, Simple and High-Throughput Alternatives for Fungal Diversity Studies. J. Microbiol. Methods 2008, 72, 42–53. Available online: http://www.sciencedirect.com/science/article/pii/S0167701207003478 (accessed on 8 December 2020). [CrossRef] [PubMed]
  58. Steinke, D.; Vences, M.; Salzburger, W.; Meyer, A. TaxI: A software tool for DNA barcoding using distance methods. Philos. Trans. R. Soc. B Biol. Sci. 2005, 360, 1975–1980. [Google Scholar] [CrossRef] [PubMed] [Green Version]
  59. Vences, M.; Thomas, M.; van der Meijden, A.; Chiari, Y.; Vieites, D.R. Comparative performance of the 16S rRNA gene in DNA barcoding of amphibians. Front. Zool. 2005, 2, 5. [Google Scholar] [CrossRef] [Green Version]
  60. Young, N.D.; Healy, J. GapCoder automates the use of indel characters in phylogenetic analysis. BMC Bioinform. 2003, 4, 6. [Google Scholar] [CrossRef] [Green Version]
  61. Neuman, J.A.; Isakov, O.; Shomron, N. Analysis of insertion–deletion from deep-sequencing data: Software evaluation for optimal detection. Brief. Bioinform. 2013, 14, 46–55. [Google Scholar] [CrossRef]
  62. Hsieh, H.-M.; Chiang, H.-L.; Tsai, L.-C.; Lai, S.-Y.; Huang, N.-E.; Linacre, A.; Lee, J.C.-I. Cytochrome b Gene for Species Identification of the Conservation Animals. Forensic. Sci. Int. 2001, 122, 7–18. Available online: http://www.sciencedirect.com/science/article/pii/S0379073801004030 (accessed on 8 December 2020). [CrossRef]
  63. Parson, W.; Pegoraro, K.; Niederstätter, H.; Föger, M.; Steinlechner, M. Species identification by means of the cytochrome b gene. Int. J. Legal. Med. 2000, 114, 23–28. [Google Scholar] [CrossRef]
  64. Hebert, P.D.N.; Cywinska, A.; Ball, S.L.; deWaard, J.R. Biological identifications through DNA barcodes. Proc. R. Soc. London Ser. B Biol. Sci. 2003, 270, 313–321. [Google Scholar] [CrossRef] [PubMed] [Green Version]
  65. Shaw, J.; Lickey, E.B.; Schilling, E.E.; Small, R.L. Comparison of whole chloroplast genome sequences to choose noncoding regions for phylogenetic studies in angiosperms: The tortoise and the hare III. Am. J. Bot. 2007, 94, 275–288. [Google Scholar] [CrossRef] [PubMed] [Green Version]
  66. Christensen, A.C. Plant Mitochondrial Genome Evolution Can Be Explained by DNA Repair Mechanisms. Genome Biol. Evol. 2013, 5, 1079–1086. [Google Scholar] [CrossRef] [PubMed]
  67. Ossowski, S.; Schneeberger, K.; Lucas-Lledó, J.I.; Warthmann, N.; Clark, R.M.; Shaw, R.G.; Detlef Weigel, D.; Lynch, M. The Rate and Molecular Spectrum of Spontaneous Mutations in Arabidopsis thaliana. Science 2010, 327, 92–94. Available online: http://science.sciencemag.org/content/327/5961/92.abstract (accessed on 8 December 2020). [CrossRef] [Green Version]
  68. Li, W. Molecular Evolution; Sinauer Associates, Inc.: Sunderland, MA, USA, 1997. [Google Scholar]
  69. Sang, T.; Crawford, D.J.; Stuessy, T.F. Chloroplast DNA Phylogeny, Reticulate Evolution, and Biogeography of Paeonia (Paeoniaceae). Am. J. Bot. 1997, 84, 1120–1136. [Google Scholar] [CrossRef] [Green Version]
  70. Hardig, T.M.; Soltis, P.S.; Soltis, D.E. Diversification of the North American shrub genus Ceanothus (Rhamnaceae): Conflicting phylogenies from nuclear ribosomal DNA and chloroplast DNA. Am. J. Bot. 2000, 87, 108–123. [Google Scholar] [CrossRef]
  71. Schönenberger, J.; Conti, E. Molecular phylogeny and floral evolution of Penaeaceae, Oliniaceae, Rhynchocalycaceae, and Alzateaceae (Myrtales). Am. J. Bot. 2003, 90, 293–309. [Google Scholar] [CrossRef]
  72. Yamane, K.; Yasui, Y.; Ohnishi, O. Intraspecific cpDNA variations of diploid and tetraploid perennial buckwheat, Fagopyrum cymosum (Polygonaceae). Am. J. Bot. 2003, 90, 339–346. [Google Scholar] [CrossRef]
  73. Pereira, F.; Carneiro, J.; Matthiesen, R.; van Asch, B.; Pinto, N.; Gusmão, L.; Amori, A. Identification of species by multiplex analysis of variable-length sequences. Nucleic Acids Res. 2010, 38, e203. [Google Scholar] [CrossRef] [Green Version]
  74. Bonen, L.; Vogel, J. The Ins and Outs of Group II Introns. Trends Genet. 2001, 17, 322–331. Available online: http://www.sciencedirect.com/science/article/pii/S0168952501023241 (accessed on 8 December 2020). [CrossRef]
  75. Lambowitz, A.M.; Zimmerly, S. Mobile Group II Introns. Annu. Rev. Genet. 2004, 38, 1–35. [Google Scholar] [CrossRef] [PubMed] [Green Version]
  76. Cho, Y.; Qiu, Y.-L.; Kuhlman, P.; Palmer, J.D. Explosive invasion of plant mitochondria by a group I intron. Proc. Natl. Acad. Sci. USA 1998, 95, 14244–14249. Available online: http://www.pnas.org/content/95/24/14244.abstract (accessed on 8 December 2020). [CrossRef] [PubMed] [Green Version]
  77. Cui, P.; Liu, H.; Lin, Q.; Ding, F.; Zhuo, G.; Hu, S.; Liu, D.; Yang, W.; Zhan, K.; Zhang, A.; et al. A Complete Mitochondrial Genome of Wheat (Triticum aestivum cv. Chinese Yumai), and Fast Evolving Mitochondrial Genes in Higher Plants. J. Genet. 2009, 88, 299–307. [Google Scholar] [CrossRef] [PubMed]
  78. Demesure, B.; Sodzi, N.; Petit, R.J. A set of universal primers for amplification of polymorphic non-coding regions of mitochondrial and chloroplast DNA in plants. Mol. Ecol. 1995, 4, 129–134. [Google Scholar] [CrossRef] [PubMed]
  79. Yang, Y.-W.; Lai, K.-N.; Tai, P.-Y.; Li, W.-H. Rates of Nucleotide Substitution in Angiosperm Mitochondrial DNA Sequences and Dates of Divergence between Brassica and Other Angiosperm Lineages. J. Mol. Evol. 1999, 48, 597–604. [Google Scholar] [CrossRef]
  80. Kubo, T.; Yamamoto, M.P.; Mikami, T. The nad4L-orf25 gene cluster is conserved and expressed in sugar beet mitochondria. Theor. Appl. Genet. 2000, 100, 214–220. [Google Scholar] [CrossRef]
  81. Carneiro, J.; Pereira, F.; Amorim, A. SPInDel: A multifunctional workbench for species identification using insertion/deletion variants. Mol. Ecol. Resour. 2012, 12, 1190–1195. [Google Scholar] [CrossRef]
Figure 1. Schematic illustration presenting the strategy used in the species identification by the insertions/deletions method (SPInDel). Illustration shows the sequence alignment for four hypothetical species (1 to 4). Three hypervariable domains (dotted lines) are defined by four conserved regions (blue). The compartent of the alignment is developed to indicate the presence of a large number of gaps in hypervariable regions. Subsequent species are identified using the numerical profile caused by the combination of lengths in the hypervariable regions (blue numeric codes).
Ijms 21 09421 g001
Figure 2. SPInDel analysis of 4 cpDNA variable-length sequences; (A) The frequency of species-specific profiles in all combinations of hypervariable cpDNA regions; (B) Mismatch distribution, i.e., the frequency distribution of the number of SPInDel hypervariable cpDNA regions that differ between all pairs of SPInDel profiles in a taxonomic group; (C) The discriminatory potential of each hypervariable cpDNA region individually (region by region analyses).
Ijms 21 09421 g002
Figure 3. SPInDel analysis of 6 mtDNA noncoding regions; (A) The frequency of species-specific profiles in all combinations of hypervariable mtDNA regions; (B) Mismatch distribution, i.e., the frequency distribution of the number of SPInDel hypervariable mtDNA regions that differ between all pairs of SPInDel profiles in a taxonomic group; (C) The discriminatory potential of each hypervariable mtDNA region individually (region by region analyses).
Ijms 21 09421 g003
Table 1. Main SPInDel analyses performed for each cpDNA and mtDNA target region for 35 accessions of 13 Secale species.
Genomic
Region
Number of Conserved RegionsNumber of Hypervariable Regions (n)Average Number of Pairwise Differences (pGn)Average Number of Pairwise Differences Per Hypervariable RegionNumber of Species-Specific Profiles (Nsp)Frequency of Species-Specific Profiles (fsp)Number of Species-Shared ProfilesNumber of Minimum Hypervariable Regions for Discrimination of All Species
cpDNA
atpB-rbcL intergenic spacer621.020.9110.9144
trnT(UGU)-trnL(UAA)5′exon intergenic spacer520.970.6220.8344
trnL(UAA) intron intergenic spacer420.510.4140.8721
trnD[tRNA-Asp(GUC)]-trnT[tRNA-Thr(GGU)] intergenic spacer410.070.0230.7232
mtDNA
nad1exon B-nad1exon C intron intergenic spacer410.060.0120.8922
nad4/1-2 intergenic spacer420.270.2310.7222
nad4L-orf25 intergenic spacer521.230.9970.4543
rps12-1/nad3-2 intergenic spacer410.070.0520.6721
rps12-2/nad3-1 intergenic spacer310.010.0110.8111
rrn5/rrn18-1 intergenic spacer520.730.2330.8622
cpDNA—chloroplast DNA; mtDNA—mitochondrial DNA.
Publisher’s Note: MDPI stays neutral with regard to jurisdictional claims in published maps and institutional affiliations.

