Article

Analysis of miR-9-5p, miR-124-3p, miR-21-5p, miR-138-5p, and miR-1-3p in Glioblastoma Cell Lines and Extracellular Vesicles

1
Medical Centre for Molecular Biology, Institute of Biochemistry, Faculty of Medicine, University of Ljubljana, 1000 Ljubljana, Slovenia
2
Jožef Stefan International Postgraduate School, 1000 Ljubljana, Slovenia
3
Institute of Cell Biology, Faculty of Medicine, University of Ljubljana, 1000 Ljubljana, Slovenia
4
Institute of Pathology, Faculty of Medicine, University of Ljubljana, 1000 Ljubljana, Slovenia
5
Shemyakin-Ovchinnikov Institute of Bioorganic Chemistry, Russian Academy of Sciences, Moscow 117997, Russia
6
Oncobox ltd., Moscow 121205, Russia
7
Laboratory of Clinical and Genomic Bioinformatics, I. M. Sechenov First Moscow State Medical University, Moscow 119146, Russia
8
Moscow Institute of Physics and Technology (National Research University), Moscow region 141700, Russia
9
OmicsWay Corp., Walnut, CA 91789, USA
*
Authors to whom correspondence should be addressed.
These authors share lead authorship.
Int. J. Mol. Sci. 2020, 21(22), 8491; https://doi.org/10.3390/ijms21228491
Submission received: 31 May 2020 / Revised: 1 November 2020 / Accepted: 6 November 2020 / Published: 11 November 2020
(This article belongs to the Special Issue The Plentiful Roles of RNA in Glioblastoma)

Abstract

:
Glioblastoma (GBM), the most common primary brain tumor, is a complex and extremely aggressive disease. Despite recent advances in molecular biology, there is a lack of biomarkers, which would improve GBM’s diagnosis, prognosis, and therapy. Here, we analyzed by qPCR the expression levels of a set of miRNAs in GBM and lower-grade glioma human tissue samples and performed a survival analysis in silico. We then determined the expression of same miRNAs and their selected target mRNAs in small extracellular vesicles (sEVs) of GBM cell lines. We showed that the expression of miR-21-5p was significantly increased in GBM tissue compared to lower-grade glioma and reference brain tissue, while miR-124-3p and miR-138-5p were overexpressed in reference brain tissue compared to GBM. We also demonstrated that miR-9-5p and miR-124-3p were overexpressed in the sEVs of GBM stem cell lines (NCH421k or NCH644, respectively) compared to the sEVs of all other GBM cell lines and astrocytes. VIM mRNA, a target of miR-124-3p and miR-138-5p, was overexpressed in the sEVs of U251 and U87 GBM cell lines compared to the sEVs of GBM stem cell line and also astrocytes. Our results suggest VIM mRNA, miR-9-5p miRNA, and miR-124-3p miRNA could serve as biomarkers of the sEVs of GBM cells.

Graphical Abstract

1. Introduction

Glioblastoma (GBM) is the most common and highly aggressive primary brain tumor, with an annual incidence below 10 (e.g., 3.2 in the USA) per 100,000 people [1,2]. In Europe, the incidence varies from 3 per 100,000 people in Eastern Europe to 5 per 100,000 people in the United Kingdom and Ireland [3]. This is a disease that mainly affects the elderly population, with an average age of patients diagnosed at 64 years [4]. According to the World Health Organization classification, it belongs to grade IV, the most malignant type of glioma [5]. Despite extensive research and attempts to develop appropriate and effective therapies, GBM is still characterized by a poor prognosis and a high mortality rate [6]. In general, 90% of GBM arise de novo, while the rest develop from lower-grade glioma [7]. The exact causes of the disease are largely unknown, but high-dose ionizing radiation and rare genetic disorders have been suggested to increase incidence [4]. Diagnosis is usually made with magnetic resonance imaging and confirmed with histology. In most cases, patients are treated surgically and with radiotherapy and chemotherapy with temozolomide [4]. Temozolomide is an alkylating agent that crosses the blood–brain barrier and methylates DNA, leading to cell death [7]. With this aggressive treatment, the survival of GBM patients ranges from 12 to 15 months, while only 9.8% of patients survive more than 5 years after diagnosis [8,9]. There are quite a few reasons why established treatments have no long-term success. One of the main causes is the presence of GBM stem cells, which share characteristics with normal stem cells, such as the expression of common markers, quiescence, and a high ability of self-renewal [7]. In addition, GBM stem cells are highly resistant to drugs, are migratory, and can form a new tumor [7].
To date, only a few glioblastoma biomarkers have entered clinical use. The two major are the methylation status of O-6-methylguanine-DNA methyltransferase (MGMT) promotor, and the mutation status of isocitrate dehydrogenase 1 and 2 (IDH1, IDH2). The methylation of MGMT promotor is correlated with a better disease outcome [4], while the status of IDH is the basis for GBM’s classification into three subgroups: IDH-mutant, wild-type IDH, and “not otherwise specified” (NOS) [10,11]. In general, IDH mutation is an indicator of a less aggressive form of the disease [1]. Despite recent progress in biomarker discovery, there is still a great shortage of biomarkers that would provide a more accurate insight into the nature or better characterization of the tumor and its prognosis, and on this basis could finally adjust appropriate therapy. Additionally, the disadvantages of current diagnosis are that MRI sometimes cannot distinguish well enough between GBM and other brain tumors, and single biopsies may not represent the overall genetic diversity of a given sample [12].
Newly explored potential biomarkers are various RNA molecules, including miRNAs, which are small (18–25 nucleotide long) non-coding RNAs that bind to the 3′UTR region of the target mRNA [13]. miRNAs are especially attractive because they can regulate the expression of target genes and affect the expression levels of the corresponding proteins [14]. The emerging and promising source of RNA biomarkers are extracellular vesicles (EVs) [12]. EVs were first described as entities for disposing cellular waste, yet are today known as important means of intercellular communication [15]. They are classified as exosomes, microvesicles, apoptotic bodies, and oncosomes [16]. Exosomes are the smallest among EVs (diameter 50–150 nm) and are frequently studied due to the biologically active molecules they contain. They are formed in multivesicular endosomes (MVE), which release its intraluminal vesicles as exosomes when MVE fuse with the cell’s plasma membrane [15]. When exosomes encounter a target cell, they can trigger signaling by binding to specific receptors, fusing with the membrane, or undergoing endocytosis [15].
Exosomes also carry a variety of macromolecules such as specific proteins and RNAs, making them a suitable source of biomarkers in body fluids. Their internal cargo may contribute to various characteristic processes of malignancy, such as increased cell viability, chemoresistance, angiogenesis, and the activation of malignant signaling pathways such as the signal transducer and activator of transcription (STAT) and sex-determining region Y (SRY)-box 2 (SOX2) pathways [16,17]. The analysis of RNA molecules present in the exosomes has various advantages compared to free RNA, such as protection from RNAse degradation resulting in longer stability and the detection of small amounts of RNAs that might otherwise go unnoticed [12]. On the other hand, the main disadvantages of this analysis are the small number of copies of specific gene transcripts and the difficulty in choosing the right reference for normalization [12].
As the field of research on extracellular vesicles is relatively new, no agreement has been reached on biomarkers specific to different subtypes of extracellular vesicle [18]. Therefore, as suggested by the Minimal Information of Extracellular Vesicle Studies 2018 [18], vesicles in our study are referred to as small extracellular vesicles (sEVs) (<200 nm) instead of exosomes.
In this study, we elucidated the differences in the expression levels of selected miRNAs and their target genes in different human-derived GBM samples. We examined the expression levels of miRNAs between GBM, lower-grade glioma, and reference brain tissue samples. Next, we examined the expression level of miRNAs and mRNAs in sEVs derived from GBM cell lines and astrocytes. Finally, we also performed a pathway analysis to investigate in which signaling pathway a particular candidate miRNA is involved.

2. Results

2.1. Selection of a Set of miRNAs (miR-9-5p, miR-21-5p, miR-124-3p, miR-138-5p, and miR-1-3p) That Target VIM, NCL, NAP1L1, FREM2, and SPRY1 Genes

Candidate miRNAs were selected based on their target genes, vimentin (VIM), nucleolin (NCL), nucleosome assembly protein-1 like-1 (NAP1L1), FRAS1-related extracellular matrix protein 2 (FREM2), and sprouty RTK signaling antagonist 1 (SPRY1) [6,19,20,21], which were previously associated with GBM in our studies. The selection was based on the prediction of the high probability and consistency of miRNA candidates among TargetScan [22], miRDB [23,24], and microT-CDS datasets [25,26]. The selection of miRNAs is shown in Table 1.
miR-9-5p targets NAP1L1 and FREM2 genes, which matched all tested datasets (TargetScan, miRDB, and microT-CDS). miR-21-5p targets SPRY1 gene and miR-124-3p targets SPRY1, NAP1L1, and VIM genes, with only NAP1L1 and VIM genes being consistent among all three datasets. Furthermore, miR-138-5p targets VIM and NCL genes, with VIM gene as a target consistent only between TargetScan and miRDB, while NCL gene as a target was detected only by microT-CDS. On the other hand, miR-1-3p was described to target NCL gene according to all three databases.
According to TargetScan, miR-9-5p binds the 672–679 position of 3′UTR FREM2 and the 347–353 position of 3′UTR NAP1L1. miR-21-5p binds the 415–422 position 3′UTR of SPRY1. miR-124-3p binds the 928–935 position of 3′UTR of SPRY1, the 403–409 position of 3′UTR NAP1L1, and the 81–87 position of 3′UTR of VIM. miR-138-5p binds the 32–38 position of 3′ UTR VIM and miR-1-3p binds the 90–97 position of 3′UTR of NCL.

2.2. miR-9-5p, miR-21-5p, miR-124-3p, and miR-1-3p Are Involved in Cancer and Brain-Specific Processes

For further insight into the function of candidate miRNAs, we identified pathways associated with candidate miRNAs. We first determined the target genes using the TargetScan [22], miRDB [23,24], and microT-CDS [25,26] datasets. Venn diagrams [28] of common target genes from all three datasets are presented in Figure 1. The list of genes is available in Supplementary Table S1.
The roles of miRNAs were analyzed by an Over-Representation Analysis of common target genes obtained from TargetScan, miRDB, and microT-CDS, using WebGestalt [29,30,31,32] and the Kyoto Encyclopedia of Genes and Genomes (KEGG) [33], Panther [34], and Reactome [35] databases. The pathways for each miRNA are presented in Table 2, along with their false-discovery rate (FDR). Only pathways with a false-discovery rate <0.05 are presented. In Supplementary Figures S1–S3, the protein connections for two pathways for miR-9-5p and miR-21-5p are presented. The protein connections were analyzed by STRING [36]. Only experimentally validated interconnections are presented. Supplementary Figure S1 shows the interconnections of proteins involved in the RAS pathway. The figure shows that miR-9-5p inhibits genes including MAP2K7, MAP3K1, SHC1, and PIK3CP, and in the ErbB pathway (Supplementary Figure S2) it inhibits genes including PAK4, MAP2K7, GSK3B, and SOS1. Supplementary Figure S3 shows the involvement of miR-21-5p in the RAS pathway, inhibiting genes including GAB1, FASLG, TIAM1, and its involvement in the tyrosine kinase pathway, inhibiting genes including SPRY2, FGF18, PAG1, and STAT3.
Most of the miRNAs analyzed are potentially involved in cancer, either specific types such as hepatocellular carcinoma (miR-9-5p), renal cell carcinoma (miR-1-3p), and thyroid cancer (miR-1-3p), or specific processes associated with cancer (miR-9-5p, miR-21-5p, miR-124-3p, and miR-1-3p). Moreover, miR-124-3p and miR-1-3p were related to the brain-specific processes of axon guidance, and miR-9-5p was strongly involved in the Ras, neurotrophin, and ErbB pathways. Likewise, miR-21-5p was involved in the Ras signaling pathway, as well as in the NTRK, BMP, receptor tyrosine-kinase, and PI3K: FGF pathways. For miR-138-5p, no pathway with an FDR lower than 0.05 was detected by Reactome, Panther, or KEGG.

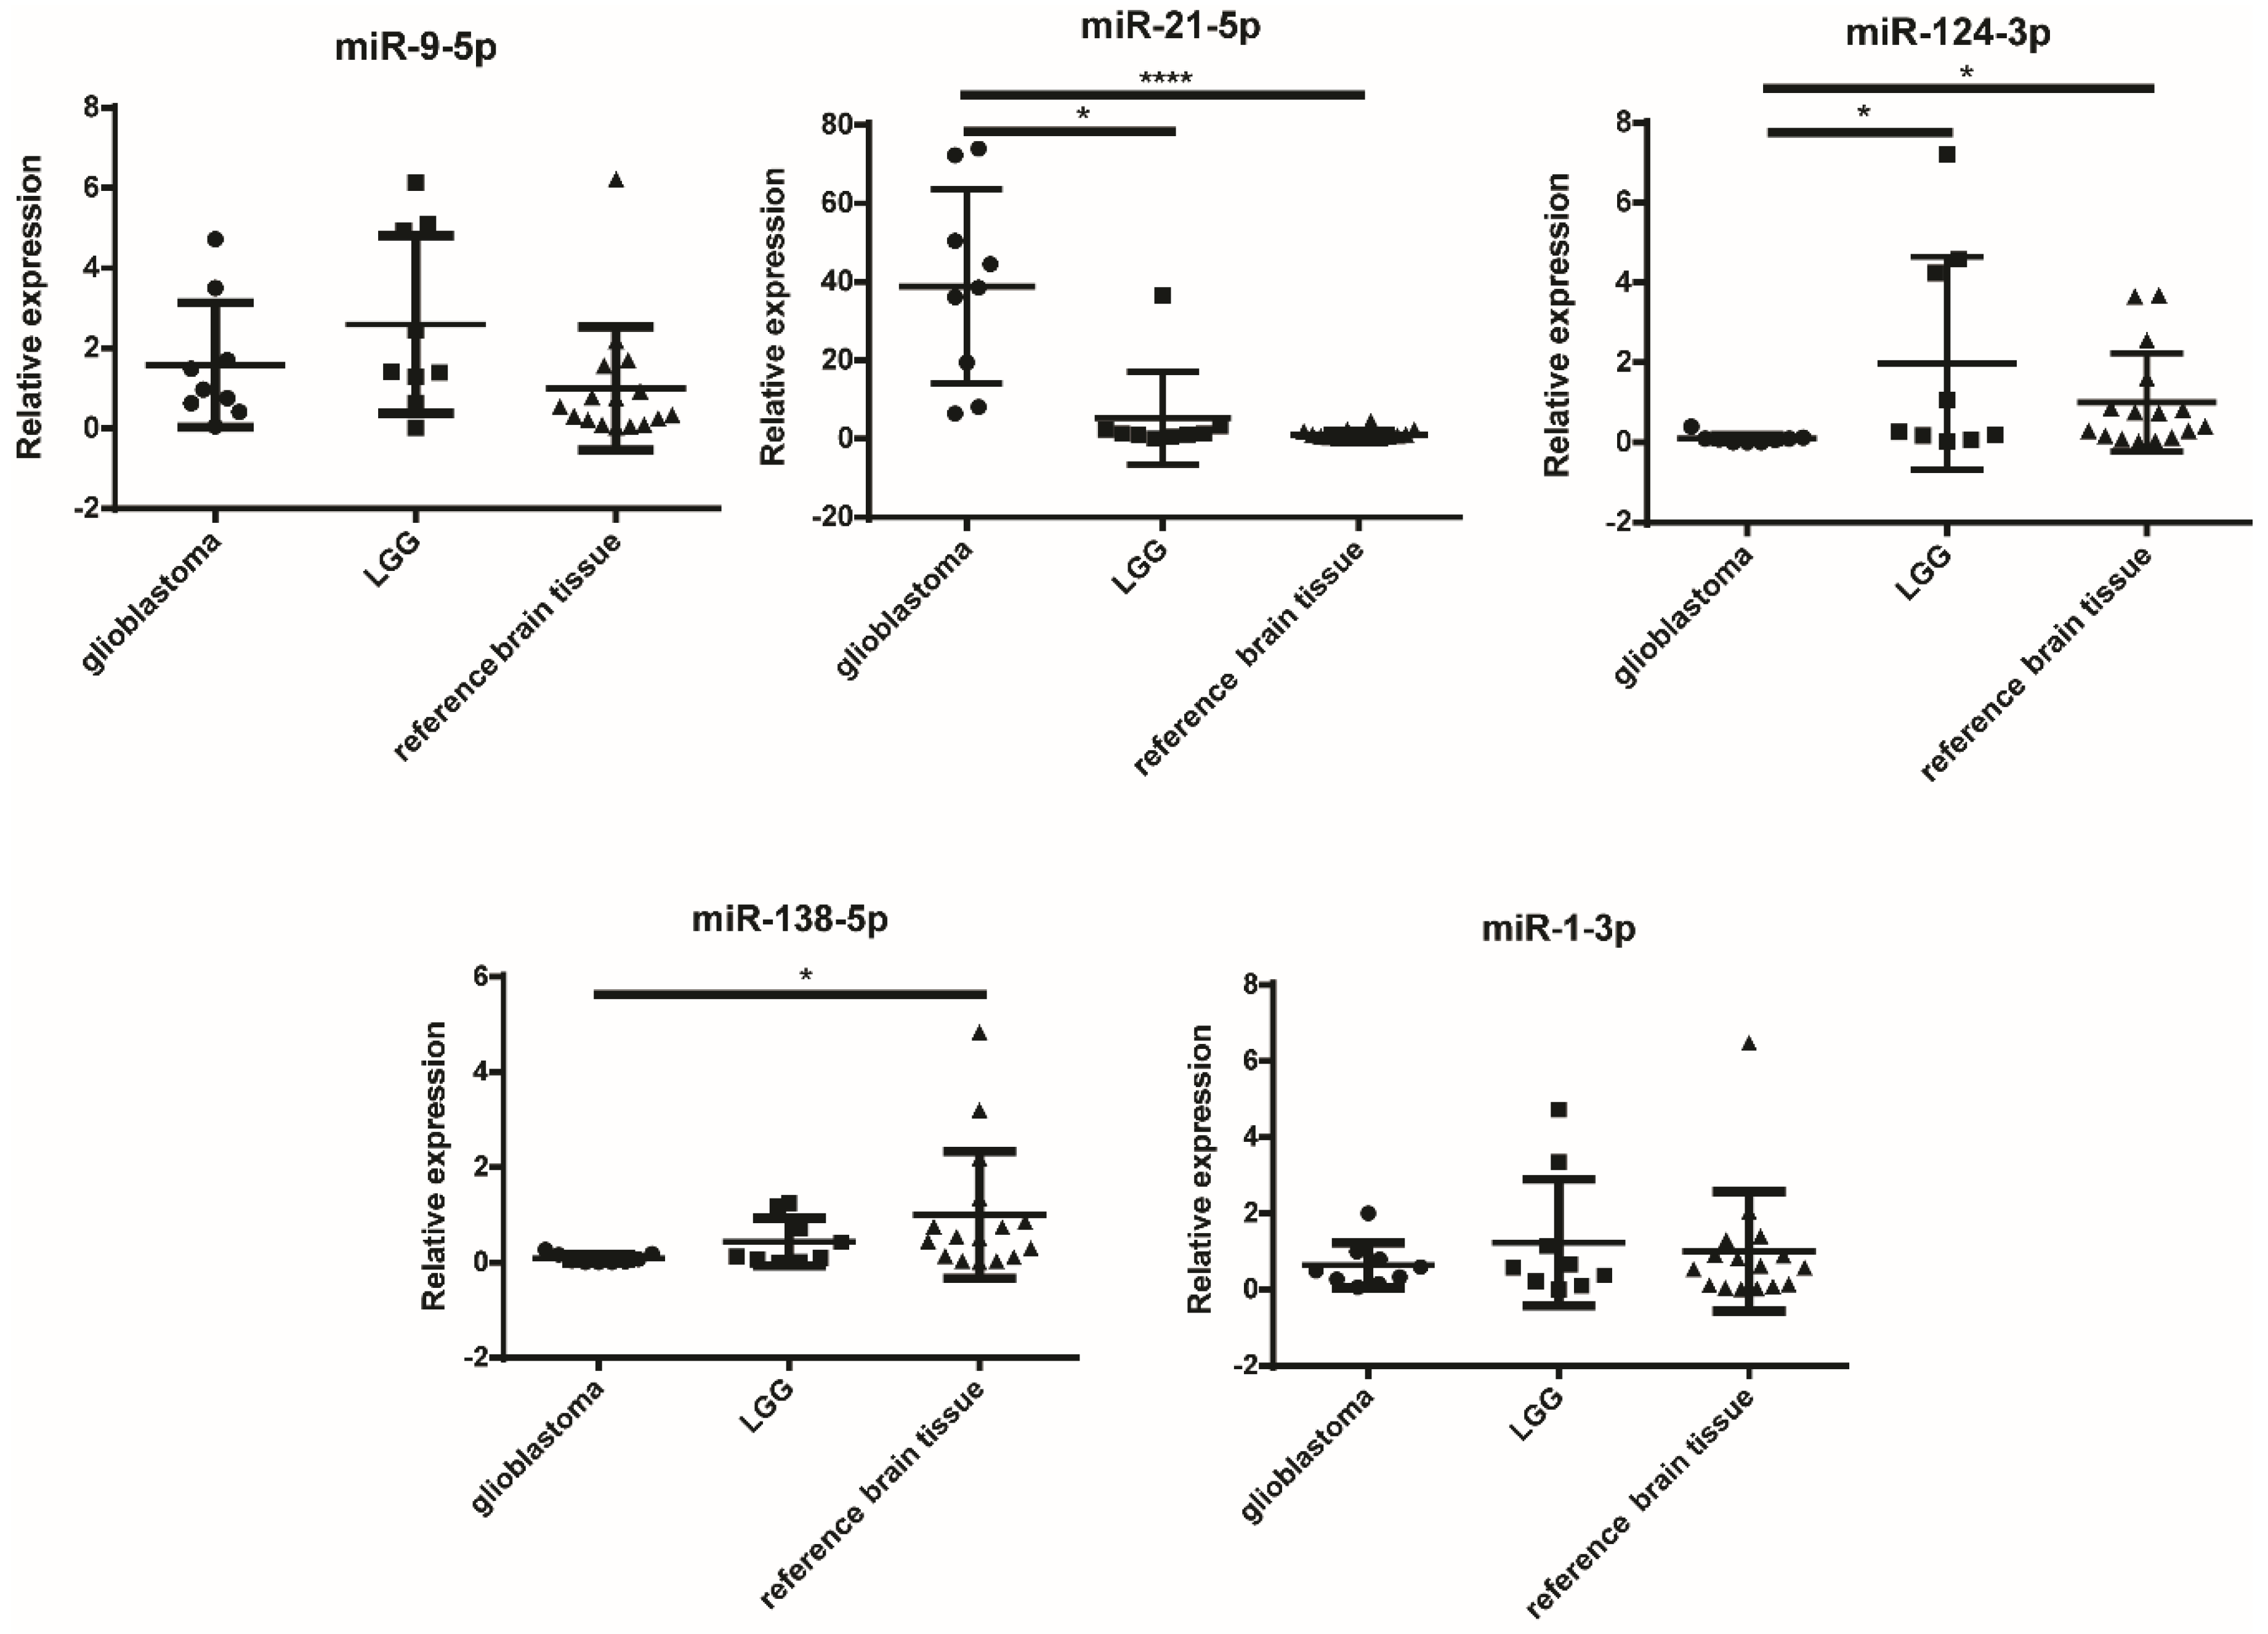
2.3. miR-124-3p and miR-138-5p Are Overexpressed in Reference Brain Tissue Compared to GBM

Next, we were interested whether the candidate miRNAs are expressed differently in different grades of glioma (GBM and lower-grade gliomas (LGG)) and reference brain tissues. The results of the experiment are graphically presented in Figure 2, and the results of the statistical analysis are given in Table 3.
miR-21-5p was significantly overexpressed in GBM compared to both LGG (p = 0.0146) and reference brain tissue (p < 0.0001). On the other hand, miR-124-3p was significantly overexpressed in reference brain tissue compared to GBM (p = 0.0178) and also in LGG compared to GBM (p = 0.0278). Likewise, miR-138-5p was also overexpressed in reference brain tissue compared to GBM (p = 0.0143). In contrast, for miR-9-5p and miR-1-3p no differences in tissue expression levels were detected.

2.4. Higher Expression Levels of miR-9-5p and miR-138-5p Are Correlated to the Shorter Survival of GBM Patients Carrying IDH Mutation

We wanted to investigate whether the expression of candidate miRNAs was associated with the survival of GBM patients, as this would mean that potential miRNA could be used as a prognostic biomarker. The results are graphically presented in Figure 3. The analysis was performed in silico using the TCGA database.
The results of the survival analysis showed that the higher expression of miR-9-5p in GBM tissues correlated with a shorter median survival of IDH-mutant GBM patients, whereas in all patients, regardless of the IDH mutation status, a higher miR-9-5p was linked to better survival. Similarly, a high expression of miR-138-5p was linked to worse survival in GBM patients carrying an IDH mutation. The expression of other tested miRNAs (miR-21-5p, miR-124-3p, or miR-1-3p) did not affect mean differences in survival.

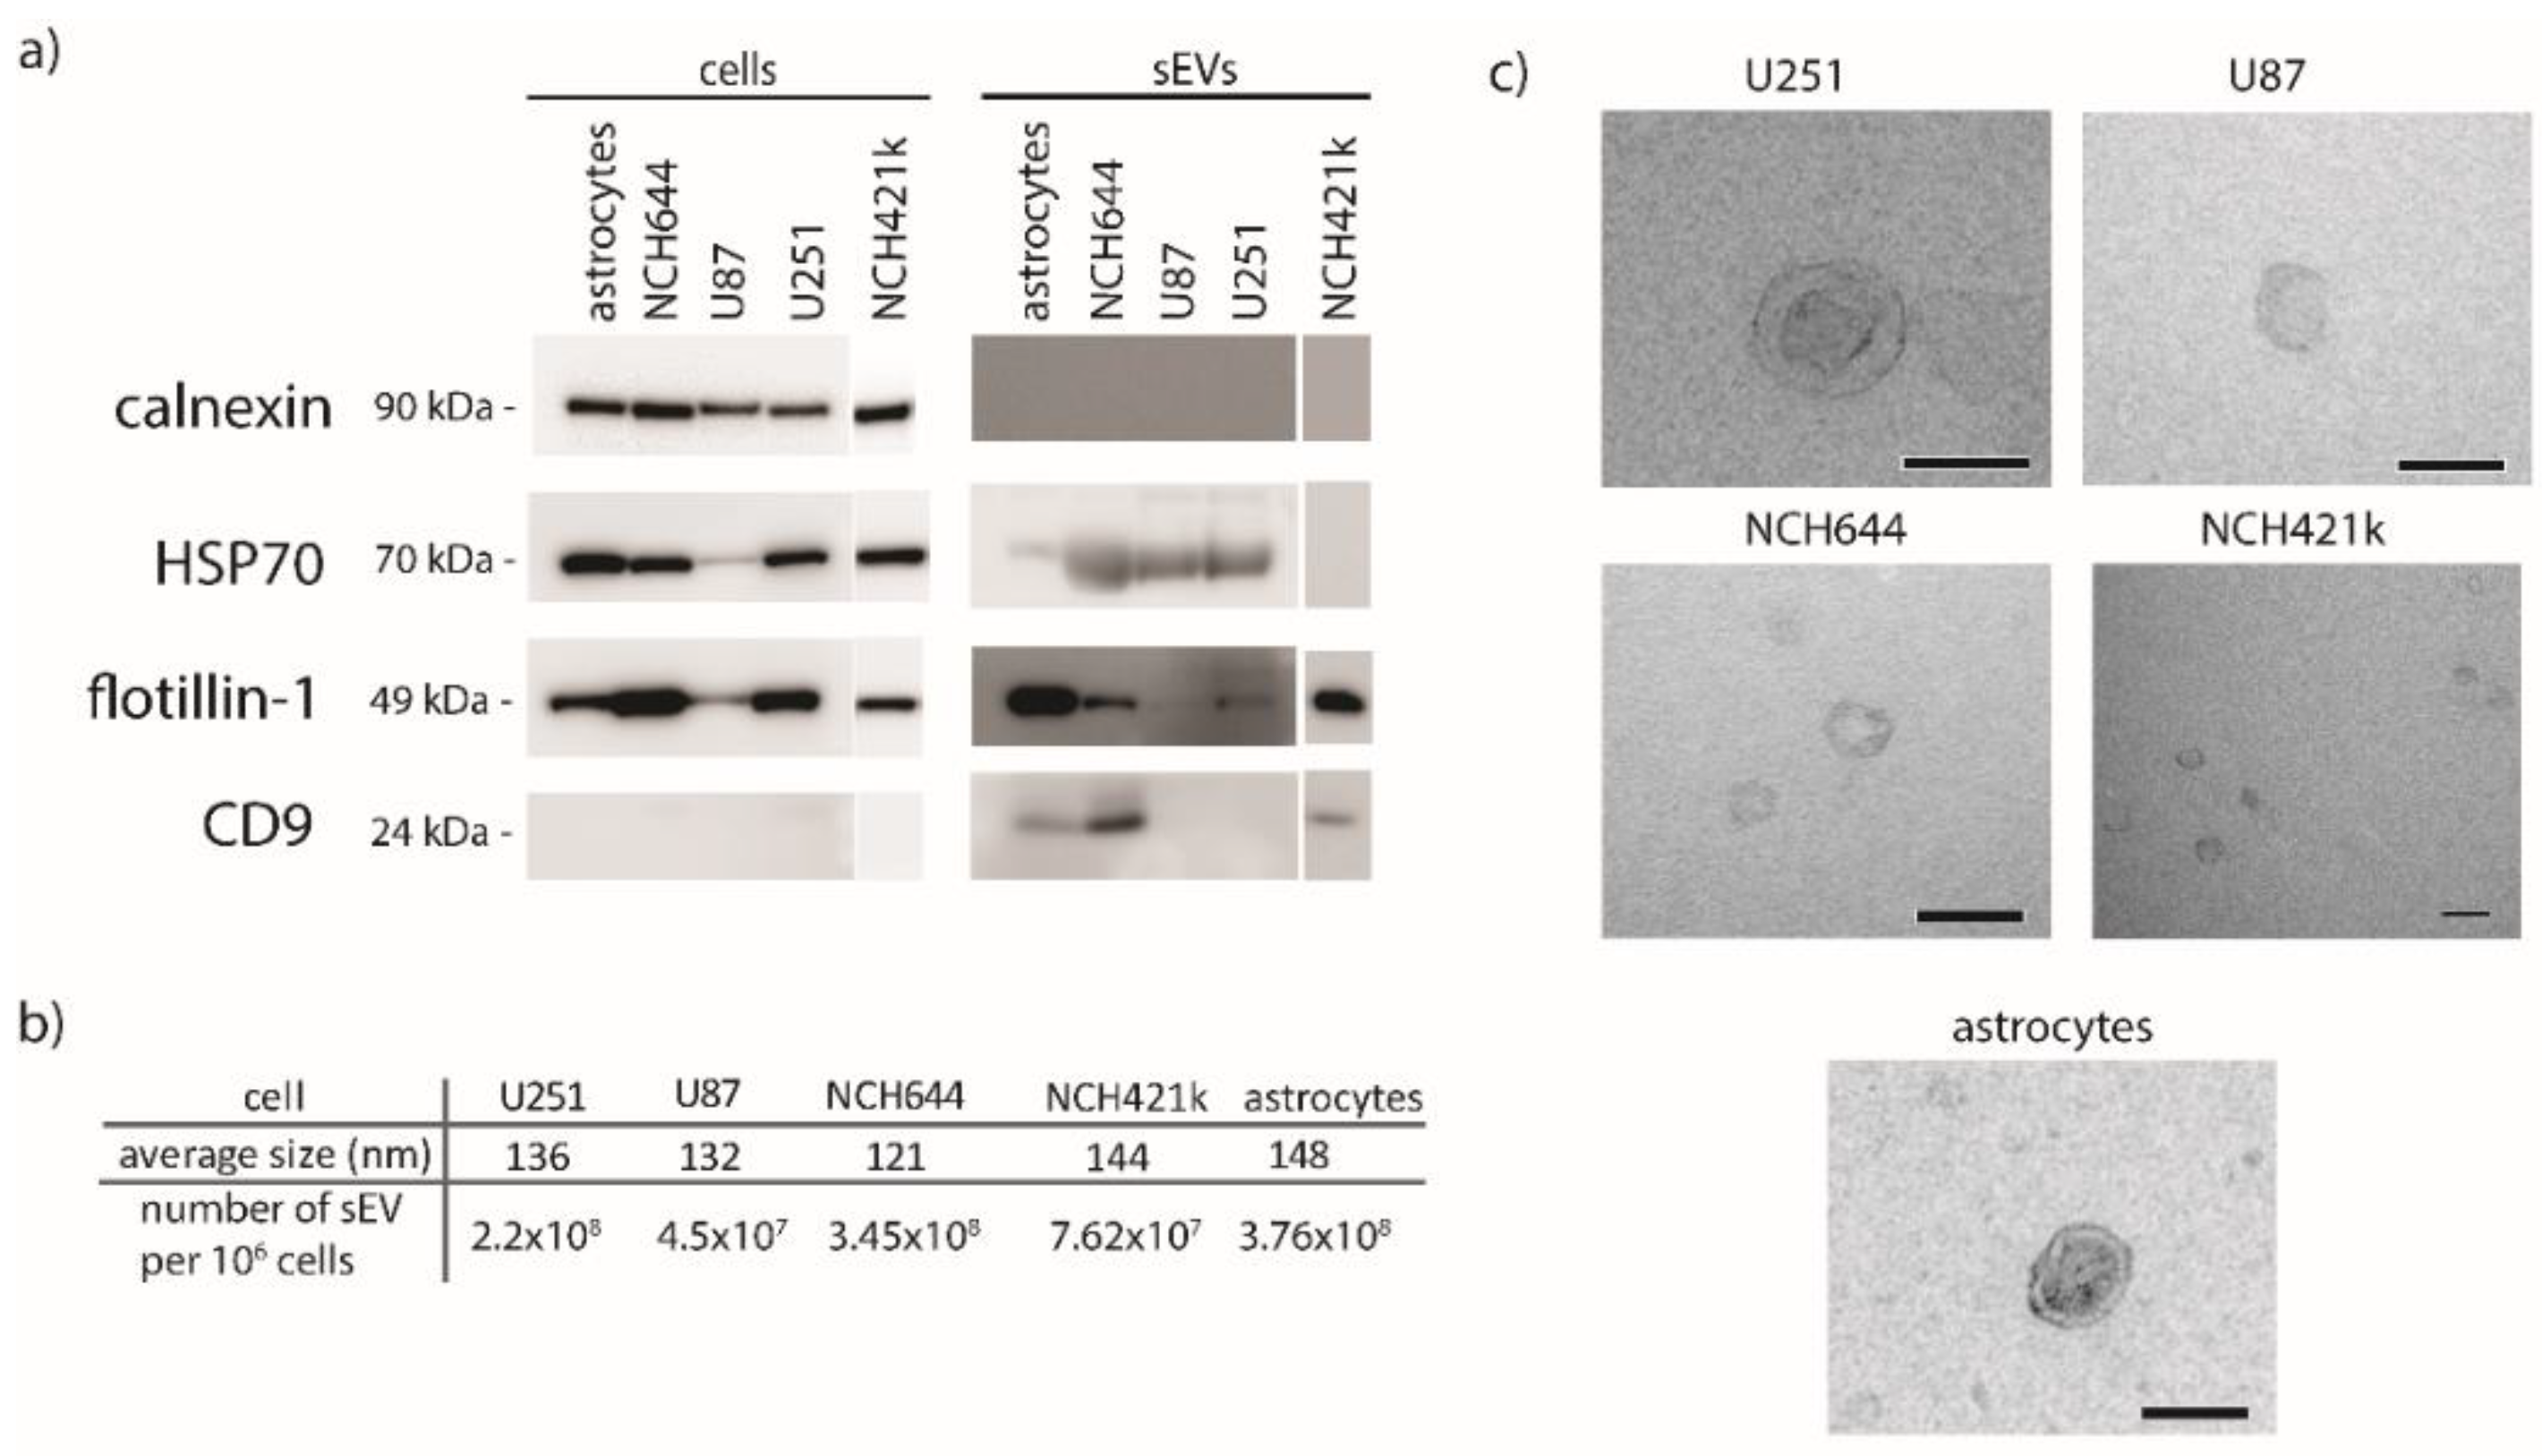
2.5. Characterization of sEVs

The sEVs were isolated from the U251 and U87 cell lines, from the NCH644 and NCH421k glioblastoma stem cell lines and astrocytes as a reference. NCH644 and NCH421k were characterized by flow cytometry, detecting CD133 on their surface (Supplementary Figure S4). The results show that both NCH644 and NCH421k have a high expression of CD133 (61–66%), while the expression of CD133 on U251, U87, and astrocytes was almost absent. The sEVs isolated from GBM cell lines and astrocytes were characterized by Western blot, nanoparticle tracking analysis (NTA), and transmission electron microscopy to confirm their identity and ensure that there were no cellular contaminants. The results are presented in Figure 4. The isolated sEVs were positive for proteins commonly enriched in sEVs: heat shock protein 70 (HSP70), flotillin-1, and CD9. The purity of sEV isolates was confirmed by the absence of calnexin, a marker for endoplasmic reticulum (Figure 4a). HSP70 and flotillin-1 were detected in lysates of all cells and sEVs, except in the sEVs of NCH421k (HSP70). The signal of flotillin in U87 sEVs was very weak, which may indicate that it is present in a lesser extent in U87 cells. Furthermore, CD9 was detected only in the sEVs of astrocytes and in the sEVs of the GBM stem cell lines NCH644 and NCH421k. The size of sEVs was determined by nanoparticle-tracking analysis (NTA). The mean diameter of all sEVs was between 100 and 150 nm (Figure 4b), which is expected because the cell medium was filtered through 220 nm-pore-size filters. The smallest sEVs were derived from the NCH644 cell line and measured 121 nm in diameter, while the largest were those from astrocytes (148 nm). Additionally, the number of sEVs secreted by a million cells was calculated. Astrocytes and NCH644 secreted the highest number of sEVs (3.76 × 10⁸ per million cells and 3.45 × 10⁸ per million cells), while U87 secreted the least number of sEVs (4.5 × 10⁷ per million cells). sEVs were also observed under the electron microscope, and representative images are presented in Figure 4c. All the observed sEVs had a spherical/doughnut-like shape. We conclude that all five investigated cell types release sEVs with distinct characteristics.

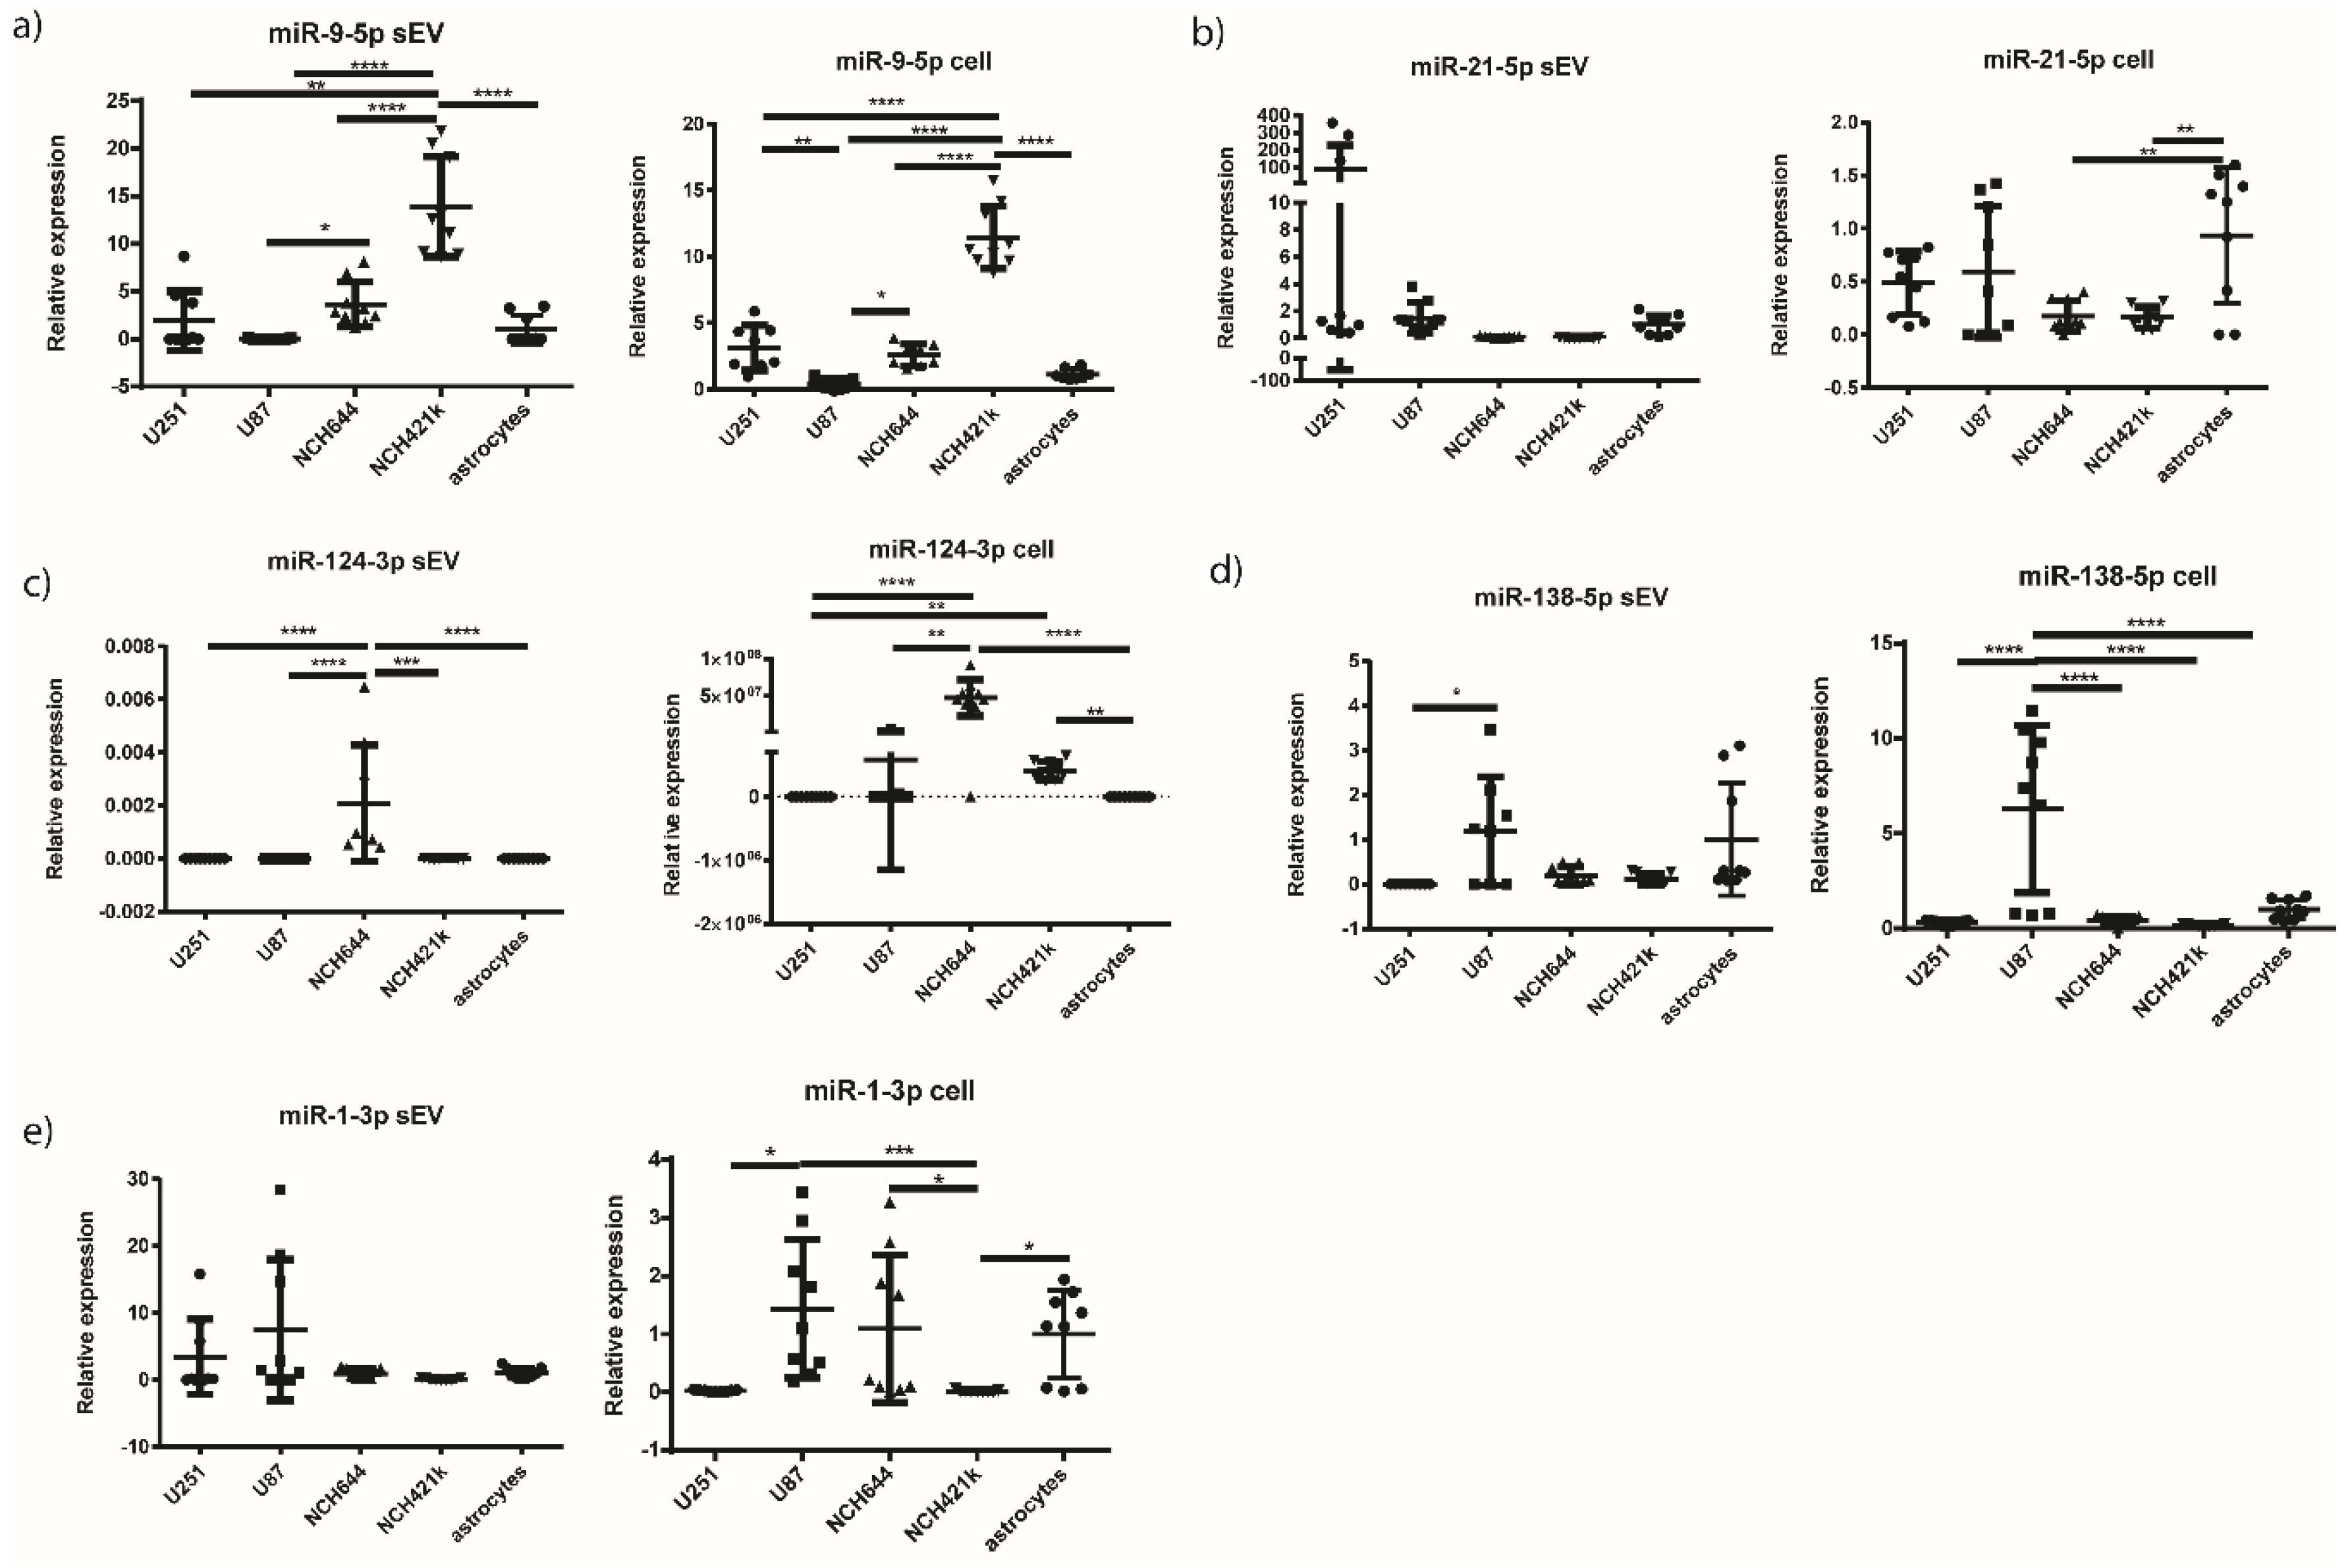
2.6. miR-9-5p and miR-124-3p are Overexpressed in the sEVs of NCH421k and NCH644 GBM Stem Cell Lines, Respectively, in Comparison to the sEVs of GBM Cell Lines and Astrocytes

We then performed qPCR on candidate miRNAs (miR-9-5p, miR-21-5p, miR-124-3p, miR-138-5p, and miR-1-3p) from all five cell types (U251, U87, NCH644, NCH421k GBM cell lines and astrocytes as a reference) and corresponding sEVs. The results are presented in Figure 5 and Table 4. It should be noted, however, that the experiment including the NCH421k cell line was conducted separately from the rest of the cells.
miR-9-5p was upregulated in the NCH421k cell line compared to all other GBM cell lines and astrocytes (p < 0.0001 for all cells). Similarly, miR-9-5p was upregulated in the sEVs of the GBM stem cell line NCH421k, compared to the sEVs of NCH644, U87, U251, and astrocytes (p = 0.0048 for U251 and p < 0.0001 for U87, NCH644, U87, and astrocytes). Furthermore, miR-21-5p was found to be significantly overexpressed in astrocytes cells compared to NCH644 (p = 0.0052) and NCH421k (p = 0.0042), while there were no statistical differences observed between other cells and also between sEVs. For miR-124-3p, it was found to be significantly overexpressed in the both GBM stem cell lines, NCH644 and NCH421k, compared to astrocytes (p < 0.0001 and p = 0.0075, respectively). In sEVs, the expression of miR-124-3p was significantly higher only in NCH644 compared to all the other cells (p < 0.0001 for U251, U87, and astrocytes, p = 0.0002 for NCH421k). However, in astrocyte sEVs the miR-124-3p expression level was below the limit of detection (Figure 5). Furthermore, miR-138-5p was overexpressed in the U87 cell line compared to all other cells tested (p < 0.0001 for all cells), but in associated sEVs it was overexpressed in U87 sEVs compared to U251 sEVs only (p = 0.0301). On the other hand, miR-1-3p was found to be overexpressed in U87 and astrocytes compared to NCH421k (p = 0.0007). The results indicate that miR-124-3p may differentiate between glioblastoma stem cell lines (NCH644 and NCH421k) and astrocytes. In addition, miR-124-3p and miR-9-5p could also be considered for further investigation as potential biomarkers for GBM stem cell sEVs.

2.7. Vimentin Gene Is Overexpressed in sEVs Originating from U251 and U87 GBM Cell Lines

Finally, we investigated whether the target genes of the selected miRNAs—NAP1L1, FREM2, SPRY1, VIM, and NCL—that have been associated with GBM in our previous studies [6,19,20,21] were also present in the sEVs of different cell types and showed any particular expression pattern in GBM-isolated sEVs compared to normal astrocyte cells. qPCR was used for analysis. The results are presented in Figure 6, and the results of the statistical analysis in Table 5. NCH421k sEVs were not included in this study, as reference genes could not be detected in any of the NCH421k samples.
VIM gene had a significantly higher expression in the U251 and U87 cell lines’ sEVs compared to the NCH644 GBM stem cell line sEVs (p < 0.0001 and p = 0.0003, respectively) and normal astrocyte sEVs (p < 0.0001), while the NAP1L1 gene expression was significantly higher in sEVs from U251 and NCH644 compared to those of astrocytes (p = 0.0002 and p = 0.0300, respectively). Here, the mRNA expression was also higher in U251 sEVs compared to U87 (p = 0.0467). On the other hand, there was no differential expression of NCL, FREM2, and SPRY1 genes in the sEVs of cancer cell lines and astrocytes. Because the FREM2 expression in astrocytes could not be detected, in this case data are presented without normalization to astrocytes. The results suggest that the VIM gene expression in sEVs may differ between the U251 and U87 GBM cell lines and normal astrocytes.
We then compared the gene expression in sEVs with the expression in cells types, as previously published [19,21]. The expression profile of VIM gene in sEVs followed the expression in cells, while the expression profile of the NAP1L1, NCL, SPRY1, and FREM2 genes in sEVs did not follow the expression profile of the same genes in different cell types [19,21].
Finally, we compared the expression of selected miRNAs in sEVs with the expression of their target genes in sEVs. SPRY1 and FREM2 genes were both negative in the sEVs of all cell types, while miR-9-5p and miR-21-5p expression was detected in all cell types, indicating inverse expression. The VIM gene was significantly overexpressed in the sEVs of the U251 and U87 glioblastoma cell lines, while VIM-targeting miR-124-3p showed an inverse expression compared to VIM itself, as it was downregulated in the sEVs of U251 and U87 compared to the NCH644 stem cell line. Additionally, VIM-targeting miR-138-5p had inverse expression in the U251 sEVs compared to astrocytes and stem cell lines (though not significant). In Table 6, the summary of all the results are presented.

3. Discussion

In this study, we selected candidate miRNAs that regulate genes associated with GBM, as confirmed by our previous studies. FREM2 and SPRY1 have been proposed as potential new markers of GBM, and have been demonstrated to be significantly upregulated in GBM at the mRNA and/or protein level in GBM cell lines and GBM tissues compared to references (astrocytes or reference non-malignant brain tissue) [6,19]. Furthermore, VIM, NCL, and NAP1L1 were significantly overexpressed in GBM tissues and/or cells compared to the reference [20,21]. Some of the proposed genes have also been implicated in other cancers, for example gastric cancer (vimentin) [37], large B-cell lymphoma (nucleolin) [38], and pancreatic cancer (NAP1L1) [39]. The information about FREM2 expression in cancer is rather scarce. However, it has been found to be overexpressed in gliosarcoma [40]. SPRY1, on the other hand, has been associated with increased malignancy in triple-negative breast cancer [41] and has been shown to be downregulated in epithelial ovarian cancer [42].
The investigated miRNAs were selected on the basis of the datasets TargetScan [22], miRDB [23,24], and microT-CDS [25,26], with a high probability of miRNA–mRNA pair formation. Most of the miRNA–target gene combinations matched between the datasets—namely, miR-9-5p targeting the NAP1L1 and FREM2 genes; miR-21-5p regulating the SPRY1 gene; miR-124-3p regulating the SPRY1, NAP1L1, and VIM genes; and miR-1-3p regulating the NCL gene. Discrepancy was observed in the case of miR-138-5p, which regulates the VIM gene, as predicted by TargetScan and miRDB, and the NCL gene, as predicted by microT-CDS. Of these two, VIM has already been described as a direct target of miR-138 [43,44], while to our knowledge there are no direct experimental reports on NCL as a target of miR-138.
The analysis of the miRNA expression in cells showed that miR-9-5p was overexpressed in the GBM NCH421k stem cell line compared to all other GBM cell lines and astrocytes. It was similar to the expression in sEVs, as this miRNA is also overexpressed in the sEVs of the GBM NCH421k stem cell line compared to the sEVs of all other GBM cell lines and astrocytes. Our findings are consistent with the results published by Schraivogel et al., who reported a high expression of miR-9 in CD133+ glioma stem cells [45]. On the other hand, Tezcan et al. [13] found that the miR-9 expression in GBM stem cells was lower compared to the expression in GBM non-stem cells, although not significantly. Our results suggest that miR-9-5p is overexpressed in one type of glioblastoma stem cell line (NCH421k) and their sEVs compared to healthy astrocytes. Our results also show that a higher expression of miR-9-5p in the GBM tissue is associated with a poorer survival (p = 0.01) in patients with IDH-mutated GBM, whereas in all tissues, regardless of the IDH mutation, a higher miR-9-5p expression was associated with better survival (p = 0.012). Similar results were obtained by Ben-Hamo et al., who showed with in silico analysis that higher miR-9-5p is linked to better survival; however, in this study IDH status was not taken into consideration [46]. The analysis of the participation of our selected miRNAs in different cellular pathways (Table 2) showed that miR-9 is strongly involved in the modulation of the Ras, ErbB, neurotrophin signaling, and actin cytoskeleton pathways, which have previously been associated with malignancy [46,47,48,49]. However, to better elucidate the role of miRNAs in a particular pathway, it would be appropriate to establish a knock-down of miRNA and explore the expression of downstream target(s). miR-9 has also been reported as one of the contributors to temozolomide resistance in the GBM stem cells. Specifically, as described by Munoz et al., anti-miR-9 present in exosomes successfully inhibited temozolomide resistance in GBM cells [50]. Therefore, miR-9, selectively packaged in NCH421k sEVs, may mediate and promote temozolomide resistance, as the GBM stem cells are exceptionally resistant to chemotherapy [51]. Nevertheless, the potential role of miR-9 in mediating temozolomide resistance should be further investigated.
Another miRNA that is specific for GBM is miR-21-5p (Figure 2), as the expression of miR-21-5p was significantly overexpressed in GBM compared to LGG (Figure 2) and reference brain tissue. Our results indicate that miR-21-5p, in contrast to miR-9-5p, was significantly downregulated in GBM stem cell lines (both NCH644 and NCH421k) compared to astrocytes. The expression of miR-21 has already been positively associated with a more differentiated phenotype and negatively associated with stemness [52,53]. While miR-21-5p has already been investigated as a marker of GBM present in the sEVs of cerebrospinal fluid [54], its presence in other body fluids remains to be investigated. Our results, however, do not indicate differences in the miRNA expression in sEVs of different cell types. Our pathway analysis (Table 2) shows that miR-21-5p is strongly involved in several pathways such as the Ras, NTRK, bone morphogenic protein, receptor tyrosine kinase, MET/PI3K/AKT, and fibroblast growth factor receptor pathways, which have already been associated with GBM [55,56,57]. The targets of both miRNAs, miR-9-5p and miR-21-5p, include FREM2 and SPRY1, which could not be detected in the sEVs of GBM cell lines, and their expression was inverse to that of miRNA expression, suggesting the inhibition of gene expression.
In contrast to miR-21-5p miRNA, the miR-124-3p and miR-138-5p miRNAs were both underexpressed in GBM compared to reference brain tissue (Figure 2). miR-124-3p was significantly downregulated in GBM compared to reference brain tissue and LGG. However, it was overexpressed in NCH644 and NCH421k cell lines compares to astrocytes, as well as in the sEVs of NCH644 compared to astrocytes, in which the expression was below the detection threshold. The absence of miR-124-3p expression in astrocytes has already been reported [58]. miR-124 has previously been shown to be downregulated in GBM stem cells compared to neural stem cells [59], which may serve as more suitable control cell line. As shown in Table 2, the analysis of signaling pathways demonstrated that miR-124-3p is associated with senescence, a feature attributed to cancer stem cells [60]. However, as described as Jiang et al., miR-124 is linked to the inhibition of self-renewal and mesenchymal transition and a reduction in stemness [61]. Nevertheless, in our study its lower expression in cancer stem cell lines compared to the U251 and U87 GBM cell lines could not be observed. miR-124 has also been described as neuron-specific [62], which is also indicated by the results of our pathway analysis linking miR-124-3p to axon guidance (Table 2). This would also explain the low expression in U251 and U87 GBM cells, as GBM belongs to the group of astrocytomas [5].
The second miRNA, underexpressed in GBM vs. reference brain tissue, was miR-138-5p. In silico analysis using data from the TCGA showed that a high expression of miR-138-5p was associated with a worse overall survival in GBM patients carrying an IDH mutation. In previous studies, miR-138 has been described in brain tumors as both a tumor suppressor and an oncogene [63,64,65]. WebGestalt by KEGG, Panther, or Reactome with a false detection rate below 0.05 (Table 2) did not detect any signaling pathway associated with miR-138 (Table 5). This is probably due to the fact that miR-138 is a relatively uncharacterized miRNA. Both miRNAs, miR-124-3p and miR-138-5p, target the VIM gene, which was found overexpressed in the sEVs of differentiated GBM cell lines compared to the GBM NCH644 stem cell line and astrocytes. The expression of this gene was inversely associated with the expression of miR-124-3p and miR-138-5p, suggesting a malignant role of the VIM gene that could be further investigated as a potential glioblastoma biomarker in small extracellular vesicles. VIM gene encodes the vimentin protein, which belongs to group III intermediate filaments [66]. In physiological conditions, it is expressed in developing brains and later replaced by other filaments. Brain tumors, on the other hand, express proteins that are characteristic for developing brains, including vimentin [67]. It should be noted that it is one of the markers of epithelial to mesenchymal transition and is highly expressed in mesenchymal cells and strongly associated with GBM malignancy [66,68].

4. Materials and Methods

4.1. Selection of Candidate miRNAs

Candidate miRNAs were selected based on their interaction with NCL, VIM NAP1L1, FREM2, and SPRY1 [6,19,20,21] target genes using the TargetScan [22], miRDB [23,24], and microT-CDS datasets [25,26].

4.2. Pathway Analysis

First, target genes of each miRNA were chosen based on the TargetScan [22], miRDB [23,24], and microT-CDS datasets [25,26]. Next, using Venn diagram [28], all common target genes of miRNAs were selected. Pathway analysis was performed using WebGestalt 2019 [29,30,31,32], including the Panther, Reactome, and KEGG databases for an Over-Representation Analysis. Moreover, a STRING [36] analysis for a few miRNAs and pathways was performed, showing the experimentally validated interconnections of proteins with a level of medium confidence.

4.3. Tissues and Ethical Approval

All tissues were of human origin. Nine glioblastoma and nine lower-grade glioma tissues and 16 reference brain tissues were included in the study. All of the GBM tissues were IDH wild type. One of the tissues included in lower-grade glioma group was grade II-III glioma (classification by World Health Organization). The tissues were reviewed by a pathologist. The study was approved by the National Medical Ethics Committee of Republic of Slovenia (document numbers are 92/06/12, 89/04/13, 95/09/15, 0120-196/2017/7, and 0120-190/2018/4). Reference samples were acquired following national legal regulations of the Republic of Slovenia.

4.4. miRNA Quantification in Tissues

Total RNA from tissues was extracted using TRIzol reagent following the manufacturer’s recommendations. RNA samples were stored at −80 °C and concentrations were measured with Synergy H4 (Synergy H4 Hybrid Reader, BioTek, Winooski, VT, USA), and the A260/A280 ratio was determined. The miRNA conversion to cDNA and its quantification with qPCR are described in Section 4.9 (Quantification of Cellular and sEV miRNA, and sEV mRNA). The process of miRNA to cDNA synthesis was as follows. First, to remove possible DNA traces RNA was treated with DNase (0.1 μL; Roche, Basel, Switzerland) in 10× DNAse buffer (0.5 μL; Roche) in a total volume of 5 μL. The reaction mixture was incubated for 15 min at 30 °C and 10 min at 75 °C. Then, miRNA was transcribed to cDNA using the TaqMan Advanced miRNA cDNA Synthesis Kit according to the manufacturer’s manual (ThermoFisher Scientific, Waltham, MA, USA). The qPCR mixture consisted of 2.25 μL of cDNA, 0.25 μL of probes, and 2.5 μL of TaqMan Fast Advanced Master Mix (ThermoFisher Scientific) in a total of 5 μL reaction. The settings were as follows: 20 s at 95 °C; 45 cycles of 1 s 95 °C, 20 s 60 °C; hold 4 °C. qPCR was performed using ViiA7 (Applied Biosystems, Life Technologies, Waltham, MA, USA). The experiment was performed with three biological replicates and each biological replicate was tested in triplicate. The reference gene for miRNA was miR-99a-5p, one of the stably expressed miRNAs in glioblastoma [69].

4.5. In Silico Survival Analysis

The miRNA expression and survival data were extracted from the OncoLnc portal (http://www.oncolnc.org) [70]. In total, we analyzed data for 484 GBM patients (21 with IDH mutation found and 463 wild-type patients). IDH mutation status was inferred from annotated vcf files downloaded from the TCGA repository (https://portal.gdc.cancer.gov/repository; National Cancer Institute, Bethesda, MD, USA) [71]. We searched for missense mutations IDH1 R132H and IDH2 R172H that passed all quality filters imposed by the TCGA consortium.
A survival analysis of GBM patients was performed using R packages survival (Version 3.1.12) and survminer (Version 0.4.6), Kaplan–Meier curves were drawn using R ggplot2 package (Version 3.3.0).

4.6. Cell Lines

U251 and U87 human GBM cell lines (ATCC) were cultured in Eagle’s minimum essential medium (Sigma-Aldrich, St. Louis, MO, USA) supplemented with 5% fetal bovine serum (FBS) (Sigma-Aldrich), 1 mM sodium pyruvate (Sigma-Aldrich), 1% non-essential amino-acids solution (Gibco, Waltham, MA, USA) and 1% antibiotic–antimycotic solution (penicillin/ streptomycin/ amphotericin B; Gibco). The NCH644 and NCH421k human GBM stem cell line (CLS Cell Lines Service GmbH, Eppelheim, Germany) were cultured in Neurobasal medium (Gibco) supplemented with 1% GlutaMax (Gibco), B27 supplement (Gibco), 20 ng/mL EGF (Gibco), 20 ng/mL bFGF (Gibco), 1 U/mL heparin (Sigma-Aldrich), and 1% antibiotic–antimycotic solution (penicillin/streptomycin/amphotericin B; Gibco). Both of the glioblastoma stem cell lines are tumorigenic and highly CD133 positive. U251 and U87 are immortalized cell lines commonly used as a model for research of GBM molecular and cell biology. Human astrocytes (ScienCell) were grown in Astrocyte medium (ScienCell, Carlsbad, CA, USA) supplemented with 2% FBS (ScienCell), 1% astrocyte growth supplement (ScienCell), and 1% penicillin/ streptomycin (ScienCell). They were isolated from cerebral cortex and are highly glial fibrillary acidic protein (GFAP) positive. FBS used in the medium for sEVs isolation was previously centrifuged at 100,000× g (MLA-50; Beckman Coulter, Brea, CA, USA) and 4 °C for 24 h and filtered through a 0.22 μm-pore-size filter (cellulose acetate membrane, Corning) to eliminate EVs.

CD133 Flow Cytometry

The expression of the surface marker CD133 (Prominin-1) was quantified by flow cytometry. Briefly, 50,000 cells of the cell lines NCH644, NCH421K, U87, U251 and astrocytes were resuspended in 0.02% BSA/PBS, centrifuged at 300× g for 10 min and the pellet was resuspended in 0.02% BSA/PBS with 0.25 µg of CD133 antibody (CD133 (Prominin-1) Monoclonal Antibody (TMP4), Alexa Fluor 488, eBioscience™). After 30 min incubation at 4 °C, cells were centrifugated at 300× g for 10 min, supernatant was discarded and resuspended in 0.02% BSA/PBS. This step was performed twice. Cells were analyzed by flow cytometry on a FACSCalibur system equipped with a 488 nm Ar-ion laser using the CellQuest software (Becton Dickinson, Franklin Lakes, NJ, USA) and the FL-1 (530/30) filter on at least 2 × 10⁴ events per sample.

4.7. Small Extracellular Vesicles (Small EV) Isolation and Characerization

For sEV isolation, cells were incubated for 72 h. Then, medium was collected and the cells and cellular debris were removed from the medium by subsequent centrifugation at 300× g for 10 min and 2000× g for 10 min, respectively. The medium was passed through a 0.22 μm-pore-size filter (cellulose acetate membrane, Corning) to remove larger vesicles. The sample was concentrated (Amicon® Ultra, with Ultracel-100 regenerated cellulose membrane; Merck, St. Louis, MO, USA) and ultracentrifuged on 2 mL of 20% sucrose cushion for 135 min, 4 °C at 100,000× g (MLA-55; Beckman Coulter) [72]. The pellet was resuspended in PBS and subsequently used for nanoparticle-tracking analysis (NTA), transmission electron microscopy, in radioimmunoprecipitation assay buffer (RIPA) for Western blot, and in lysis buffer (mirVana; ThermoFisher) for RNA extraction studies.

4.7.1. Protein Isolation and Western Blot

Pellets of sEVs and cells were resuspended in RIPA buffer supplemented with 100X Halt™ Protease Inhibitor Cocktail (ThermoFisher) and incubated for 15 min on ice. A protein mixture of cells was centrifuged 15 min at 14,000× g and 4 °C. All samples were saved at −20 °C for Western blot analysis. The protein concentration was measured using Pierce BCA Protein Assay Kit (ThermoFisher) as described in the manufacturer’s protocol. Approximately 5 μg of sEVs lysate proteins and 10 μg of cell lysate proteins were separated on 4–12% NuPAGE Bis-Tris gel (ThermoFisher) which was running for 70 min at 200 V. Proteins were then transferred to a polyvinylidene fluoride membrane. The transfer was running 90 min at 100 V. Afterwards, the membrane was blocked for 1 h in 5%/PBS milk with shaking at room temperature, and then incubated overnight at 4 °C with the following primary antibodies: rabbit anti-flotillin-1 (1:1000; Cell Signalling), mouse anti-HSP70 (1:200; Santa Cruz, Dallas, TX, USA), mouse anti-CD9 (1:200; Santa Cruz, Dallas, TX, USA), and rabbit anti-calnexin (1:2000; Sigma Aldrich). Then, secondary goat anti-rabbit HRP-conjugated antibody (1:7500; Sigma Aldrich) or goat anti-mouse HRP-conjugated antibody (1:4000; Sigma Aldrich) were applied. The membrane was incubated with Super Signal West Pico Chemiluminescent Substrate (ThermoFisher). Chemiluminescence signals were visualized with LAS-4000 CCD camera (Fujifilm; Tokyo, Japan).

4.7.2. Nanoparticle Tracking Analysis

The average size of sEVs was determined by nanoparticle tracking analysis using Nanosight NS300TM (Malvern Panalytical, Malvern, UK) equipped with syringe pump and autosampler. Briefly, pelleted sEVs were resuspended and diluted 1:200 in filtered (0.22 μm-pore size) and sonicated PBS. For each sample, five videos of 60 s were filmed at the camera level 14 and threshold five. Slide shutter was at 1259 and slider gain at 366. The temperature was set at 25 °C. Software NTA 3.3.- Sample Assistant Dev Build 3.3.203 was used for the detection and analysis.

4.7.3. Transmission Electron Microscopy

Negative contrasting was performed according to Théry et al. [73]. The sEVs were fixed in 2% formaldehyde in 0.1 M sodium phosphate buffer. Five μL droplets were applied to formvar/carbon coated EM grids and dried for 20 min. Grids were put on droplets of PBS and immediately transferred to 1% glutaraldehyde for 5 min. After washing with distilled water, grids were put on droplets of uranyl-oxalate solution for 5 min at room temperature and then on 4% uranyl acetate and 2% methyl cellulose for 10 min on ice. Grids were collected on a loop, excess fluid was blotted off by filter paper, and grids were air dried. Grids were analyzed by a transmission electron microscope (Philips CM100, Philips, Amsterdam, Netherlands), operating at 80 kV.

4.8. Total RNA Isolation from Cells and sEVs

Total RNA was isolated using the mirVana miRNA Isolation Kit (ThermoFisher). Briefly, cells were washed with PBS and 300 μL of Lysis/Binding solution was added. The sEVs were put directly in 300 μL of Lysis/Binding solution. Next, the samples were vortexed and 30 μL of miRNA homogenate was added, vortexed, and incubated on ice for 10 min. Then, 300 μL of Acid-Phenol:Chloroform was added and vortexed for 30 s. The mixture was centrifuged 5 min at 10,000× g. The upper phase was transferred to a new tube and 1.25 volume of 100% ethanol was added. The mixture was transferred to the filter in the collection tube and centrifuged for 15 s at 10,000× g. The flow-through was removed and 700 μL of miRNA wash solution 1 was added and the mixture centrifuged 10 s at 10,000× g. Flow-through was removed again and 500 μL of wash solution 2/3 added, and the mixture was centrifuged 10 s at 10,000× g. Again, the flow-through was removed and 500 μL of wash solution 2/3 added, and the suspension was centrifuged 10 s at 10,000× g. After flow-through removal, with 1 min spin-down, the remaining liquid was removed. The filter was transferred to a new collection tube and total RNA was eluted with 50 μL of water, previously warmed at 95 °C, and the solution was centrifuged 30 s at maximal speed. The concentration of RNA was measured using Synergy H4 (BioTek, Winooski, VT, USA) and the RNA purity was determined using the A260/A280 and A260/A230 ratios.

4.9. Quantification of Cellular and sEV miRNA, and sEV mRNA

The process of miRNA to cDNA synthesis was as follows. First, to remove possible DNA traces RNA was treated with Dnase (0.1 μL; Roche) in 10× DNAse buffer (0.5 μL; Roche) in a total volume of 5 μL. The reaction mixture was incubated for 15 min at 30 °C and 10 min at 75 °C. Then, miRNA was transcribed to cDNA using the TaqMan Advanced miRNA cDNA Synthesis Kit according to the manufacturer’s manual (ThermoFisher Scientific). The qPCR mixture consisted of 2.25 μL of cDNA, 0.25 μL of probes, and 2.5 μL of TaqMan Fast Advanced Master Mix (ThermoFisher Scientific) in a total 5 μL reaction. The settings were as follows: 20 s at 95 °C; 40 cycles of 1 s 95 °C, 20 s 60 °C; hold 4 °C. qPCR was performed using ViiA7 (Applied Biosystems, Life Technologies).
In the case of mRNA, RNA was treated with DNAse (Roche) 15 min at 30 °C and then 10 min at 75 °C. Then, RNA was converted to cDNA with the High Capacity cDNA Reverse Transcription Kit (ThermoFisher) together with RNAse Inhibitor (ThermoFisher) with the following settings: 10 min at 25 °C, 120 min at 37 °C, 5 min at 85 °C. qPCR was performed using ViiA7 (Applied Biosystems, Life Technologies, Waltham, MA, USA). A total reaction volume of 5 μL consisted of 2.5 μL TaqMan Fast Advanced Master Mix (Thermo Fisher), 0.25 of TaqMan Probe (ThermoFisher), and 2.25 μL of cDNA. The settings were as follows: 20 s at 95 °C; 45 cycles of 1 s 95 °C, 20 s 60 °C; hold 4 °C. The experiment was performed with three biological replicates, and each biological replicate was tested in triplicate. The reference genes for miRNA were miR-99a-5p [69] and for mRNA were GAPDH [74], beta-actin [75], and 18s rRNA [76]. All probes are listed in Table 7.

4.10. Statistical Analysis

The analysis of the relative miRNA and mRNA expression was determined as previously described [77]. Briefly, the expression of each of the study genes was normalized to the expression of the reference genes. Statistical significance was determined by a one-way ANOVA for data with a Gaussian distribution and Kruskal–Wallis for data without a Gaussian distribution in statistical tests.

5. Conclusions

GBM is a very complex disease and one of the deadliest types of cancer. Due to the extremely low survival rate, new biomarkers are very much needed that could improve the diagnosis and prognosis and determine the selection of appropriate therapy. The detection of specific RNAs in sEVs could significantly assist in our understanding of extracellular tumor communication and serve as potential and promising biomarkers. In our study, we showed that a higher expression of miR-9-5p and miR-124-3p was related to the sEVs of NCH421k or NCH644 GBM stem cell lines, respectively. Moreover, miR-9-5p was associated with a decreased survival of GBM patients carrying an IDH mutation. miR-21-5p expression could differentiate between GBM and lower-grade glioma and between GBM and reference brain, while miR-124-3p and miR-138-5p presented with a lower expression in GBM with respect to the reference brain tissue. Both miRNAs, miR-124-3p and miR-138-5p, target VIM gene, which was overexpressed in the U251 and U87 glioblastoma cell lines-derived sEVs. We therefore suggest that the VIM mRNA present in sEVs is a specific marker of more differentiated GBM cells compared to stem cells and may serve as a potential biomarker for the characterization of GBM in the body fluids of patients and/or as potential future targets in GBM therapy. Furthermore, miR-9-5p and miR-124-3p may be further explored as potential GBM stem cell biomarkers present in sEVs. miR-9-5p could also be investigated as a prognostic biomarker, indicating the worse survival of glioblastoma patients with an IDH mutation. The further validation of candidate RNAs requires the analysis of a larger cohort of samples and finally, in addition, the substantial validation of the cargo in sEVs from different body fluids (blood, cerebrospinal fluid) of patients with GBM. Finally, in this study, only a few miRNAs and according target genes were included and in order to better characterize glioblastoma sEVs, other novel miRNAs or other RNAs could be investigated, for example, by transcriptome sequencing.

Supplementary Materials

Supplementary materials can be found at https://www.mdpi.com/1422-0067/21/22/8491/s1.

Author Contributions

Conceptualization, R.K.; manuscript writing, A.Z.; sEVs isolation, A.Z., L.R.D., P.P.D.; Western blot, A.Z., L.R.D., P.P.D.; nanoparticle-tracking analysis A.Z.; electron microscopy R.R., S.H.; RNA isolation, qPCR and data analysis A.Z., I.J., N.Š., A.K., L.R.D.; providing and reviewing the tissues J.M.; TCGA in silico analysis—D.N., M.S., A.B.; supervision, R.K.; project administration, R.K.; funding acquisition, R.K., I.J., R.R. All authors have read and agreed to the published version of the manuscript.

Funding

This research and the APC were funded by the Research Programme Grants P1-0390 and P3-0108 from the Slovenian Research Agency (SRA), Young Researcher Grant from SRA to A.Z., the postdoctoral project Z3-1869 from SRA to I.J., and the Interreg EC Project TRANS-GLIOMA (Interreg 2014-2020 V-A It.-Slo., Ref. No. 146).

Acknowledgments

The authors would like to thank Linda Štrus (Institute of Cell Biology, Faculty of Medicine UL) for technical help with electron microscopy. The authors would also like to thank Metka Lenassi, Marija Holcar, and Teja Lavrin (Institute of Biochemistry, Faculty of Medicine UL) for help with the nanoparticle-tracking analysis experiment, and Alja Videtič Paska and Katarina Kouter (Medical Centre for Molecular Biology, Institute of Biochemistry, Faculty of Medicine UL) for their valuable comments regarding qPCR. The authors would also like to thank Boštjan Matos and Andrej Vranič for providing human tissues. The results here are partly based upon data generated by the TCGA Research Network: https://www.cancer.gov/tcga (National Cancer Institute, Bethesda, MD, USA).

Conflicts of Interest

The authors declare no conflict of interest. The funders had no role in the design of the study; in the collection, analysis, or interpretation of data; in the writing of the manuscript; or in the decision to publish the results.

Abbreviations

EVExtracellular vesicle
FDRFalse-discovery rate
FREM2FRAS1-related extracellular matrix protein 2
GBMGlioblastoma
IDHIsocitrate dehydrogenase
LGGLower-grade glioma
MGMTO-6-methylguanine-DNA-methyltransferase
MRIMagnetic-resonance imaging
NAP1L1Nucleosome assembly protein 1-like 1
NCLNucleolin
NTANanoparticle-tracking analysis
sEVSmall extracellular vesicle
SPRY1Protein sprouty homolog 1
VIMVimentin

References

  1. Alexander, B.M.; Cloughesy, T.F. Adult glioblastoma. J. Clin. Oncol. 2017, 35, 2402–2409. [Google Scholar] [CrossRef] [PubMed]
  2. Lin, J.; Zuo, J.; Cui, Y.; Song, C.; Wu, X.; Feng, H.; Li, J.; Li, S.; Xu, Q.; Wei, W.; et al. Characterizing the molecular mechanisms of acquired temozolomide resistance in the u251 glioblastoma cell line by protein microarray. Oncol. Rep. 2018, 39, 2333–2341. [Google Scholar] [CrossRef] [PubMed]
  3. Crocetti, E.; Trama, A.; Stiller, C.; Caldarella, A.; Soffietti, R.; Jaal, J.; Weber, D.C.; Ricardi, U.; Slowinski, J.; Brandes, A.; et al. Epidemiology of glial and non-glial brain tumours in europe. Eur. J. Cancer 2012, 48, 1532–1542. [Google Scholar] [CrossRef] [PubMed]
  4. Weller, M.; Wick, W.; Aldape, K.; Brada, M.; Berger, M.; Pfister, S.M.; Nishikawa, R.; Rosenthal, M.; Wen, P.Y.; Stupp, R.; et al. Glioma. Nat. Rev. Dis. Primers 2015, 1, 15017. [Google Scholar] [CrossRef]
  5. Louis, D.N.; Ohgaki, H.; Wiestler, O.D.; Cavenee, W.K.; Burger, P.C.; Jouvet, A.; Scheithauer, B.W.; Kleihues, P. The 2007 who classification of tumours of the central nervous system. Acta Neuropathol. 2007, 114, 97–109. [Google Scholar] [CrossRef] [Green Version]
  6. Jovcevska, I.; Zottel, A.; Samec, N.; Mlakar, J.; Sorokin, M.; Nikitin, D.; Buzdin, A.A.; Komel, R. High frem2 gene and protein expression are associated with favorable prognosis of idh-wt glioblastomas. Cancers 2019, 11, 1060. [Google Scholar] [CrossRef] [Green Version]
  7. Miranda, A.; Blanco-Prieto, M.; Sousa, J.; Pais, A.; Vitorino, C. Breaching barriers in glioblastoma. Part i: Molecular pathways and novel treatment approaches. Int. J. Pharm. 2017, 531, 372–388. [Google Scholar] [CrossRef]
  8. Zhong, J.; Paul, A.; Kellie, S.J.; O’Neill, G.M. Mesenchymal migration as a therapeutic target in glioblastoma. J. Oncol. 2010, 2010, 430142. [Google Scholar] [CrossRef]
  9. Noroxe, D.S.; Poulsen, H.S.; Lassen, U. Hallmarks of glioblastoma: A systematic review. ESMO Open 2016, 1, e000144. [Google Scholar] [CrossRef]
  10. Taylor, O.G.; Brzozowski, J.S.; Skelding, K.A. Glioblastoma multiforme: An overview of emerging therapeutic targets. Front. Oncol. 2019, 9, 963. [Google Scholar] [CrossRef] [Green Version]
  11. Louis, D.N.; Perry, A.; Reifenberger, G.; von Deimling, A.; Figarella-Branger, D.; Cavenee, W.K.; Ohgaki, H.; Wiestler, O.D.; Kleihues, P.; Ellison, D.W. The 2016 world health organization classification of tumors of the central nervous system: A summary. Acta Neuropathol. 2016, 131, 803–820. [Google Scholar] [CrossRef] [PubMed] [Green Version]
  12. Quinn, J.F.; Patel, T.; Wong, D.; Das, S.; Freedman, J.E.; Laurent, L.C.; Carter, B.S.; Hochberg, F.; Van Keuren-Jensen, K.; Huentelman, M.; et al. Extracellular rnas: Development as biomarkers of human disease. J. Extracell Vesicles 2015, 4, 27495. [Google Scholar] [CrossRef] [PubMed]
  13. Tezcan, G.; Tunca, B.; Bekar, A.; Preusser, M.; Berghoff, A.S.; Egeli, U.; Cecener, G.; Ricken, G.; Budak, F.; Taskapilioglu, M.O.; et al. Microrna expression pattern modulates temozolomide response in gbm tumors with cancer stem cells. Cell Mol. Neurobiol. 2014, 34, 679–692. [Google Scholar] [CrossRef] [PubMed]
  14. Yao, Q.; Chen, Y.; Zhou, X. The roles of micrornas in epigenetic regulation. Curr. Opin. Chem. Biol. 2019, 51, 11–17. [Google Scholar] [CrossRef] [PubMed]
  15. van Niel, G.; D’Angelo, G.; Raposo, G. Shedding light on the cell biology of extracellular vesicles. Nat. Rev. Mol. Cell. Biol. 2018, 19, 213–228. [Google Scholar] [CrossRef]
  16. Quezada, C.; Torres, A.; Niechi, I.; Uribe, D.; Contreras-Duarte, S.; Toledo, F.; San Martin, R.; Gutierrez, J.; Sobrevia, L. Role of extracellular vesicles in glioma progression. Mol. Aspects Med. 2018, 60, 38–51. [Google Scholar] [CrossRef]
  17. Saadatpour, L.; Fadaee, E.; Fadaei, S.; Nassiri Mansour, R.; Mohammadi, M.; Mousavi, S.M.; Goodarzi, M.; Verdi, J.; Mirzaei, H. Glioblastoma: Exosome and microrna as novel diagnosis biomarkers. Cancer Gene Ther. 2016, 23, 415–418. [Google Scholar] [CrossRef]
  18. Thery, C.; Witwer, K.W.; Aikawa, E.; Alcaraz, M.J.; Anderson, J.D.; Andriantsitohaina, R.; Antoniou, A.; Arab, T.; Archer, F.; Atkin-Smith, G.K.; et al. Minimal information for studies of extracellular vesicles 2018 (misev2018): A position statement of the international society for extracellular vesicles and update of the misev2014 guidelines. J. Extracell Vesicles 2018, 7, 1535750. [Google Scholar] [CrossRef] [Green Version]
  19. Vidak, M.; Jovcevska, I.; Samec, N.; Zottel, A.; Liovic, M.; Rozman, D.; Dzeroski, S.; Juvan, P.; Komel, R. Meta-analysis and experimental validation identified frem2 and spry1 as new glioblastoma marker candidates. Int. J. Mol. Sci. 2018, 19, 1369. [Google Scholar] [CrossRef] [Green Version]
  20. Jovcevska, I.; Zupanec, N.; Urlep, Z.; Vranic, A.; Matos, B.; Stokin, C.L.; Muyldermans, S.; Myers, M.P.; Buzdin, A.A.; Petrov, I.; et al. Differentially expressed proteins in glioblastoma multiforme identified with a nanobody-based anti-proteome approach and confirmed by oncofinder as possible tumor-class predictive biomarker candidates. Oncotarget 2017, 8, 44141–44158. [Google Scholar] [CrossRef]
  21. Zottel, A.; Jovčevska, I.; Šamec, N.; Mlakar, J.; Šribar, J.; Križaj, I.; Skoblar Vidmar, M.; Komel, R. Anti-vimentin, anti-tufm, anti-nap1l1 and anti-dpysl2 nanobodies display cytotoxic effect and reduce glioblastoma cell migration. Ther. Adv. Med. Oncol. 2020, 12, 1758835920915302. [Google Scholar] [CrossRef] [PubMed]
  22. Agarwal, V.; Bell, G.W.; Nam, J.W.; Bartel, D.P. Predicting effective microrna target sites in mammalian mrnas. Elife 2015, 4. [Google Scholar] [CrossRef] [PubMed]
  23. Chen, Y.; Wang, X. Mirdb: An online database for prediction of functional microrna targets. Nucleic Acids Res. 2020, 48, D127–D131. [Google Scholar] [CrossRef] [PubMed] [Green Version]
  24. Liu, W.; Wang, X. Prediction of functional microrna targets by integrative modeling of microrna binding and target expression data. Genome Biol. 2019, 20, 18. [Google Scholar] [CrossRef]
  25. Paraskevopoulou, M.D.; Georgakilas, G.; Kostoulas, N.; Vlachos, I.S.; Vergoulis, T.; Reczko, M.; Filippidis, C.; Dalamagas, T.; Hatzigeorgiou, A.G. Diana-microt web server v5.0: Service integration into mirna functional analysis workflows. Nucleic Acids Res. 2013, 41, W169–W173. [Google Scholar] [CrossRef] [Green Version]
  26. Reczko, M.; Maragkakis, M.; Alexiou, P.; Grosse, I.; Hatzigeorgiou, A.G. Functional microrna targets in protein coding sequences. Bioinformatics 2012, 28, 771–776. [Google Scholar] [CrossRef]
  27. Friedman, R.C.; Farh, K.K.; Burge, C.B.; Bartel, D.P. Most mammalian mrnas are conserved targets of micrornas. Genome Res. 2009, 19, 92–105. [Google Scholar] [CrossRef] [Green Version]
  28. Heberle, H.; Meirelles, G.V.; da Silva, F.R.; Telles, G.P.; Minghim, R. Interactivenn: A web-based tool for the analysis of sets through venn diagrams. BMC Bioinf. 2015, 16, 169. [Google Scholar] [CrossRef]
  29. Liao, Y.; Wang, J.; Jaehnig, E.J.; Shi, Z.; Zhang, B. Webgestalt 2019: Gene set analysis toolkit with revamped uis and apis. Nucleic Acids Res. 2019, 47, W199–W205. [Google Scholar] [CrossRef] [Green Version]
  30. Wang, J.; Duncan, D.; Shi, Z.; Zhang, B. Web-based gene set analysis toolkit (webgestalt): Update 2013. Nucleic Acids Res. 2013, 41, W77–W83. [Google Scholar] [CrossRef] [Green Version]
  31. Wang, J.; Vasaikar, S.; Shi, Z.; Greer, M.; Zhang, B. Webgestalt 2017: A more comprehensive, powerful, flexible and interactive gene set enrichment analysis toolkit. Nucleic Acids Res. 2017, 45, W130–W137. [Google Scholar] [CrossRef] [PubMed]
  32. Zhang, B.; Kirov, S.; Snoddy, J. Webgestalt: An integrated system for exploring gene sets in various biological contexts. Nucleic Acids Res. 2005, 33, W741–W748. [Google Scholar] [CrossRef] [PubMed]
  33. Kanehisa, M.; Goto, S. Kegg: Kyoto encyclopedia of genes and genomes. Nucleic Acids Res. 2000, 28, 27–30. [Google Scholar] [CrossRef] [PubMed]
  34. Mi, H.; Muruganujan, A.; Ebert, D.; Huang, X.; Thomas, P.D. Panther version 14: More genomes, a new panther go-slim and improvements in enrichment analysis tools. Nucleic Acids Res. 2019, 47, D419–D426. [Google Scholar] [CrossRef] [PubMed]
  35. Jassal, B.; Matthews, L.; Viteri, G.; Gong, C.; Lorente, P.; Fabregat, A.; Sidiropoulos, K.; Cook, J.; Gillespie, M.; Haw, R.; et al. The reactome pathway knowledgebase. Nucleic Acids Res. 2020, 48, D498–D503. [Google Scholar] [CrossRef] [PubMed]
  36. Szklarczyk, D.; Gable, A.L.; Lyon, D.; Junge, A.; Wyder, S.; Huerta-Cepas, J.; Simonovic, M.; Doncheva, N.T.; Morris, J.H.; Bork, P.; et al. String v11: Protein-protein association networks with increased coverage, supporting functional discovery in genome-wide experimental datasets. Nucleic Acids Res. 2019, 47, D607–D613. [Google Scholar] [CrossRef] [Green Version]
  37. Yin, S.; Chen, F.F.; Yang, G.F. Vimentin immunohistochemical expression as a prognostic factor in gastric cancer: A meta-analysis. Pathol. Res. Pract. 2018, 214, 1376–1380. [Google Scholar] [CrossRef]
  38. Jain, N.; Zhu, H.; Khashab, T.; Ye, Q.; George, B.; Mathur, R.; Singh, R.K.; Berkova, Z.; Wise, J.F.; Braun, F.K.; et al. Targeting nucleolin for better survival in diffuse large b-cell lymphoma. Leukemia 2018, 32, 663–674. [Google Scholar] [CrossRef]
  39. Schimmack, S.; Taylor, A.; Lawrence, B.; Alaimo, D.; Schmitz-Winnenthal, H.; Buchler, M.W.; Modlin, I.M.; Kidd, M. A mechanistic role for the chromatin modulator, nap1l1, in pancreatic neuroendocrine neoplasm proliferation and metastases. Epigen. Chromatin. 2014, 7, 15. [Google Scholar] [CrossRef] [Green Version]
  40. Nagaishi, M.; Kim, Y.H.; Mittelbronn, M.; Giangaspero, F.; Paulus, W.; Brokinkel, B.; Vital, A.; Tanaka, Y.; Nakazato, Y.; Legras-Lachuer, C.; et al. Amplification of the stoml3, frem2, and lhfp genes is associated with mesenchymal differentiation in gliosarcoma. Am. J. Pathol. 2012, 180, 1816–1823. [Google Scholar] [CrossRef]
  41. He, Q.; Jing, H.; Liaw, L.; Gower, L.; Vary, C.; Hua, S.; Yang, X. Suppression of spry1 inhibits triple-negative breast cancer malignancy by decreasing egf/egfr mediated mesenchymal phenotype. Sci. Rep. 2016, 6, 23216. [Google Scholar] [CrossRef] [PubMed] [Green Version]
  42. Masoumi-Moghaddam, S.; Amini, A.; Wei, A.Q.; Robertson, G.; Morris, D.L. Sprouty 1 predicts prognosis in human epithelial ovarian cancer. Am. J. Cancer Res. 2015, 5, 1531–1541. [Google Scholar] [PubMed]
  43. Sullivan, T.B.; Robert, L.C.; Teebagy, P.A.; Morgan, S.E.; Beatty, E.W.; Cicuto, B.J.; Nowd, P.K.; Rieger-Christ, K.M.; Bryan, D.J. Spatiotemporal microrna profile in peripheral nerve regeneration: Mir-138 targets vimentin and inhibits schwann cell migration and proliferation. Neural Regen. Res. 2018, 13, 1253–1262. [Google Scholar] [PubMed]
  44. Liu, X.; Wang, C.; Chen, Z.; Jin, Y.; Wang, Y.; Kolokythas, A.; Dai, Y.; Zhou, X. Microrna-138 suppresses epithelial-mesenchymal transition in squamous cell carcinoma cell lines. Biochem. J. 2011, 440, 23–31. [Google Scholar] [CrossRef] [PubMed] [Green Version]
  45. Schraivogel, D.; Weinmann, L.; Beier, D.; Tabatabai, G.; Eichner, A.; Zhu, J.Y.; Anton, M.; Sixt, M.; Weller, M.; Beier, C.P.; et al. Camta1 is a novel tumour suppressor regulated by mir-9/9* in glioblastoma stem cells. EMBO J. 2011, 30, 4309–4322. [Google Scholar] [CrossRef] [Green Version]
  46. Ben-Hamo, R.; Zilberberg, A.; Cohen, H.; Efroni, S. Hsa-mir-9 controls the mobility behavior of glioblastoma cells via regulation of mapk14 signaling elements. Oncotarget 2016, 7, 23170–23181. [Google Scholar] [CrossRef] [Green Version]
  47. Masliah-Planchon, J.; Garinet, S.; Pasmant, E. Ras-mapk pathway epigenetic activation in cancer: Mirnas in action. Oncotarget 2016, 7, 38892–38907. [Google Scholar] [CrossRef] [Green Version]
  48. An, Z.; Aksoy, O.; Zheng, T.; Fan, Q.W.; Weiss, W.A. Epidermal growth factor receptor and egfrviii in glioblastoma: Signaling pathways and targeted therapies. Oncogene 2018, 37, 1561–1575. [Google Scholar] [CrossRef]
  49. Lange, A.M.; Lo, H.W. Inhibiting trk proteins in clinical cancer therapy. Cancers 2018, 10, 105. [Google Scholar] [CrossRef] [Green Version]
  50. Munoz, J.L.; Bliss, S.A.; Greco, S.J.; Ramkissoon, S.H.; Ligon, K.L.; Rameshwar, P. Delivery of functional anti-mir-9 by mesenchymal stem cell-derived exosomes to glioblastoma multiforme cells conferred chemosensitivity. Mol. Ther. Nucleic Acids 2013, 2, e126. [Google Scholar] [CrossRef]
  51. Sharifzad, F.; Ghavami, S.; Verdi, J.; Mardpour, S.; Mollapour Sisakht, M.; Azizi, Z.; Taghikhani, A.; Los, M.J.; Fakharian, E.; Ebrahimi, M.; et al. Glioblastoma cancer stem cell biology: Potential theranostic targets. Drug Resist. Updat 2019, 42, 35–45. [Google Scholar] [CrossRef] [PubMed]
  52. Aldaz, B.; Sagardoy, A.; Nogueira, L.; Guruceaga, E.; Grande, L.; Huse, J.T.; Aznar, M.A.; Diez-Valle, R.; Tejada-Solis, S.; Alonso, M.M.; et al. Involvement of mirnas in the differentiation of human glioblastoma multiforme stem-like cells. PLoS ONE 2013, 8, e77098. [Google Scholar] [CrossRef] [PubMed] [Green Version]
  53. Godlewski, J.; Newton, H.B.; Chiocca, E.A.; Lawler, S.E. Micrornas and glioblastoma; the stem cell connection. Cell Death Differ. 2010, 17, 221–228. [Google Scholar] [CrossRef] [PubMed] [Green Version]
  54. Akers, J.C.; Ramakrishnan, V.; Kim, R.; Skog, J.; Nakano, I.; Pingle, S.; Kalinina, J.; Hua, W.; Kesari, S.; Mao, Y.; et al. Mir-21 in the extracellular vesicles (evs) of cerebrospinal fluid (csf): A platform for glioblastoma biomarker development. PLoS ONE 2013, 8, e78115. [Google Scholar] [CrossRef] [PubMed]
  55. Le Rhun, E.; Preusser, M.; Roth, P.; Reardon, D.A.; van den Bent, M.; Wen, P.; Reifenberger, G.; Weller, M. Molecular targeted therapy of glioblastoma. Cancer Treat. Rev. 2019, 80, 101896. [Google Scholar] [CrossRef] [PubMed]
  56. Tuncel, G.; Kalkan, R. Receptor tyrosine kinase-ras-pi 3 kinase-akt signaling network in glioblastoma multiforme. Med. Oncol. 2018, 35, 122. [Google Scholar] [CrossRef] [PubMed]
  57. Sachdeva, R.; Wu, M.; Johnson, K.; Kim, H.; Celebre, A.; Shahzad, U.; Graham, M.S.; Kessler, J.A.; Chuang, J.H.; Karamchandani, J.; et al. Bmp signaling mediates glioma stem cell quiescence and confers treatment resistance in glioblastoma. Sci. Rep. 2019, 9, 14569. [Google Scholar] [CrossRef]
  58. Cheng, L.C.; Pastrana, E.; Tavazoie, M.; Doetsch, F. Mir-124 regulates adult neurogenesis in the subventricular zone stem cell niche. Nat. Neurosci. 2009, 12, 399–408. [Google Scholar] [CrossRef] [Green Version]
  59. Lang, M.F.; Yang, S.; Zhao, C.; Sun, G.; Murai, K.; Wu, X.; Wang, J.; Gao, H.; Brown, C.E.; Liu, X.; et al. Genome-wide profiling identified a set of mirnas that are differentially expressed in glioblastoma stem cells and normal neural stem cells. PLoS ONE 2012, 7, e36248. [Google Scholar] [CrossRef]
  60. Milanovic, M.; Fan, D.N.Y.; Belenki, D.; Dabritz, J.H.M.; Zhao, Z.; Yu, Y.; Dorr, J.R.; Dimitrova, L.; Lenze, D.; Monteiro Barbosa, I.A.; et al. Senescence-associated reprogramming promotes cancer stemness. Nature 2018, 553, 96–100. [Google Scholar] [CrossRef] [Green Version]
  61. Jiang, W.; Finniss, S.; Cazacu, S.; Xiang, C.; Brodie, Z.; Mikkelsen, T.; Poisson, L.; Shackelford, D.B.; Brodie, C. Repurposing phenformin for the targeting of glioma stem cells and the treatment of glioblastoma. Oncotarget 2016, 7, 56456–56470. [Google Scholar] [CrossRef] [PubMed] [Green Version]
  62. Ferrarese, R.; Harsh, G.R.t.; Yadav, A.K.; Bug, E.; Maticzka, D.; Reichardt, W.; Dombrowski, S.M.; Miller, T.E.; Masilamani, A.P.; Dai, F.; et al. Lineage-specific splicing of a brain-enriched alternative exon promotes glioblastoma progression. J. Clin. Investig. 2014, 124, 2861–2876. [Google Scholar] [CrossRef] [PubMed] [Green Version]
  63. Yeh, M.; Oh, C.S.; Yoo, J.Y.; Kaur, B.; Lee, T.J. Pivotal role of microrna-138 in human cancers. Am. J. Cancer Res. 2019, 9, 1118–1126. [Google Scholar] [PubMed]
  64. Sha, H.H.; Wang, D.D.; Chen, D.; Liu, S.W.; Wang, Z.; Yan, D.L.; Dong, S.C.; Feng, J.F. Mir-138: A promising therapeutic target for cancer. Tumour. Biol. 2017, 39, 1010428317697575. [Google Scholar] [CrossRef] [Green Version]
  65. Qiu, S.; Huang, D.; Yin, D.; Li, F.; Li, X.; Kung, H.F.; Peng, Y. Suppression of tumorigenicity by microrna-138 through inhibition of ezh2-cdk4/6-prb-e2f1 signal loop in glioblastoma multiforme. Biochim. Biophys. Acta 2013, 1832, 1697–1707. [Google Scholar] [CrossRef] [Green Version]
  66. Zhao, J.; Zhang, L.; Dong, X.; Liu, L.; Huo, L.; Chen, H. High expression of vimentin is associated with progression and a poor outcome in glioblastoma. Appl. Immunohistochem. Mol. Morphol. 2018, 26, 337–344. [Google Scholar] [CrossRef]
  67. Quick, Q.; Paul, M.; Skalli, O. Roles and potential clinical applications of intermediate filament proteins in brain tumors. Semin. Pediatr. Neurol. 2015, 22, 40–48. [Google Scholar] [CrossRef]
  68. Trendowski, M. Exploiting the cytoskeletal filaments of neoplastic cells to potentiate a novel therapeutic approach. Biochim. Biophys. Acta 2014, 1846, 599–616. [Google Scholar] [CrossRef] [Green Version]
  69. Barbagallo, D.; Condorelli, A.; Ragusa, M.; Salito, L.; Sammito, M.; Banelli, B.; Caltabiano, R.; Barbagallo, G.; Zappala, A.; Battaglia, R.; et al. Dysregulated mir-671-5p/cdr1-as/cdr1/vsnl1 axis is involved in glioblastoma multiforme. Oncotarget 2016, 7, 4746–4759. [Google Scholar] [CrossRef]
  70. Anaya, J. Oncolnc: Linking tcga survival data to mrnas, mirnas, and lncrnas. PeerJ Comput. Sci. 2016, 2, e67. [Google Scholar] [CrossRef] [Green Version]
  71. Grossman, R.L.; Heath, A.P.; Ferretti, V.; Varmus, H.E.; Lowy, D.R.; Kibbe, W.A.; Staudt, L.M. Toward a shared vision for cancer genomic data. N. Engl. J. Med. 2016, 375, 1109–1112. [Google Scholar] [CrossRef]
  72. Stok, U.; Blokar, E.; Lenassi, M.; Holcar, M.; Frank-Bertoncelj, M.; Erman, A.; Resnik, N.; Sodin-Semrl, S.; Cucnik, S.; Pirkmajer, K.P.; et al. Characterization of plasma-derived small extracellular vesicles indicates ongoing endothelial and platelet activation in patients with thrombotic antiphospholipid syndrome. Cells 2020, 9, 1211. [Google Scholar] [CrossRef]
  73. Thery, C.; Amigorena, S.; Raposo, G.; Clayton, A. Isolation and characterization of exosomes from cell culture supernatants and biological fluids. Curr. Protoc. Cell Biol. 2006, 3. [Google Scholar] [CrossRef] [PubMed]
  74. Manda, S.V.; Kataria, Y.; Tatireddy, B.R.; Ramakrishnan, B.; Ratnam, B.G.; Lath, R.; Ranjan, A.; Ray, A. Exosomes as a biomarker platform for detecting epidermal growth factor receptor-positive high-grade gliomas. J. Neurosurg. 2018, 128, 1091–1101. [Google Scholar] [CrossRef] [PubMed] [Green Version]
  75. Rohn, G.; Koch, A.; Krischek, B.; Stavrinou, P.; Goldbrunner, R.; Timmer, M. Actb and sdha are suitable endogenous reference genes for gene expression studies in human astrocytomas using quantitative rt-pcr. Technol. Cancer Res. Treat. 2018, 17, 1533033818802318. [Google Scholar] [CrossRef]
  76. Blazquez, C.; Salazar, M.; Carracedo, A.; Lorente, M.; Egia, A.; Gonzalez-Feria, L.; Haro, A.; Velasco, G.; Guzman, M. Cannabinoids inhibit glioma cell invasion by down-regulating matrix metalloproteinase-2 expression. Cancer Res. 2008, 68, 1945–1952. [Google Scholar] [CrossRef] [PubMed] [Green Version]
  77. Vandesompele, J.; De Preter, K.; Pattyn, F.; Poppe, B.; Van Roy, N.; De Paepe, A.; Speleman, F. Accurate normalization of real-time quantitative rt-pcr data by geometric averaging of multiple internal control genes. Genome Biol. 2002, 3, RESEARCH0034. [Google Scholar] [CrossRef] [Green Version]
Figure 1. Venn diagrams of number of candidate miRNA target genes obtained from the TargetScan, miRDB, and microT-CDS datasets.
Ijms 21 08491 g001
Figure 2. Relative expression levels of miRNA in glioblastoma, LGG, and reference brain tissues. * p < 0.05, and **** p < 0.0001. Results are presented as mean, and standard deviation as error bars. LGG—lower-grade glioma.
Ijms 21 08491 g002
Figure 3. Survival analysis in GBM patients based on the expression levels of miRNAs (miR-9-5p, miR-21-5p, miR-124-3p, miR-138-5p, and miR-1-3p) and IDH mutation status in GBM tumor tissues. (a) miR-9-5p, (b) miR-21-5p, (c) miR-124-3p, (d) miR-138-5p, (e) miR-1-3p. GBM—glioblastoma.
Ijms 21 08491 g003
Figure 4. Molecular characterization of sEVs isolated from normal astrocytes and GBM cell lines. (a) Western blot of cell and sEV lysates. Antibodies directed against proteins enriched in sEVs (HSP70, flotillin-1, CD9) and against a marker for endoplasmic reticulum (calnexin) were used. (b) Mean size of sEVs was determined by nanoparticle-tracking analysis. (c) Transmission electron microscopy images of sEVs. Scale bare is 100 nm. sEVs—small extracellular vesicles.
Ijms 21 08491 g004
Figure 5. Relative miRNA expression in GBM cell lines and normal astrocytes and in their corresponding sEVs. Results are presented as mean, and standard deviation as error bars. (a) miR-9-5p, (b) miR-21-5p, (c) miR-124-3p, (d) miR-138-5p, (e) miR-1-3p. * p < 0.05, ** p < 0.01, *** p < 0.001, and **** p < 0.0001. For the miR-124-3p in sEVs, data normalized to the reference gene are presented, because the expression of miR-124-3p in the sEVs of astrocytes was below the detection threshold. GBM—glioblastoma. sEVs—small extracellular vesicles.
Ijms 21 08491 g005
Figure 6. Relative mRNA expression in GBM and normal astrocyte sEVs. Results are presented as mean, and error bars represent standard deviation. * p < 0.05, *** p < 0.001, and **** p < 0.0001. FREM2 sEVs 1—data normalized to reference gene are not presented, as the expression of FREM2 in sEVs of astrocytes was under the detection threshold. GBM—glioblastoma. sEVs—small extracellular vesicles.
Ijms 21 08491 g006
Table 1. Candidate miRNAs with the corresponding target mRNA determined by the TargetScan, miRDB, and microT-CDS datasets.
miRNAGeneTargetScan
(Aggregate Pct)
miRDB
(Target Score)
microT-CDS
(miTG Score)
hsa-miR-9-5pFREM20.96900.99
NAP1L10.91740.92
hsa-miR-21-5pSPRY10.70950.96
hsa-miR-124-3pVIM0.86910.74
NAP1L10.92610.82
SPRY10.87X0.72
hsa-miR-138-5pVIM0.7094X
NCLXX0.80
hsa-miR-1-3pNCL0.98901
The prediction probability of miRNA–mRNA pair formation was determined by aggregate Pct (TargetScan), target score (miRDB), and miTG score (microT-CDS). Pct—probability of preferentially conserved targeting (ranging from 0 to 1) [27]. miTG—target prediction score. X—no results obtained.
Table 2. Pathway analysis of common genes analyzed by WebGestalt (KEGG, Panther, and Reactome databases).
DescriptionFDR DescriptionFDR
miR-9-5pKEGGFocal adhesion0.021miR-124-3pKEGGApelin signaling pathway0.012
Prostate cancer0.021Cellular senescence0.012
ErbB signaling pathway0.021Axon guidance0.012
Cellular senescence0.021Pathways in cancer0.012
Regulation of actin cytoskeleton0.021Pantherx
MicroRNAs in cancer0.021ReactomeReceptor-type tyrosine-protein phosphatases0.031
Neurotrophin signaling pathway0.021NOTCH2 Activation and Transmission of Signal to the Nucleus0.031
Hepatocellular carcinoma0.021Semaphorin interactions0.031
PantherRas Pathway0.009Signaling by Receptor Tyrosine Kinases0.031
ReactomeX Signaling by MET0.031
MiR-21-5pKEGGProteoglycans in cancer0.019MiR-138-5pKEGGX
Ras signaling pathway0.032PantherX
MicroRNAs in cancer0.038ReactomeX
Neurotrophin signaling pathway0.043MiR-1-3pKEGGMicroRNAs in cancer0.000
EGFR tyrosine kinase inhibitor resistance0.043Adherens junction0.010
PantherX Bacterial invasion of epithelial cells0.010
ReactomeSignaling by NTRK2 (TRKB)2.62 × 10⁻³Axon guidance0.029
Signaling by NTRKs2.62 × 10−3Proteoglycans in cancer0.029
Signaling by BMP2.69 × 10−3EGFR tyrosine kinase inhibitor resistance0.035
Signaling by Receptor Tyrosine Kinases4.94 × 10−3Choline metabolism in cancer0.035
MET activates PI3K/AKT signaling4.94 × 10−3Regulation of actin cytoskeleton0.035
PI-3K cascade:FGFR35.14 × 10−3Hepatitis B0.035
PI-3K cascade:FGFR45.97 × 10−3Cocaine addiction0.042
Signaling by FGFR35.97 × 10−3Viral carcinogenesis0.042
Signaling by FGFR45.97 × 10−3Renal cell carcinoma0.042
Signaling by EGFR5.97 × 10−3Hippo signaling pathway0.042
Signaling by FGFR3 in disease5.97 × 10−3Spliceosome0.043
Signaling by FGFR3 point mutants in cancer5.97 × 10−3Human papillomavirus infection0.044
PI-3K cascade:FGFR26.63 × 10−3Thyroid cancer0.044
Downstream signaling of activated FGFR38.67 × 10−3Cellular senescence0.044
Signaling by FGFR3 fusions in cancer9.29 × 10−3Pathogenic Escherichia coli infection0.044
Signaling by FGFR19.29 × 10−3PantherX
Downstream signaling of activated FGFR49.77 × 10−3ReactomeSignaling by Receptor Tyrosine Kinases0.000
Signaling by FGFR4 in disease0.010Clathrin-mediated endocytosis0.010
GAB1 signalosome0.010RHO GTPases Activate WASPs and WAVEs0.010
PIP3 activates AKT signaling0.010Signaling by VEGF0.013
Downstream signaling of activated FGFR20.012RNA Polymerase II Transcription0.028
Signaling by FGFR in disease0.020VEGFA-VEGFR2 Pathway0.028
Intracellular signaling by second messengers0.022Gene expression (Transcription)0.035
MAPK family signaling cascades0.022Signaling by RAS mutants0.035
Signaling by TGF-beta family members0.022Diseases of signal transduction0.035
Signaling by FGFR1 in disease0.025EPH-Ephrin signaling0.041
Interleukin-4 and Interleukin-13 signaling0.028Generic Transcription Pathway0.041
Constitutive Signaling by Aberrant PI3K in Cancer0.028Platelet activation, signaling and aggregation0.042
Signaling by FGFR20.031RHO GTPase Effectors0.042
Signaling by FGFR2 in disease0.034EPHB-mediated forward signaling0.042
Diseases of signal transduction0.034Hemostasis0.045
Generic Transcription Pathway0.035Regulation of actin dynamics for phagocytic cup formation0.048
PI3K Cascade0.035Membrane Trafficking0.049
Signaling by NODAL0.038
Gene expression (Transcription)0.038
MET activates PTPN110.039
PI-3K cascade:FGFR10.040
IRS-mediated signalling0.042
Pathways directly involved in cancer are marked in bold. Each miRNA section is separated by color. X—no results obtained. KEKEGG, Pa—Panther, ReReactome.
Table 3. Statistical analysis of the qPCR results of miRNA expression in GBM, LGG, and reference brain tissue samples.
miRNATissuesSignificancep-Value
miR-9-5p ns
miR-21-5pGBM vs. LGG*0.0146
GBM vs. reference brain tissue****<0.0001
miR-124-3pGBM vs. reference brain tissue*0.0178
GBM vs. LGG*0.0278
miR-138-5pGBM vs. reference brain tissue*0.0143
miR-1-3p ns
* p < 0.05, **** p < 0.0001, ns – non significant. GBM—glioblastoma; LGG—lower-grade glioma.
Table 4. Statistical analysis of the qPCR results of the miRNA expression in sEVs and originating cells.
miRNAsEVCell
miR-9-5pU251 vs. NCH421k**0.0048U251 vs. U87**0.0028
U87 vs. NCH644*0.0362U251 vs. NCH421k****<0.0001
U87 vs. NCH421k****<0.0001U87 vs. NCH644*0.0284
NCH644 vs. NCH421k****<0.0001U87 vs. NCH421k****<0.0001
NCH421k vs. astrocytes****<0.0001NCH644 vs. NCH421k****<0.0001
NCH421k vs. astrocytes****<0.0001
miR-21-5pns NCH644 vs. astrocytes**0.0052
NCH421k vs. astrocytes**0.0042
miR-124-3pU251 vs. NCH644****<0.0001U251 vs. NCH644****<0.0001
U87 vs. NCH644****<0.0001U251 vs. NCH421k**0.0092
NCH644 vs. NCH421k***0.0002U87 vs. NCH644**0.0028
NCH644 vs. astrocytes****<0.0001NCH644 vs. astrocytes****<0.0001
NCH421k vs. astrocytes**0.0075
miR-138-5pU251 vs. U87*0.0301U251 vs. U87****<0.0001
U87 vs. NCH644****<0.0001
U87 vs. NCH421k****<0.0001
U87 vs. astrocytes****<0.0001
miR-1-3pns U87 vs. NCH421k***0.0007
U251 vs. U87*0.013
NCH644 vs. NCH421k*0.0242
NCH421k vs. astrocytes*0.0140
* p < 0.05, ** p < 0.01, *** p < 0.001, and **** p < 0.0001; ns—non-significant.
Table 5. Statistical analysis of the qPCR results of the mRNA expression in sEVs.
GeneCellsSignificancep-Value
NAP1L1U251 vs. U87*0.0466
U251 vs. astrocytes***0.0002
NCH644 vs. astrocytes*0.0300
VIMU251 vs. NCH644****<0.0001
U251 vs. astrocytes****<0.0001
U87 vs. NCH644***0.0003
U87 vs. astrocytes****<0.0001
NCLNCH644 vs. U87*0.0418
* p < 0.05, *** p < 0.001, and **** p < 0.0001. The results for FREM2 and SPRY1 genes are not presented because there were no statistical differences observed.
Table 6. Summary of significant results. Arrows indicate the upregulation or downregulation of specific RNA.
miRNA or mRNAsEVsCell LinesTissue
miR-9-5p miRNA↑ NCH421k↑ NCH421k↑ associated with the poor survival of IDH mutant GBM patients
↓ associated with the better survival of GBM patients (regardless of IDH mutation)
miR-21-5p miRNA/↓ NCH421k, NCH644↑ GBM vs. LGG, reference tissue
miR-124-3p miRNA↑ NCH644↑ NCH421k, NCH644↓ GBM vs. LGG, reference tissue
miR-138-5p miRNA//↓ GBM vs. reference tissue
↑ associated with the poor survival of IDH mutant GBM patients
VIM mRNA↑ U251, U87/
IDH—isocitrate dehydrogenase; GBM—glioblastoma; LGG—lower-grade glioma. ↑—higher expression, ↓—lower expression.
Table 7. List of the TaqMan probes used in the experiments. All the probes are from ThermoFisher.
miRNAAssay
miR-9-5p478214_mir
miR-21-5p477975_mir
miR-124-3p480901_mir
miR-138-5p477905_mir
miR-1-3p477820_mir
miR-99a-5p478519_mir
SPRY1Hs00398096_m1
vimentinHs00958111_m1
FREM2Hs01388268_m1
NAP1L1Hs01590181_g1
nucleolinHs01066668_m1
GAPDHHs99999905_m1
18SHs99999901_s1
Beta-actinHs99999903_m1
Publisher’s Note: MDPI stays neutral with regard to jurisdictional claims in published maps and institutional affiliations.

