Alpha-Carbonic Anhydrases from Hydrothermal Vent Sources as Potential Carbon Dioxide Sequestration Agents: In Silico Sequence, Structure and Dynamics Analyses


Abstract
:
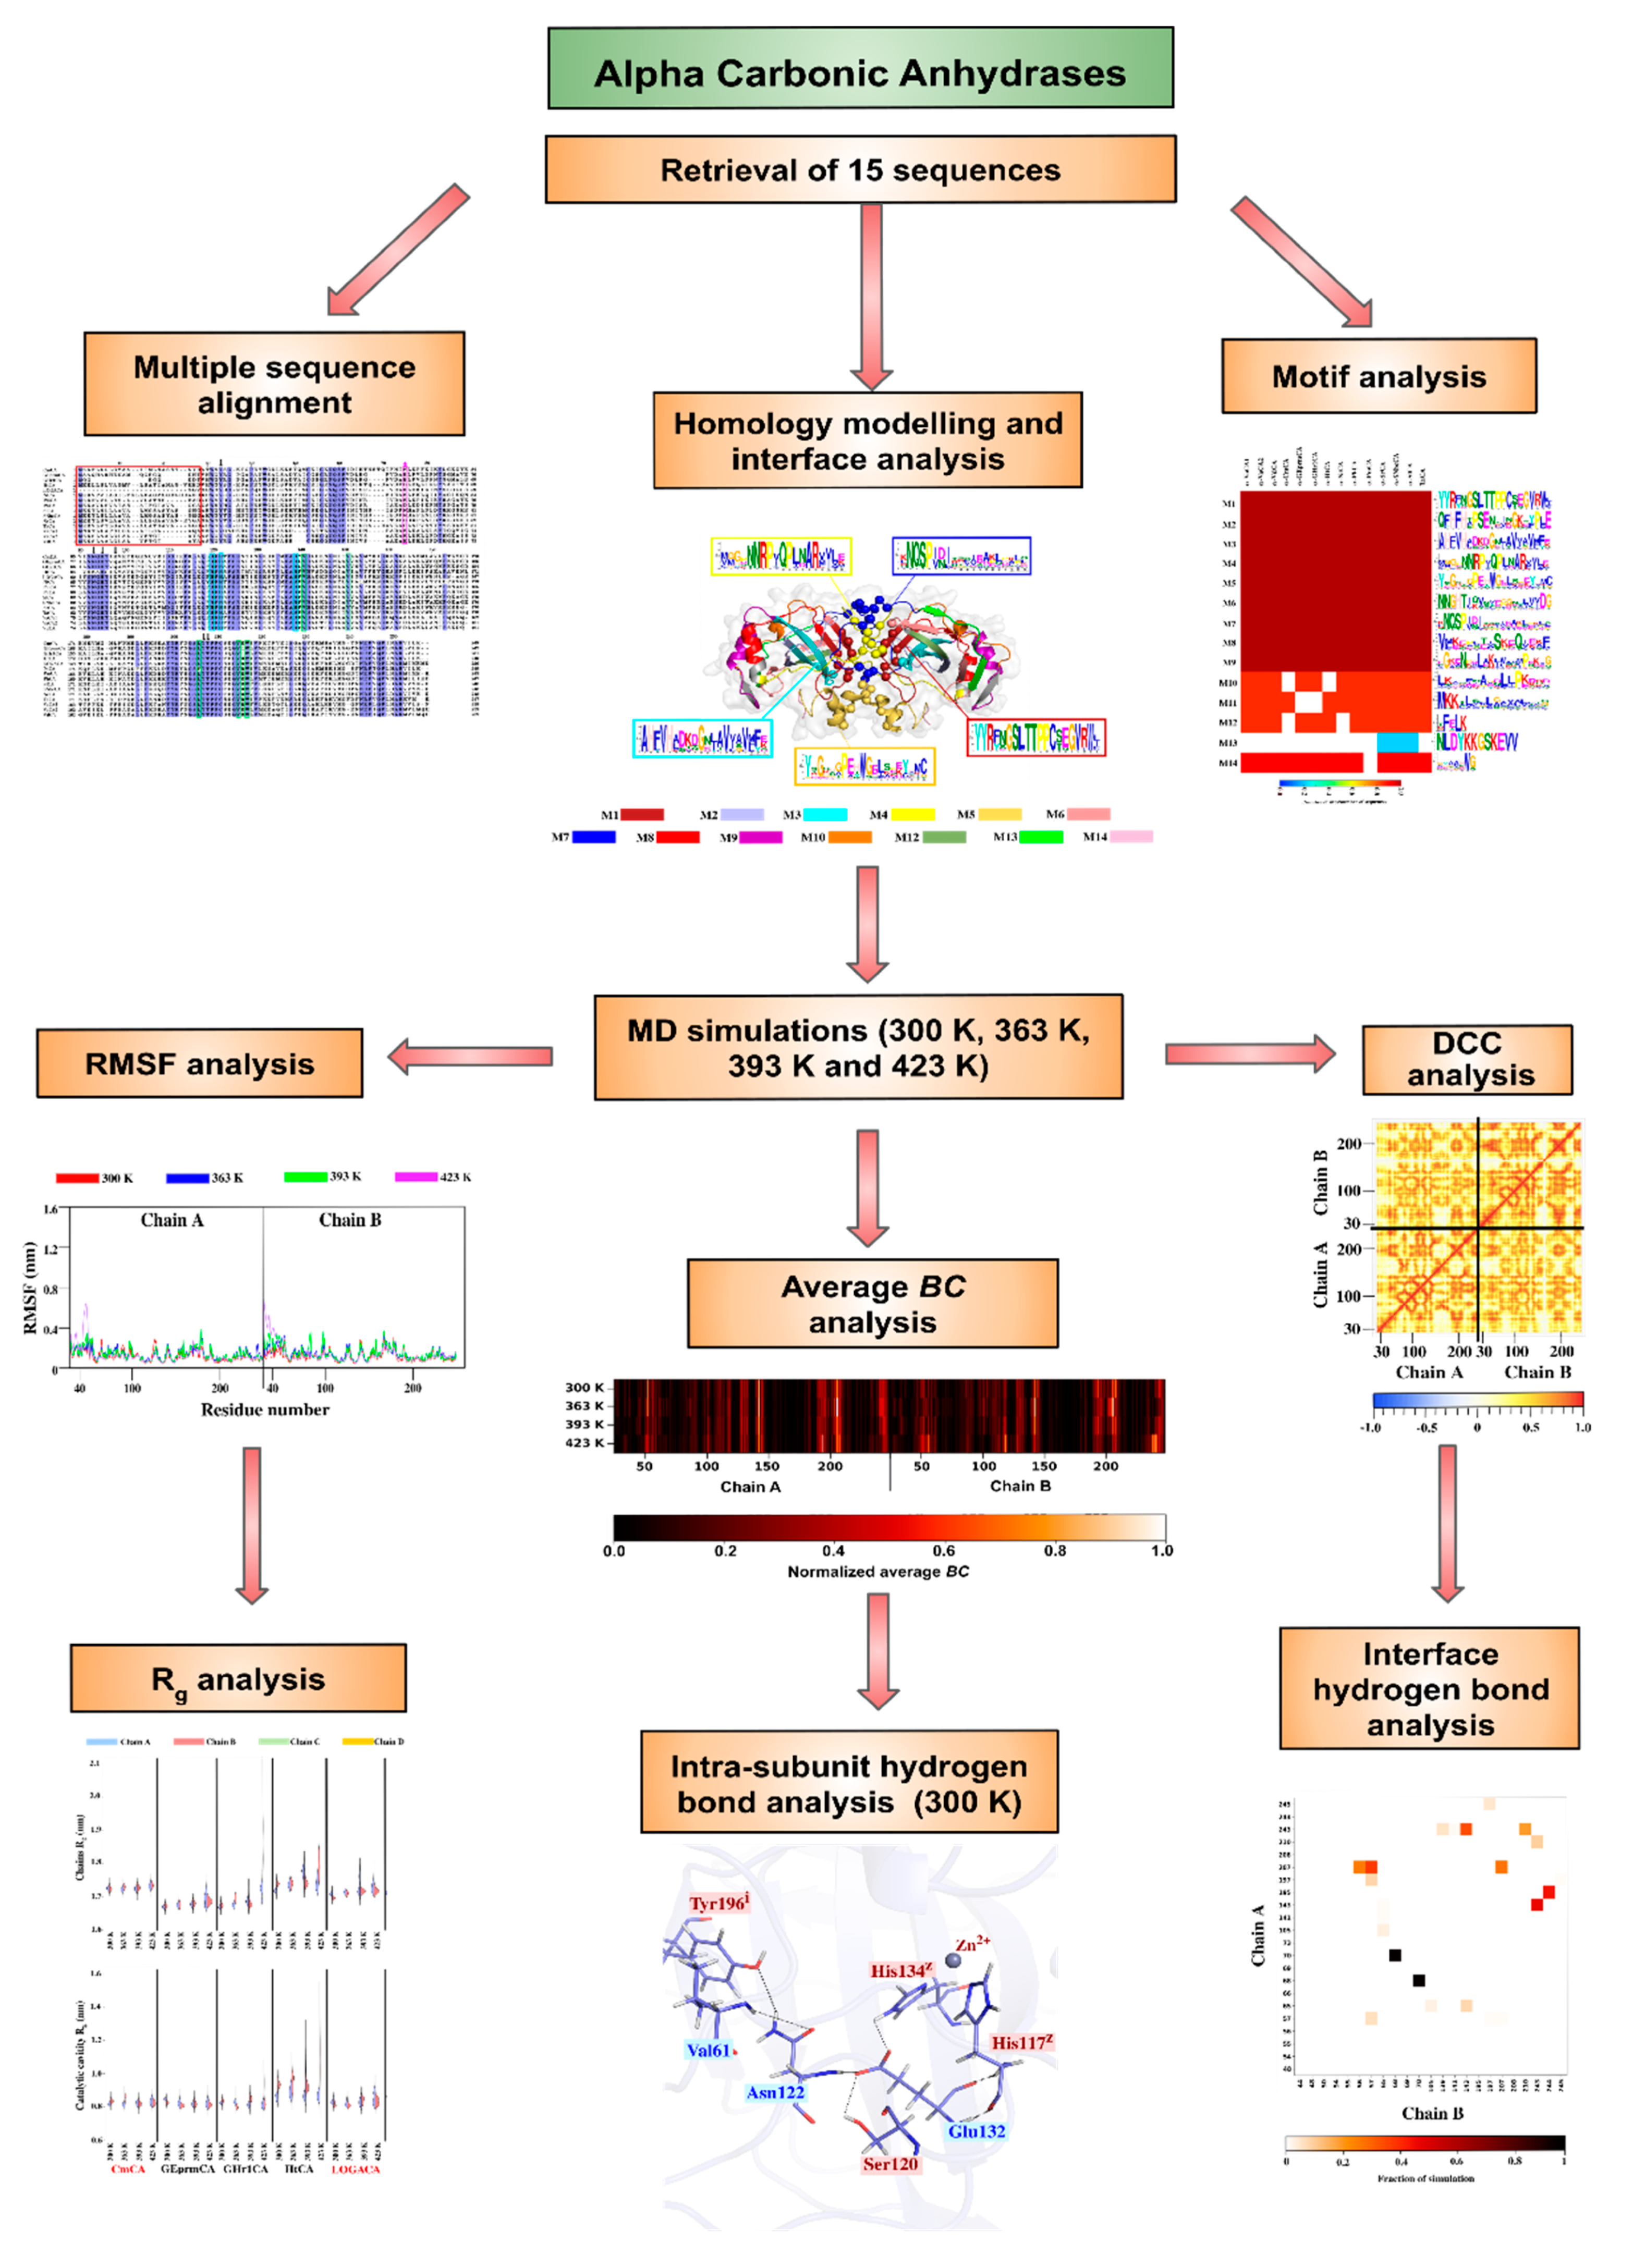
1. Introduction
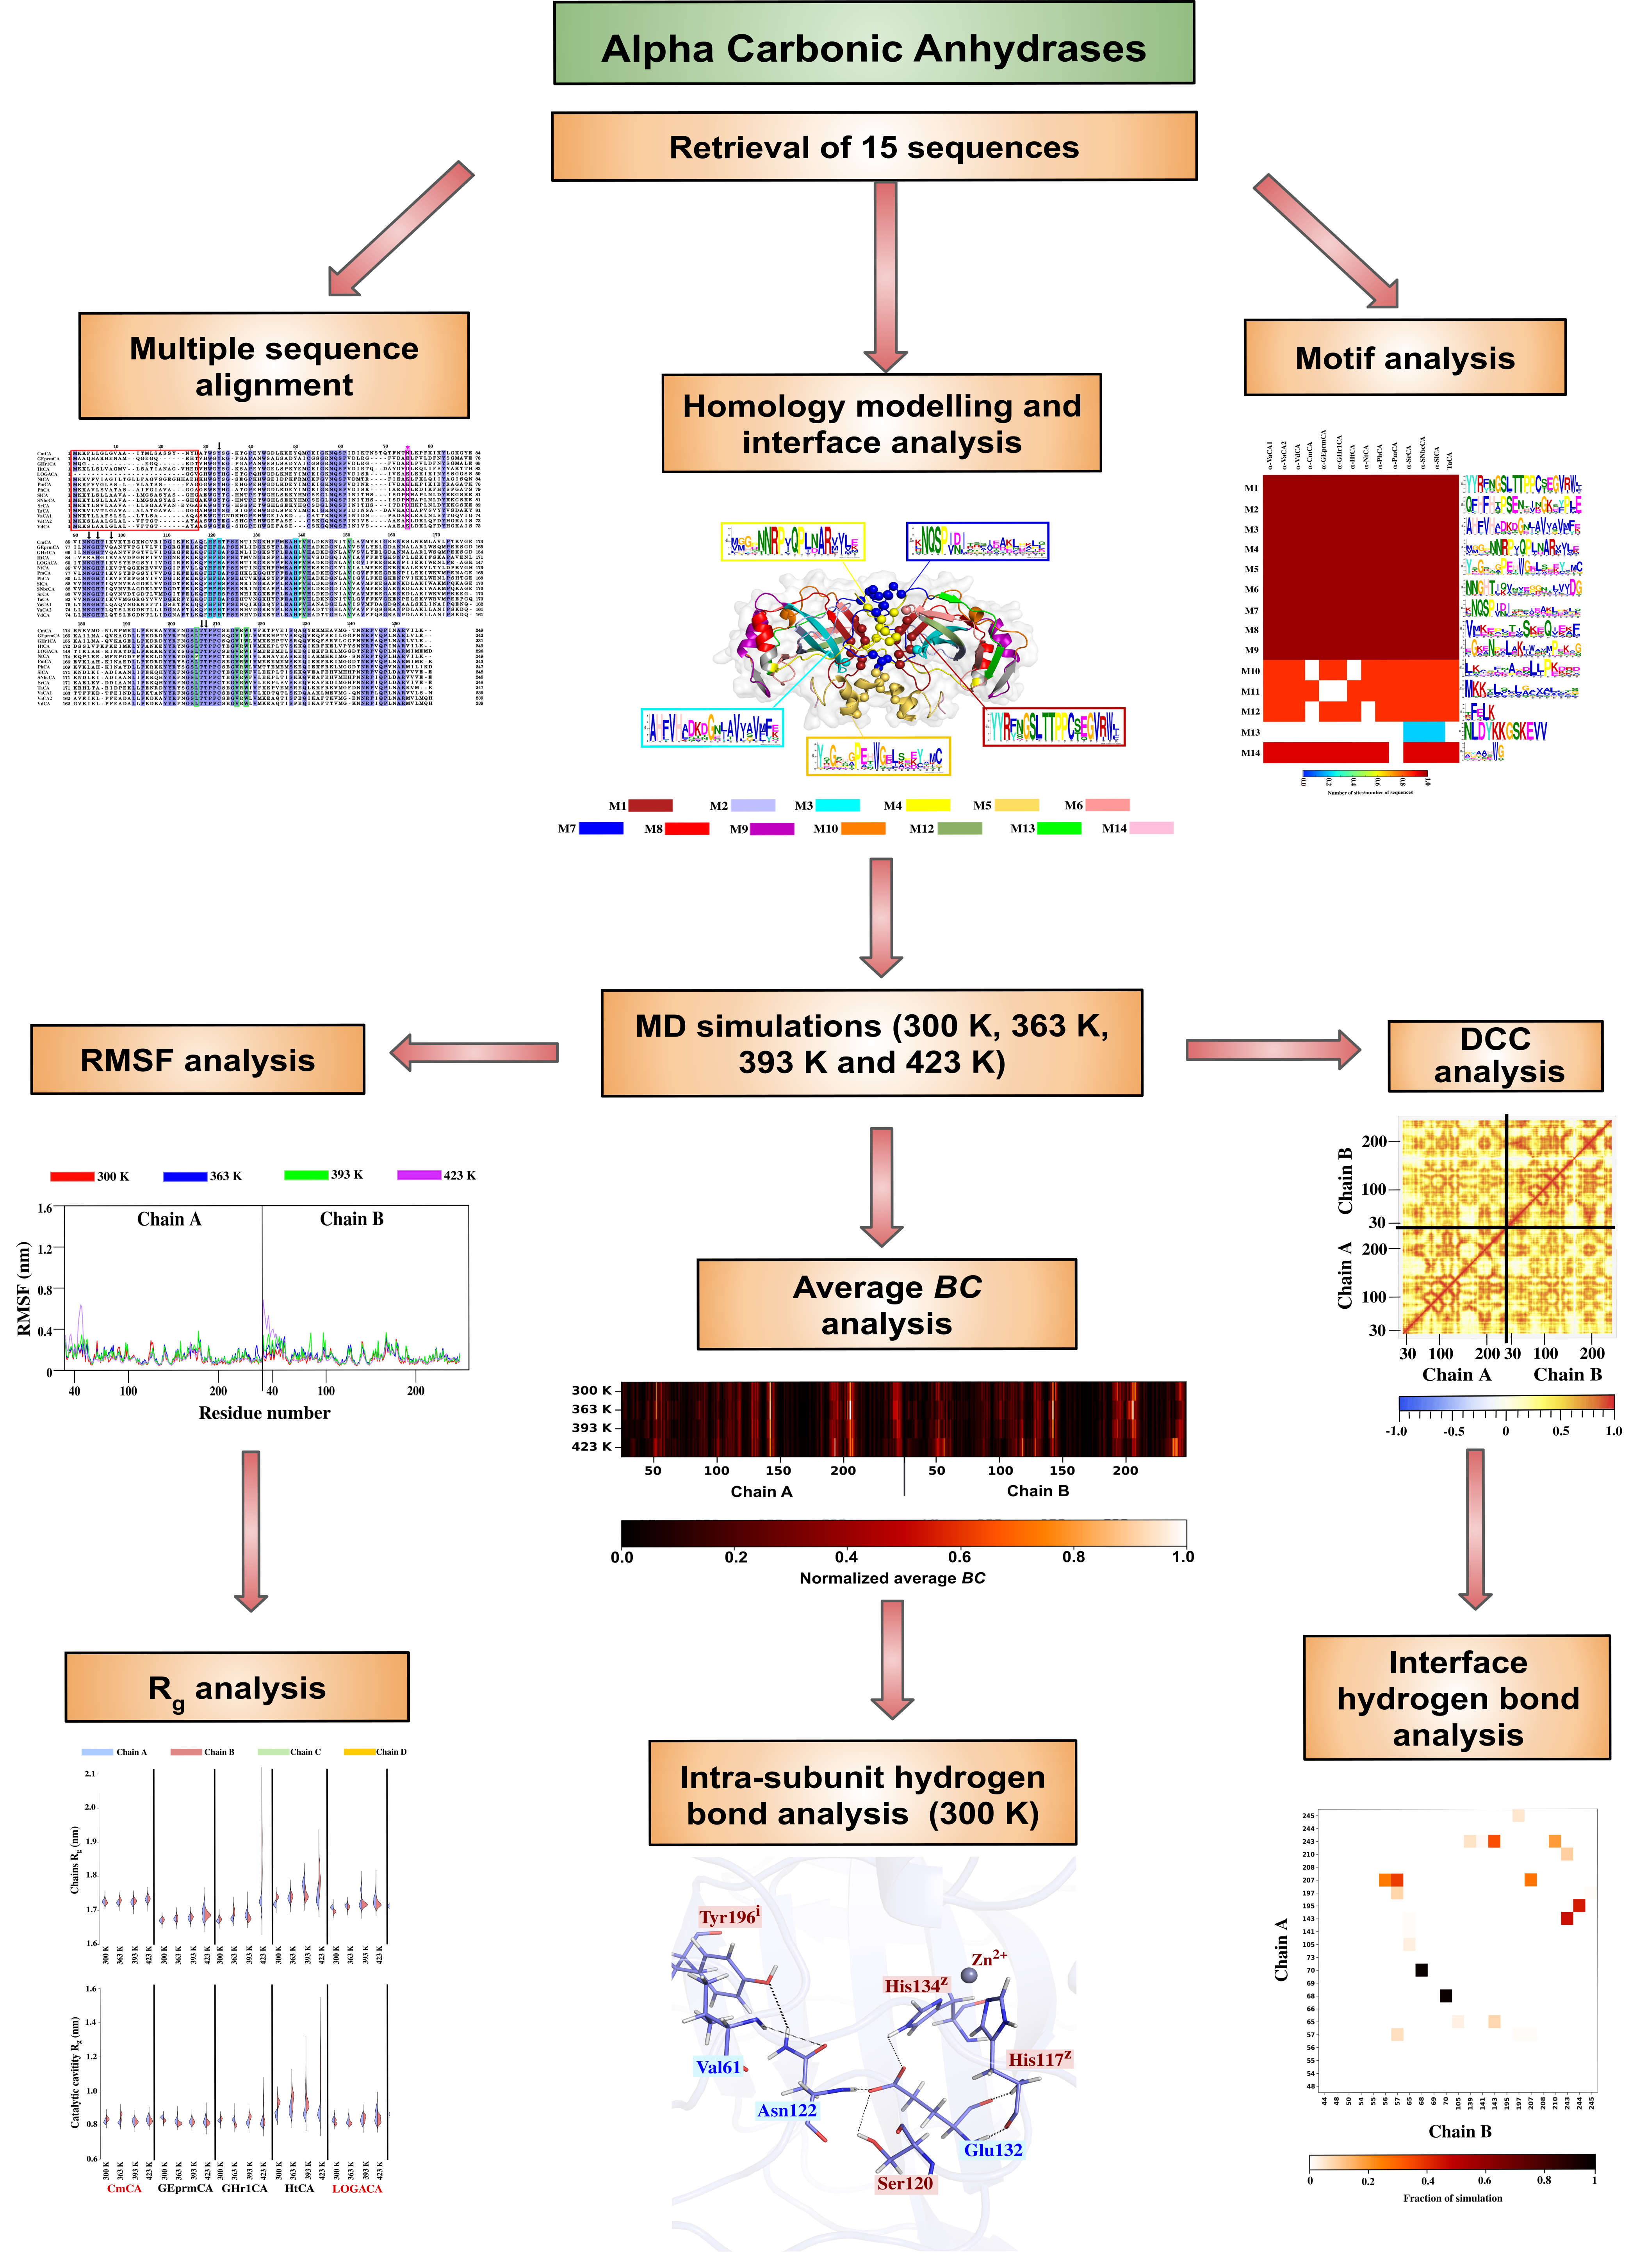
2. Results and Discussion
2.1. Sequence Analysis
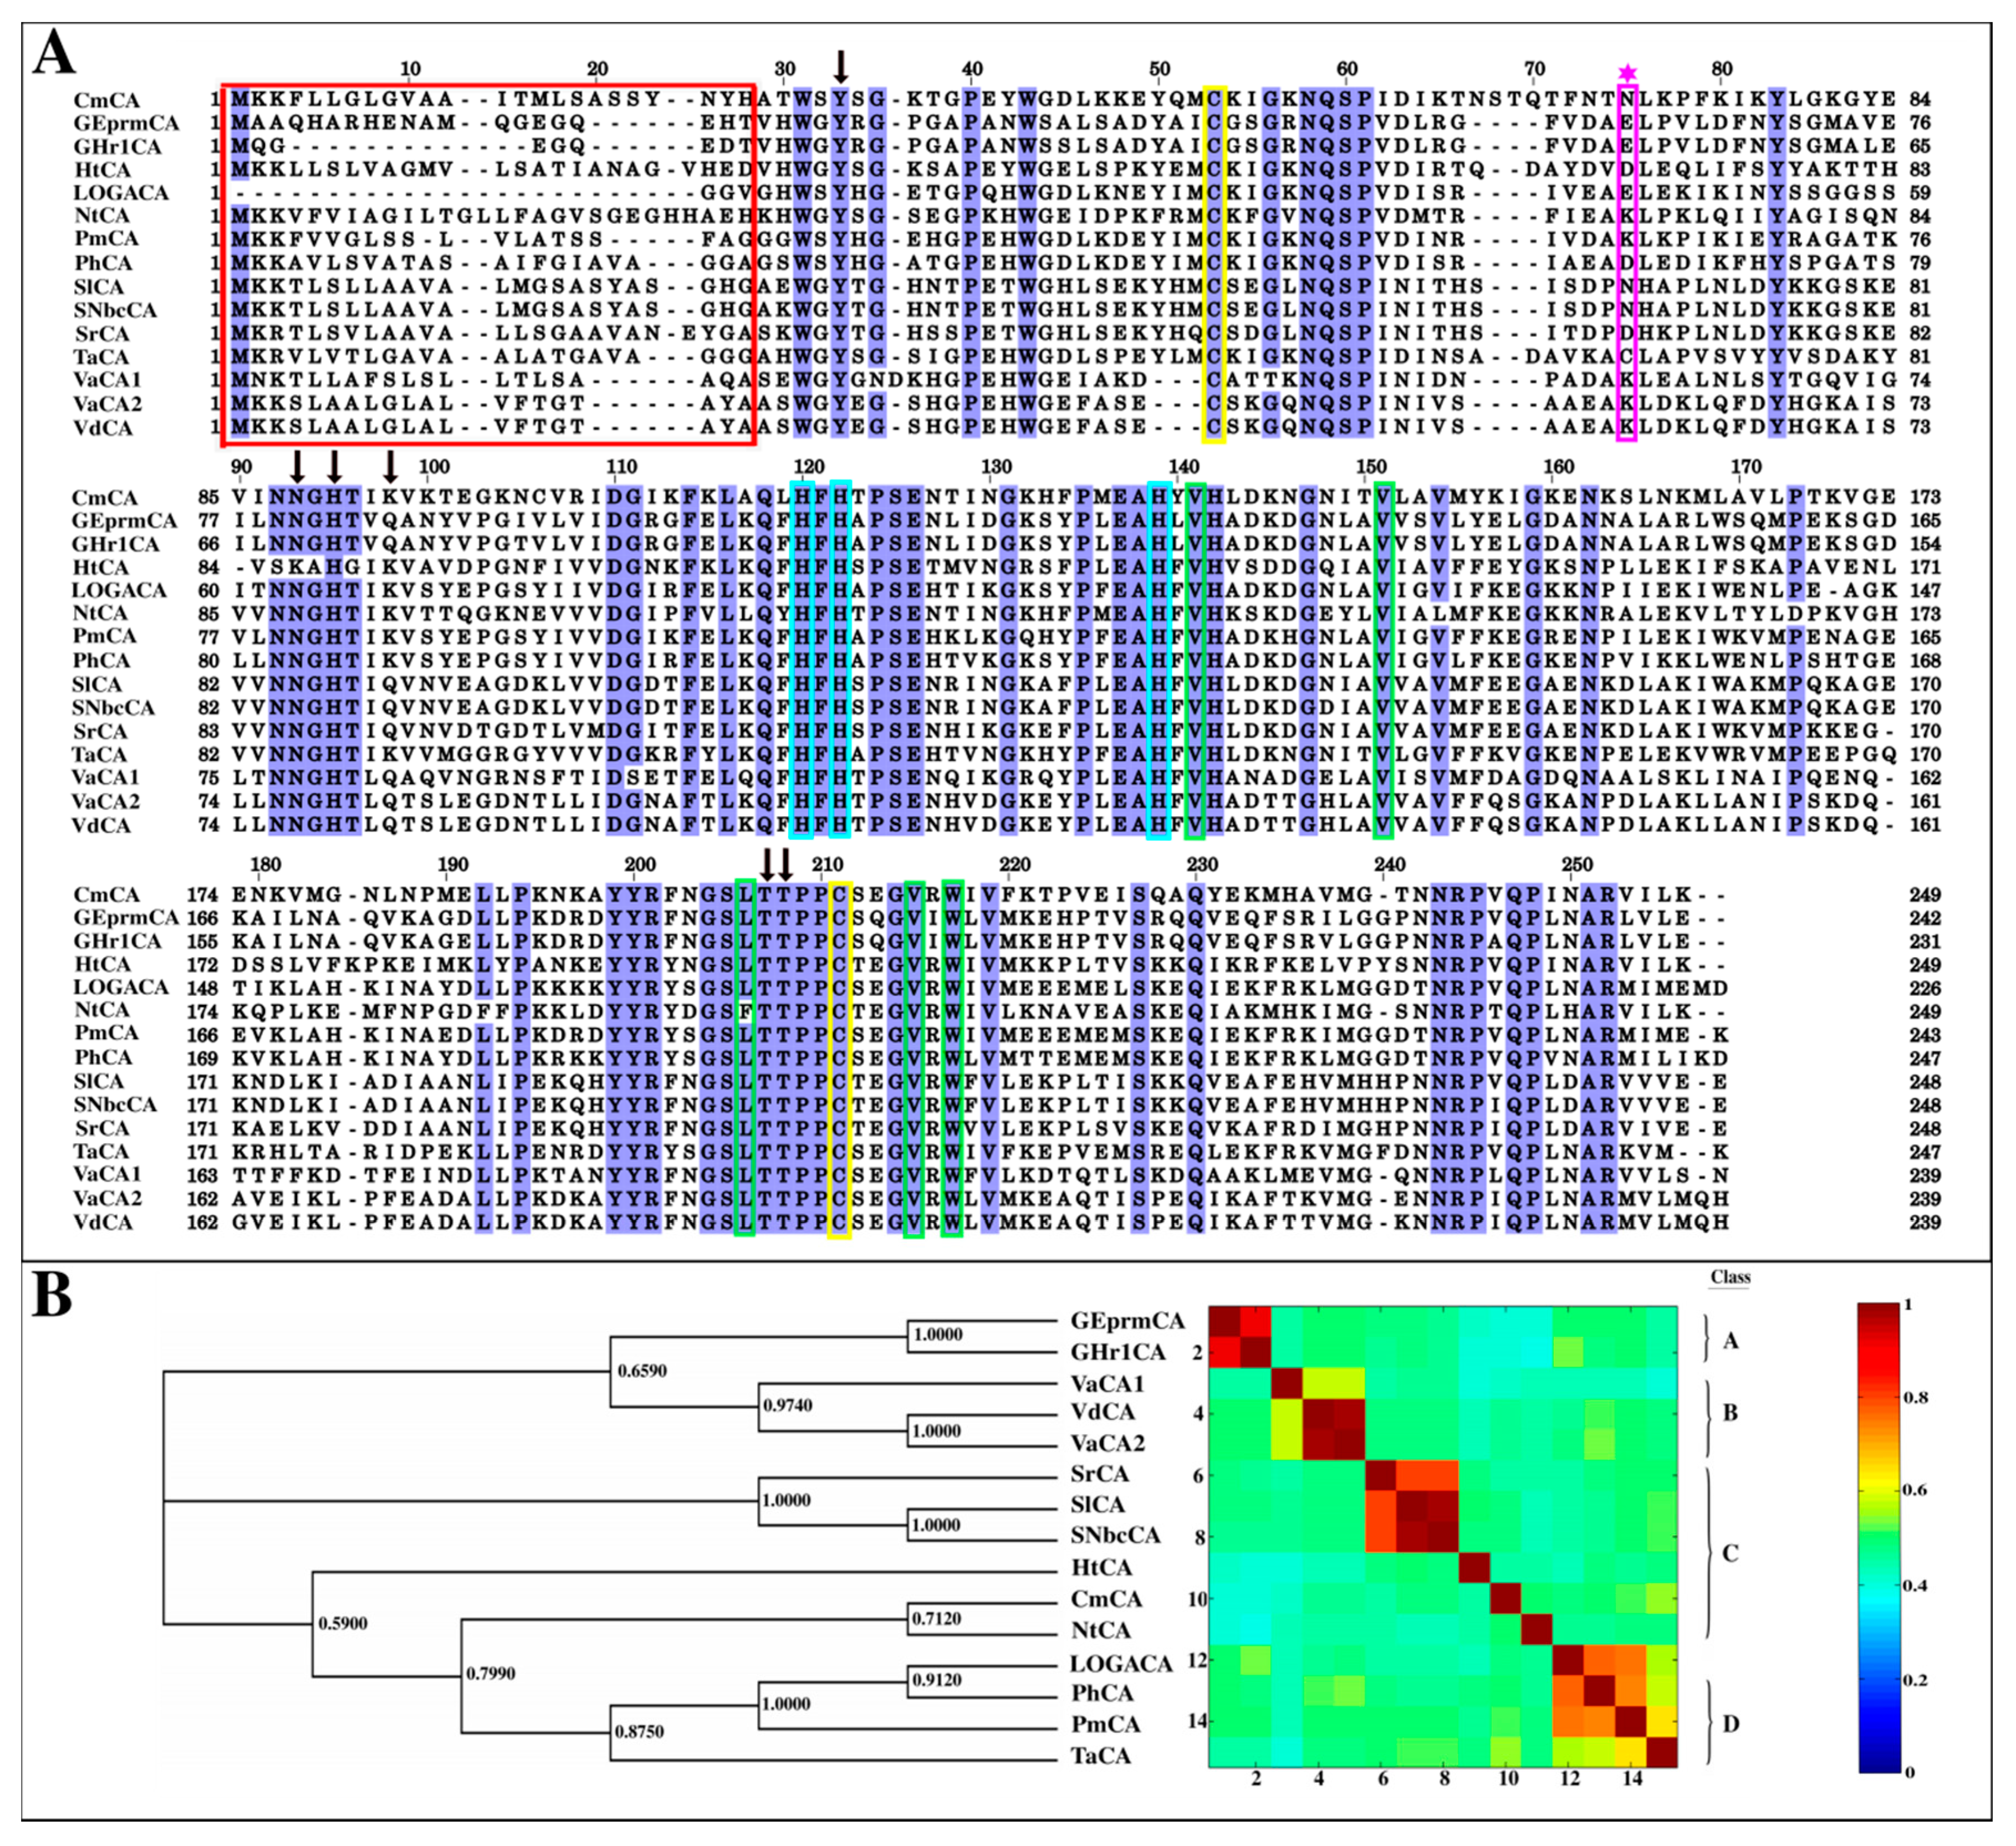
2.1.1. Multiple Sequence Alignment Reveals the Extent of Conservation in the α-CA Sequences
2.1.2. Signal Peptides in Most α-CA Sequences Are Confirmed by Signal Peptide Prediction Servers
2.1.3. Evolutionary Relationships amongst the α-CAs Through Construction of a Phylogenetic Tree
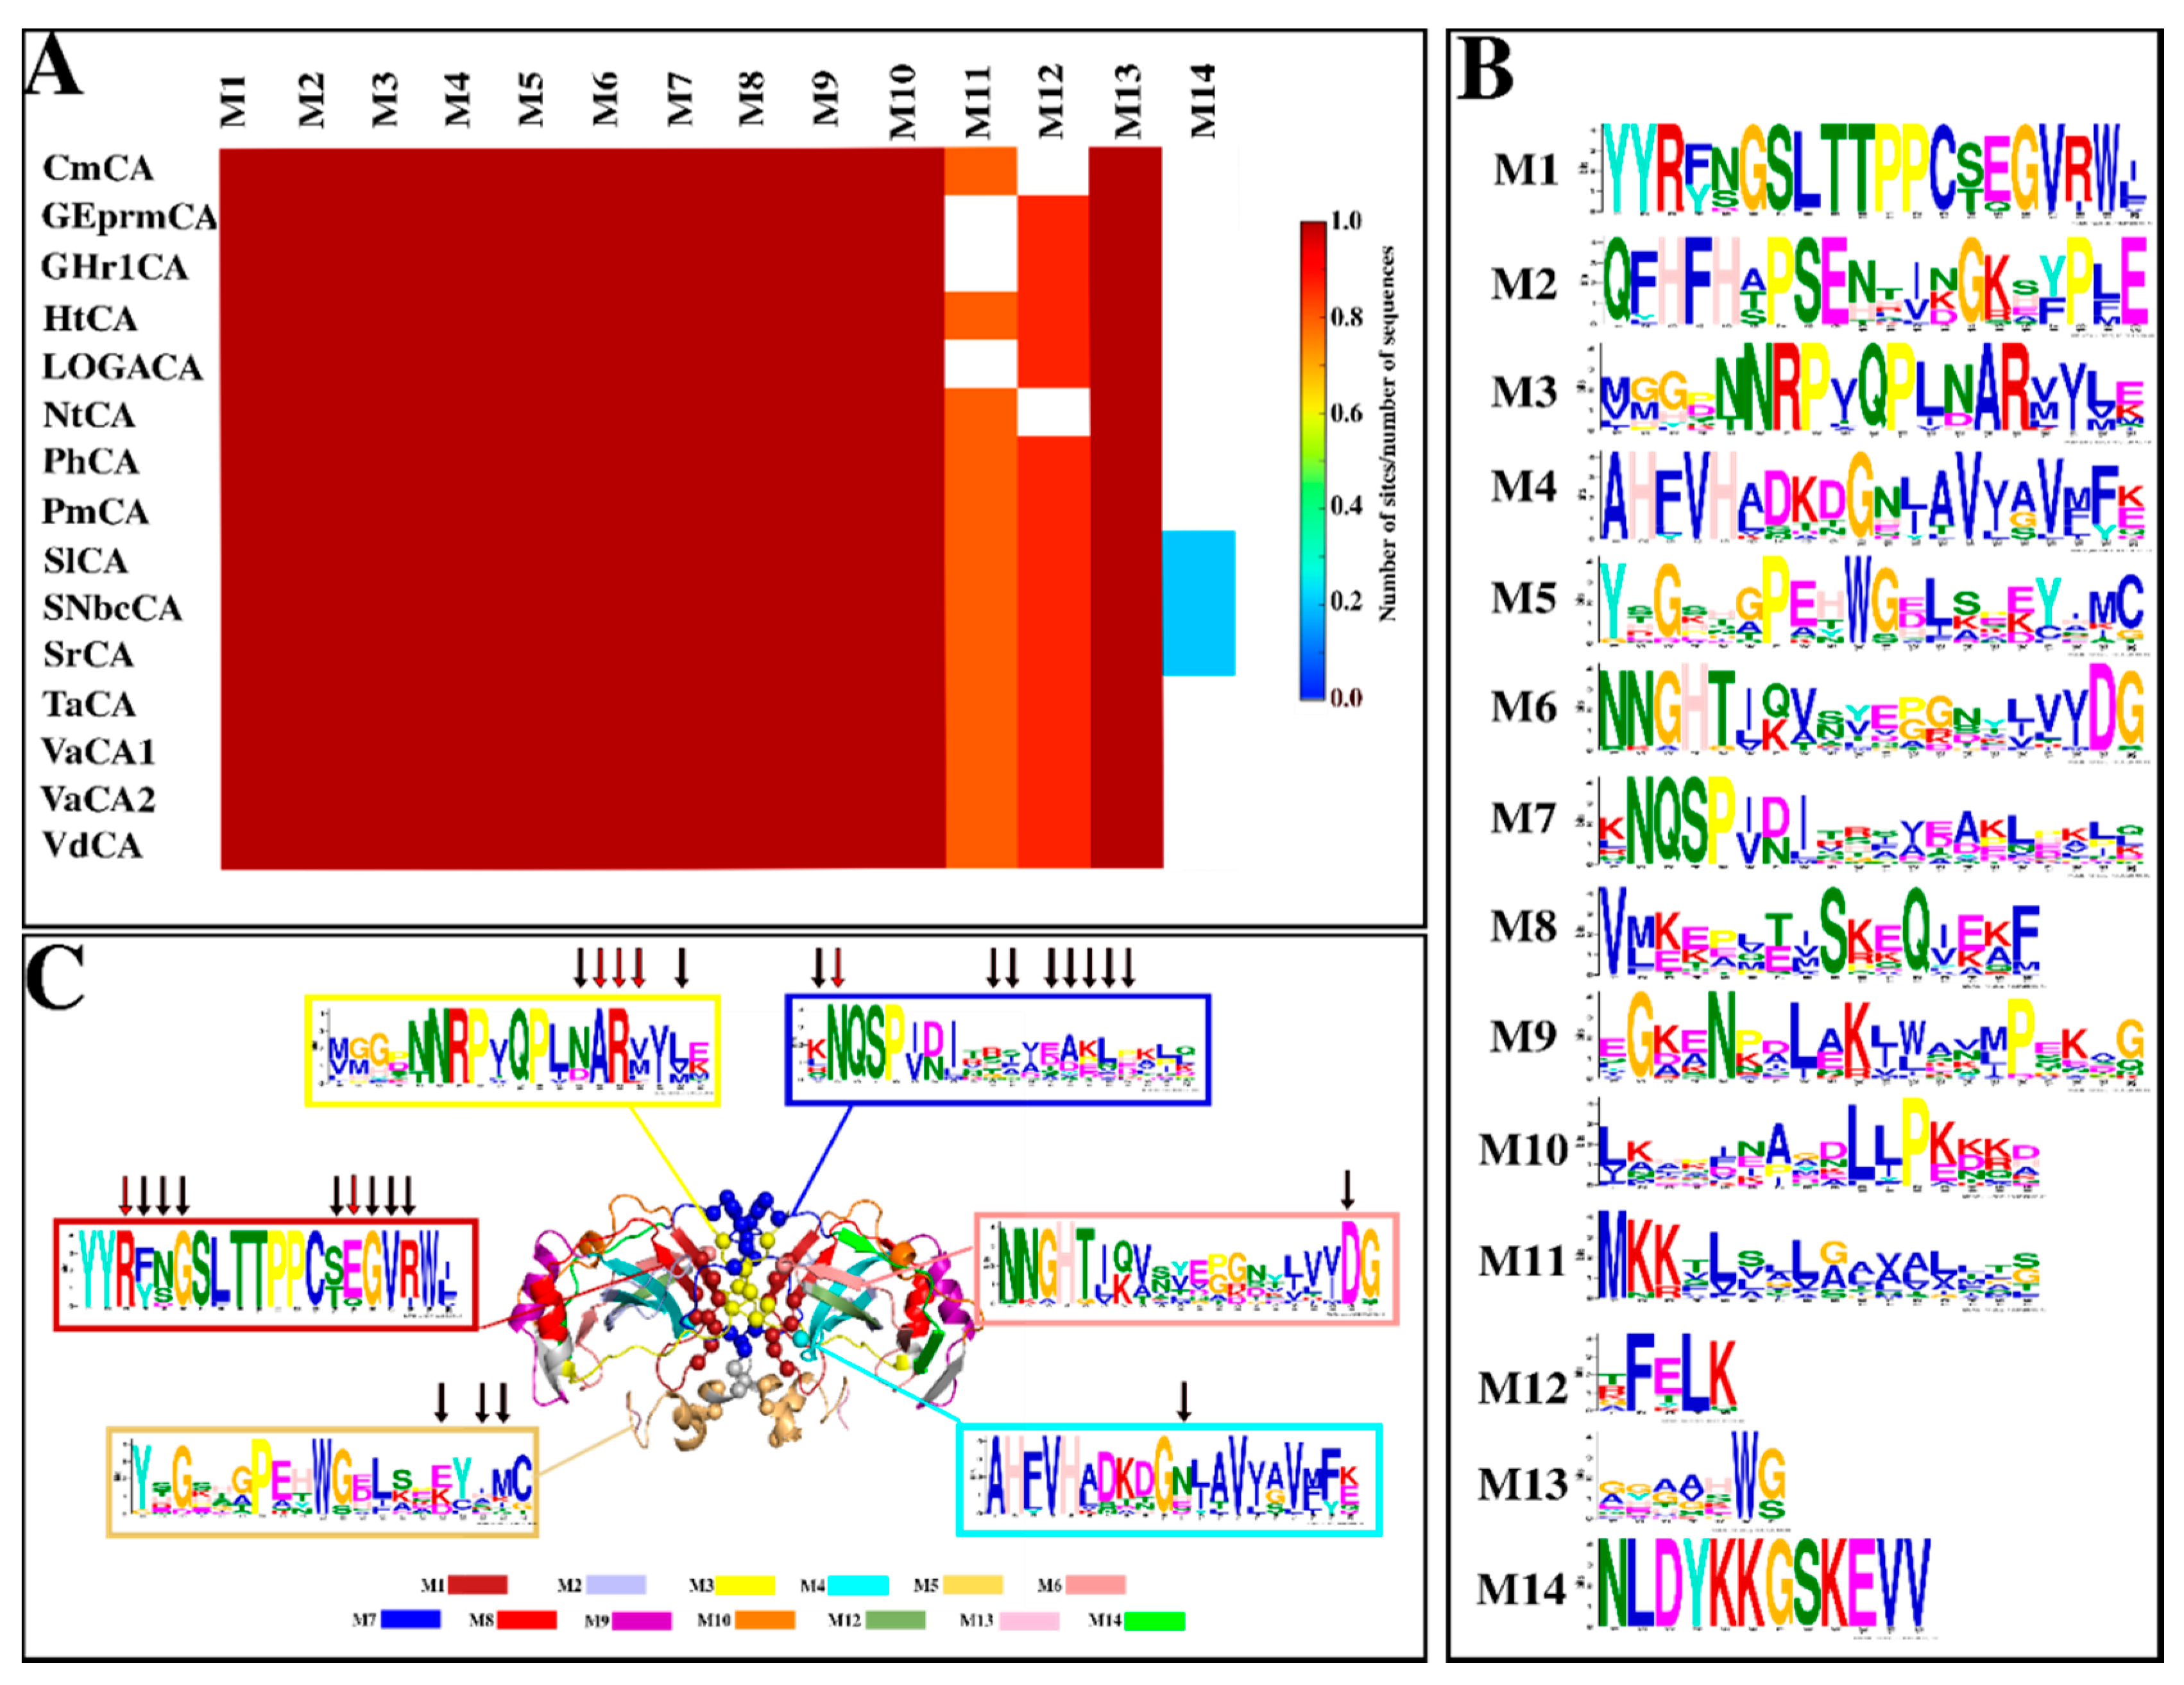
2.1.4. Motif Analysis Reveals Functionally Important Motifs as Well as Conservation across Sequences
2.2. Homology Modelling and Structural Analysis
2.2.1. Calculations of Dimeric Models of α-CAs and Their Validation Yields Good Quality Structures
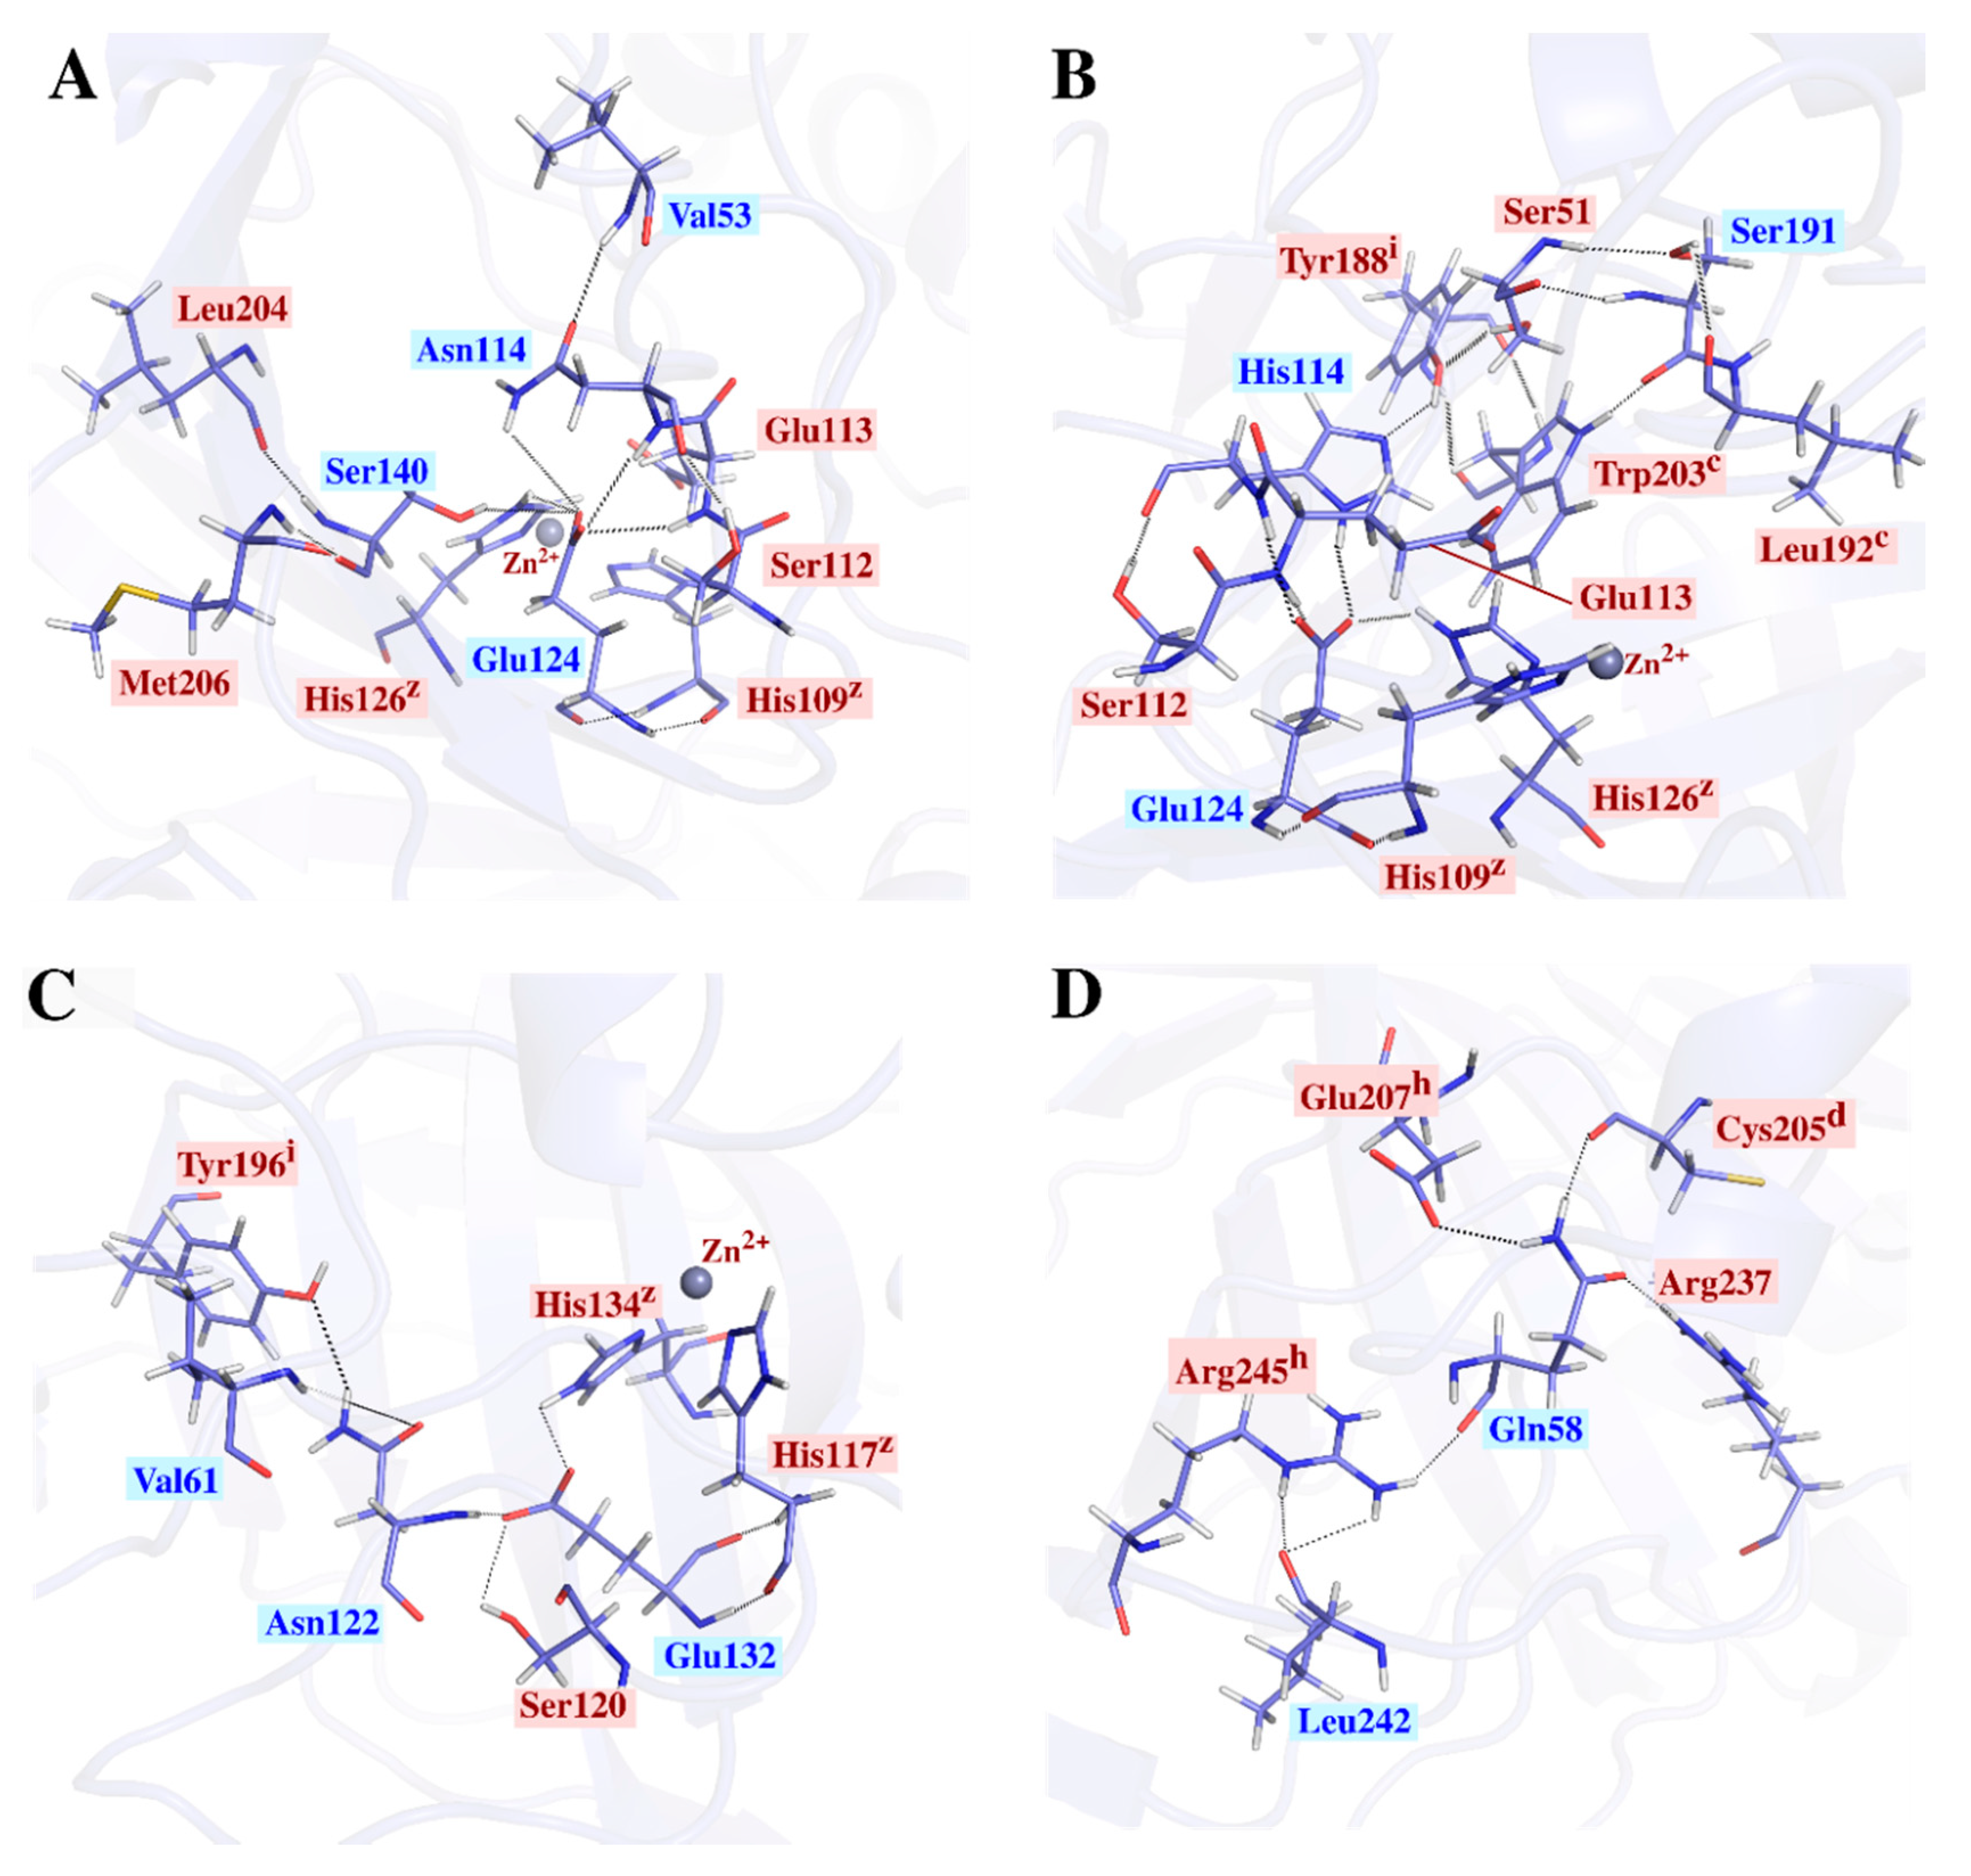
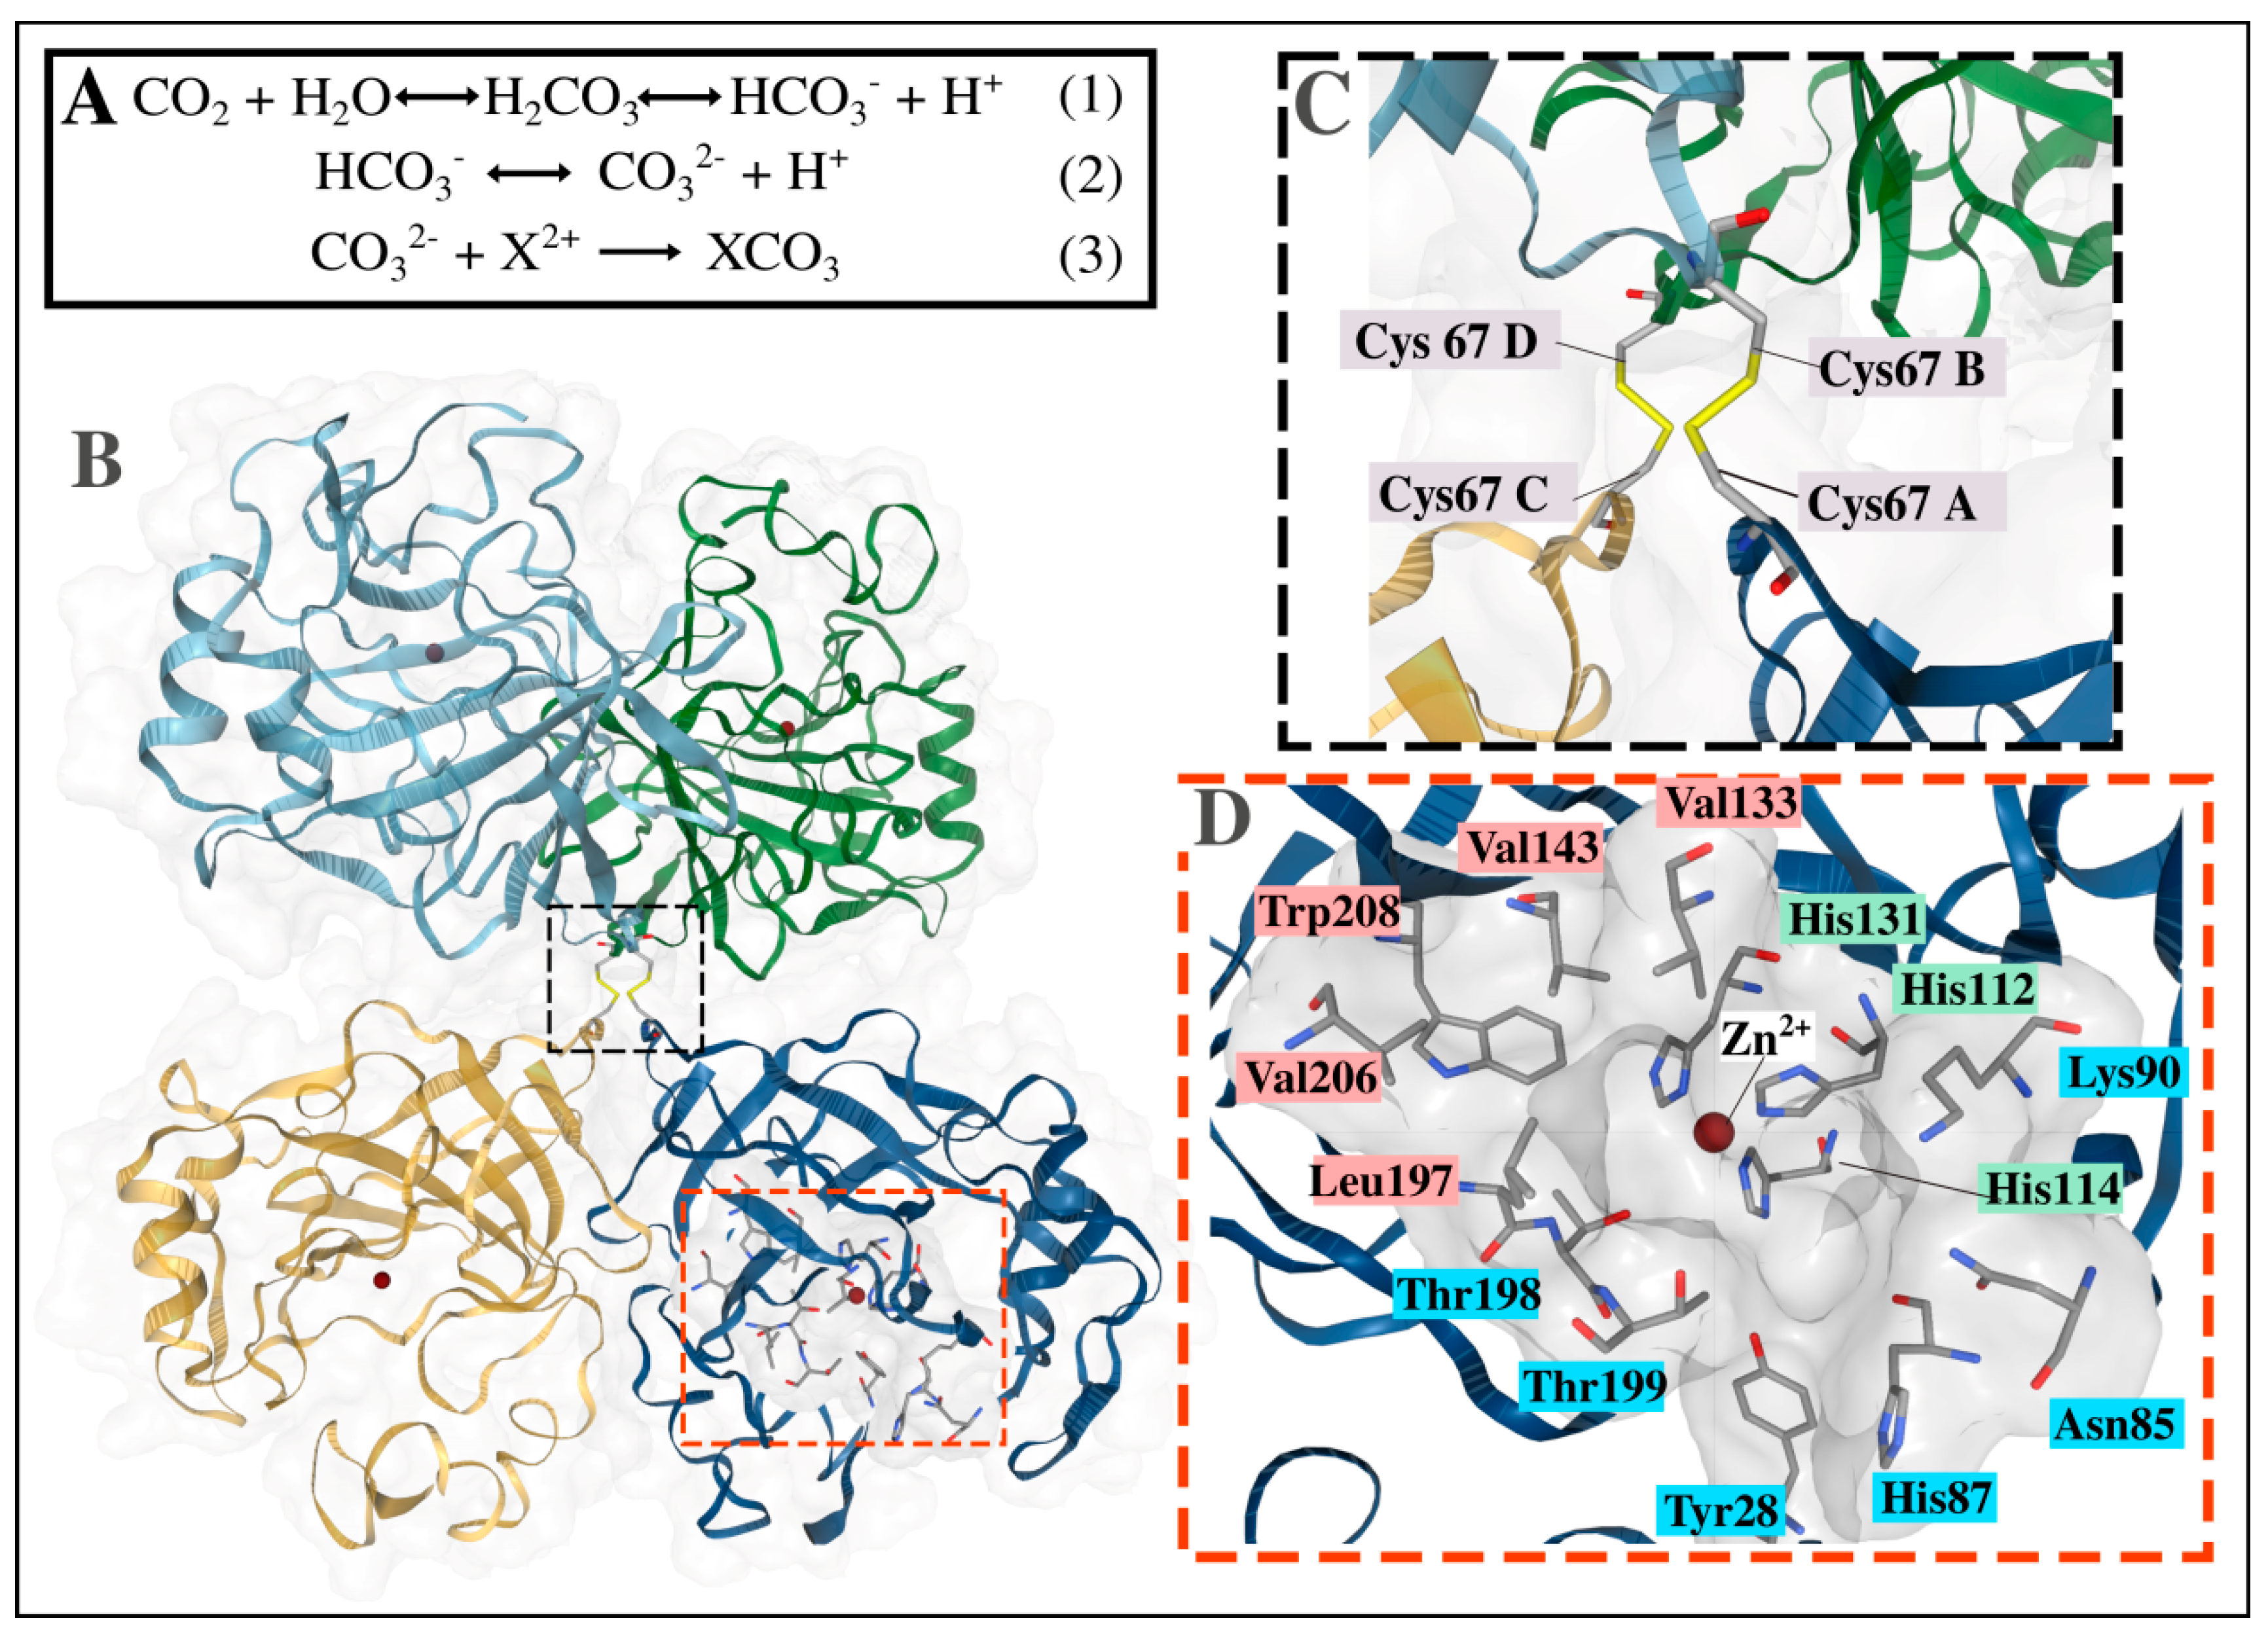
2.2.2. Structural Analysis of the α-CA Multimers Reveals Hotspot Residues in the Protein Interface and Important Inter- and Intra-Subunit Interactions
2.3. Dynamic Characterization of the Proteins
2.3.1. Dynamic Residue Network Analysis Confirms Interfacing and Hotspot Residues along with Previously Identified Functional Residues
2.3.2. Intra-Subunit Hydrogen Bond Analysis Reveals Important Networks Going through High Communication Residues Identified in Average BC Analysis
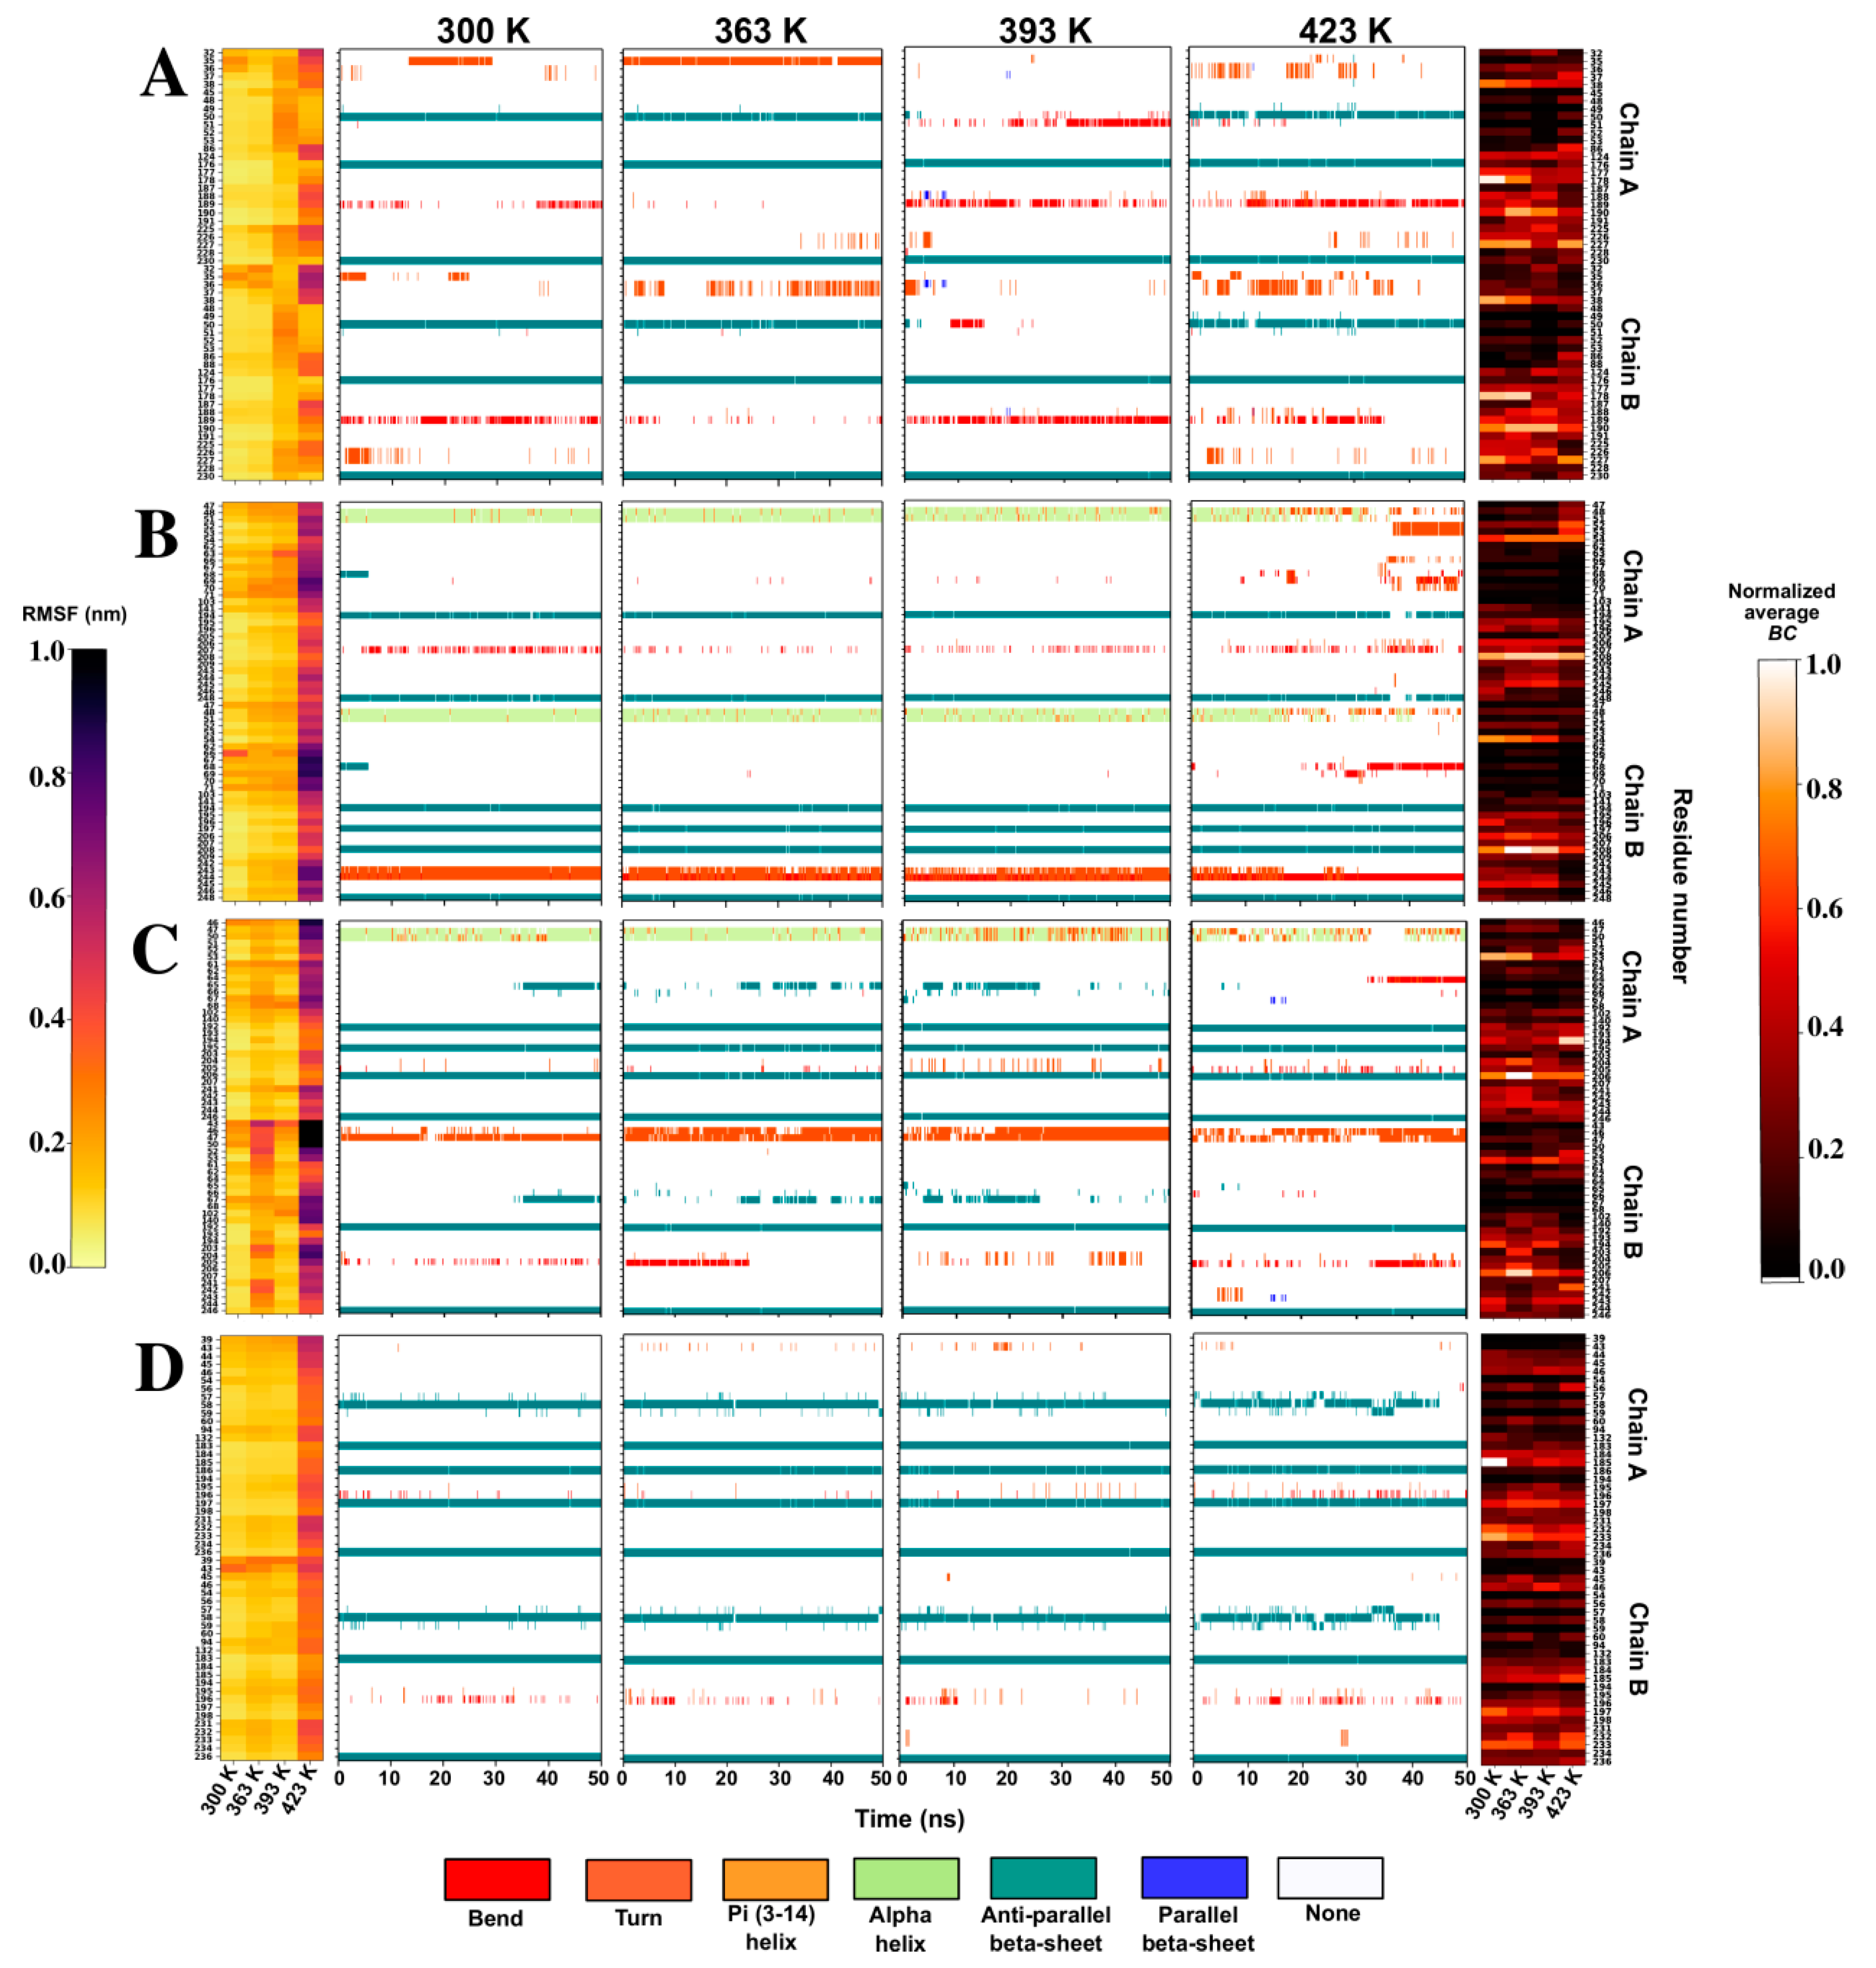
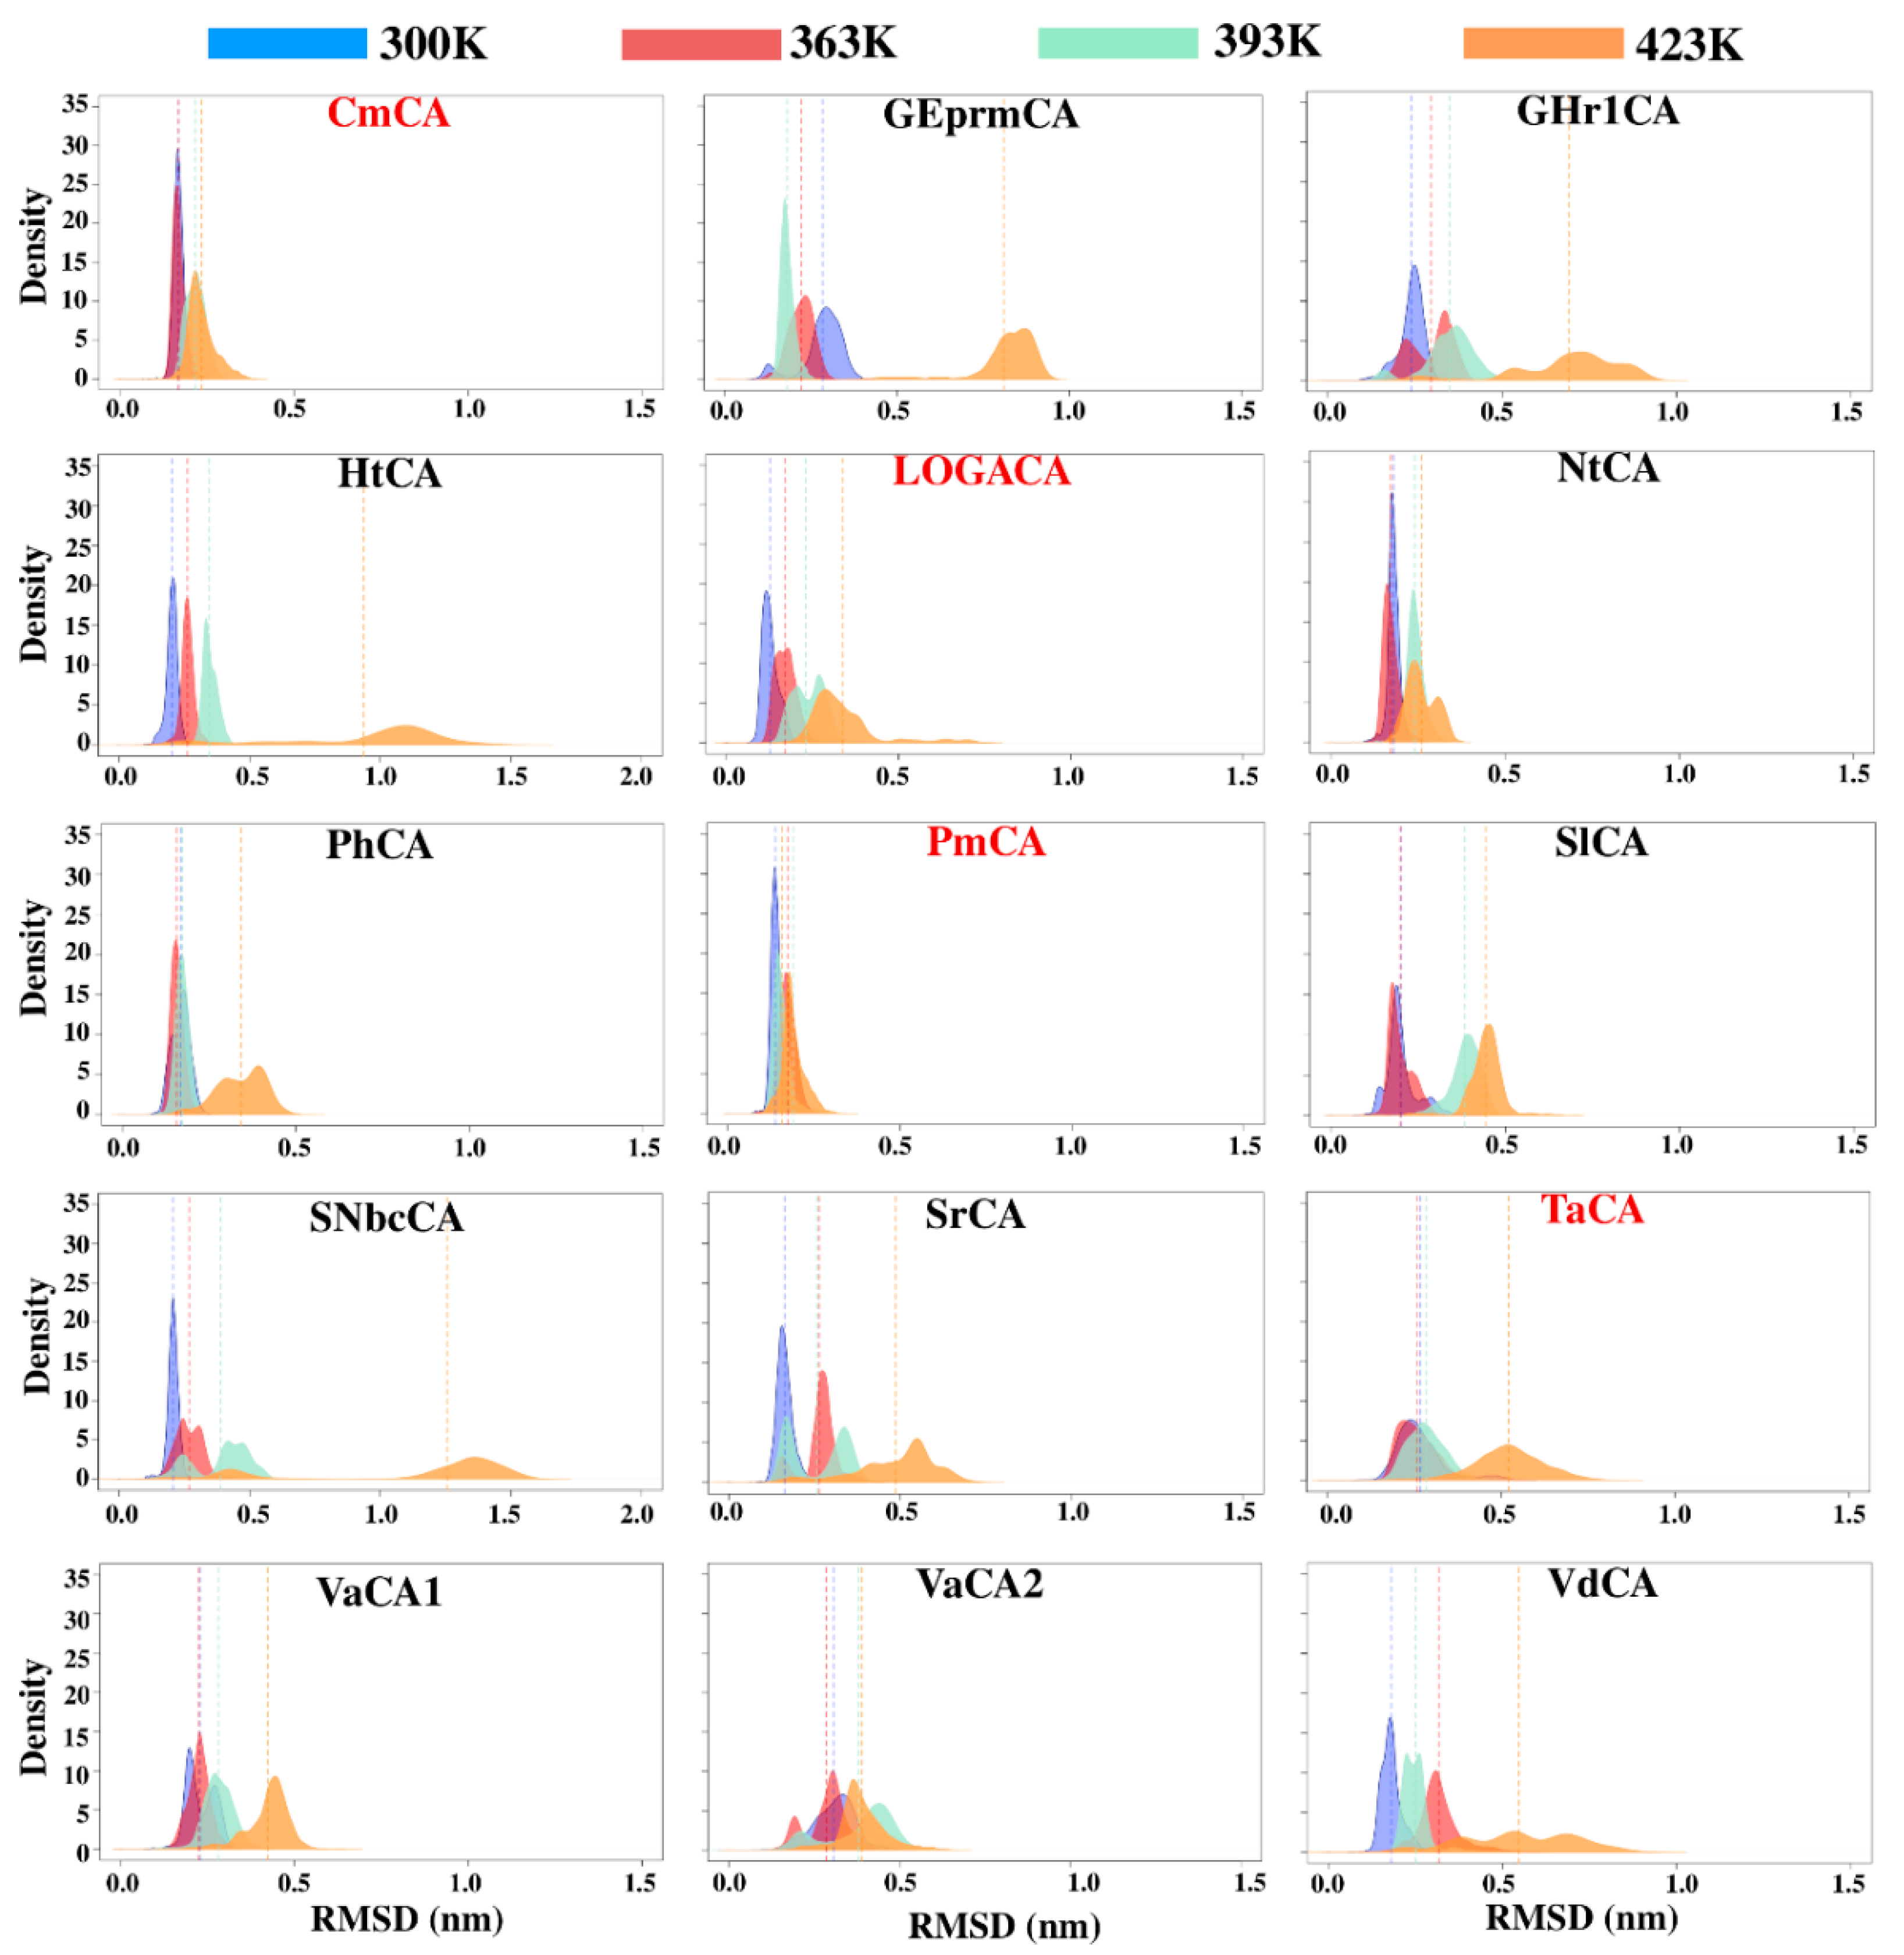
2.4. Identification of Potentially Thermostable α-CAs Using High Temperature Simulations
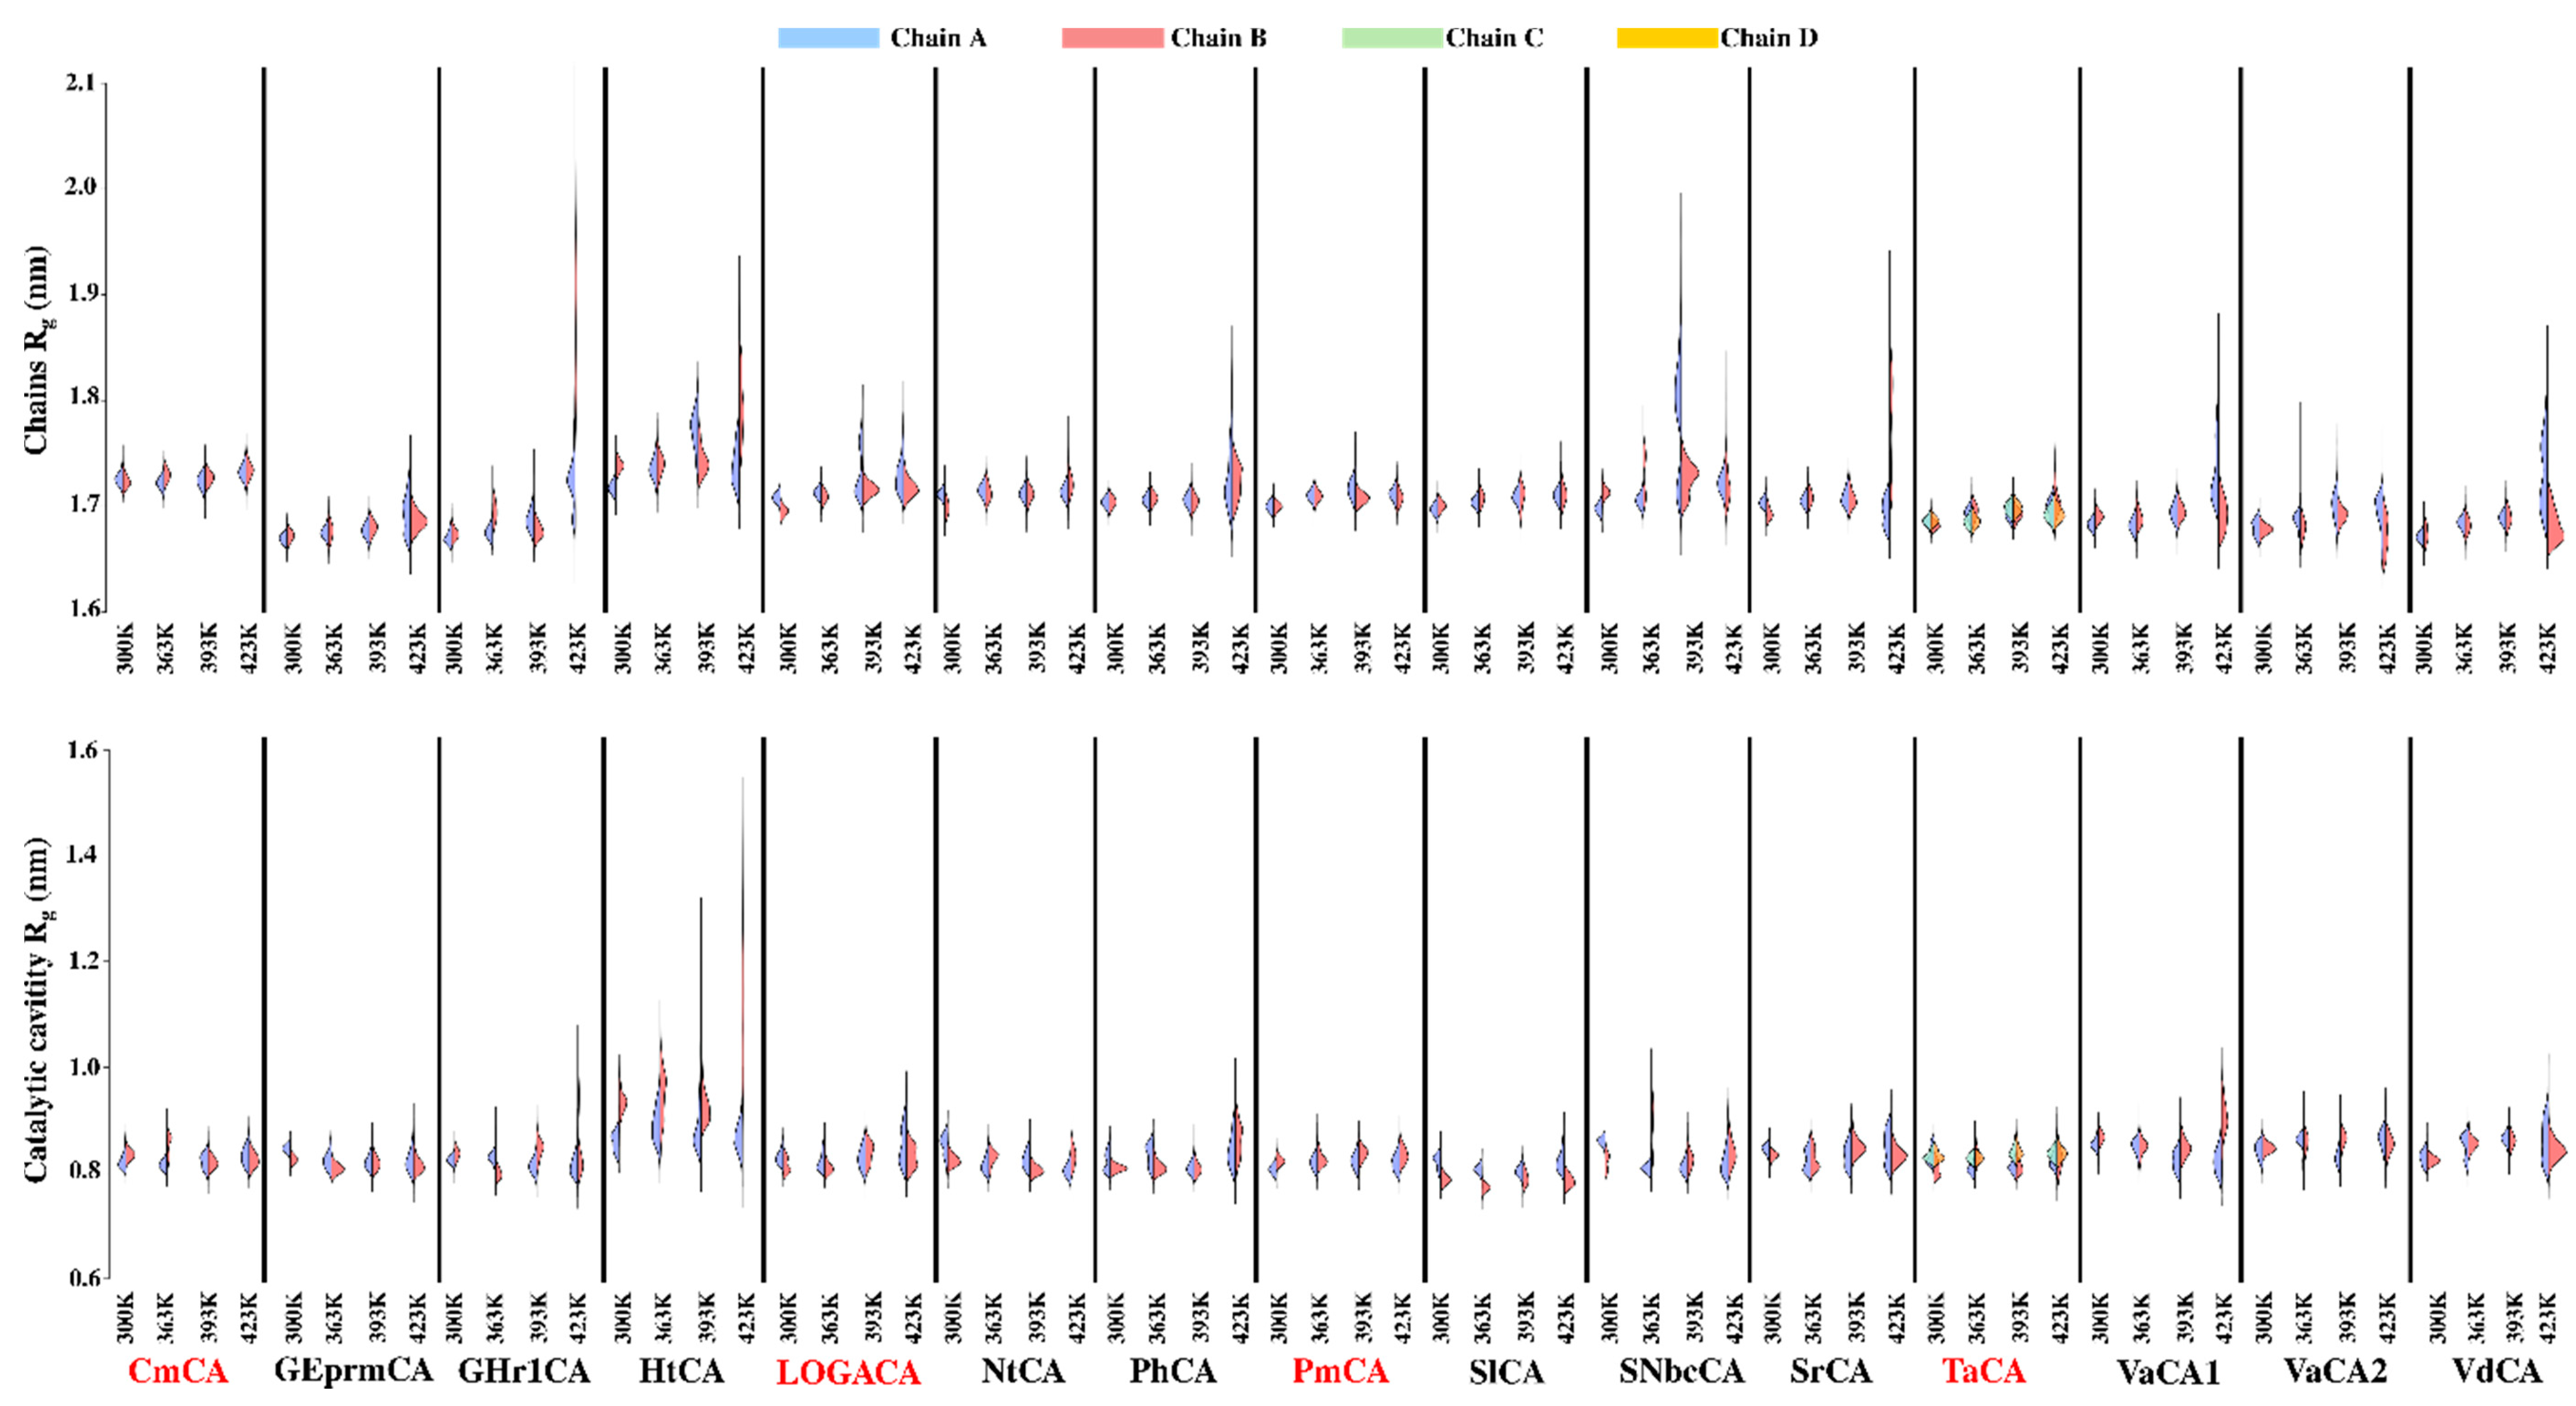
2.4.1. Compactness of the Chains and Catalytic Cavities from Each Protein Is Assessed by Rg Analysis at Increasing Temperatures
2.4.2. RMSF Analysis Reveals Stability of Some Proteins at High Simulation Temperatures
2.4.3. Disruption of the Interfaces in High Fluctuating α-CAs Is Investigated
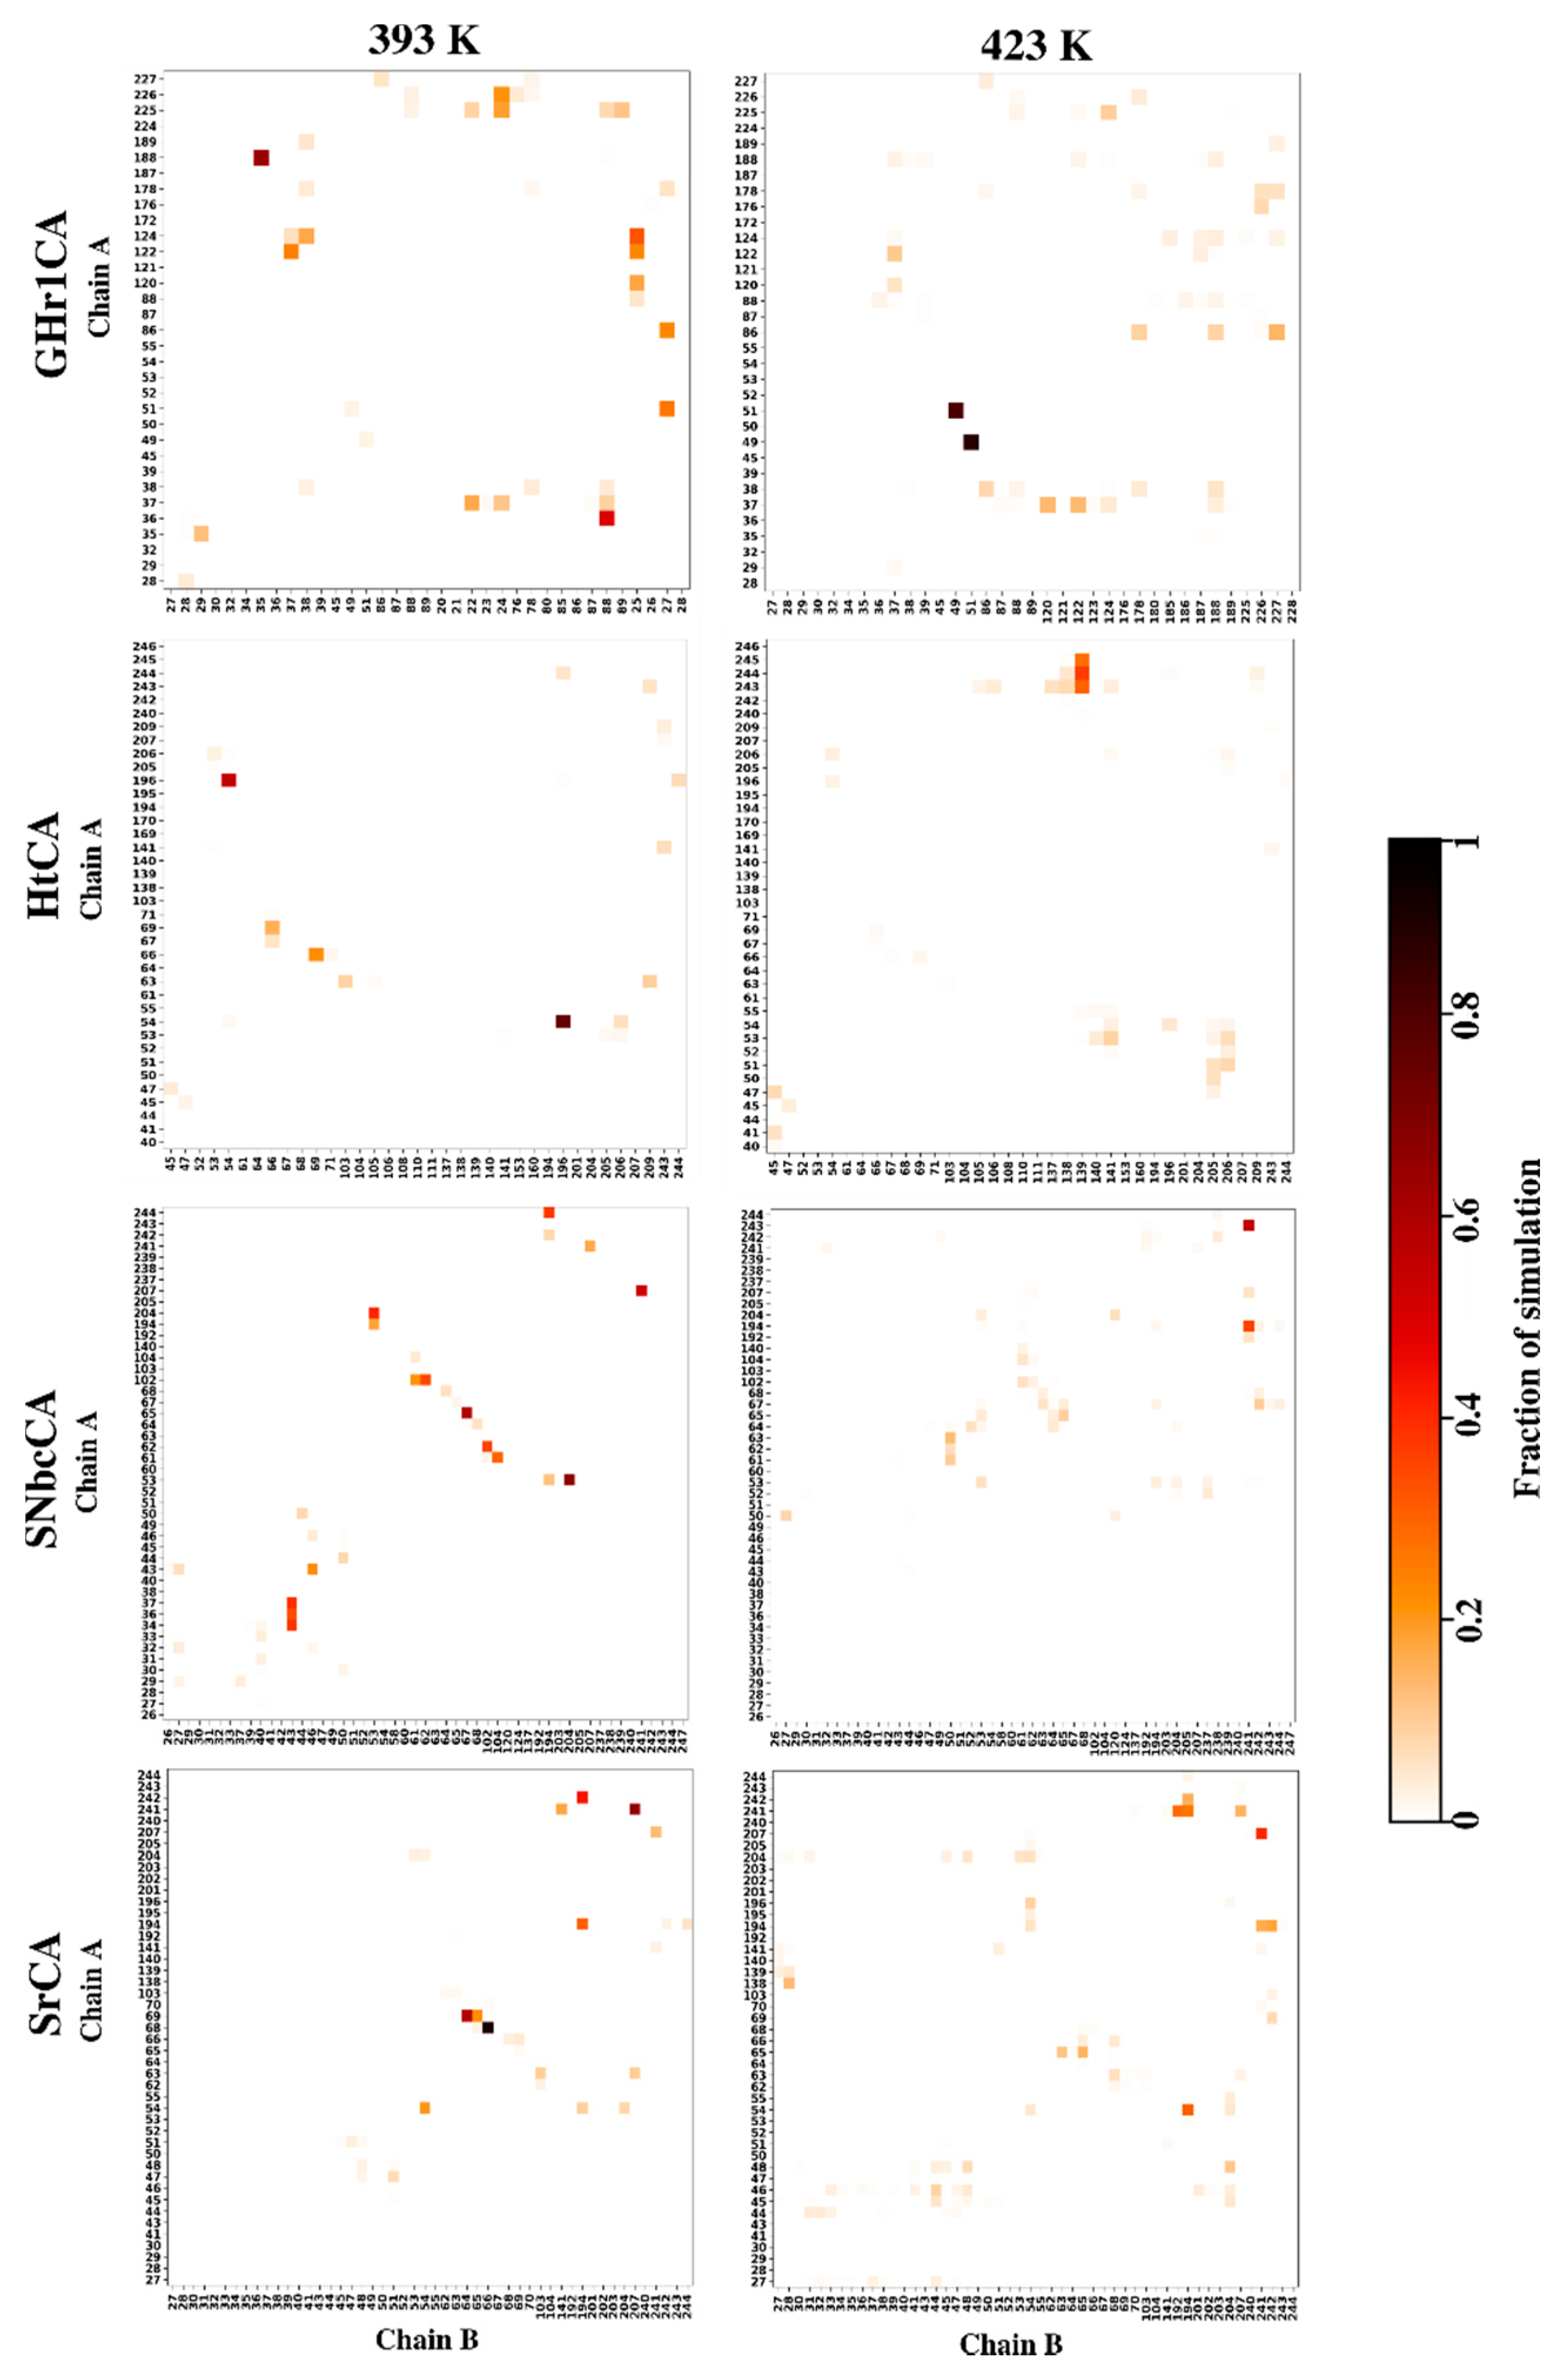
2.4.4. Effects of Temperature on Hydrogen Bond Interactions in the Interface Are Monitored by Inter-Subunit Hydrogen Bond Analysis
2.4.5. Correlated Motions Confirm Synchronized Movement of the Dimers through Interfacing Interactions
3. Materials and Methods
3.1. Sequence Retrieval
3.2. Sequence Alignments and Signal Peptide Prediction
3.3. Phylogenetic Tree Analysis
3.4. Motif Analysis
3.5. Homology Modelling
3.6. Protein–Protein Interface Analysis
3.7. Molecular Dynamics Simulations
3.8. Dynamic Residue Network Analysis
3.9. Dynamic cross Correlation
4. Conclusions
Supplementary Materials
Author Contributions
Funding
Acknowledgments
Conflicts of Interest
Abbreviations
| BC | Betweenness centrality |
| CA | Carbonic anhydrase |
| CmCA | Caminibacter mediatlanticus carbonic anhydrase |
| DCC | Dynamic cross correlation |
| DRN | Dynamic residue network |
| DSSP | Define Secondary Structure of Proteins |
| GEprmCA | Geothermobacter sp. EPR-M carbonic anhydrase |
| GHr1CA | Geothermobacter sp. HR-1 carbonic anhydrase |
| HtCA | Hydrogenimonas thermophila carbonic anhydrase |
| LOGACA | Logatchev hydrothermal field carbonic anhydrase |
| MSA | Multiple sequence alignment |
| NtCA | Nitratiruptor tergarcus carbonic anhydrase |
| PhCA | Persephonella hydrogeniphila carbonic anhydrase |
| PmCA | Persephonella marina carbonic anhydrase |
| RMSF | Root mean square fluctuation |
| Rg | Radius of gyration |
| SI | Sequence identity |
| SlCA | Sulfurovum lithotrophicum carbonic anhydrase |
| SNbcCA | Sulfurovum sp. NBC37-1 carbonic anhydrase |
| SrCA | Sulfurovum riftiae carbonic anhydrase |
| VaCA1 | Vibrio antiquarius carbonic anhydrase 1 |
| VaCA2 | Vibrio antiquarius carbonic anhydrase 2 |
| VdCA | Vibrio diabolicus carbonic anhydrase |
References
- Sejian, V.; Bhatta, R.; Malik, P.K.; Madiajagan, B.; Al-Hosni, Y.A.S.; Sullivan, M.; Gaughan, J.B. Livestock as sources of greenhouse gases and its significance to climate change. Greenh. Gases 2016, 243–259. [Google Scholar] [CrossRef] [Green Version]
- Pachauri, R.K.; Allen, M.R.; Barros, V.R.; Broome, J.; Cramer, W.; Christ, R.; Church, J.A.; Clarke, L.; Dahe, Q.; Dasgupta, P.; et al. Climate Change 2014: Synthesis Report. Contribution of Working Groups I, II and III to the Fifth Assessment Report of the Intergovernmental Panel on Climate Change; IPCC: Geneva, Switzerland, 2014; p. 151. [Google Scholar]
- Harrison, A.L.; Power, I.M.; Dipple, G.M. accelerated carbonation of brucite in mine tailings for carbon sequestration. Environ. Sci. Technol. 2012, 47, 126–134. [Google Scholar] [CrossRef] [PubMed]
- Nanda, S.; Reddy, S.N.; Mitra, S.K.; Kozinski, J.A. The progressive routes for carbon capture and sequestration. Energy Sci. Eng. 2016, 4, 99–122. [Google Scholar] [CrossRef] [Green Version]
- Yadav, R.R.; Krishnamurthi, K.; Mudliar, S.N.; Devi, S.S.; Naoghare, P.K.; Bafana, A.; Chakrabarti, T. Carbonic anhydrase mediated carbon dioxide sequestration: Promises, challenges and future prospects. J. Basic Microbiol. 2014, 54, 472–481. [Google Scholar] [CrossRef]
- Wolf, J.; Asrar, G.R.; West, T.O. Revised methane emissions factors and spatially distributed annual carbon fluxes for global livestock. Carbon Balance Manag. 2017, 12, 16. [Google Scholar] [CrossRef] [Green Version]
- NOAA. National Oceanic and Atmospheric Administration 2019. Available online: https://climate.nasa.gov/vital-signs/carbon-dioxide (accessed on 12 February 2019).
- Kim, I.G.; Jo, B.H.; Kang, D.G.; Kim, C.S.; Choi, Y.S.; Cha, H.J. Biomineralization-based conversion of carbon dioxide to calcium carbonate using recombinant carbonic anhydrase. Chemosphere 2012, 87, 1091–1096. [Google Scholar] [CrossRef] [PubMed]
- Mitchell, A.C.; Dideriksen, K.; Spangler, L.H.; Cunningham, A.B.; Gerlach, R. Microbially enhanced carbon capture and storage by mineral-trapping and solubility-trapping. Environ. Sci. Technol. 2010, 44, 5270–5276. [Google Scholar] [CrossRef] [Green Version]
- Mirjafari, P.; Asghari, A.K.; Mahinpey, N. Investigating the application of enzyme carbonic anhydrase for CO2 sequestration purposes. Ind. Eng. Chem. Res. 2007, 46, 921–926. [Google Scholar] [CrossRef]
- Savile, C.K.; LaLonde, J.J. Biotechnology for the acceleration of carbon dioxide capture and sequestration. Curr. Opin. Biotechnol. 2011, 22, 818–823. [Google Scholar] [CrossRef]
- Yong, J.K.J.; Stevens, G.W.; Caruso, F.; Kentish, S.E. The use of carbonic anhydrase to accelerate carbon dioxide capture processes. J. Chem. Technol. Biotechnol. 2014, 90, 3–10. [Google Scholar] [CrossRef]
- Tripp, B.C.; Smith, K.; Ferry, J.G. Carbonic anhydrase: New insights for an ancient enzyme. J. Biol. Chem. 2001, 276, 48615–48618. [Google Scholar] [CrossRef] [PubMed] [Green Version]
- Capasso, C.; Supuran, C.T. An overview of the alpha-, beta- and gamma-carbonic anhydrases from Bacteria: Can bacterial carbonic anhydrases shed new light on evolution of bacteria? J. Enzym. Inhib. Med. Chem. 2014, 30, 325–332. [Google Scholar] [CrossRef] [PubMed] [Green Version]
- Lane, T.W.; Saito, M.A.; George, G.N.; Pickering, I.J.; Prince, R.C.; Morel, F.M. Biochemistry: A cadmium enzyme from a marine diatom. Nat. Cell Biol. 2005, 435, 42. [Google Scholar] [CrossRef]
- Alterio, V.; Langella, E.; De Simone, G.; Monti, S.M. Cadmium-containing carbonic anhydrase CDCA1 in marine diatom Thalassiosira weissflogii. Mar. Drugs 2015, 13, 1688–1697. [Google Scholar] [CrossRef] [PubMed] [Green Version]
- Ferry, J.G. The γ class of carbonic anhydrases. Biochim. Biophys. Acta (BBA) Proteins Proteom. 2010, 1804, 374–381. [Google Scholar] [CrossRef] [Green Version]
- Di Fiore, A.; Alterio, V.; Monti, S.M.; De Simone, G.; D’Ambrosio, K. Thermostable carbonic anhydrases in biotechnological applications. Int. J. Mol. Sci. 2015, 16, 15456–15480. [Google Scholar] [CrossRef]
- Kikutani, S.; Nakajima, K.; Nagasato, C.; Tsuji, Y.; Miyatake, A.; Matsuda, Y. Thylakoid luminal θ-carbonic anhydrase critical for growth and photosynthesis in the marine diatom Phaeodactylum tricornutum. Proc. Natl. Acad. Sci. USA 2016, 113, 9828–9833. [Google Scholar] [CrossRef] [Green Version]
- DiMario, R.J.; Machingura, M.C.; Waldrop, G.L.; Moroney, J.V. The many types of carbonic anhydrases in photosynthetic organisms. Plant Sci. 2018, 268, 11–17. [Google Scholar] [CrossRef]
- Tan, S.-I.; Han, Y.-L.; Yu, Y.-J.; Chiu, C.-Y.; Chang, Y.-K.; Ouyang, S.; Fan, K.-C.; Lo, K.-H.; Ng, I.-S. Efficient carbon dioxide sequestration by using recombinant carbonic anhydrase. Process. Biochem. 2018, 73, 38–46. [Google Scholar] [CrossRef]
- Jensen, E.L.; Clement, R.; Kosta, A.; Maberly, S.C.; Gontero, B. A new widespread subclass of carbonic anhydrase in marine phytoplankton. ISME J. 2019, 13, 2094–2106. [Google Scholar] [CrossRef] [Green Version]
- Bose, H.; Satyanarayana, T. Microbial carbonic anhydrases in biomimetic carbon sequestration for mitigating global warming: Prospects and perspectives. Front. Microbiol. 2017, 8, 1615. [Google Scholar] [CrossRef] [PubMed]
- Lee, S.-W.; Park, S.-B.; Jeong, S.K.; Lim, K.-S.; Lee, S.-H.; Trachtenberg, M.C. On carbon dioxide storage based on biomineralization strategies. Micron 2010, 41, 273–282. [Google Scholar] [CrossRef] [PubMed]
- Tu, C.; Silverman, D.N.; Forsman, C.; Jonsson, B.H.; Lindskog, S. Role of histidine 64 in the catalytic mechanism of human carbonic anhydrase II studied with a site-specific mutant. Biochemistry 1989, 28, 7913–7918. [Google Scholar] [CrossRef] [PubMed]
- Idrees, D.; Anwer, R.; Shahbaaz, M.; Sabela, M.; Khamees, O.A.; Gourinath, S.; Kumar, M.; Singh, M.P.; Qumaizi, K.I. Carbonic anhydrase II based biosensing of carbon dioxide at high temperature: An analytical and MD simulation study. J. Bioremediat. Biodegrad. 2018, 9, 1–8. [Google Scholar] [CrossRef]
- Stams, T.; Nair, S.K.; Okuyama, T.; Waheed, A.; Sly, W.S.; Christianson, D.W. Crystal structure of the secretory form of membrane-associated human carbonic anhydrase IV at 2.8-A resolution. Proc. Natl. Acad. Sci. USA 1996, 93, 13589–13594. [Google Scholar] [CrossRef] [PubMed] [Green Version]
- Boriack-Sjodin, P.A.; Zeitlin, S.; Christianson, D.W.; Chen, H.-H.; Crenshaw, L.; Gross, S.; Dantanarayana, A.; Delgado, P.; May, J.A.; Dean, T. Structural analysis of inhibitor binding to human carbonic anhydrase II. Protein Sci. 1998, 7, 2483–2489. [Google Scholar] [CrossRef] [Green Version]
- James, P.; Isupov, M.N.; Sayer, C.; Saneei, V.; Berg, S.; Lioliou, M.; Kotlar, H.K.; Littlechild, J.A. The structure of a tetrameric α-carbonic anhydrase from Thermovibrio ammonificans reveals a core formed around intermolecular disulfides that contribute to its thermostability. Acta Crystallogr. Sect. D Biol. Crystallogr. 2014, 70, 2607–2618. [Google Scholar] [CrossRef] [Green Version]
- Lindskog, S. Structure and mechanism of carbonic anhydrase. Pharmacol. Ther. 1997, 74, 1–20. [Google Scholar] [CrossRef]
- Supuran, C.T. Structure and function of carbonic anhydrases. Biochem. J. 2016, 473, 2023–2032. [Google Scholar] [CrossRef]
- Boone, C.D.; Pinard, M.; McKenna, R.; Silverman, D. Catalytic mechanism of α-class carbonic anhydrases: CO2 hydration and proton transfer. In Carbonic Anhydrase: Mechanism, Regulation, Links to Disease, and Industrial Applications; Frost, S., McKenna, R., Eds.; Springer: Dordrecht, The Netherlands, 2014; Volume 75, pp. 31–52. [Google Scholar]
- Nair, S.K.; Calderone, T.L.; Christianson, D.W.; Fierke, C.A. Altering the mouth of a hydrophobic pocket. Structure and kinetics of human carbonic anhydrase II mutants at residue Val-121. J. Biol. Chem. 1991, 266, 17320–17325. [Google Scholar]
- De Simone, G.; Monti, S.M.; Alterio, V.; Buonanno, M.; De Luca, V.; Rossi, M.; Carginale, V.; Supuran, C.T.; Capasso, C.; Di Fiore, A. Crystal structure of the most catalytically effective carbonic anhydrase enzyme known, SazCA from the thermophilic bacterium Sulfurihydrogenibium azorense. Bioorg. Med. Chem. Lett. 2015, 25, 2002–2006. [Google Scholar] [CrossRef] [PubMed]
- Fredslund, F.; Borchert, M.S.; Poulsen, J.-C.N.; Mortensen, S.B.; Perner, M.; Streit, W.R.; Leggio, L.L. Structure of a hyperthermostable carbonic anhydrase identified from an active hydrothermal vent chimney. Enzym. Microb. Technol. 2018, 114, 48–54. [Google Scholar] [CrossRef] [Green Version]
- Coleman, J.E. Mechanism of action of carbonic anhydrase substrate, sulfonamide, and anion binding. J. Biol. Chem. 1967, 242, 5212–5219. [Google Scholar] [PubMed]
- Silverman, D.N.; Agbandje-McKenna, M. Solvent-Mediated proton transfer in catalysis by carbonic anhydrase. Accounts Chem. Res. 2007, 40, 669–675. [Google Scholar] [CrossRef] [PubMed]
- Borchert, M.; Saunders, P. Heat-Stable Carbonic Anhydrases and Their Use. US Patent 8,945,826, 2015. [Google Scholar]
- Jo, B.H.; Seo, J.H.; Cha, H.J. Bacterial extremo-α-carbonic anhydrases from deep-sea hydrothermal vents as potential biocatalysts for CO2 sequestration. J. Mol. Catal. B Enzym. 2014, 109, 31–39. [Google Scholar] [CrossRef]
- Kanth, B.K.; Jun, S.-Y.; Kumari, S.; Pack, S.P. Highly thermostable carbonic anhydrase from Persephonella marina EX-H1: Its expression and characterization for CO2-sequestration applications. Process. Biochem. 2014, 49, 2114–2121. [Google Scholar] [CrossRef]
- Parra-Cruz, R.; Lau, P.L.; Loh, H.-S.; Pordea, A. Engineering of Thermovibrio ammonificans carbonic anhydrase mutants with increased thermostability. J. CO2 Util. 2020, 37, 1–8. [Google Scholar] [CrossRef]
- Kim, S.; Sung, J.; Yeon, J.; Choi, S.H.; Jin, M.S. Crystal structure of a highly thermostable α-carbonic anhydrase from Persephonella marina EX-H1. Mol. Cells 2019, 42, 460–469. [Google Scholar]
- Chakravarty, D.; Guharoy, M.; Robert, C.H.; Chakrabarti, P.; Janin, J. Reassessing buried surface areas in protein–protein complexes. Protein Sci. 2013, 22, 1453–1457. [Google Scholar] [CrossRef] [Green Version]
- Ozbabacan, S.E.A.; Engin, H.B.; Gursoy, A.; Keskin, O. Transient protein-protein interactions. Protein Eng. Des. Sel. 2011, 24, 635–648. [Google Scholar] [CrossRef]
- Bogan, A.A.; Thorn, K.S. Anatomy of hot spots in protein interfaces. J. Mol. Biol. 1998, 280, 1–9. [Google Scholar] [CrossRef] [PubMed] [Green Version]
- Upfold, N.; Ross, C.; Tastan Bishop, Ö.; Knox, C. The in silico prediction of hotspot residues that contribute to the structural stability of subunit interfaces of a picornavirus capsid. Viruses 2020, 12, 387. [Google Scholar] [CrossRef] [PubMed] [Green Version]
- Emameh, R.Z.; Barker, H.; Tolvanen, M.; Parkkila, S.; Hytönen, V.P. Horizontal transfer of β-carbonic anhydrase genes from prokaryotes to protozoans, insects, and nematodes. Parasites Vectors 2016, 9, 152. [Google Scholar] [CrossRef] [Green Version]
- Emameh, R.Z.; Barker, H.; Hytönen, V.P.; Parkkila, S. Involvement of β-Carbonic Anhydrase Genes in Bacterial Genomic Islands and Their Horizontal Transfer to Protists. Appl. Environ. Microbiol. 2018, 84, AEM.00771–18. [Google Scholar] [CrossRef] [PubMed] [Green Version]
- Ross, C.; Knox, C.; Tastan Bishop, Ö. Interacting motif networks located in hotspots associated with RNA release are conserved in Enterovirus capsids. FEBS Lett. 2017, 591, 1687–1701. [Google Scholar] [CrossRef] [PubMed] [Green Version]
- Brown, D.K.; Penkler, D.L.; Sheik Amamuddy, O.; Ross, C.; Atilgan, A.R.; Atilgan, C.; Tastan Bishop, Ö. MD-TASK: A software suite for analyzing molecular dynamics trajectories. Bioinformatics 2017, 33, 2768–2771. [Google Scholar] [CrossRef] [PubMed] [Green Version]
- Voordeckers, J.W.; Starovoytov, V.; Vetriani, C. Caminibacter mediatlanticus sp. nov., a thermophilic, chemolithoautotrophic, nitrate-ammonifying bacterium isolated from a deep-sea hydrothermal vent on the Mid-Atlantic Ridge. Int. J. Syst. Evol. Microbiol. 2005, 55, 773–779. [Google Scholar] [CrossRef]
- Götz, D.; Banta, A.; Beveridge, T.J.; Rushdi, A.I.; Simoneit, B.R.T.; Reysenbach, A.L. Persephonella marina gen. nov., sp. nov. and Persephonella guaymasensis sp. nov., two novel, thermophilic, hydrogen-oxidizing microaerophiles from deep-sea hydrothermal vents. Int. J. Syst. Evol. Microbiol. 2002, 52, 1349–1359. [Google Scholar] [CrossRef] [Green Version]
- Nakagawa, S.; Takai, K.; Horikoshi, K.; Sako, Y. Persephonella hydrogeniphila sp. nov., a novel thermophilic, hydrogen-oxidizing bacterium from a deep-sea hydrothermal vent chimney. Int. J. Syst. Evol. Microbiol. 2003, 53, 863–869. [Google Scholar] [CrossRef]
- Raguenes, G.; Christen, R.; Guezennec, J.; Pignet, P.; Barbier, G. Vibrio diabolicus sp. nov., a new polysaccharide-secreting organism isolated from a deep-sea hydrothermal vent polychaete annelid, Alvinella pompejana. Int. J. Syst. Bacteriol. 1997, 47, 989–995. [Google Scholar] [CrossRef] [Green Version]
- Inagaki, F.; Takai, K.; Nealson, K.H.; Horikoshi, K. Sulfurovum lithotrophicum gen. nov., sp. nov., a novel sulfur-oxidizing chemolithoautotroph within the ε-Proteobacteria isolated from Okinawa trough hydrothermal sediments. Int. J. Syst. Evol. Microbiol. 2004, 54, 1477–1482. [Google Scholar] [CrossRef] [PubMed]
- Giovannelli, D.; Chung, M.; Staley, J.; Starovoytov, V.; Le Bris, N.; Vetriani, C. Sulfurovum riftiae sp. nov., a mesophilic, thiosulfate-oxidizing, nitrate-reducing chemolithoautotrophic epsilonproteobacterium isolated from the tube of the deep-sea hydrothermal vent polychaete Riftia pachyptila. Int. J. Syst. Evol. Microbiol. 2016, 66, 2697–2701. [Google Scholar] [CrossRef] [PubMed]
- Nakagawa, S.; Takaki, Y.; Shimamura, S.; Reysenbach, A.-L.; Takai, K.; Horikoshi, K. Deep-sea vent -proteobacterial genomes provide insights into emergence of pathogens. Proc. Natl. Acad. Sci. USA 2007, 104, 12146–12150. [Google Scholar] [CrossRef] [Green Version]
- Waite, D.W.; VanWonterghem, I.; Rinke, C.; Parks, D.H.; Zhang, Y.; Takai, K.; Sievert, S.M.; Simon, J.; Campbell, B.J.; Hanson, T.E.; et al. Comparative genomic analysis of the class Epsilonproteobacteria and proposed reclassification to Epsilonbacteraeota (phyl. nov.). Front. Microbiol. 2017, 8, 682. [Google Scholar] [CrossRef] [PubMed]
- Waite, D.W.; VanWonterghem, I.; Rinke, C.; Parks, D.H.; Zhang, Y.; Takai, K.; Sievert, S.M.; Simon, J.; Campbell, B.J.; Hanson, T.E.; et al. Addendum: Comparative genomic analysis of the class Epsilonproteobacteria and proposed reclassification to Epsilonbacteraeota (phyl. nov.). Front. Microbiol. 2018, 9, 772. [Google Scholar] [CrossRef] [PubMed]
- Labonté, J.M.; Pachiadaki, M.; Fergusson, E.; McNichol, J.; Grosche, A.; Gulmann, L.K.; Vetriani, C.; Sievert, S.M.; Stepanauskas, R. Single cell genomics-based analysis of gene content and expression of prophages in a diffuse-flow deep-sea hydrothermal system. Front. Microbiol. 2019, 10, 1262. [Google Scholar] [CrossRef] [Green Version]
- Sievert, S.; Vetriani, C. Chemoautotrophy at deep-sea vents: Past, present, and future. Oceanography 2012, 25, 218–233. [Google Scholar] [CrossRef]
- Takai, K.; Inagaki, F.; Nakagawa, S.; Hirayama, H.; Nunoura, T.; Sako, Y.; Nealson, K.H.; Horikoshi, K. Isolation and phylogenetic diversity of members of previously uncultivated ε-Proteobacteria in deep-sea hydrothermal fields. FEMS Microbiol. Lett. 2003, 218, 167–174. [Google Scholar] [CrossRef] [Green Version]
- NCBI-Taxonomy. Available online: https://www.ncbi.nlm.nih.gov/taxonomy (accessed on 20 February 2020).
- Lloyd, N.A.; Nazaret, S.; Barkay, T. Genome-facilitated discovery of RND efflux pump-mediated resistance to cephalosporins in Vibrio spp. isolated from the mummichog fish gut. J. Glob. Antimicrob. Resist. 2019, 19, 294–300. [Google Scholar] [CrossRef]
- Turner, J.W.; Tallman, J.J.; Macias, A.; Pinnell, L.J.; Elledge, N.C.; Azadani, D.N.; Nilsson, W.B.; Paranjpye, R.N.; Armbrust, E.V.; Strom, M.S. Comparative genomic analysis of Vibrio diabolicus and six taxonomic synonyms: A first look at the distribution and diversity of the expanded species. Front. Microbiol. 2018, 9, 1893. [Google Scholar] [CrossRef] [Green Version]
- Kashefi, K.; Holmes, D.E.; Baross, J.A.; Lovley, D.R. Thermophily in the Geobacteraceae: Geothermobacter ehrlichii gen. nov., sp. nov., a novel thermophilic member of the Geobacteraceae from the “Bag City” hydrothermal vent. Appl. Environ. Microbiol. 2003, 69, 2985–2993. [Google Scholar] [CrossRef] [Green Version]
- Tully, B.J.; Savalia, P.; Abuyen, K.; Baughan, C.; Romero, E.; Ronkowski, C.; Torres, B.; Tremblay, J.; Trujillo, A.; Tyler, M.; et al. Genome sequence of Geothermobacter sp. strain EPR-M, a deep-sea hydrothermal vent iron reducer. Genome Announc. 2017, 5, e00424-17. [Google Scholar] [CrossRef] [PubMed] [Green Version]
- Smith, H.; Abuyen, K.; Tremblay, J.; Savalia, P.; Pérez-Rodríguez, I.; Emerson, D.; Tully, B.J.; Amend, J. Genome Sequence of Geothermobacter sp. Strain HR-1, an Iron Reducer from the Lō ‘ihi Seamount, Hawai’i. Genome Announc. 2018, 6, e00339-18. [Google Scholar] [CrossRef] [PubMed] [Green Version]
- Gomez-Saez, G.V.; Ristova, P.P.; Sievert, S.M.; Elvert, M.; Hinrichs, K.-U.; Bühring, S.I. Relative importance of chemoautotrophy for primary production in a light exposed marine shallow hydrothermal system. Front. Microbiol. 2017, 8, 702. [Google Scholar] [CrossRef] [PubMed] [Green Version]
- Yuan, H.-Y.; Ding, L.-J.; Wang, N.; Chen, S.-C.; Deng, Y.; Li, X.-M.; Zhu, Y.-G. Geographic distance and amorphous iron affect the abundance and distribution of Geobacteraceae in paddy soils in China. J. Soils Sediments 2016, 16, 2657–2665. [Google Scholar] [CrossRef]
- Han, Y.; Perner, M. The globally widespread genus Sulfurimonas: Versatile energy metabolisms and adaptations to redox clines. Front. Microbiol. 2015, 6, 989. [Google Scholar] [CrossRef] [Green Version]
- Notredame, C.; Higgins, D.G.; Heringa, J. T-coffee: A novel method for fast and accurate multiple sequence alignment1. J. Mol. Biol. 2000, 302, 205–217. [Google Scholar] [CrossRef] [Green Version]
- Di Tommaso, P.; Moretti, S.; Xenarios, I.; Orobitg, M.; Montanyola, A.; Chang, J.-M.; Taly, J.-F.; Notredame, C. T-Coffee: A web server for the multiple sequence alignment of protein and RNA sequences using structural information and homology extension. Nucleic Acids Res. 2011, 39, W13–W17. [Google Scholar] [CrossRef]
- Di Fiore, A.; Capasso, C.; De Luca, V.; Monti, S.M.; Carginale, V.; Supuran, C.T.; Scozzafava, A.; Pedone, C.; Rossi, M.; De Simone, G. X-ray structure of the first extremo-α-carbonic anhydrase’, a dimeric enzyme from the thermophilic bacterium Sulfurihydrogenibium yellowstonense YO3AOP1. Acta Crystallogr. Sect. D Biol. Crystallogr. 2013, 69, 1150–1159. [Google Scholar] [CrossRef]
- Huang, S.; Xue, Y.; Sauer-Eriksson, E.; Chirica, L.; Lindskog, S.; Jonsson, B.H. Crystal structure of carbonic anhydrase from Neisseria gonorrhoeae and its complex with the inhibitor acetazolamide. J. Mol. Biol. 1998, 283, 301–310. [Google Scholar] [CrossRef]
- Suzuki, K.; Yang, S.-Y.; Shimizu, S.; Morishita, E.C.; Jiang, J.; Zhang, F.; Hoque, M.; Sato, Y.; Tsunoda, M.; Sekiguchi, T.; et al. The unique structure of carbonic anhydrase αCA1 from Chlamydomonas reinhardtii. Sect. D Biol. Crystallogr. 2011, 67, 894–901. [Google Scholar] [CrossRef]
- Waheed, A.; Sly, W.S. Carbonic anhydrase XII functions in health and disease. Gene 2017, 623, 33–40. [Google Scholar] [CrossRef]
- Alexander, R.S.; Nair, S.K.; Christianson, D.W. Engineering the hydrophobic pocket of carbonic anhydrase II. Biochem. 1991, 30, 11064–11072. [Google Scholar] [CrossRef] [PubMed]
- Modakh, J.K.; Liu, Y.C.; Machuca, M.A.; Supuran, C.T.; Roujeinikova, A. Structural basis for the inhibition of Helicobacter pylori α-carbonic anhydrase by sulfonamides. PLoS ONE 2015, 10, e0127149. [Google Scholar] [CrossRef] [PubMed]
- Liang, J.Y.; Lipscomb, W.N. Binding of substrate CO2 to the active site of human carbonic anhydrase II: A molecular dynamics study. Proc. Natl. Acad. Sci. USA 1990, 87, 3675–3679. [Google Scholar] [CrossRef] [PubMed] [Green Version]
- Domsic, J.F.; Avvaru, B.S.; Kim, C.U.; Gruner, S.M.; Agbandje-McKenna, M.; Silverman, D.N.; McKenna, R. Entrapment of carbon dioxide in the active site of carbonic anhydrase II. J. Biol. Chem. 2008, 283, 30766–30771. [Google Scholar] [CrossRef] [PubMed] [Green Version]
- Sanyanga, T.A.; Nizami, B.; Tastan Bishop, Ö. Mechanism of Action of Non-Synonymous Single Nucleotide Variations Associated with α-Carbonic Anhydrase II Deficiency. Molecules 2019, 24, 3987. [Google Scholar] [CrossRef] [Green Version]
- Silhavy, T.J.; Kahne, D.; Walker, S. The bacterial cell envelope. Cold Spring Harb. Perspect. Biol. 2010, 2, a000414. [Google Scholar] [CrossRef]
- Lovejoy, D.A.; Hewett-Emmett, D.; Porter, C.A.; Cepoi, D.; Sheffield, A.; Vale, W.W.; Tashian, R.E. Evolutionarily Conserved, “Acatalytic” Carbonic Anhydrase-Related Protein XI Contains a Sequence Motif Present in the Neuropeptide Sauvagine: The Human CA-RPXI Gene (CA11) Is Embedded between the Secretor Gene Cluster and the DBP Gene at 19q13. 3. Genom. 1998, 54, 484–493. [Google Scholar] [CrossRef]
- Chirica, L.C.; Elleby, B.; Jonsson, B.-H.; Lindskog, S. The complete sequence, expression in Escherichia coli, purification and some properties of carbonic anhydrase from Neisseria gonorrhoeae. JBIC J. Biol. Inorg. Chem. 1997, 244, 755–760. [Google Scholar] [CrossRef]
- Frank, K.; Sippl, M.J. High-performance signal peptide prediction based on sequence alignment techniques. Bioinformatics 2008, 24, 2172–2176. [Google Scholar] [CrossRef]
- Käll, L.; Krogh, A.; Sonnhammer, E.L. A combined transmembrane topology and signal peptide prediction method. J. Mol. Biol. 2004, 338, 1027–1036. [Google Scholar] [CrossRef]
- Bailey, T.L.; Bodén, M.; Buske, F.A.; Frith, M.C.; Grant, C.E.; Clementi, L.; Ren, J.; Li, W.W.; Noble, W.S. MEME SUITE: Tools for motif discovery and searching. Nucleic Acids Res. 2009, 37, w202–w208. [Google Scholar] [CrossRef]
- Laitaoja, M.; Valjakka, J.; Jänis, J. Zinc coordination spheres in protein structures. Inorg. Chem. 2013, 52, 10983–10991. [Google Scholar] [CrossRef]
- Alterio, V.; Di Fiore, A.; D’Ambrosio, K.; Supuran, C.T.; De Simone, G. Multiple binding modes of inhibitors to carbonic anhydrases: How to design specific drugs targeting 15 different isoforms? Chem. Rev. 2012, 112, 4421–4468. [Google Scholar] [CrossRef] [Green Version]
- Compostella, M.E.; Berto, P.; Vallese, F.; Zanotti, G. Structure of α-carbonic anhydrase from the human pathogen Helicobacter pylori. Acta Crystallogr. Sect. F Struct. Biol. Commun. 2015, 71, 1005–1011. [Google Scholar] [CrossRef] [Green Version]
- Laskowski, R.A.; MacArthur, M.W.; Moss, D.S.; Thornton, J.M. PROCHECK: A program to check the stereochemical quality of protein structures. J. Appl. Crystallogr. 1993, 26, 283–291. [Google Scholar] [CrossRef]
- Eisenberg, D.; Lüthy, R.; Bowie, J.U. [20] VERIFY3D: Assessment of protein models with three-dimensional profiles. In Methods in Enzymology; Elsevier: Amsterdam, The Netherlands, 1997; Volume 277, pp. 396–404. [Google Scholar]
- Kortemme, T.; Kim, D.E.; Baker, D. Computational Alanine Scanning of Protein-Protein Interfaces. Sci. Signal. 2004, 2004, pl2. [Google Scholar] [CrossRef] [Green Version]
- Tina, K.G.; Bhadra, R.; Srinivasan, N. PIC: Protein Interactions Calculator. Nucleic Acids Res. 2007, 35, W473–W476. [Google Scholar] [CrossRef] [Green Version]
- Krissinel, E.; Henrick, K. Inference of macromolecular assemblies from crystalline state. J. Mol. Biol. 2007, 372, 774–797. [Google Scholar] [CrossRef]
- Bosshard, H.R.; Marti, D.N.; Jelesarov, I. Protein stabilization by salt bridges: Concepts, experimental approaches and clarification of some misunderstandings. J. Mol. Recognit. 2004, 17, 1–16. [Google Scholar] [CrossRef]
- Costantini, S.; Colonna, G.; Facchiano, A.M. ESBRI: A web server for evaluating salt bridges in proteins. Bioinformation 2008, 3, 137–138. [Google Scholar] [CrossRef]
- Chan, C.-H.; Yu, T.-H.; Wong, K.-B. Stabilizing Salt-Bridge Enhances Protein Thermostability by Reducing the Heat Capacity Change of Unfolding. PLoS ONE 2011, 6, e21624. [Google Scholar] [CrossRef] [Green Version]
- Liu, Z.; Lemmonds, S.; Huang, J.; Tyagi, M.; Hong, L.; Jain, N.U. Entropic contribution to enhanced thermal stability in the thermostable P450 CYP119. Proc. Natl. Acad. Sci. USA 2018, 115, E10049–E10058. [Google Scholar] [CrossRef] [Green Version]
- Surpeta, B.; Sequeiros-Borja, C.E.; Brezovský, J. Dynamics, a Powerful Component of Current and Future in Silico Approaches for Protein Design and Engineering. Int. J. Mol. Sci. 2020, 21, 2713. [Google Scholar] [CrossRef] [Green Version]
- Hubbard, R.E.; Haider, M.K. Hydrogen Bonds in Proteins: Role and Strength; John Wiley & Sons, Ltd.: Hoboken, NJ, USA, 2010; pp. 1–3. [Google Scholar] [CrossRef]
- Pace, C.N.; Fu, H.; Fryar, K.L.; Landua, J.; Trevino, S.R.; Schell, D.; Thurlkill, R.L.; Imura, S.; Scholtz, J.M.; Gajiwala, K.S.; et al. Contribution of hydrogen bonds to protein stability. Protein Sci. 2014, 23, 652–661. [Google Scholar] [CrossRef]
- Roe, D.R.; Cheatham, I.T.E. PTRAJ and CPPTRAJ: Software for processing and analysis of molecular dynamics trajectory data. J. Chem. Theory Comput. 2013, 9, 3084–3095. [Google Scholar] [CrossRef]
- Sheik Amamuddy, O.; Verkhivker, G.M.; Tastan Bishop, Ö. Impact of Early Pandemic Stage Mutations on Molecular Dynamics of SARS-CoV-2 Mpro. J. Chem. Inf. Model. 2020, 60, 5080–5102. [Google Scholar] [CrossRef]
- Vihinen, M. Relationship of protein flexibility to thermostability. Protein Eng. Des. Sel. 1987, 1, 477–480. [Google Scholar] [CrossRef]
- Vieille, C.; Zeikus, G.J. Hyperthermophilic Enzymes: Sources, Uses, and Molecular Mechanisms for Thermostability. Microbiol. Mol. Biol. Rev. 2001, 65, 1–43. [Google Scholar] [CrossRef] [Green Version]
- Kwok, S.C.; Mant, C.T.; Hodges, R.S. Importance of secondary structural specificity determinants in protein folding: Insertion of a native β-sheet sequence into an α-helical coiled-coil. Protein Sci. 2002, 11, 1519–1531. [Google Scholar] [CrossRef]
- Bharatiy, S.K.; Hazra, M.; Paul, M.; Mohapatra, S.; Samantaray, D.; Dubey, R.C.; Sanyal, S.; Datta, S.; Hazra, S. In silico designing of an industrially sustainable carbonic anhydrase using molecular dynamics simulation. ACS Omega 2016, 1, 1081–1103. [Google Scholar] [CrossRef]
- Candotti, M.; Perez, A.; Ferrer-Costa, C.; Rueda, M.; Meyer, T.; Gelpi, J.L.; Orozco, M. Exploring early stages of the chemical unfolding of proteins at the proteome scale. PLoS Comput. Biol. 2013, 9, e1003393. [Google Scholar] [CrossRef] [Green Version]
- Kabsch, W.; Sander, C. Dictionary of protein secondary structure: Pattern recognition of hydrogen-bonded and geometrical features. Biopolymolecules 1983, 22, 2577–2637. [Google Scholar] [CrossRef]
- Sayers, E.W.; Barrett, T.; Benson, D.A.; Bolton, E.; Bryant, S.H.; Canese, K.; Chetvernin, V.; Church, D.M.; DiCuccio, M.; Federhen, S.; et al. Database resources of the National Center for Biotechnology Information. Nucleic Acids Res. 2010, 39, D38–D51. [Google Scholar] [CrossRef] [Green Version]
- Takai, K.; Nealson, K.H.; Horikoshi, K. Hydrogenimonas thermophila gen. nov., sp. nov., a novel thermophilic, hydrogen-oxidizing chemolithoautotroph within the ε-Proteobacteria, isolated from a black smoker in a Central Indian Ridge hydrothermal field. Int. J. Syst. Evol. Microbiol. 2004, 54, 25–32. [Google Scholar] [CrossRef] [Green Version]
- Nakagawa, S.; Takai, K.; Inagaki, F.; Horikoshi, K.; Sako, Y. Nitratiruptor tergarcus gen. nov., sp. nov. and Nitratifractor salsuginis gen. nov., sp. nov., nitrate-reducing chemolithoautotrophs of the ε-Proteobacteria isolated from a deep-sea hydrothermal system in the Mid-Okinawa Trough. Int. J. Syst. Evol. Microbiol. 2005, 55, 925–933. [Google Scholar] [CrossRef]
- Nakagawa, S.; Takai, K.; Inagaki, F.; Hirayama, H.; Nunoura, T.; Horikoshi, K.; Sako, Y. Distribution, phylogenetic diversity and physiological characteristics of epsilon-Proteobacteria in a deep-sea hydrothermal field. Environ. Microbiol. 2005, 7, 1619–1632. [Google Scholar] [CrossRef]
- Hasan, N.A.; Grim, C.J.; Lipp, E.K.; Rivera, I.N.G.; Chun, J.; Haley, B.J.; Taviani, E.; Choi, S.Y.; Hoq, M.; Munk, A.C.; et al. Deep-sea hydrothermal vent bacteria related to human pathogenic Vibrio species. Proc. Natl. Acad. Sci. USA 2015, 112, E2813–E2819. [Google Scholar] [CrossRef] [Green Version]
- Berman, H.; Westbrook, J.; Feng, Z.; Gilliland, G.; Bhat, T.; Weissig, H.; Shindyalov, I.N.; Bourne, P.E. The protein data bank. Nucleic Acids Res. 2000, 28, 235–242. [Google Scholar] [CrossRef] [Green Version]
- Vetriani, C.; Speck, M.D.; Ellor, S.V.; Lutz, R.A.; Starovoytov, V. Thermovibrio ammonificans sp. nov., a thermophilic, chemolithotrophic, nitrate-ammonifying bacterium from deep-sea hydrothermal vents. Int. J. Syst. Evol. Microbiol. 2004, 54, 175–181. [Google Scholar] [CrossRef]
- Katoh, K. MAFFT: A novel method for rapid multiple sequence alignment based on fast Fourier transform. Nucleic Acids Res. 2002, 30, 3059–3066. [Google Scholar] [CrossRef] [Green Version]
- Waterhouse, A.M.; Procter, J.B.; Martin, D.M.A.; Clamp, M.; Barton, G.J. Jalview Version 2--a multiple sequence alignment editor and analysis workbench. Bioinformolecules 2009, 25, 1189–1191. [Google Scholar] [CrossRef] [Green Version]
- Hatherley, R.; Clitheroe, C.-L.; Faya, N.; Tastan Bishop, Ö. Plasmodium falciparum Hop: Detailed analysis on complex formation with Hsp70 and Hsp90. Biochem. Biophys. Res. Commun. 2015, 456, 440–445. [Google Scholar] [CrossRef] [Green Version]
- Eaton, J.W.; Bateman, D.; Hauberg, S.; Wehbring, R. GNU Octave version 4.0. 0 manual: A high-level interactive language for numerical computations. In CreateSpace Independent Publishing Platform; Samurai Media Limited: Thames Ditton, UK, 2015. [Google Scholar]
- Kumar, S.; Stecher, G.; Tamura, K. MEGA7: Molecular Evolutionary Genetics Analysis Version 7.0 for Bigger Datasets. Mol. Biol. Evol. 2016, 33, 1870–1874. [Google Scholar] [CrossRef] [Green Version]
- Le, S.Q.; Gascuel, O. An improved general amino acid replacement matrix. Mol. Biol. Evol. 2008, 25, 1307–1320. [Google Scholar] [CrossRef] [Green Version]
- Whelan, S.; Goldman, N. A general empirical model of protein evolution derived from multiple protein families using a maximum-likelihood approach. Mol. Biol. Evol. 2001, 18, 691–699. [Google Scholar] [CrossRef] [Green Version]
- Huson, D.H.; Richter, D.C.; Rausch, C.; Dezulian, T.; Franz, M.; Rupp, R. Dendroscope: An interactive viewer for large phylogenetic trees. BMC Bioinform. 2007, 8, 460–466. [Google Scholar] [CrossRef] [Green Version]
- Bailey, T.L.; Gribskov, M. Combining evidence using p-values: Application to sequence homology searches. Bioinformatics 1998, 14, 48–54. [Google Scholar] [CrossRef] [Green Version]
- Faya, N.; Penkler, D.L.; Tastan Bishop, Ö. Human, vector and parasite Hsp90 proteins: A comparative bioinformatics analysis. FEBS Open Biol. 2015, 5, 916–927. [Google Scholar] [CrossRef] [Green Version]
- Eswar, N.; Webb, B.; Marti-Renom, M.A.; Madhusudhan, M.; Eramian, D.; Shen, M.-Y.; Pieper, U.; Sali, A. Comparative Protein Structure Modeling Using Modeller. Curr. Protoc. Bioinform. 2006, 15, 5.6.1–5.6.30. [Google Scholar] [CrossRef] [Green Version]
- Wiederstein, M.; Sippl, M.J. ProSA-web: Interactive web service for the recognition of errors in three-dimensional structures of proteins. Nucleic Acids Res. 2007, 35, W407–W410. [Google Scholar] [CrossRef] [Green Version]
- DeLano, W. PyMOL: An open-source molecular graphics tool. CCP4 Newsl. Protein Crystallogr. 2002, 40, 82–92. [Google Scholar]
- Cukuroglu, E.; Gursoy, A.; Keskin, O. HotRegion: A database of predicted hot spot clusters. Nucleic Acids Res. 2011, 40, D829–D833. [Google Scholar] [CrossRef]
- Darnell, S.J.; Legault, L.H.; Mitchell, J.C. KFC Server: Interactive forecasting of protein interaction hot spots. Nucleic Acids Res. 2008, 36, W265–W269. [Google Scholar] [CrossRef] [Green Version]
- Sukhwal, A.; Sowdhamini, R. PPCheck: A webserver for the quantitative analysis of protein-protein interfaces and prediction of residue hotspots. Bioinform. Biol. Insights 2015, 9, BBI.SS25928-51. [Google Scholar] [CrossRef]
- Gordon, J.C.; Myers, J.B.; Folta, T.; Shoja, V.; Heath, L.S.; Onufriev, A.V. H++: A server for estimating pKas and adding missing hydrogens to macromolecules. Nucleic Acids Res. 2005, 33, W368–W371. [Google Scholar] [CrossRef]
- Case, D.; Cerutti, D.; Cheatham, T.; Darden, T.; Duke, R.; Giese, T.; Gohlke, H.; Goetz, A.; Greene, D.; Homeyer, N.; et al. Amber 2017, University of California, San Francisco; Technical Report; University of California: San Francisco, CA, USA, 2017. [Google Scholar] [CrossRef]
- Frisch, M.J.; Trucks, G.W.; Schlegel, H.B.; Scuseria, G.E.; Robb, M.A.; Cheeseman, J.R.; Scalmani, G.; Barone, V.; Mennucci, B.; Petersson, G.A.; et al. GAUSSIAN 09 Revision A. 2; Gaussian Inc.: Wallingford, CT, USA, 2009. [Google Scholar]
- Maier, J.A.; Martinez, C.; Kasavajhala, K.; Wickstrom, L.; Hauser, K.E.; Simmerling, C. ff14SB: Improving the accuracy of protein side chain and backbone parameters from ff99SB. J. Chem. Theory Comput. 2015, 11, 3696–3713. [Google Scholar] [CrossRef] [Green Version]
- Schafmeister, C.; Ross, W.; Romanovski, V. LEaP; University of California: San Francisco, CA, USA, 1995. [Google Scholar]
- Da Silva, A.W.S.; Vranken, W.F. ACPYPE antechamber python parser interface. BMC Res. Notes 2012, 5, 367. [Google Scholar] [CrossRef] [Green Version]
- Abraham, M.J.; Murtola, T.; Schulz, R.; Páll, S.; Smith, J.C.; Hess, B.; Lindahl, E. GROMACS: High performance molecular simulations through multi-level parallelism from laptops to supercomputers. SoftwareX 2015, 1, 19–25. [Google Scholar] [CrossRef] [Green Version]
- Mathematica, Version 11.3; Wolfram Research Inc.: Champaign, IL, USA, 2018.


| CA | Organism | Taxonomic Classification | |||
|---|---|---|---|---|---|
| Class | Family | Genus | Reference | ||
| CmCA | Caminibacter mediatlanticus | Campylobacteria | Nautiliaceae | Caminibacter | [58] |
| GEprmCA | Geothermobacter sp. EPR-M | Deltaproteobacteria | Geobacteraceae | Geothermobacter | [63] |
| GHr1CA | Geothermobacter sp. HR-1 | Deltaproteobacteria | Geobacteraceae | Geothermobacter | [63] |
| HtCA | Hydrogenimonas thermophila | Campylobacteria | Hydrogenimonaceae | Hydrogenimonas | [58] |
| LOGACA | Hydrothermal vent metagenome | --- | --- | --- | --- |
| NtCA | Nitratiruptor tergarcus | Campylobacteria | Nitratiruptoraceae | Nitratiruptor | [58] |
| PhCA | Persephonella hydrogeniphila | Aquificacea | Hydrogenothermaceae | Persephonella | [63] |
| PmCA | Persephonella marina | Aquificacea | Hydrogenothermaceae | Persephonella | [63] |
| SlCA | Sulfurovum lithotrophicum | Campylobacteria | Sulfurovaceae | Sulfurovum | [58] |
| SNbcCA | Sulfurovum sp. NBC37-1 | Campylobacteria | Sulfurovaceae | Sulfurovum | [58] |
| SrCA | Sulfurovum riftiae | Campylobacteria | Sulfurovaceae | Sulfurovum | [58] |
| TaCA | Thermovibrio ammonificans | Aquificacea | Desulfurobacteriaceae | Thermovibrio | [63] |
| VaCA1 VaCA2 | Vibrio antiquarius | Gammaproteobacteria | Vibrionaceae | Vibrio | [63] |
| VdCA | Vibrio diabolicus | Gammaproteobacteria | Vibrionaceae | Vibrio | [63] |
| Motif | E-Value | Residues | Function |
|---|---|---|---|
| 1 | 1.5 × 10−251 | YYRYSGSLTTPPCSEGVRWI | Cys197—intra-subunit disulfide Cys [29,34,74,75,76] Leu192, Val201 & Trp203—CO2 binding pocket residues [29,37,75] Thr193 & Thr194—proton shuttling residues [29,34] Arg187, Tyr188, Ser189, Glu199, Gly200, Val201 & Arg202—interface residues (present study) |
| 2 | 9.9 × 10−180 | QFHFHAPSEHKLKGQHYPFE | His107 & His109—Zn2+ coordinating residues [30,31,32] |
| 3 | 1.6 × 10−146 | MGGDTNRPVQPLNARMIME | Asn236, Ala237, Arg238, Met239 & Met241—interface residues (present study) |
| 4 | 7.8 × 10−146 | AHFVHADKHGNLAVIGVFFK | His126—Zn2+ coordinating residues [30,31,32] Val128 & Val138—CO2 binding pocket residing residues [29,34,37,75] Asn135—interface residue (present study) |
| 5 | 2.4 × 10−119 | YHGEHGPEHWGDLKDEYIMC | Tyr25—proton shuttling residue [29,34] Asp39, Ile42 and Met43—interface residues (present study) Cys44—intra-subunit disulfide Cys residue [29,34,74,75,76] |
| 6 | 3.3 × 10−110 | NNGHTIKVSYEPGSYIVVDG | Asn80, His82 & Lys85—proton shuttling residues [29,34,77] Asp97—interface residues (present study) |
| 7 | 7.2 × 10−77 | KNQSPVDINRIVDAKLKPIK | Lys48, Asn49, Arg57, Val59, Asp60, Ala61, Lys62 & Leu63—interface residues (present study) |
| CA | Residues |
|---|---|
| CmCA | Chain A: Asn53h, Asn122, Glu132, Ile144, Val146c, Ala148, Asn197, Glu207h, Gly208, Val209c, Trp211c, Ile247 |
| Chain B: Asn53h Ile57, Asn122, Glu132, Val146 c, Ala148, Phe196, Asn197, Ser199, Glu207 h, Val209 c | |
| GEprmCA | Chain A: Arg48, Asn114, Glu124, Asn135, Val138c, Ser140, Phe188, Val201c, Ile202, Trp203c, Arg238 |
| Chain B: Arg48, Val53, Ile96, Asn114, Glu124, Asn135, Val138 c, Ser140, Val201c, Trp203c, Ala237, Arg238 | |
| GHr1CA | Chain A: Asn38h, Glu113, Asn124, Val127c, Ser129, Phe177, Asn178, Gln188h, Trp192c, Arg227 |
| Chain B: Asn38h, Val42, Asn103, Glu113, Val127c, Ser129, Asn178, Gly189, Val190c, Trp192c, Leu224, Ala226, Arg227h | |
| HtCA | Chain A: Asn54h, Glu130, His132z, Val144c, Asn196, Ser198, Thr200p, Glu206h, Val208c, Trp210c |
| Chain B: Asn54h, Glu130, His132z, Val144c, Ala146, Asn196, Ser198, Glu206h, Val208c, Trp210c, Arg245h, Ile247 | |
| LOGACA | Chain A: Asn59h, Asp107, His136z, Val148c, Ser198, Ser200, Cys206d, Gly209,Val210c, Ala246h, Arg247 |
| Chain B: Asn59h, Val63, His124, Glu134, Val148c, Tyr197, Ser200, Gly209, Val210c,Trp212c, Arg247 | |
| NtCA | Chain A: Gln58, Val61, Asn122, Glu132, Glu143, Val146c, Ala148, Tyr196, Val209c, Trp211c, Arg245h |
| Chain B: Asn57h, Val61, Asn122, Glu143, Val146c, Ala148, Asp197, Val209c, Trp211c, Leu242, His243, Arg245h | |
| PhCA | Chain A: Asn52h, His117, Glu127, Val141c, Ser192, Ser194, Thr196p, Cys200d, Glu202h, Val204c, Asn239, Arg2410h |
| Chain B: Asn52h, Glu127, Val141c,Tyr191, Ser194, Glu202h, Gly203, Val204c, Arg241 | |
| PmCA | Chain A: Asn49h, Val53, His114, Glu124, Val138c, Ser189, Ser191, Cys197d, Val201c, Ala237, |
| Chain B: Asn49h, Val53, Ile55, His114, Glu124, Val138 c, Ser189, Ser191, Cys197 d,Glu199 h, Gly200, Val201 c | |
| SlCA | Chain A: Glu129, Val143c, Ala145, Arg192h, Phe193, Asn194, Ser196, Val206c, Trp208c, Arg243h |
| Chain B: Asn53h, Ile57, Asn119, Leu128, Glu129, Val143c, Ala145, Asn194, Val206c, Trp208c, Arg243h, Val244h, Val245 | |
| SNbcCA | Chain A: Asn53h, Ile57, Glu129, His131z, Val143 c, Ala145, Asn194, Ser196, Glu204, Val206c, Trp208c, Arg243h |
| Chain B: Gly51, Asn53h, Glu129, Val143c, Ala145, Phe193, Asn194, Val206c, Trp208c, Arg243 | |
| SrCA | Chain A: Asn54h, Ile58, Asn120, Glu130, Val144c, Ala146, Phe193, Glu204h, Val206c, Trp208c, Arg243 |
| Chain B: Asn54h, Glu130, Val144c, Ala146, Asn194, Ser196, Glu204h, Val206c, Trp208c, Arg243h | |
| TaCA | Chain A: Ile58, Ser60, Ala63, Val64h, Lys65, Cys67d, Leu68, His119, Val143c, Gly145, Tyr191, Arg192h, Val206c, Ile209, Lys247 |
| Chain B:Val64h, Lys65, Cys67d, Leu68, Gly145, Tyr190, Tyr191, Arg192h, Tyr193, Val206c, Trp208c, Ile209, Lys247 | |
| Chain C: Ile58, Val64h, Lys65, Cys67d, Leu68, His119, Gly145, Tyr191, Arg192h, Arg243h, Lys247 | |
| Chain D: Val64h, Lys65, Cys67d, Leu68, Tyr190, Tyr191, Arg192h, Val206c, Lys247 | |
| VACA1 | Chain A: Thr45, Ile51, Asn112, Glu122, His124z, Val136c, Ser138, Phe185, Asn186, Val198c, Trp200c, Ala233h, Arg234h |
| Chain B: Ile51, Asn112, Val136c, Phe185, Asn186, Ser188, Val198c, Trp200c, Ala233h, Arg234h | |
| VaCA2 | Chain A: Val135c, Ala137, Arg183h, Phe184, Gly196, Val197c, Trp199c, Met234h |
| Chain B: Gln45, Asn46, Ile50, Ile52, Asn111, Glu121, Val135c, Ala137, Phe184, Asn185, Trp199c, Asn231, Ala23h, Arg233, Met234h, Val235 | |
| VdCA | Chain A: Ile50, Asn111, Glu121, Val135c, Ala137, Phe184, Asn185, Val197c, Trp199c, Ala232h, Arg233h |
| Chain B: Asn46h, Ile50, Asn111, Glu121, Val135c, Ala137, Phe184, Asn185, Val197c, Trp199c, Arg233h |
Publisher’s Note: MDPI stays neutral with regard to jurisdictional claims in published maps and institutional affiliations. |
© 2020 by the authors. Licensee MDPI, Basel, Switzerland. This article is an open access article distributed under the terms and conditions of the Creative Commons Attribution (CC BY) license (http://creativecommons.org/licenses/by/4.0/).
Share and Cite
Manyumwa, C.V.; Emameh, R.Z.; Tastan Bishop, Ö. Alpha-Carbonic Anhydrases from Hydrothermal Vent Sources as Potential Carbon Dioxide Sequestration Agents: In Silico Sequence, Structure and Dynamics Analyses. Int. J. Mol. Sci. 2020, 21, 8066. https://doi.org/10.3390/ijms21218066
Manyumwa CV, Emameh RZ, Tastan Bishop Ö. Alpha-Carbonic Anhydrases from Hydrothermal Vent Sources as Potential Carbon Dioxide Sequestration Agents: In Silico Sequence, Structure and Dynamics Analyses. International Journal of Molecular Sciences. 2020; 21(21):8066. https://doi.org/10.3390/ijms21218066
Chicago/Turabian StyleManyumwa, Colleen Varaidzo, Reza Zolfaghari Emameh, and Özlem Tastan Bishop. 2020. "Alpha-Carbonic Anhydrases from Hydrothermal Vent Sources as Potential Carbon Dioxide Sequestration Agents: In Silico Sequence, Structure and Dynamics Analyses" International Journal of Molecular Sciences 21, no. 21: 8066. https://doi.org/10.3390/ijms21218066
APA StyleManyumwa, C. V., Emameh, R. Z., & Tastan Bishop, Ö. (2020). Alpha-Carbonic Anhydrases from Hydrothermal Vent Sources as Potential Carbon Dioxide Sequestration Agents: In Silico Sequence, Structure and Dynamics Analyses. International Journal of Molecular Sciences, 21(21), 8066. https://doi.org/10.3390/ijms21218066