Fluorescence Microscopy-Based Quantitation of GLUT4 Translocation: High Throughput or High Content?

 , , ,
, , ,  and
and 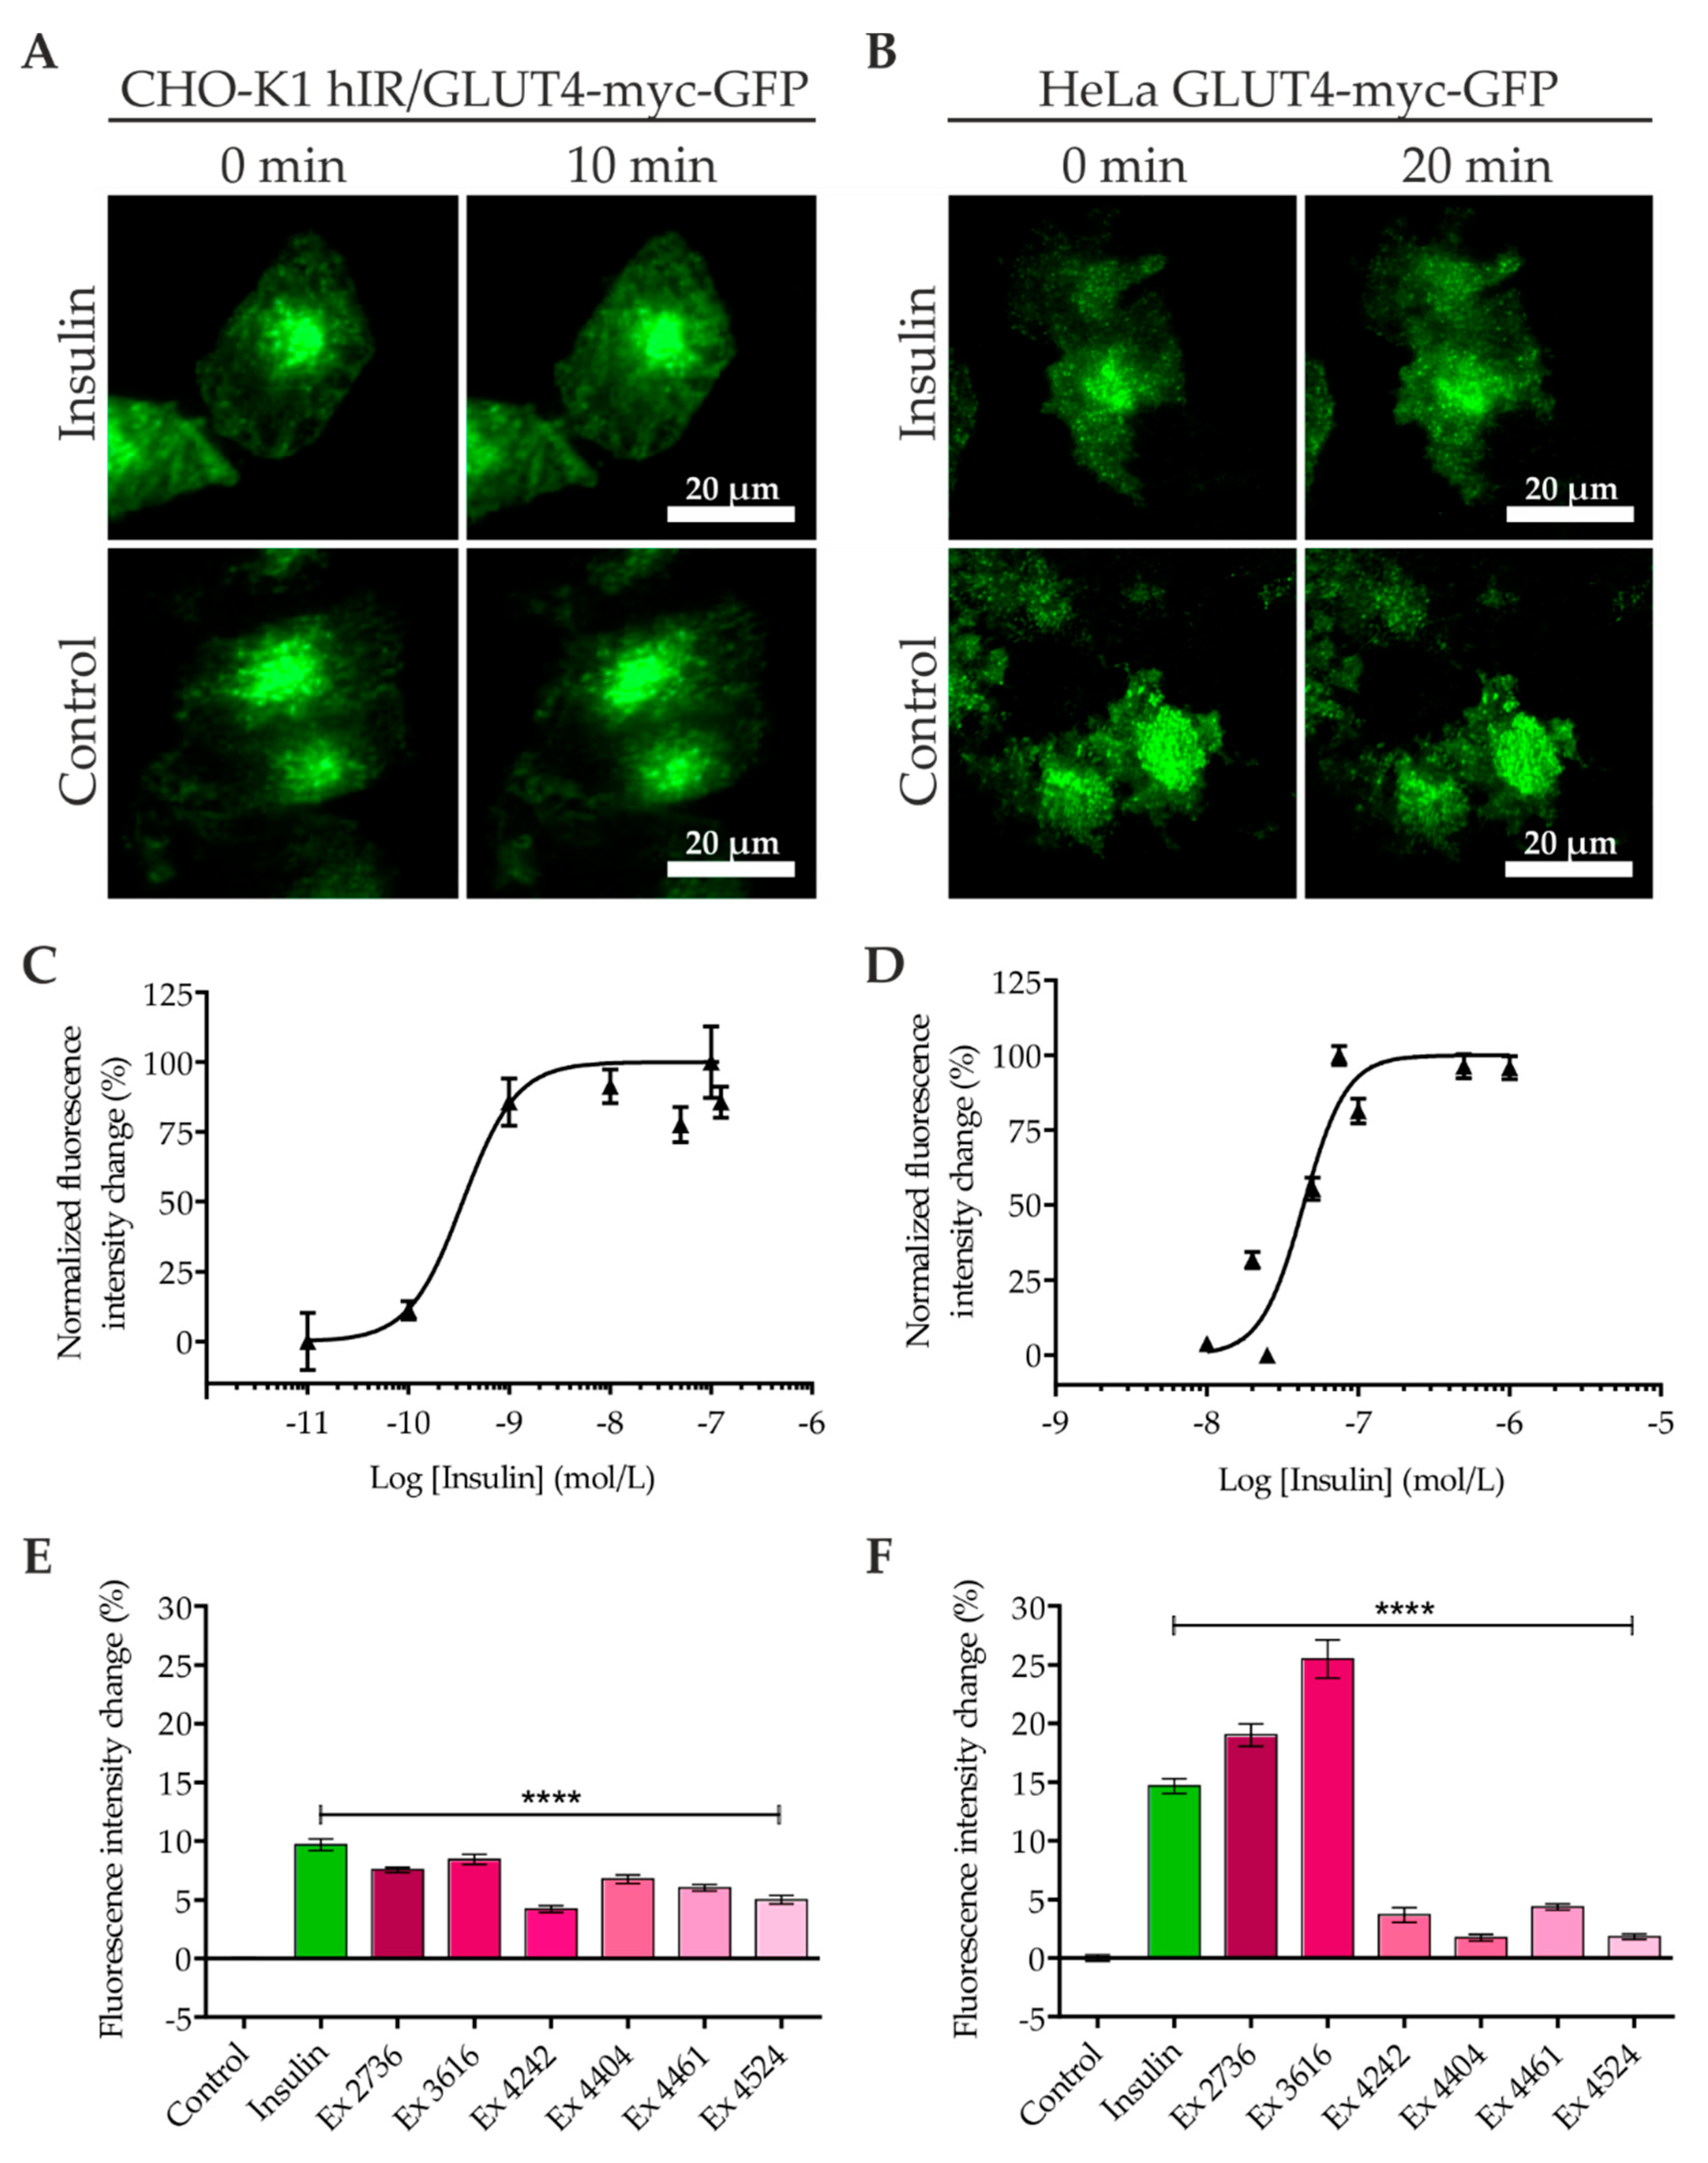
Abstract
1. Introduction
2. Results
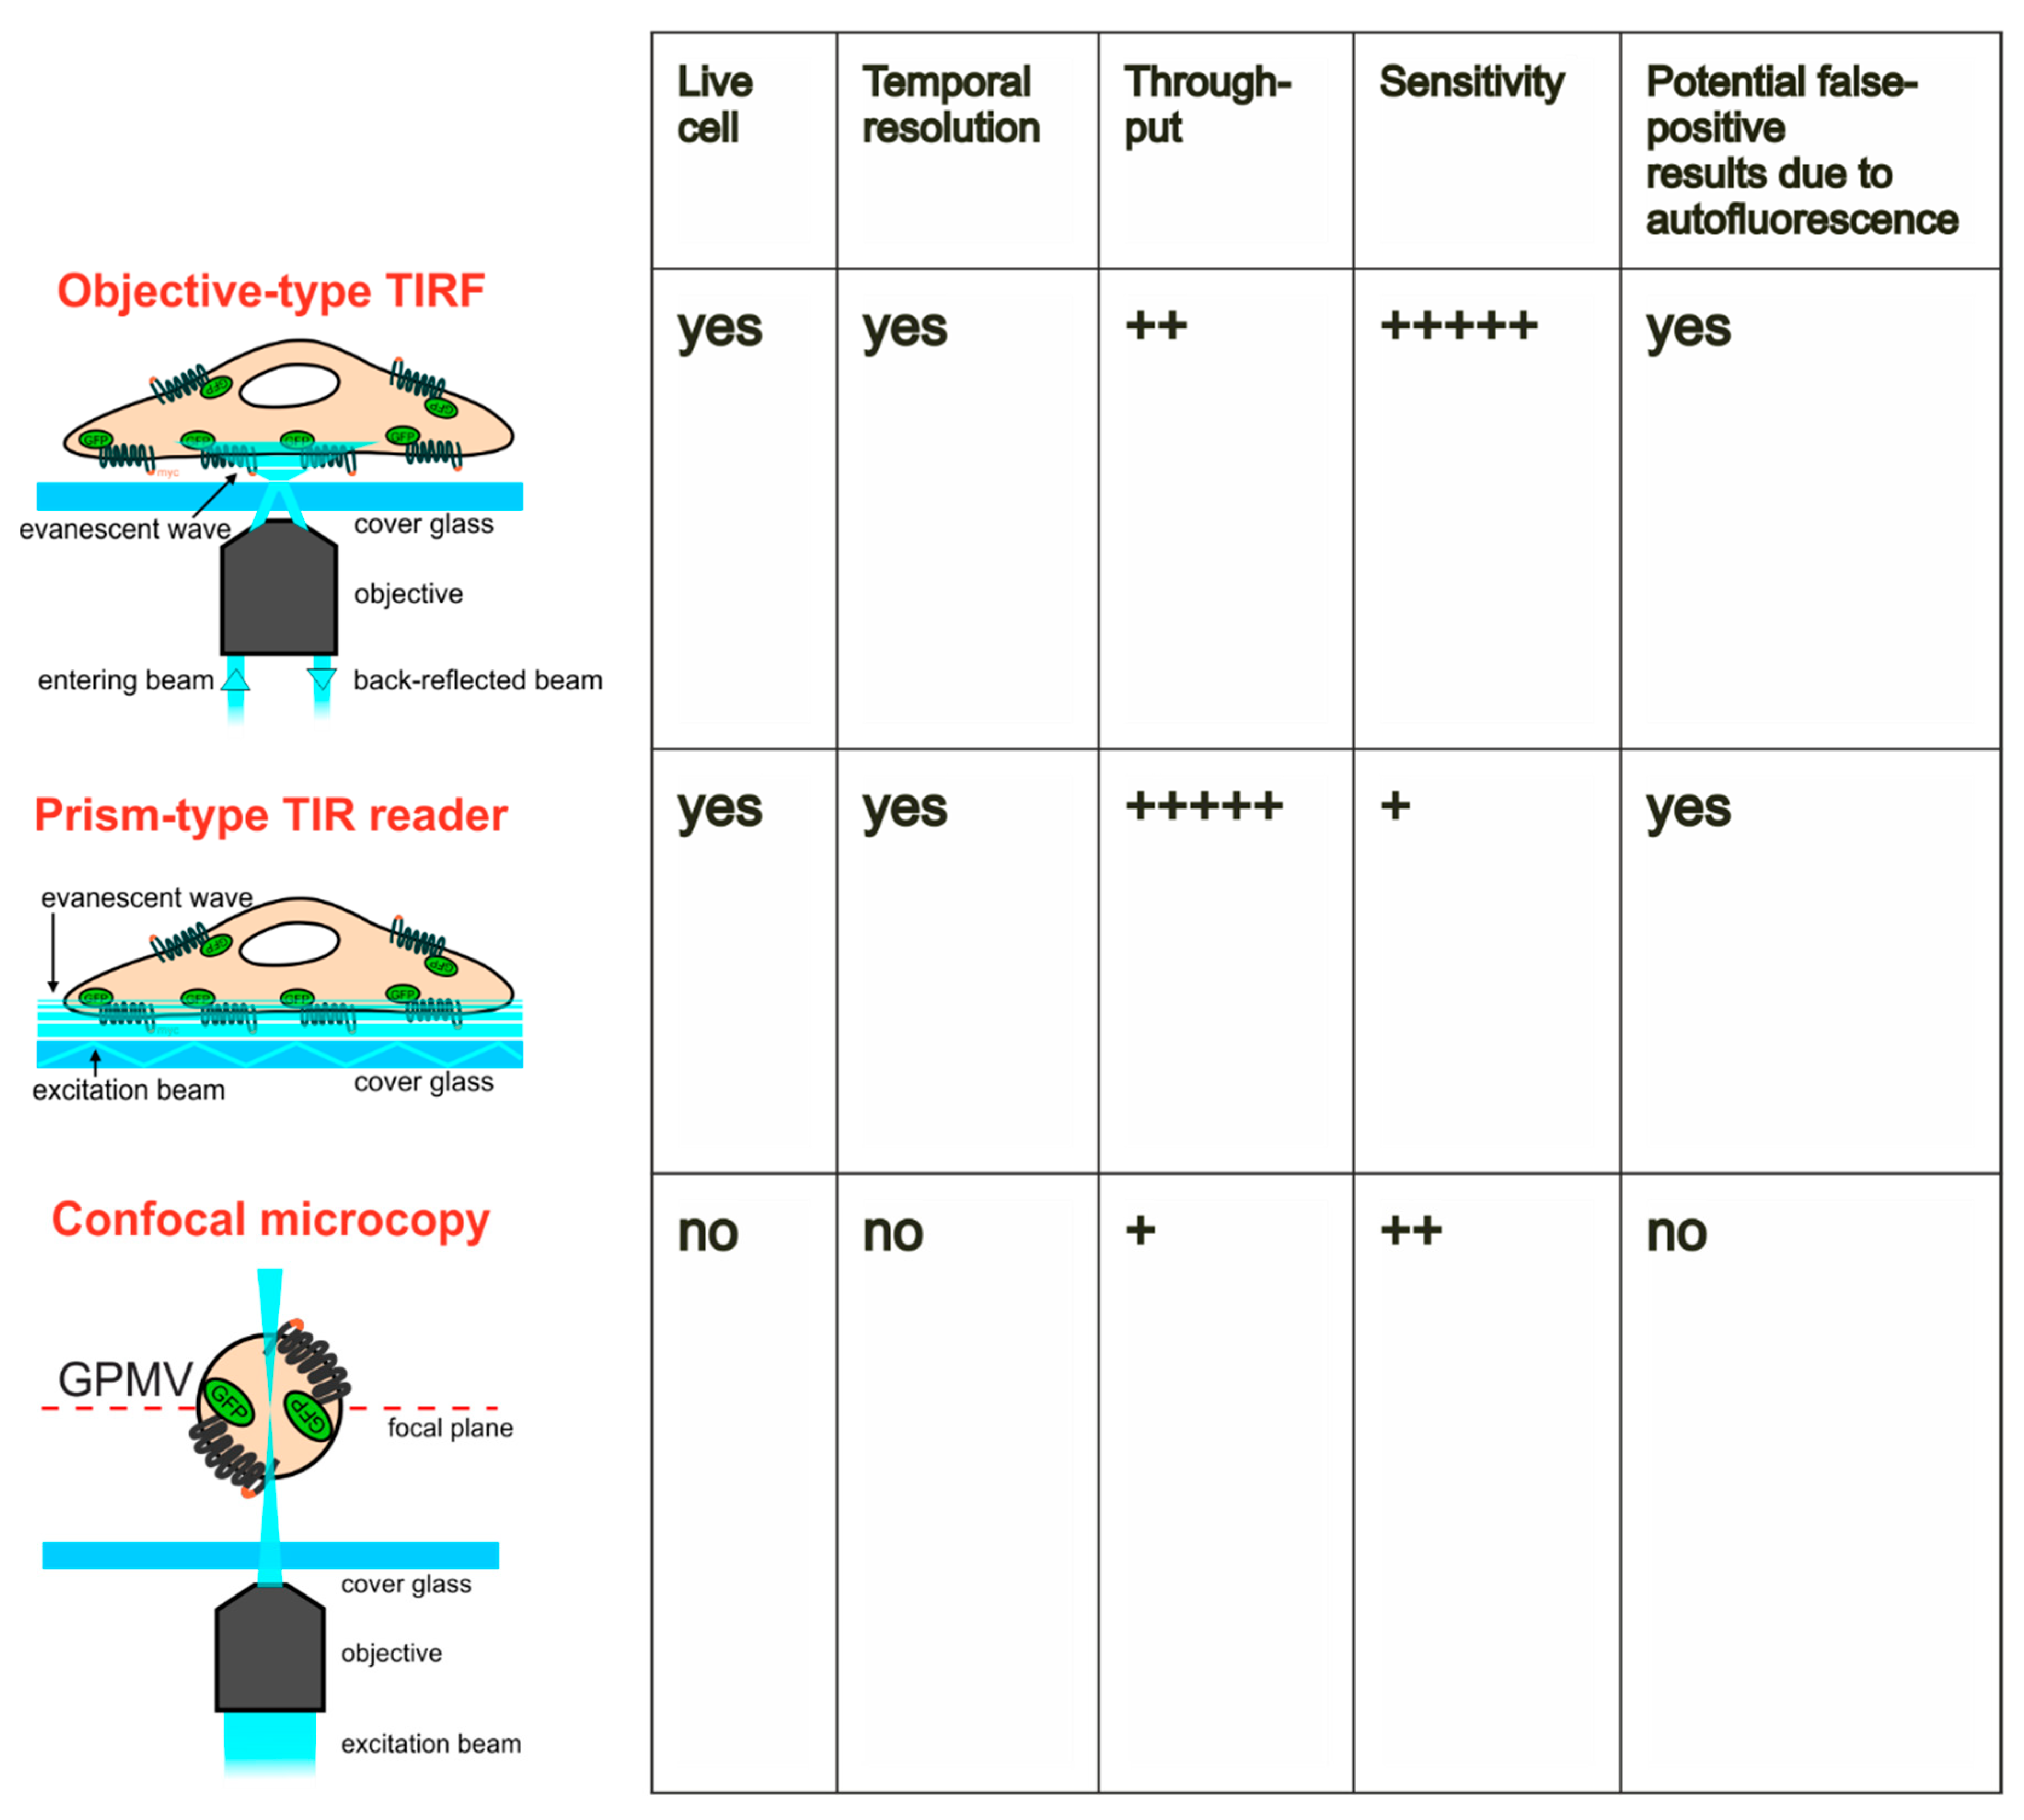
2.1. Quantitation of GLUT4 Translocation by Objective-type Scanning TIRF Microscopy
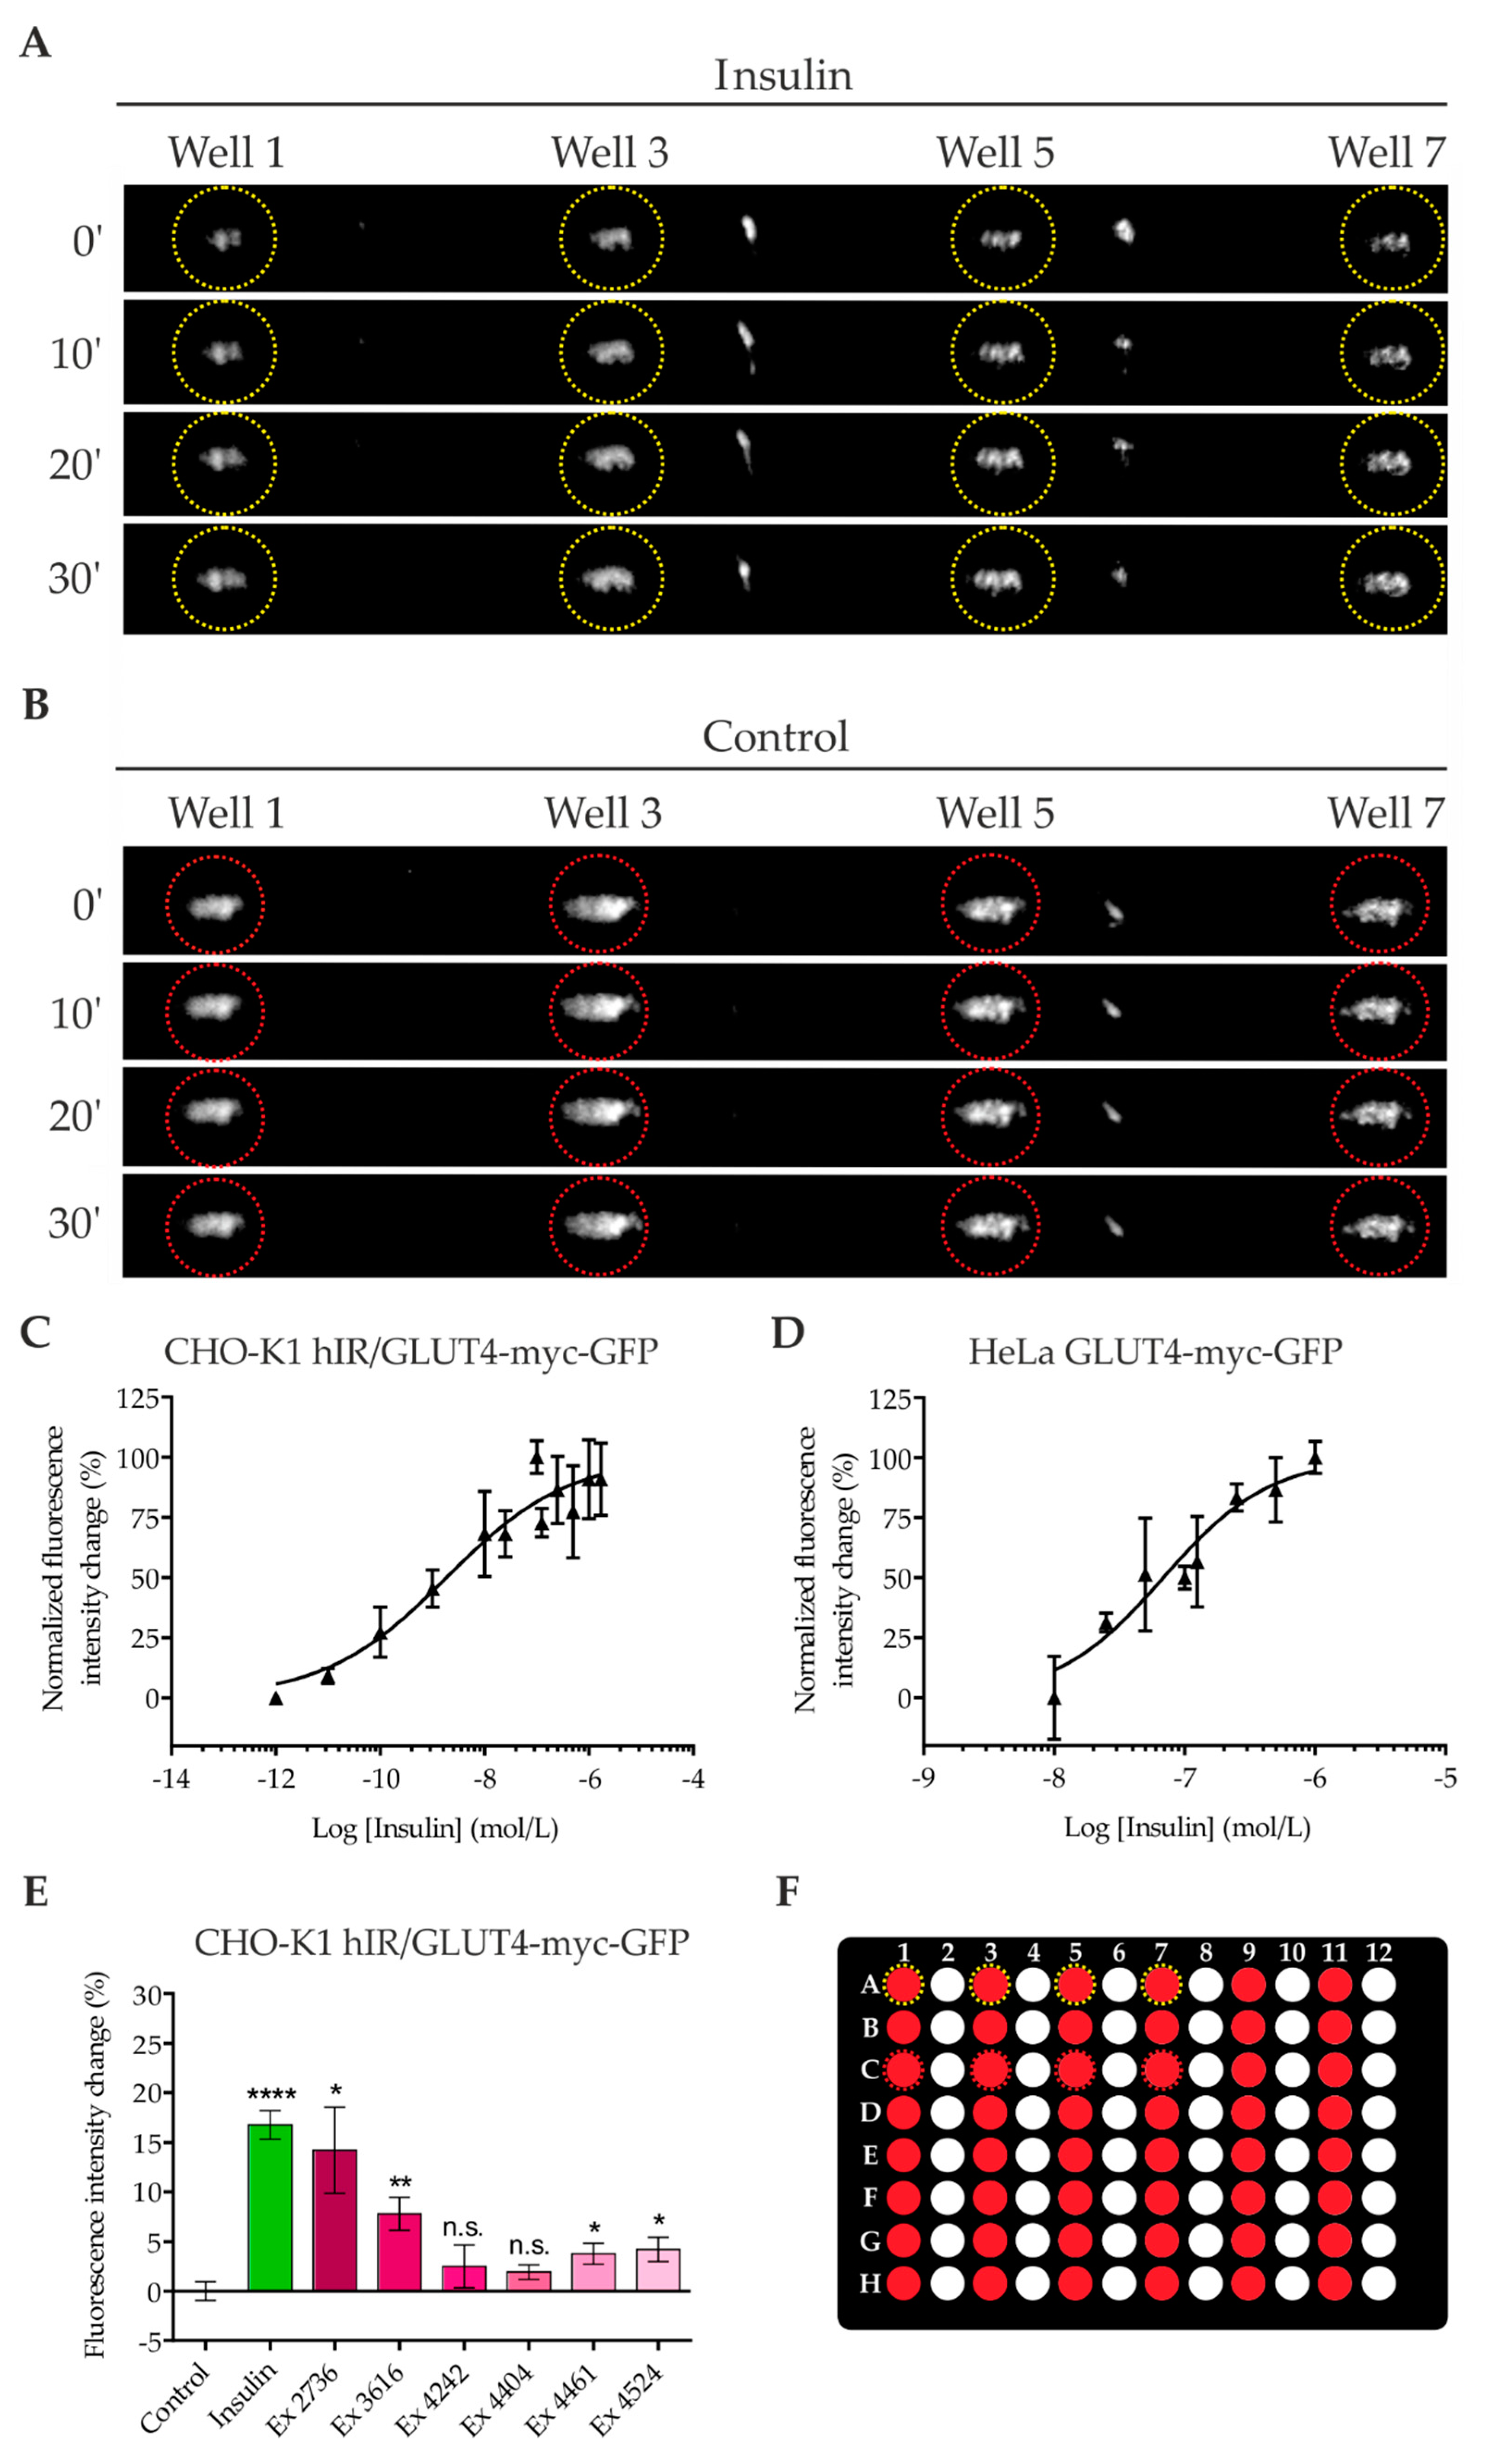
2.2. Quantitation of GLUT4 Translocation Using A Prism-Type TIR Reader
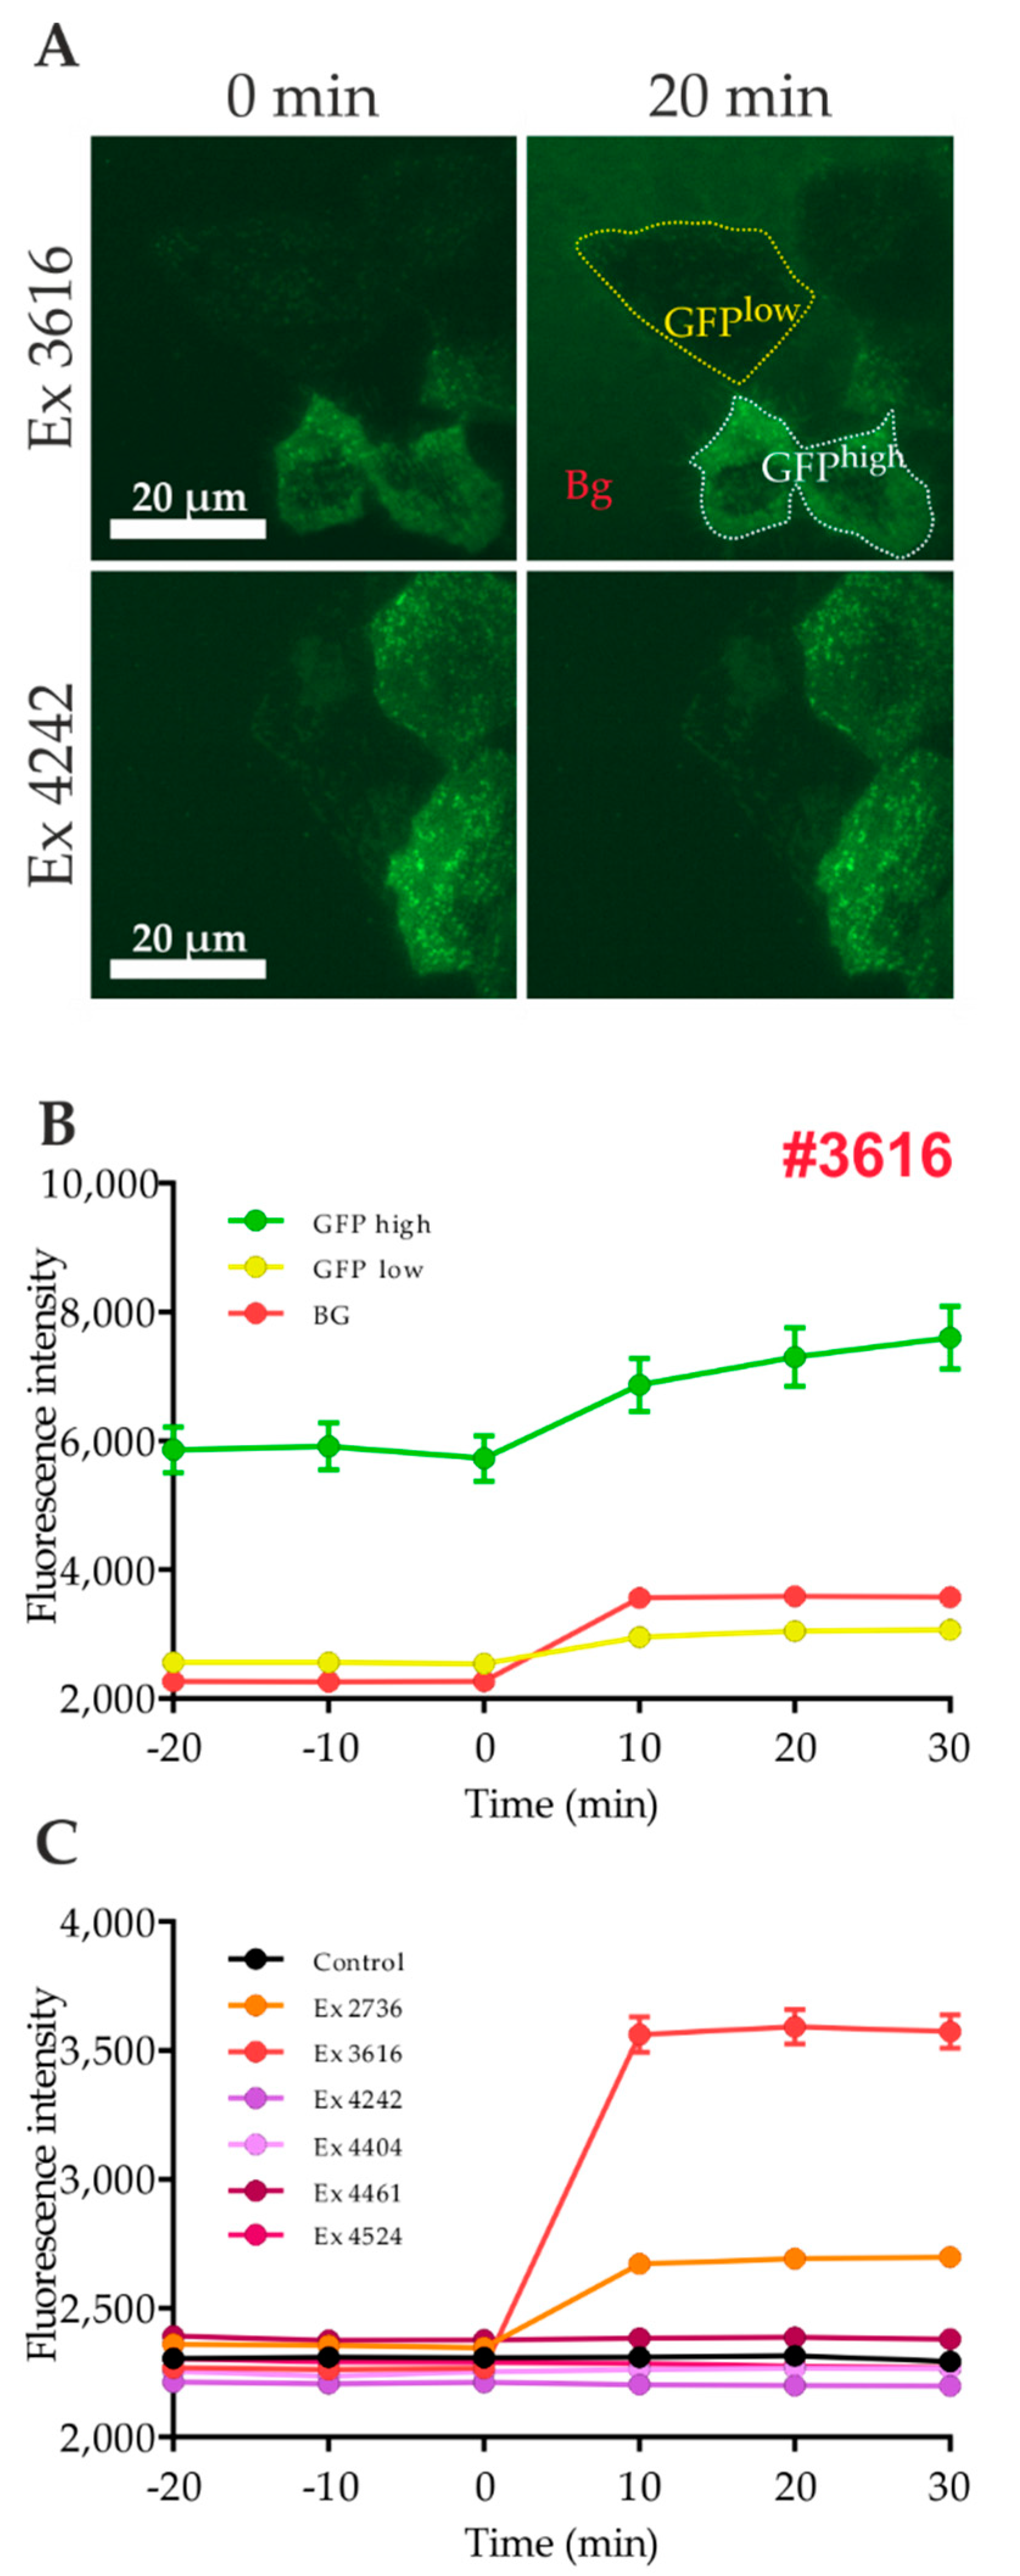
2.3. Influence of Autofluorescence of Tested Compounds on the Quantitation of GLUT4 Translocation
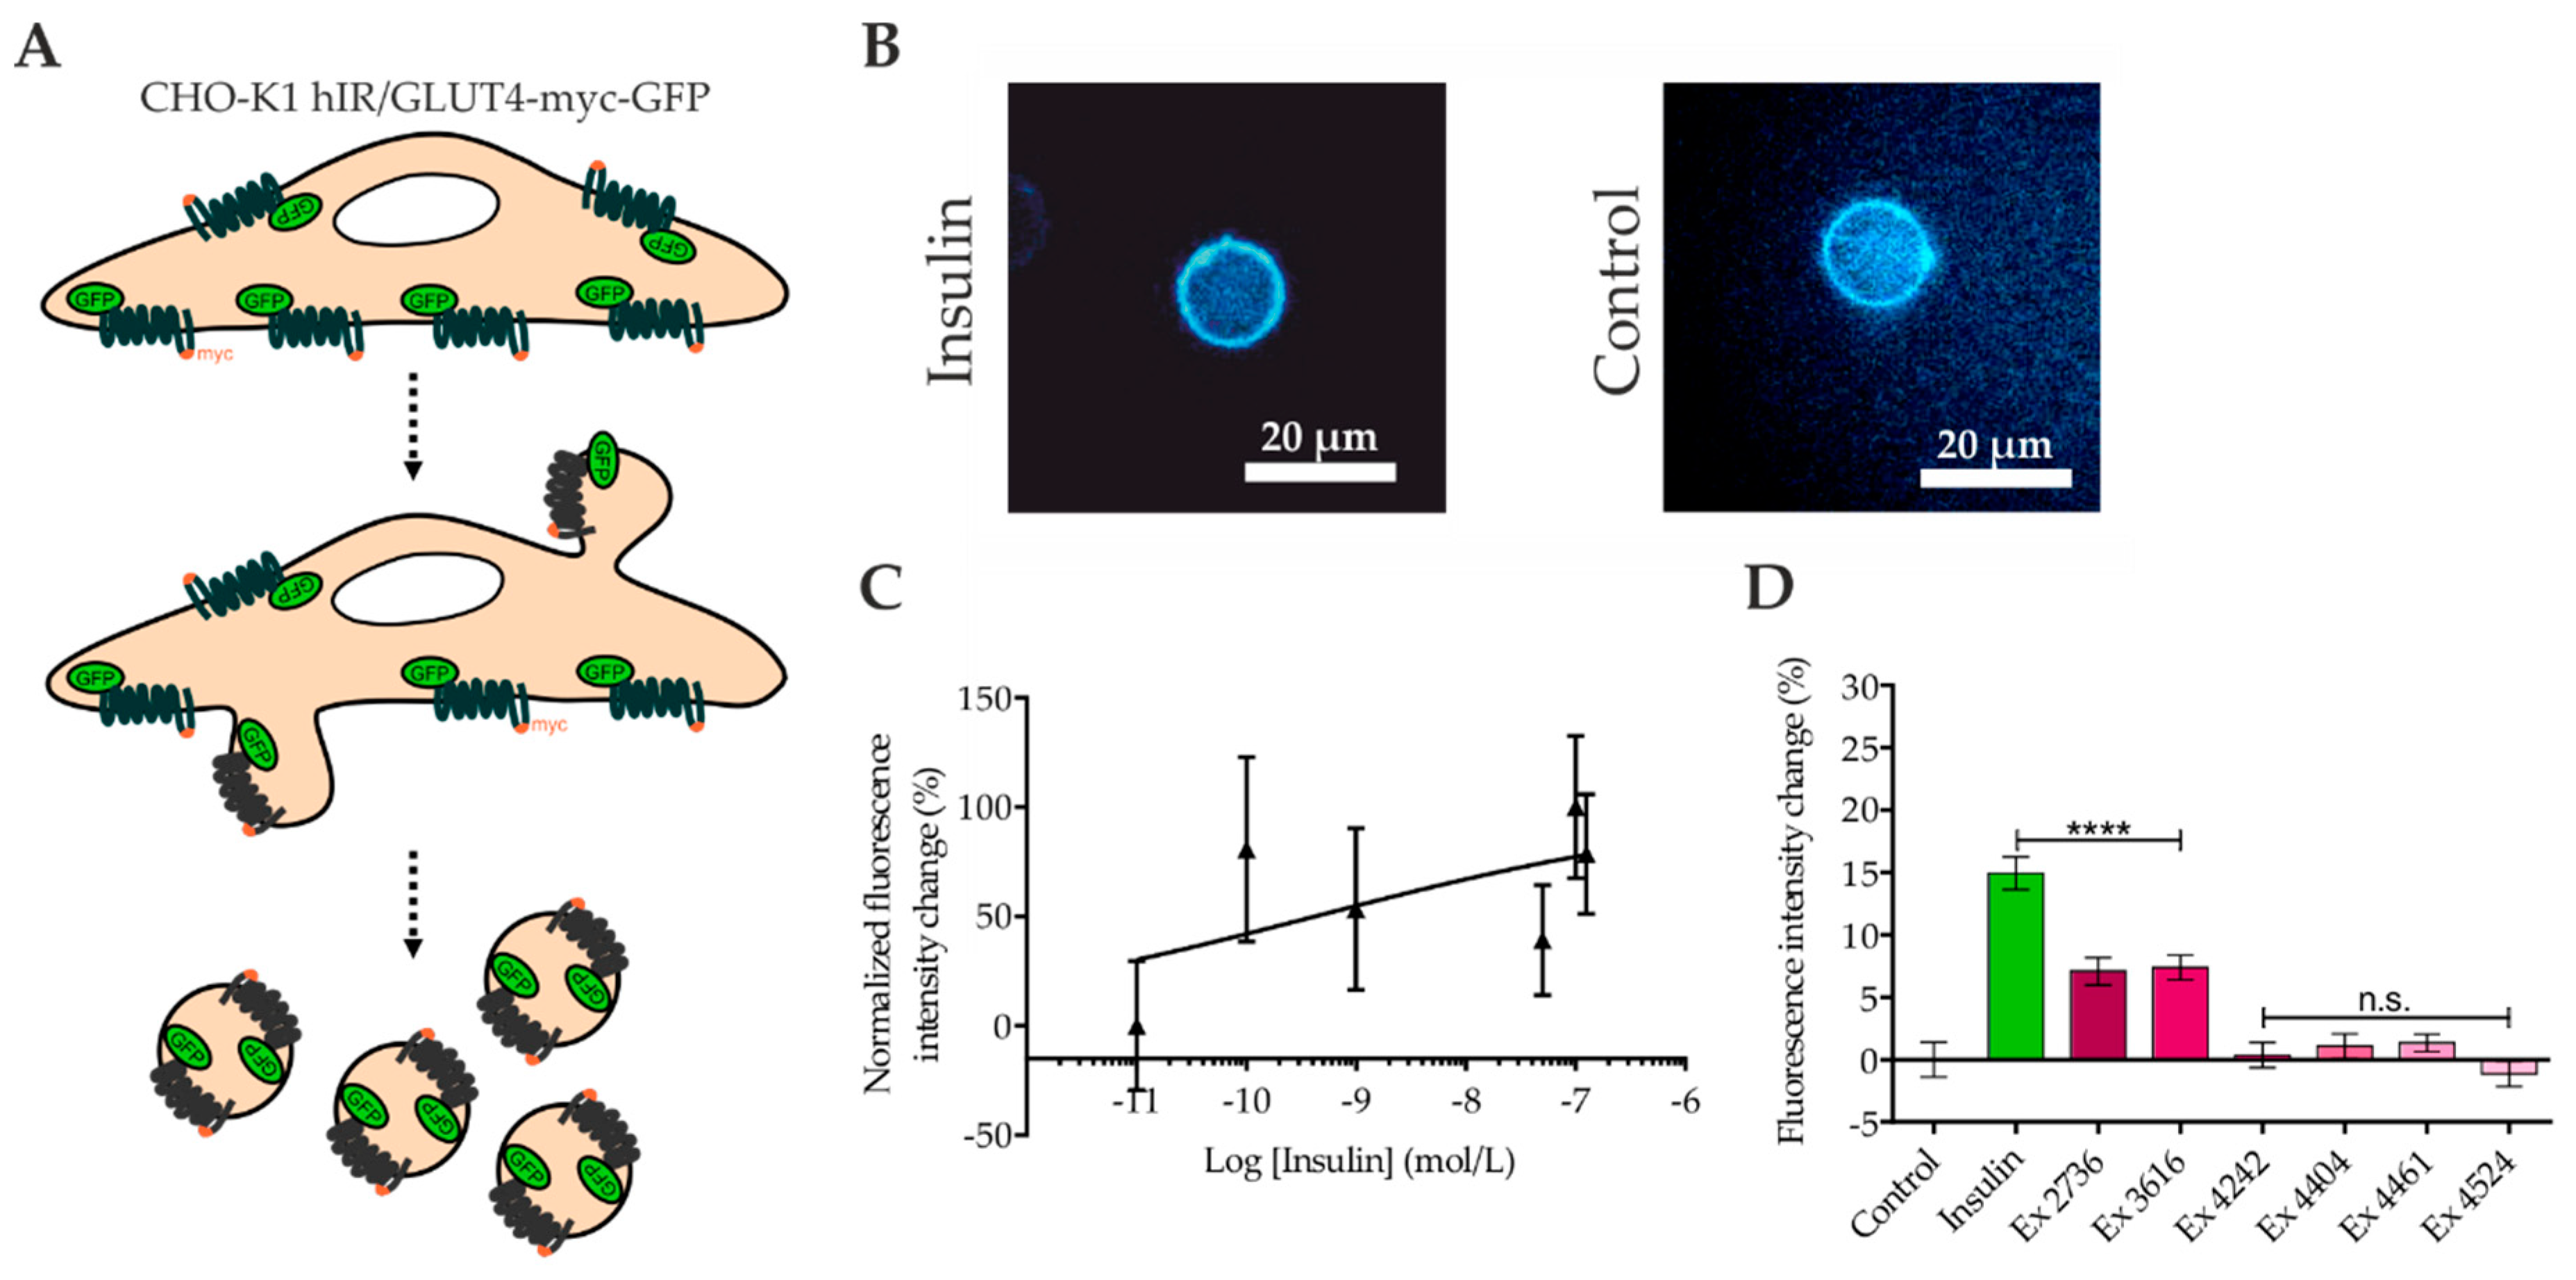
2.4. Quantitation of GLUT4 Translocation by Confocal Microscopy of Giant Plasma Membrane Vesicles (GPMVs)
3. Discussion
4. Materials and Methods
4.1. Reagents
4.2. Cell Culture and Transfection
4.3. Objective-Type TIRF Microscopy
4.4. Prism-Type TIR Multiwell Reader
4.5. Fluorescence Spectra for Autofluorescence and Quenching Properties of Plant Extracts
4.6. Giant Plasma Membrane Vesicle (GPMV) Formation and Confocal Imaging
4.7. Data Analysis
5. Conclusions
Supplementary Materials
Author Contributions
Funding
Conflicts of Interest
Abbreviations
| GLUT4 | Glucose transporter 4 |
| GPMV | Giant plasma membrane vesicle |
| T2DM | Type 2 diabetes mellitus |
| TIRF | Total internal reflection fluorescence |
References
- Petersen, M.C.; Shulman, G.I. Mechanisms of Insulin Action and Insulin Resistance. Physiol. Rev. 2018, 98, 2133–2223. [Google Scholar] [CrossRef]
- Defronzo, R.A. Banting Lecture. From the triumvirate to the ominous octet: A new paradigm for the treatment of type 2 diabetes mellitus. Diabetes 2009, 58, 773–795. [Google Scholar] [CrossRef]
- Lanzerstorfer, P.; Yoneyama, Y.; Hakuno, F.; Muller, U.; Hoglinger, O.; Takahashi, S.; Weghuber, J. Analysis of insulin receptor substrate signaling dynamics on microstructured surfaces. FEBS J. 2015, 282, 987–1005. [Google Scholar] [CrossRef]
- Manning, B.D.; Cantley, L.C. AKT/PKB signaling: Navigating downstream. Cell 2007, 129, 1261–1274. [Google Scholar] [CrossRef]
- Taniguchi, C.M.; Emanuelli, B.; Kahn, C.R. Critical nodes in signalling pathways: Insights into insulin action. Nat. Rev. Mol. Cell Biol. 2006, 7, 85–96. [Google Scholar] [CrossRef]
- Yoneyama, Y.; Lanzerstorfer, P.; Niwa, H.; Umehara, T.; Shibano, T.; Yokoyama, S.; Chida, K.; Weghuber, J.; Hakuno, F.; Takahashi, S.I. IRS-1 acts as an endocytic regulator of IGF-I receptor to facilitate sustained IGF signaling. Elife 2018, 7. [Google Scholar] [CrossRef]
- IDF Diabetes Atlas, 9th Edition. Available online: https://www.diabetesatlas.org/en/ (accessed on 12 August 2019).
- Eckel, R.H.; Alberti, K.G.; Grundy, S.M.; Zimmet, P.Z. The metabolic syndrome. Lancet 2010, 375, 181–183. [Google Scholar] [CrossRef]
- Katsiki, N.; Anagnostis, P.; Kotsa, K.; Goulis, D.G.; Mikhailidis, D.P. Obesity, Metabolic Syndrome and the Risk of Microvascular Complications in Patients with Diabetes mellitus. Curr. Pharm. Des. 2019, 25, 2051–2059. [Google Scholar] [CrossRef]
- Thomas, I.; Gregg, B. Metformin; a review of its history and future: From lilac to longevity. Pediatr. Diabetes 2017, 18, 10–16. [Google Scholar] [CrossRef]
- Vardeny, O. The Sweet Spot: Heart Failure Prevention with SGLT2 Inhibitors. Am. J. Med. 2020, 133, 182–185. [Google Scholar] [CrossRef]
- Wu, S.; Hopper, I.; Skiba, M.; Krum, H. Dipeptidyl peptidase-4 inhibitors and cardiovascular outcomes: Meta-analysis of randomized clinical trials with 55,141 participants. Cardiovasc. Ther. 2014, 32, 147–158. [Google Scholar] [CrossRef]
- Lampson, M.A.; Racz, A.; Cushman, S.W.; McGraw, T.E. Demonstration of insulin-responsive trafficking of GLUT4 and vpTR in fibroblasts. J. Cell Sci. 2000, 113 (Pt 22), 4065–4076. [Google Scholar]
- Bruzzone, S.; Ameri, P.; Briatore, L.; Mannino, E.; Basile, G.; Andraghetti, G.; Grozio, A.; Magnone, M.; Guida, L.; Scarfi, S.; et al. The plant hormone abscisic acid increases in human plasma after hyperglycemia and stimulates glucose consumption by adipocytes and myoblasts. FASEB J. 2012, 26, 1251–1260. [Google Scholar] [CrossRef]
- Kadan, S.; Saad, B.; Sasson, Y.; Zaid, H. In Vitro Evaluations of Cytotoxicity of Eight Antidiabetic Medicinal Plants and Their Effect on GLUT4 Translocation. Evid. Based Complement. Alternat. Med. 2013, 2013, 549345. [Google Scholar] [CrossRef]
- Kristiansen, S.; Richter, E.A. GLUT4-containing vesicles are released from membranes by phospholipase D cleavage of a GPI anchor. Am. J. Physiol. Endocrinol. Metab. 2002, 283, E374–E382. [Google Scholar] [CrossRef][Green Version]
- Endo, M.; Miyasaki, M.; Li, Q.; Kawamura, G.; Ozawa, T. A Detection Method for GLUT4 Exocytosis Based on Spontaneous Split Luciferase Complementation. Anal. Sci. 2019, 35, 835–838. [Google Scholar] [CrossRef]
- Liu, F.; Dallas-Yang, Q.; Castriota, G.; Fischer, P.; Santini, F.; Ferrer, M.; Li, J.; Akiyama, T.E.; Berger, J.P.; Zhang, B.B.; et al. Development of a novel GLUT4 translocation assay for identifying potential novel therapeutic targets for insulin sensitization. Biochem. J. 2009, 418, 413–420. [Google Scholar] [CrossRef]
- Lanzerstorfer, P.; Stadlbauer, V.; Chtcheglova, L.A.; Haselgrubler, R.; Borgmann, D.; Wruss, J.; Hinterdorfer, P.; Schroder, K.; Winkler, S.M.; Hoglinger, O.; et al. Identification of novel insulin mimetic drugs by quantitative total internal reflection fluorescence (TIRF) microscopy. Br. J. Pharmacol. 2014, 171, 5237–5251. [Google Scholar] [CrossRef]
- Gao, L.; Chen, J.; Gao, J.; Wang, H.; Xiong, W. Super-resolution microscopy reveals the insulin-resistance-regulated reorganization of GLUT4 on plasma membranes. J. Cell Sci. 2017, 130, 396–405. [Google Scholar] [CrossRef]
- Hatakeyama, H.; Kanzaki, M. Heterotypic endosomal fusion as an initial trigger for insulin-induced glucose transporter 4 (GLUT4) translocation in skeletal muscle. J. Physiol. 2017, 595, 5603–5621. [Google Scholar] [CrossRef]
- Richter, V.; Lanzerstorfer, P.; Weghuber, J.; Schneckenburger, H. Super-Resolution Live Cell Microscopy of Membrane-Proximal Fluorophores. Int. J. Mol. Sci. 2020, 21, 7099. [Google Scholar] [CrossRef]
- Axelrod, D. Selective imaging of surface fluorescence with very high aperture microscope objectives. J. Biomed. Opt. 2001, 6, 6–13. [Google Scholar] [CrossRef] [PubMed]
- Axelrod, D. Cell-substrate contacts illuminated by total internal reflection fluorescence. J. Cell Biol. 1981, 89, 141–145. [Google Scholar] [CrossRef] [PubMed]
- Bruns, T.; Strauss, W.S.; Sailer, R.; Wagner, M.; Schneckenburger, H. Total internal reflectance fluorescence reader for selective investigations of cell membranes. J. Biomed. Opt. 2006, 11, 34011. [Google Scholar] [CrossRef]
- Schneckenburger, H.; Weber, P.; Wagner, M.; Enderle, S.; Kalthof, B.; Schneider, L.; Herzog, C.; Weghuber, J.; Lanzerstorfer, P. Combining TIR and FRET in Molecular Test Systems. Int. J. Mol. Sci. 2019, 20, 648. [Google Scholar] [CrossRef]
- Gerstle, Z.; Desai, R.; Veatch, S.L. Giant Plasma Membrane Vesicles: An Experimental Tool for Probing the Effects of Drugs and Other Conditions on Membrane Domain Stability. Methods Enzymol. 2018, 603, 129–150. [Google Scholar] [CrossRef] [PubMed]
- Borgmann, D.M.; Weghuber, J.; Schaller, S.; Jacak, J.; Winkler, S.M. Identification of Patterns in Microscopy Images of Biological Samples Using Evolution Strategies. In Proceedings of the 24th European Modeling and Simulation Symposium, 19–21 September 2012; Bruzzone, A.G., Ed.; CAL-TEK SRL: Rende, Italy, 2012. [Google Scholar]
- Stadlbauer, V.; Haselgrubler, R.; Lanzerstorfer, P.; Plochberger, B.; Borgmann, D.; Jacak, J.; Winkler, S.M.; Schroder, K.; Hoglinger, O.; Weghuber, J. Biomolecular Characterization of Putative Antidiabetic Herbal Extracts. PLoS ONE 2016, 11, e0148109. [Google Scholar] [CrossRef] [PubMed]
- Onur, S.; Stöckmann, H.; Zenthoefer, M.; Piker, L.; Döring, F. The Plant Extract Collection Kiel in Schleswig-Holstein (PECKISH) Is an Open Access Screening Library. J. Food Res. 2013, 2. [Google Scholar] [CrossRef]
- Haselgrubler, R.; Stadlbauer, V.; Stubl, F.; Schwarzinger, B.; Rudzionyte, I.; Himmelsbach, M.; Iken, M.; Weghuber, J. Insulin Mimetic Properties of Extracts Prepared from Bellis perennis. Molecules 2018, 23, 2605. [Google Scholar] [CrossRef]
- Sezgin, E.; Kaiser, H.J.; Baumgart, T.; Schwille, P.; Simons, K.; Levental, I. Elucidating membrane structure and protein behavior using giant plasma membrane vesicles. Nat. Protoc. 2012, 7, 1042–1051. [Google Scholar] [CrossRef]
- Rao Kondapally Seshasai, S.; Kaptoge, S.; Thompson, A.; Di Angelantonio, E.; Gao, P.; Sarwar, N.; Whincup, P.H.; Mukamal, K.J.; Gillum, R.F.; Holme, I.; et al. Diabetes mellitus, fasting glucose, and risk of cause-specific death. N. Engl. J. Med. 2011, 364, 829–841. [Google Scholar] [CrossRef]
- Belete, T.M. A Recent Achievement In the Discovery and Development of Novel Targets for the Treatment of Type-2 Diabetes Mellitus. J. Exp. Pharmacol. 2020, 12, 1–15. [Google Scholar] [CrossRef] [PubMed][Green Version]
- Heng, X.P.; Li, X.J.; Li, L.; Yang, L.Q.; Wang, Z.T.; Huang, S.P. Therapy to Obese Type 2 Diabetes Mellitus: How Far Will We Go Down the Wrong Road? Chin. J. Integr. Med. 2020, 26, 62–71. [Google Scholar] [CrossRef] [PubMed]
- Jung, D.W.; Ha, H.H.; Zheng, X.; Chang, Y.T.; Williams, D.R. Novel use of fluorescent glucose analogues to identify a new class of triazine-based insulin mimetics possessing useful secondary effects. Mol. Biosyst. 2011, 7, 346–358. [Google Scholar] [CrossRef] [PubMed]
- Barros, L.F.; Bittner, C.X.; Loaiza, A.; Porras, O.H. A quantitative overview of glucose dynamics in the gliovascular unit. Glia 2007, 55, 1222–1237. [Google Scholar] [CrossRef]
- Fang, Y.; Zhang, W.; Zhu, M.; Chen, S.; Liu, X.; Lu, W.; Zhang, X. Characterization of a near-infrared fluorescent DCPO-tagged glucose analogue for cancer cell imaging. J. Photochem. Photobiol. B 2017, 166, 264–271. [Google Scholar] [CrossRef]
- Morris, S.; Geoghegan, N.D.; Sadler, J.B.A.; Koester, A.M.; Black, H.L.; Laub, M.; Miller, L.; Heffernan, L.; Simpson, J.C.; Mastick, C.C.; et al. Characterisation of GLUT4 trafficking in HeLa cells: Comparable kinetics and orthologous trafficking mechanisms to 3T3-L1 adipocytes. PeerJ 2020, 8, e8751. [Google Scholar] [CrossRef] [PubMed]
- Ki, J.; Mukherjee, A.; Rangasamy, S.; Purushothaman, B.; Song, J.M. Insulin-mimetic and anti-inflammatory potential of a vanadyl-Schiff base complex for its application against diabetes. RSC Adv. 2016, 6, 57530–57539. [Google Scholar] [CrossRef]
- DeBernardi, M.A.; Hewitt, S.M.; Kriete, A. Automated Confocal Imaging and High-Content Screening for Cytomics; Springer: Boston, MA, USA, 2006. [Google Scholar] [CrossRef]
- Fazakerley, D.J.; Naghiloo, S.; Chaudhuri, R.; Koumanov, F.; Burchfield, J.G.; Thomas, K.C.; Krycer, J.R.; Prior, M.J.; Parker, B.L.; Murrow, B.A.; et al. Proteomic Analysis of GLUT4 Storage Vesicles Reveals Tumor Suppressor Candidate 5 (TUSC5) as a Novel Regulator of Insulin Action in Adipocytes. J. Biol. Chem. 2015, 290, 23528–23542. [Google Scholar] [CrossRef]
- Lanzerstorfer, P.; Borgmann, D.; Schutz, G.; Winkler, S.M.; Hoglinger, O.; Weghuber, J. Quantification and kinetic analysis of Grb2-EGFR interaction on micro-patterned surfaces for the characterization of EGFR-modulating substances. PLoS ONE 2014, 9, e92151. [Google Scholar] [CrossRef]
- Petschnigg, J.; Ketteler, R. GFP-Grb2 Translocation Assay Using High-content Imaging to Screen for Modulators of EGFR-signaling. Bio. Protoc. 2017, 7. [Google Scholar] [CrossRef][Green Version]
- van Oort, M.M.; van Doorn, J.M.; Bonen, A.; Glatz, J.F.; van der Horst, D.J.; Rodenburg, K.W.; Luiken, J.J. Insulin-induced translocation of CD36 to the plasma membrane is reversible and shows similarity to that of GLUT4. Biochim. Biophys. Acta 2008, 1781, 61–71. [Google Scholar] [CrossRef] [PubMed]
- Vijayakumar, M.V.; Ajay, A.K.; Bhat, M.K. Demonstration of a visual cell-based assay for screening glucose transporter 4 translocation modulators in real time. J. Biosci. 2010, 35, 525–531. [Google Scholar] [CrossRef]
- Pearson, R.K.; Neuvo, Y.; Astola, J.; Gabbouj, M. Generalized Hampel Filters. EURASIP J. Adv. Signal. Process. 2016, 87. [Google Scholar] [CrossRef]


Publisher’s Note: MDPI stays neutral with regard to jurisdictional claims in published maps and institutional affiliations. |
© 2020 by the authors. Licensee MDPI, Basel, Switzerland. This article is an open access article distributed under the terms and conditions of the Creative Commons Attribution (CC BY) license (http://creativecommons.org/licenses/by/4.0/).
Share and Cite
Stadlbauer, V.; Lanzerstorfer, P.; Neuhauser, C.; Weber, F.; Stübl, F.; Weber, P.; Wagner, M.; Plochberger, B.; Wieser, S.; Schneckenburger, H.; et al. Fluorescence Microscopy-Based Quantitation of GLUT4 Translocation: High Throughput or High Content? Int. J. Mol. Sci. 2020, 21, 7964. https://doi.org/10.3390/ijms21217964
Stadlbauer V, Lanzerstorfer P, Neuhauser C, Weber F, Stübl F, Weber P, Wagner M, Plochberger B, Wieser S, Schneckenburger H, et al. Fluorescence Microscopy-Based Quantitation of GLUT4 Translocation: High Throughput or High Content? International Journal of Molecular Sciences. 2020; 21(21):7964. https://doi.org/10.3390/ijms21217964
Chicago/Turabian StyleStadlbauer, Verena, Peter Lanzerstorfer, Cathrina Neuhauser, Florian Weber, Flora Stübl, Petra Weber, Michael Wagner, Birgit Plochberger, Stefan Wieser, Herbert Schneckenburger, and et al. 2020. "Fluorescence Microscopy-Based Quantitation of GLUT4 Translocation: High Throughput or High Content?" International Journal of Molecular Sciences 21, no. 21: 7964. https://doi.org/10.3390/ijms21217964
APA StyleStadlbauer, V., Lanzerstorfer, P., Neuhauser, C., Weber, F., Stübl, F., Weber, P., Wagner, M., Plochberger, B., Wieser, S., Schneckenburger, H., & Weghuber, J. (2020). Fluorescence Microscopy-Based Quantitation of GLUT4 Translocation: High Throughput or High Content? International Journal of Molecular Sciences, 21(21), 7964. https://doi.org/10.3390/ijms21217964