1. Introduction
The neuroscience field is continuously implementing novel techniques for gene sequencing, epigenetic analyses, and proteotype profiling at a rapidly increasing rate. Obtaining single-cell suspensions from intact brain tissue is essential for downstream cell-specific transcriptomic and proteotype analyses. The main techniques available to obtain single-cell suspensions from brain tissue are enzymatic digestion (ED) and mechanical dissociation (MD). The latter is typically carried out at 4 °C [
1], whereas ED requires incubation at temperatures between 30–37 °C [
2,
3,
4]. During the dissociation process, the cells are exposed to and confronted with non-physiological conditions, which in turn can lead to cell death and/or changes in cell morphology. Although the loss of cells and changes in cell morphology are likely to occur in both ED and MD, we hypothesize that at warm temperatures, as opposed to 4 °C, surviving cells may overreact to the non-physiological milieu containing shredded extracellular matrix, cell debris, and cytoplasmic leakage [
5]. Furthermore, the ED technique is associated with marked temperature shifts occurring between the eventual cell isolation step and the preceding perfusion, the latter of which is typically carried out at cold temperatures to remove blood contamination from the brain. Thermal shocks resulting from temperature shifts have been shown to elicit widespread transcriptional changes, even within short time windows [
6]. Hence, unlike MD at cold temperatures, which largely spares the cellular transcriptome and proteome [
7], the ED technique may introduce additional biological biases to the transcriptional and proteotype profiles of cells. Furthermore, the latter technique might also influence the relative amount of cell surface markers, as changes in surface receptor trafficking might occur during enzymatic digestions at a temperature where cells are metabolically active. This, in turn, may introduce additional bias in cell sorting analyses such as fluorescence-activated cell sorting (FACS) and cytometry by time of flight (CyTOF).
A few studies have already pointed to the possibility that ED can lead to substantial artifacts in transcriptomic analyses [
8,
9,
10], while it remains largely unknown whether ED introduces a similar bias in proteotype profiling (e.g., in flow cytometry and mass-spectrometry analyses). Nevertheless, this issue has only been considered for transcriptional analyses, whereby possible biological consequences of ED on the proteotype profiling (e.g., flow cytometry and mass-spectrometry analyses) have up to today not been taken into consideration. Importantly, the use of transcription/translation inhibitors does not prevent the biological downregulation of RNAs and proteins that might occur during ED, nor can they prevent unwanted alterations in epigenetic marks or internalization/externalization of receptors which might be crucial readouts for certain cell-specific analyses. Given that at present, ED is the most widely used method to obtain single-cell suspensions from brain tissue (
Supplementary Figure S1), it is pivotal to understand the extent of cell responses when exposed to ED as compared to a method that holds cells in a quiescent state.
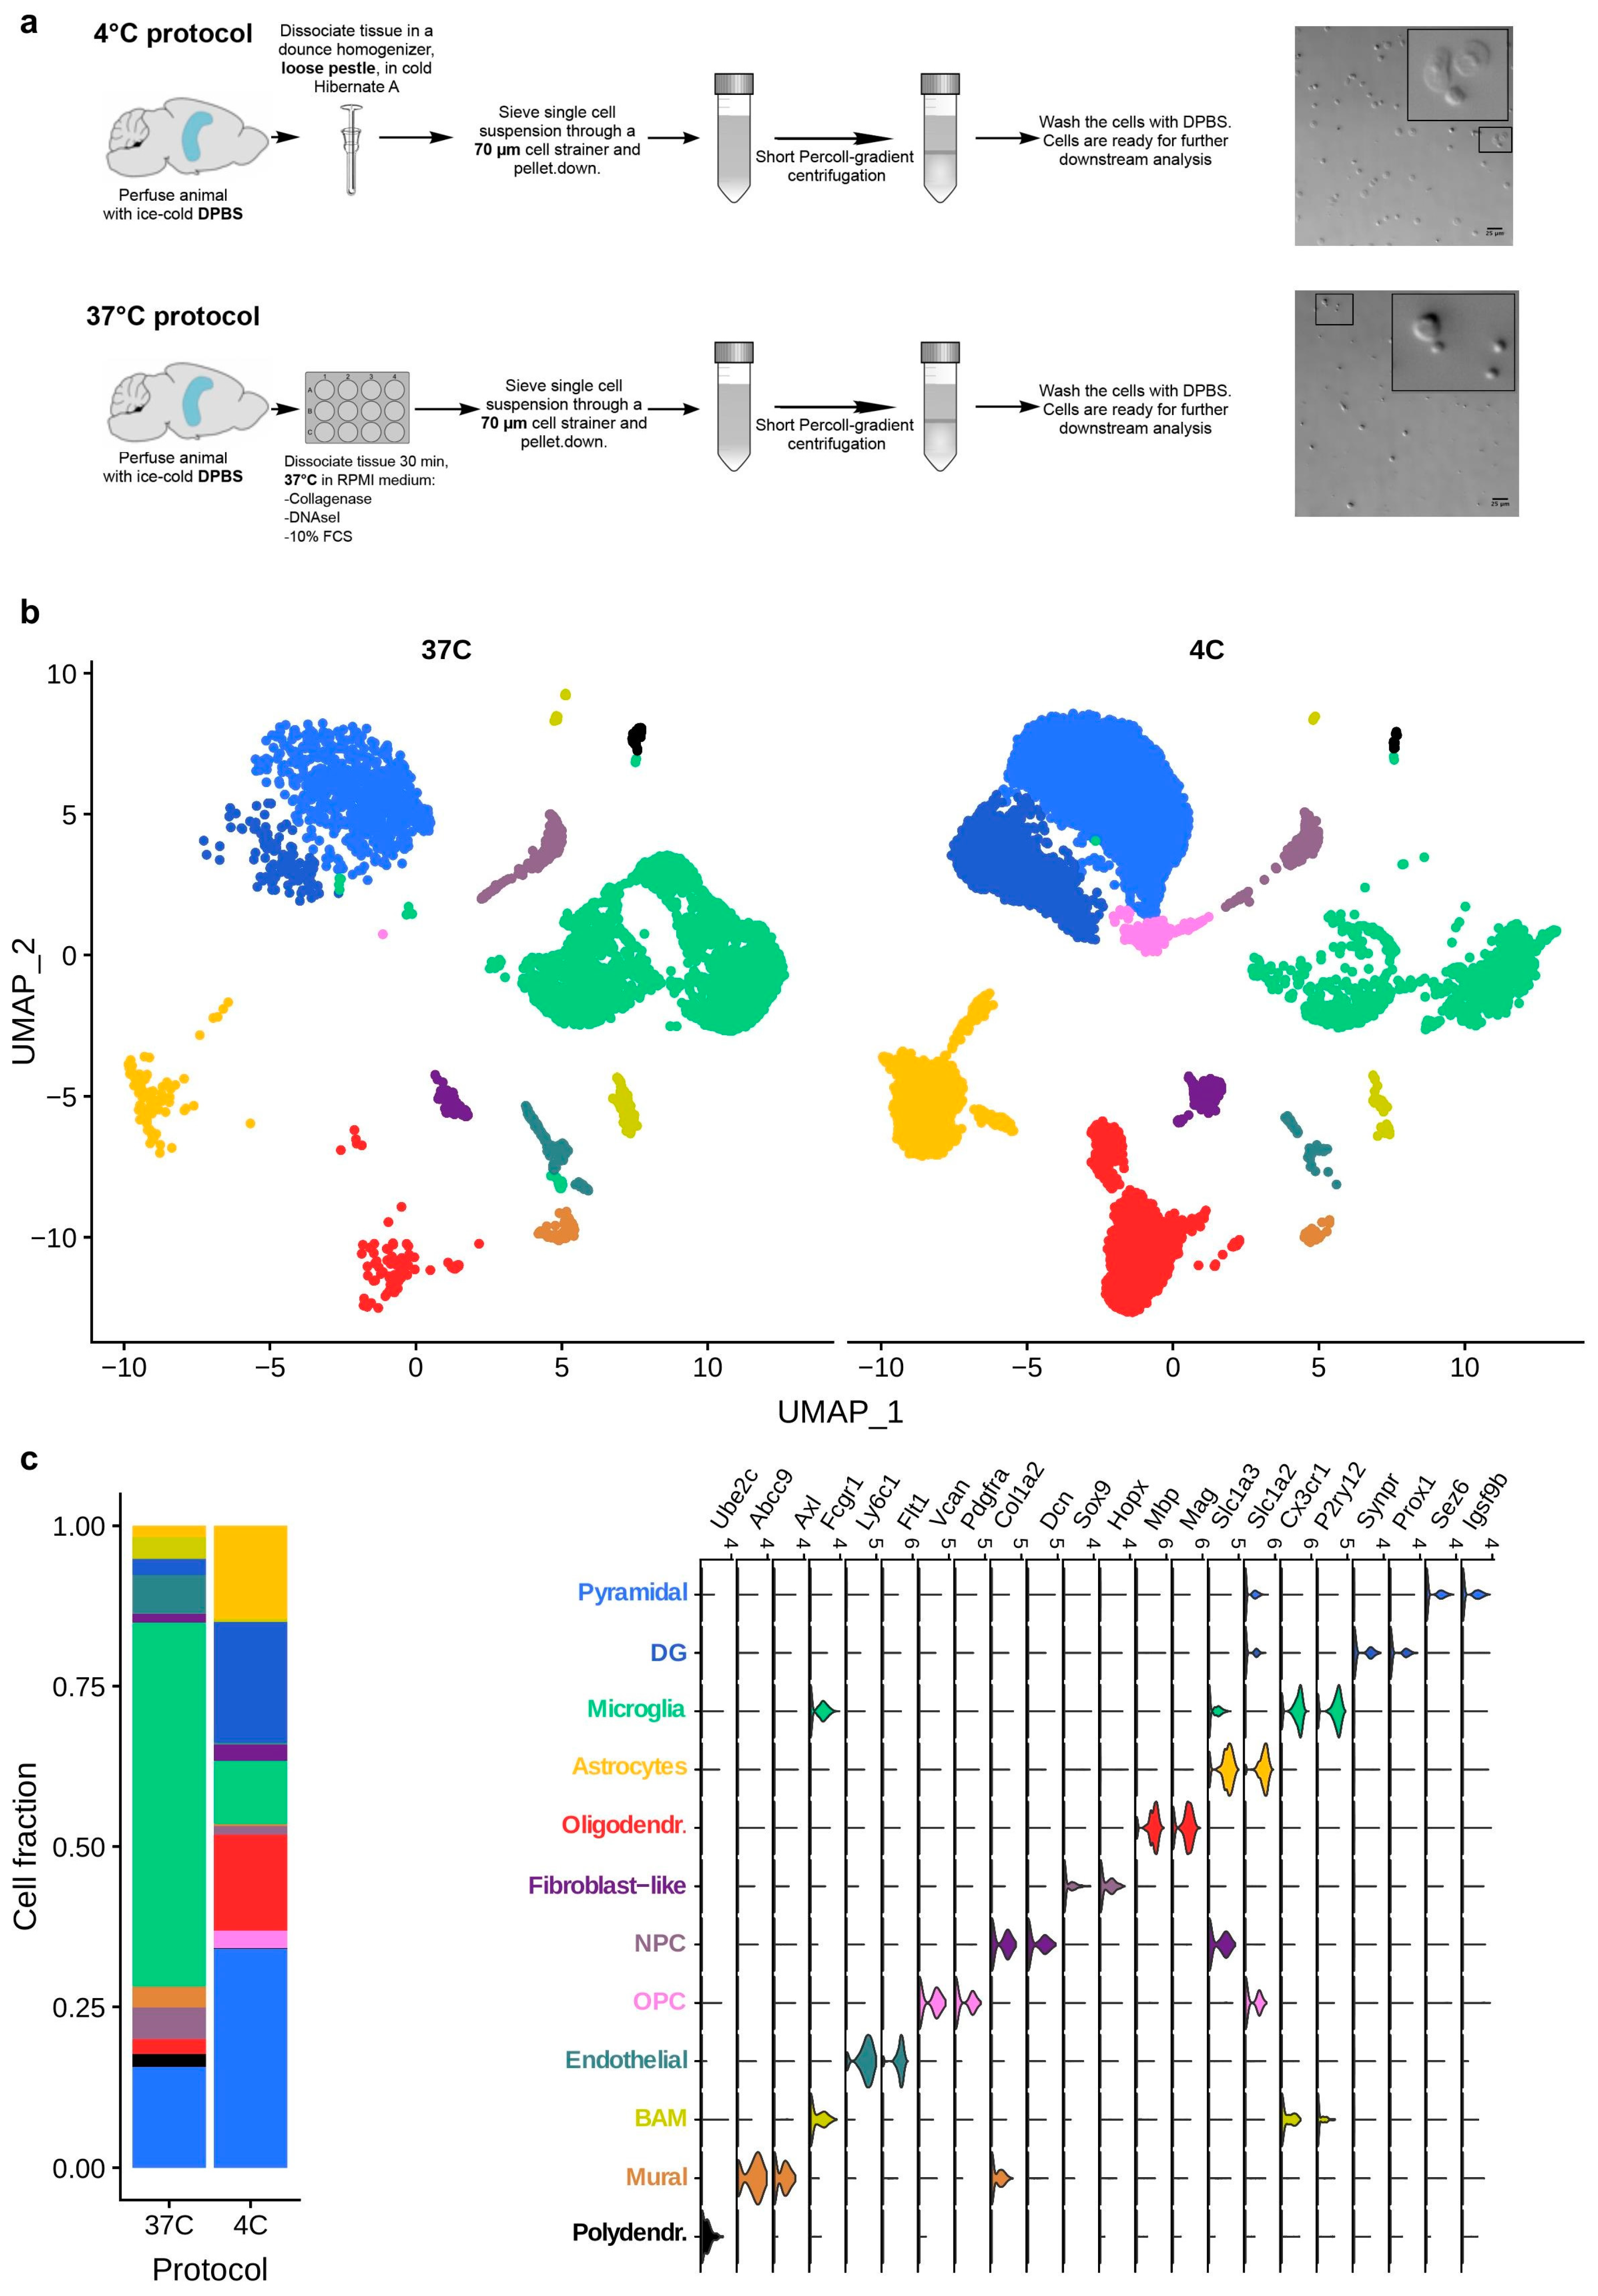
In the present study, we systematically investigated the influence of different cell isolation protocols on transcriptional and proteotype profiles in mouse brain tissue, thereby taking into account single-cell transcriptomics, proteotypes of microglia and astrocytes, and flow cytometric analysis of microglia. By comparing the transcriptional and proteotype profiles of brain cells isolated via ED at 37 °C and via MD at 4 °C, our study provides a comprehensive transcriptomic and proteotype resource that can be used to identify and correct for artifacts in previously published data sets generated via ED. In the present work, we also compared the two protocols in terms of their efficiency in producing single-cell suspension of healthy mouse brain tissue and mouse glioblastoma tissue. The latter was included to extend our analyses to neuropathological brain specimens containing necrotizing tissue that is surrounded by anaplastic cells. Taken together, we hereby offer an optimized and easy-to-establish MD protocol at 4 °C, which is cost-effective and technically easier to implement than conventional ED-based protocols.
3. Discussion
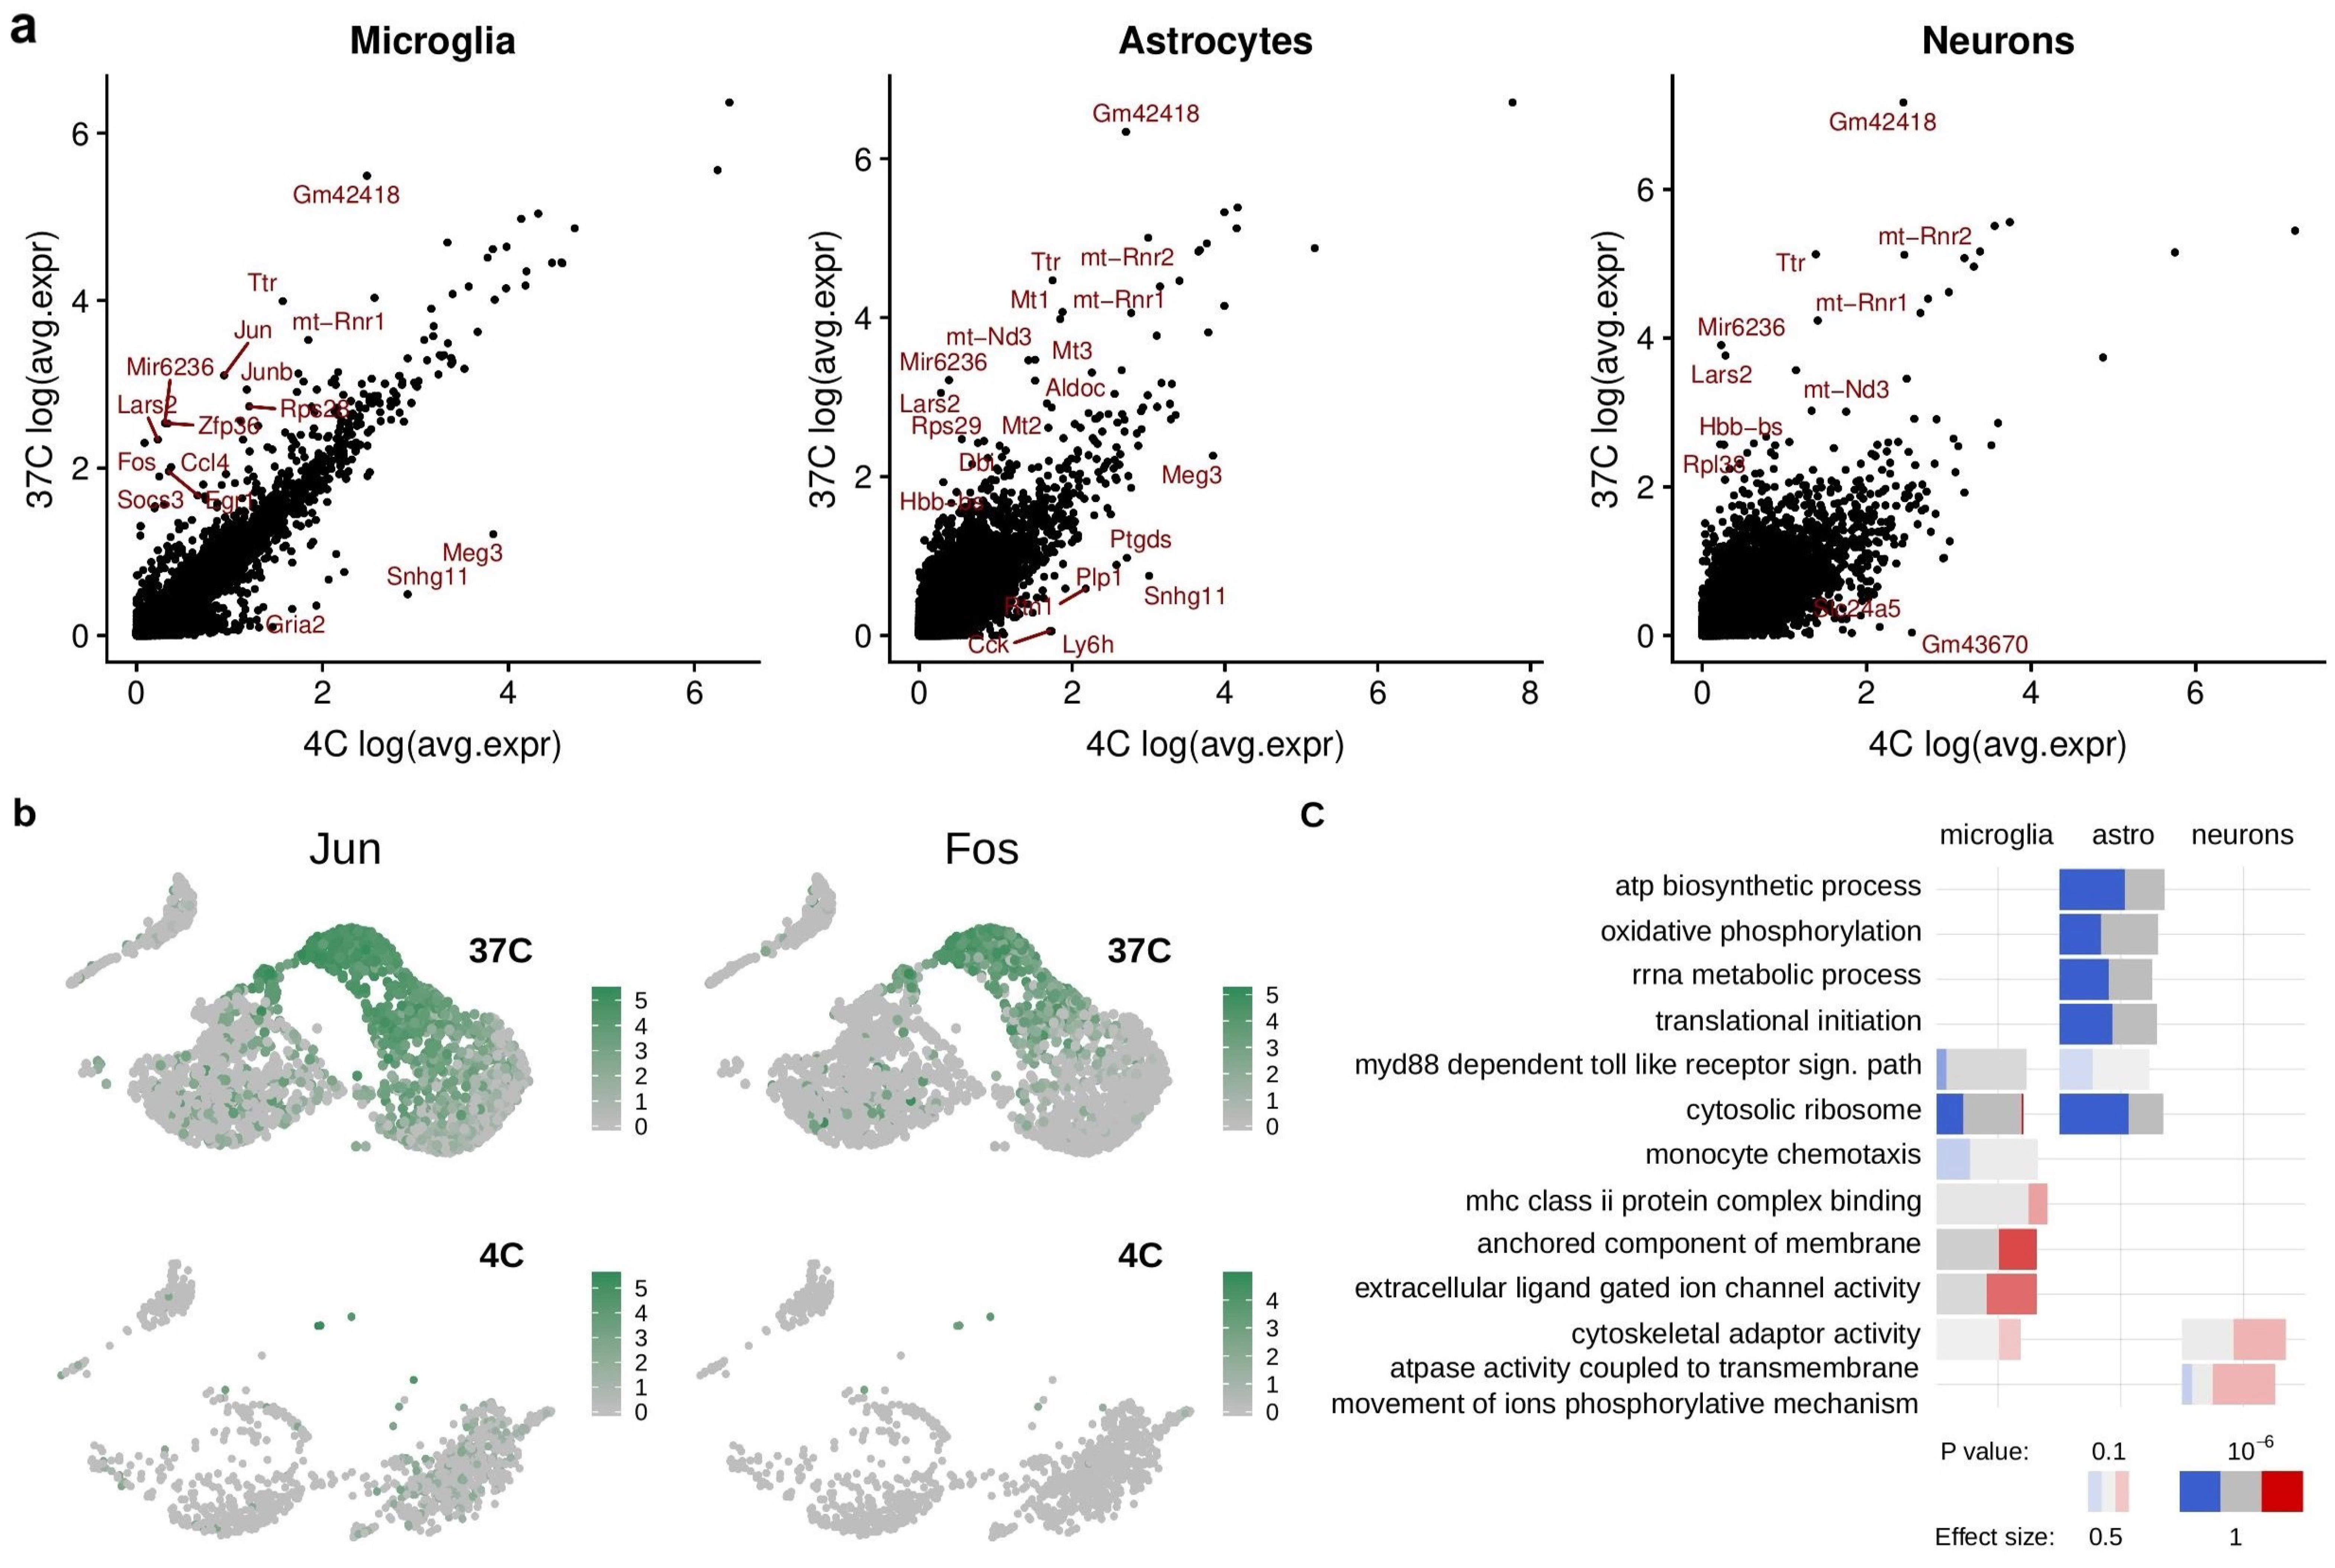
Our study aimed at systematically investigating the possible influence of different cell isolation protocols on transcriptional and proteotype profiles in mouse brain tissue, thereby taking into account single-cell transcriptomics of brain cells, proteotypes of microglia and astrocytes, and flow cytometric analysis of microglia. Our findings indicate that ED37°-based cell isolation induces alterations in gene and protein expression involving both up- and downregulations. We found that 30 min ED37° was associated with altered expression of genes related to cellular metabolic processes and energy expenditure pathways in both microglia and astrocytes. Moreover, pathways associated with the immune system were also altered following ED37°. In particular, in microglia cells, transcripts associated with innate immune response, major histocompatibility complex II (MHCII) protein complex binding, monocyte chemotaxis, and chemokine binding were deregulated (
Supplementary Table S2). This is indicative of microglial immune activation upon ED37 °C, possibly arising in response to exposure to the non-physiological microenvironment caused by the ED-based protocol. Astrocytes isolated via ED37° were characterized by transcriptional deregulations associated with metabolic pathways, especially lipid metabolism, glutathione metabolism, and mitochondrial respiration (
Supplementary Table S2). Alterations in immune-related pathways were also found in astrocytes following ED37°, which included altered cytokine receptor activity, MyD88-dependent toll-like receptor signaling pathway, and MHC protein binding (
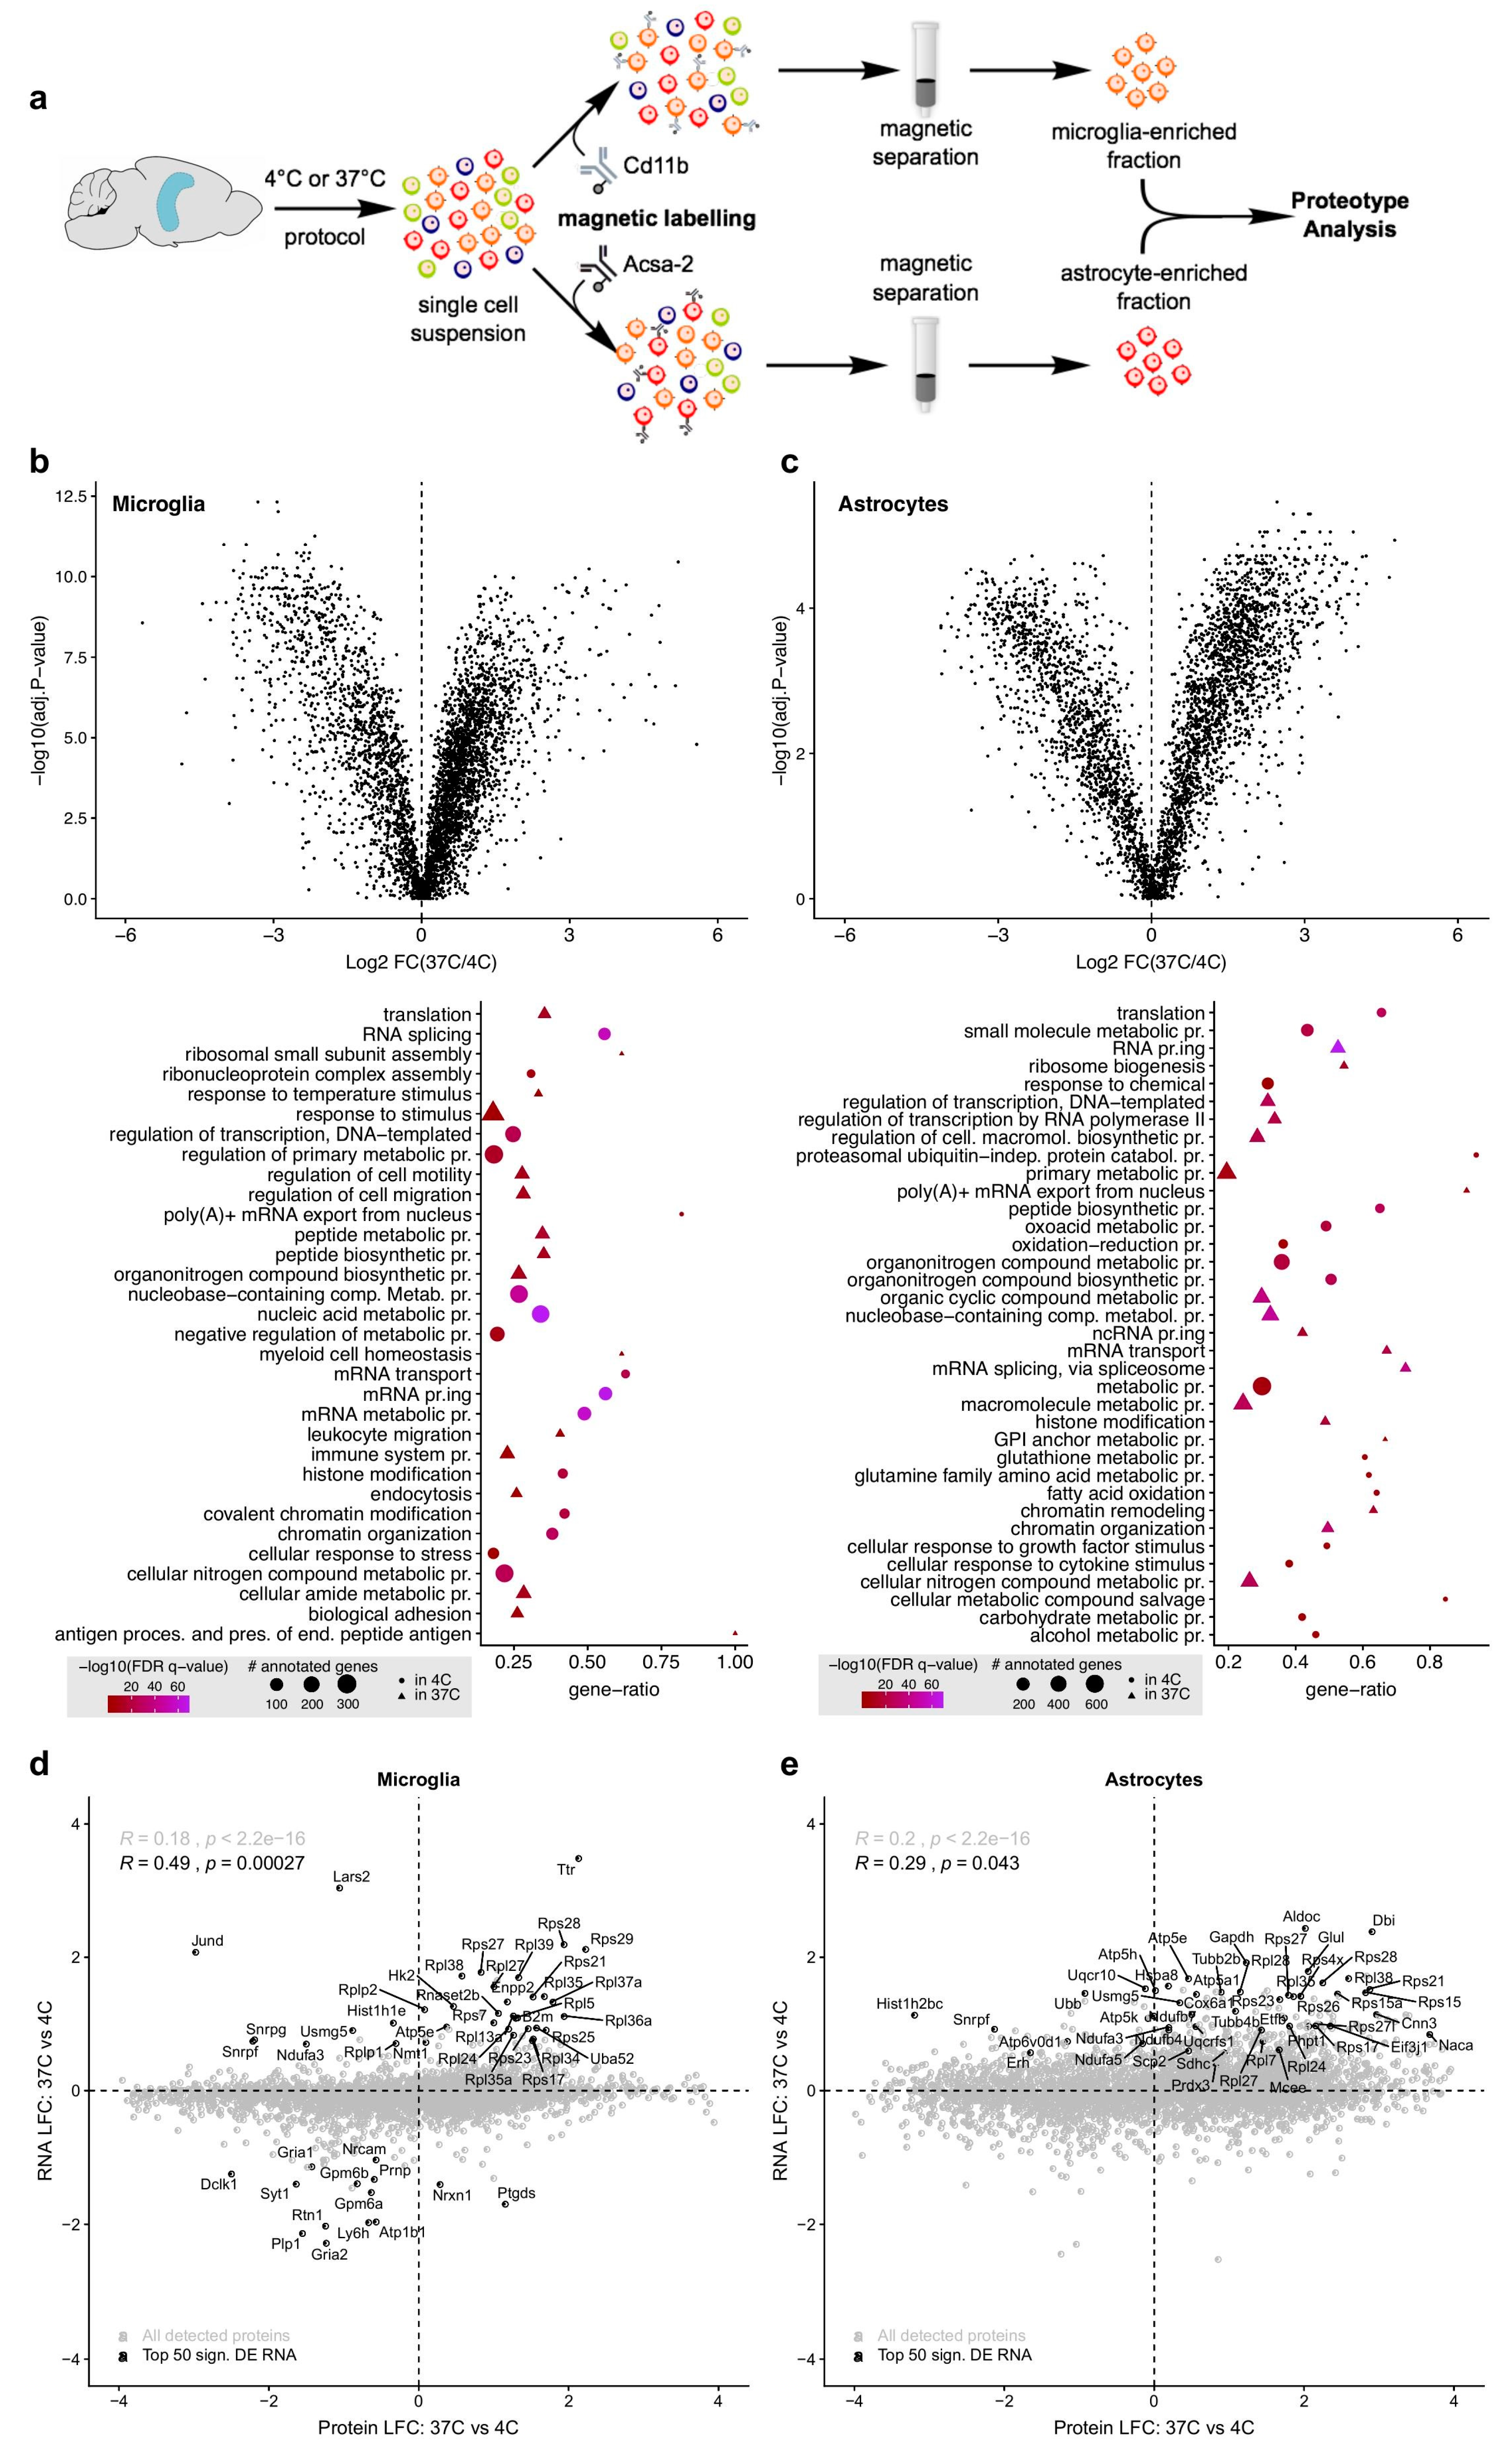
Supplementary Table S2). The proteotype analysis of microglia and astrocytes showed that many of these transcriptional changes are mirrored at the translational level (
Figure 3d,e). In both microglia and astrocytes, ED37° induced marked deregulation in proteins associated with transcription and translation (
Supplementary Table S4). Moreover, microglia isolated via ED37° responded with changes in proteins associated with cell migration and motility, immune system process, leukocyte cell-cell adhesion, and response to chemical stimulus (
Supplementary Table S4). This points towards ED37°-induced microglial activation at the translational level, akin to what we observed at the transcriptomic level. Finally, the proteotype analysis revealed deregulations in proteins associated with epigenetic modification such as chromatin organization and histone modifications (e.g., histone acetylation and methylation,
Supplementary Table S4).
We hypothesize that the ED37°-induced changes may be caused by the thermal shock suffered by the cells and may mirror their response to the non-physiological microenvironment present during ED. It is important to point out that with the present dataset, it is not possible to dissect which of the cellular responses are due to the thermal shock and which are caused by the enzymatic digestion and its microenvironment per se. However, these alterations are likely to introduce undesirable biological biases in cell-specific transcriptomic and proteotype profiling of brain specimens. While the potential risk of introducing biological artifacts through the use of ED37°-based cell isolation techniques has received recent attention in the context of transcriptomic studies [
8,
9,
10], our work is the first to systematically and specifically address this issue and to extend this concern to flow cytometry and proteotype analyses. The latter is of particular importance given the increasing use of ED37° in mass-cytometry to study and characterize brain immune cells [
20,
21,
22].
Efforts towards minimizing bias in transcriptomic datasets are indispensable not only for enhancing the reproducibility of findings, but also to avoid biological misinterpretation of datasets within studies. One possible way to prevent such biases is the use of single nucleus sequencing (snSeq), where whole tissue is homogenized and cells are lysed to release single nuclei that can be processed for sequencing [
23,
24]. This method is increasingly used for frozen human brain tissue samples [
25] and represents a valuable alternative for single-cell characterization of brain cells, albeit to a lower sequencing depth as compared to ordinary scSeq [
23]. The use of transcription and translation blockers is another possible way to reduce transcriptomic and prototype bias in ED-based protocols [
9,
10]. However, while this strategy might be efficient in preventing de novo gene and protein expression, it does not prevent degradation/downregulation of pre-existing RNAs and proteins, which according to the present data, readily occurs during ED37°-based isolation. Moreover, our proteotype analysis of microglia and astrocytes revealed that ED37° induced the deregulation of proteins associated with various epigenetic processes, including chromatin remodeling, histone modifications, and DNA methylation (
Figure 3,
Supplementary Tables S3 and S4). ED37° thus likely modifies the epigenetic machinery, which cannot be prevented via transcription and/or translation blockers. The latter also falls short in not preventing changes in flow cytometric analyses of brain cells such as microglia. Indeed, here we show that ED37° leads to an increase in proteins associated with endocytosis (see GO table in
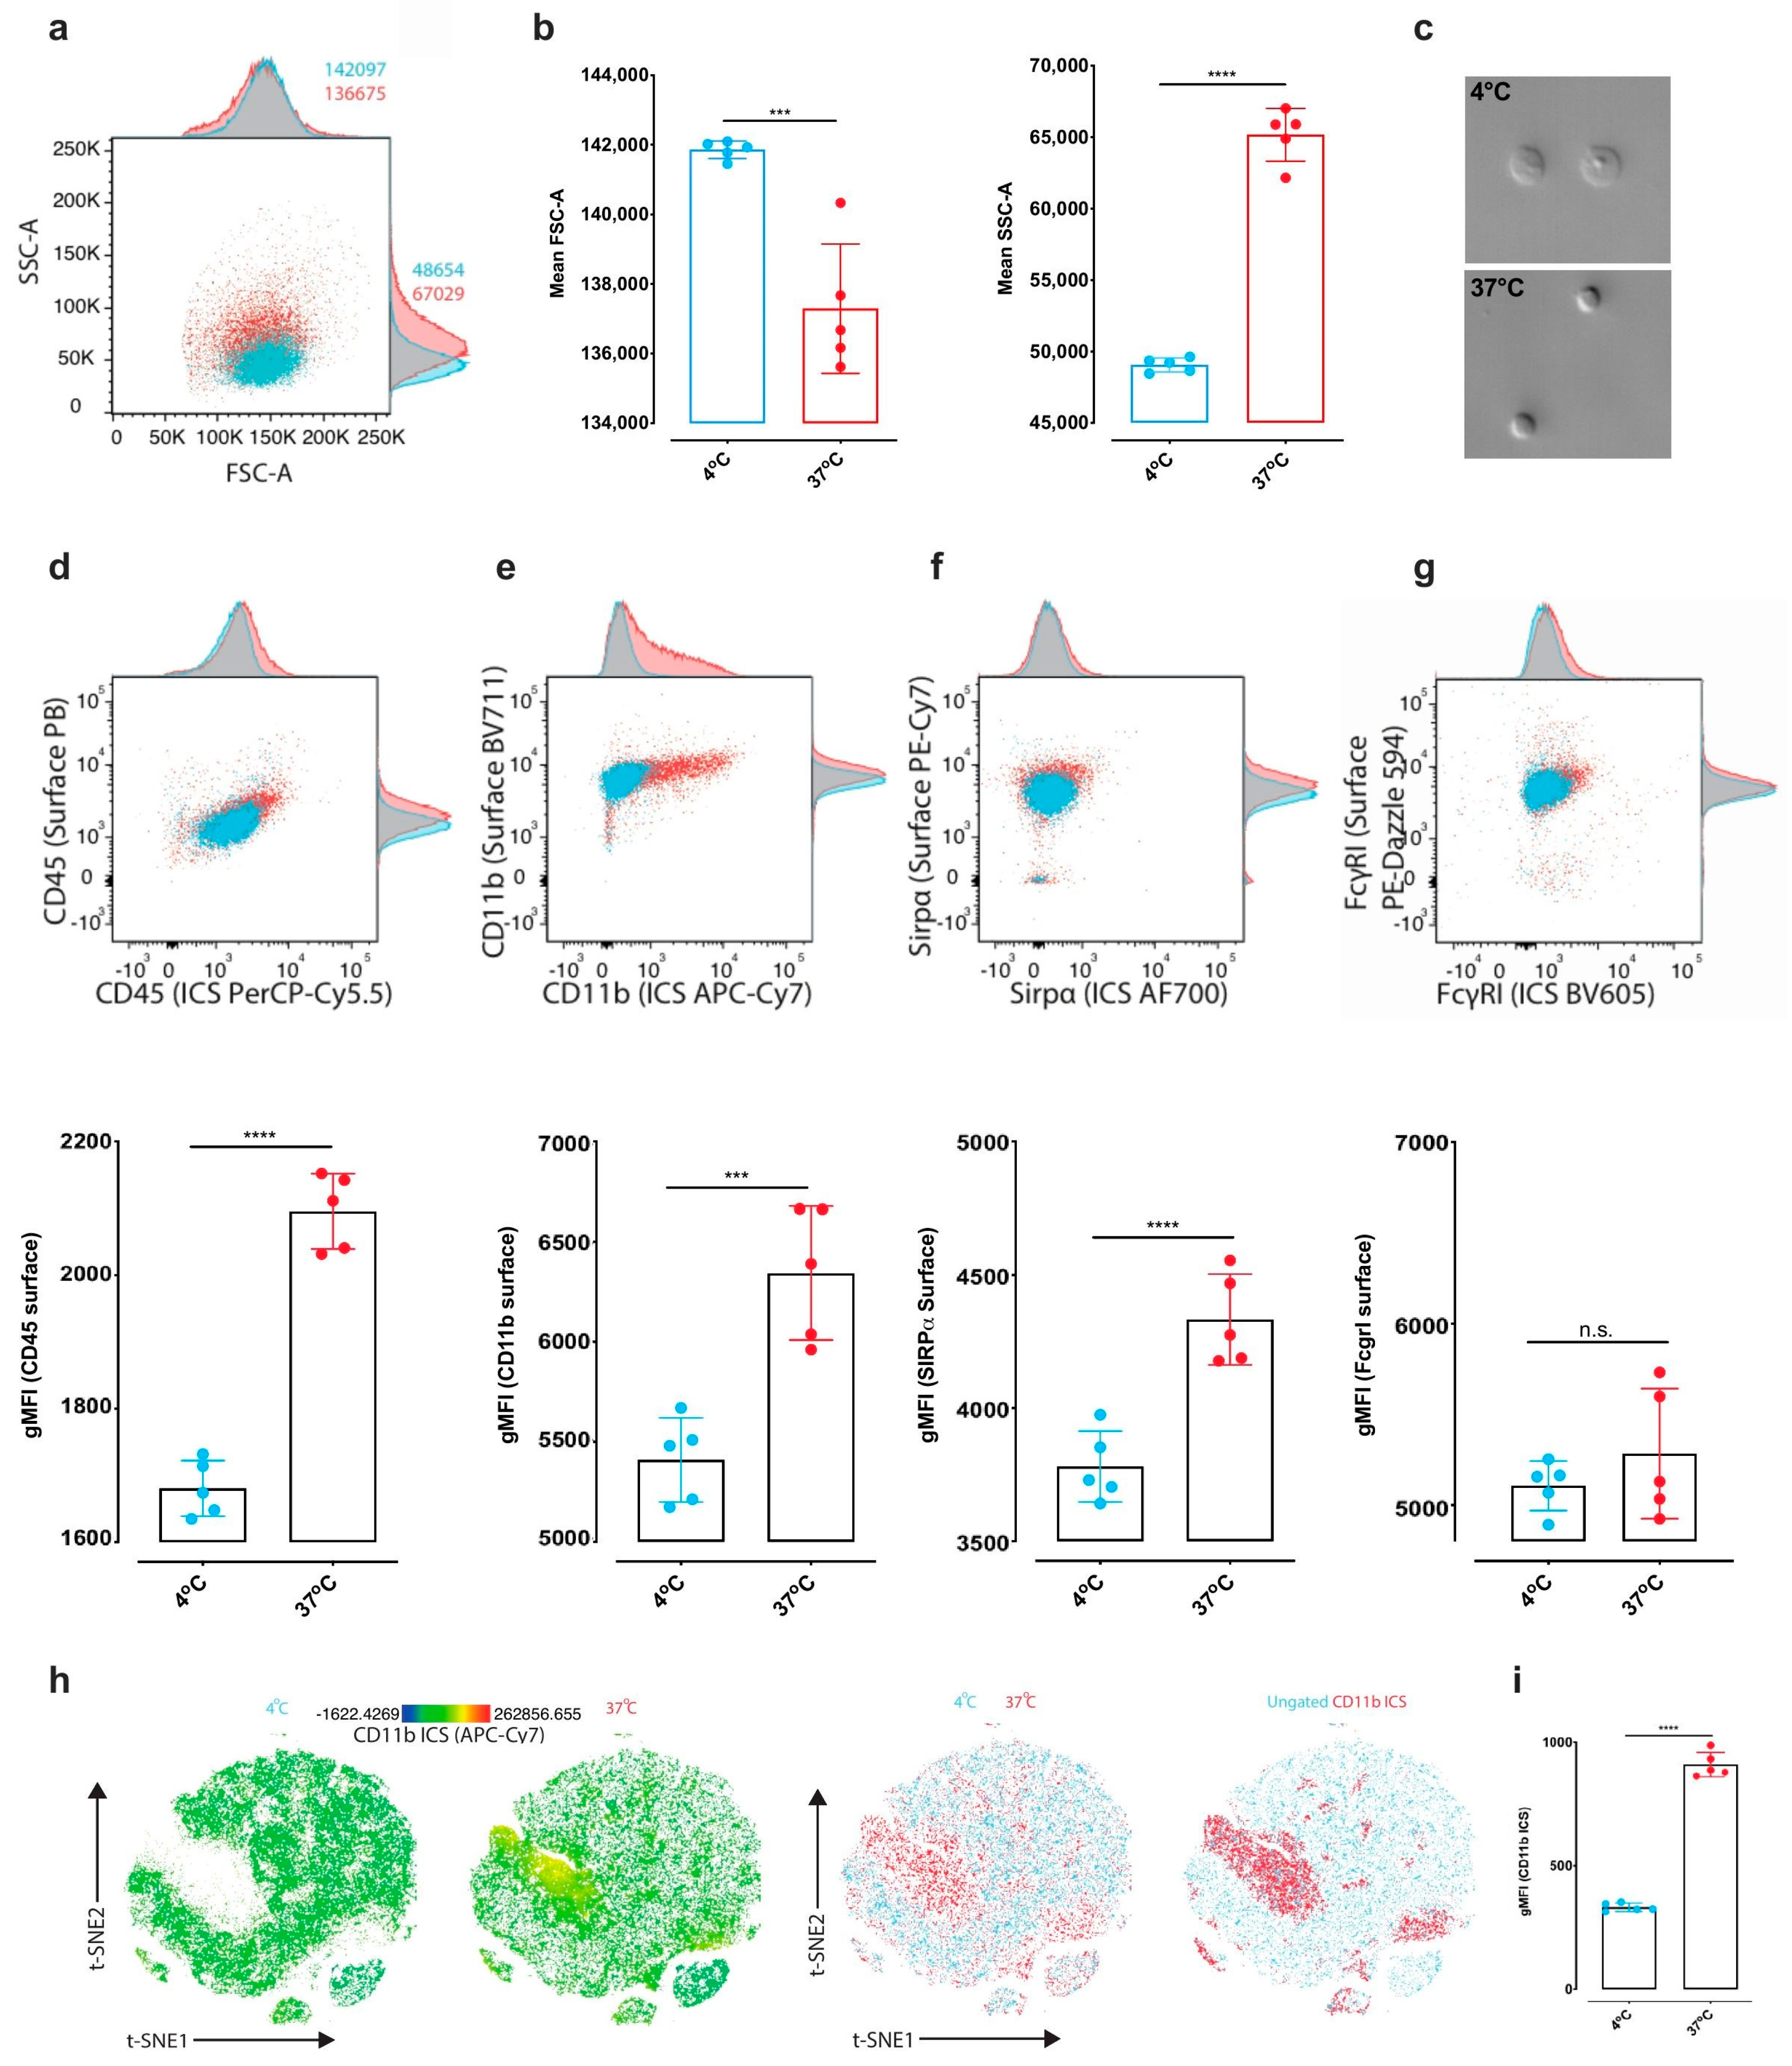
Figure 3b) and to a marked internalization of a commonly used microglial cell marker (CD11b) as compared to MD4°.
While both MD and ED may be associated with a certain degree of technical bias, it is likely that keeping the cells at 4 °C (as pertaining to the MD technique) better preservers their transcriptional and proteomic state due to cellular metabolic inactivation. Indeed, both MD and ED readily alter the surface of cells due to mechanical stress and enzymatic trimming respectively, which per se introduces a degree of technical bias in both cases. However, holding cells in a metabolically quiescent state will prevent processes such as endocytosis and degradation that might further alter the intracellular/surface protein levels. Importantly, our study also provides evidence that the MD at 4 °C is efficient for obtaining single-cell suspensions from mouse brain tumor tissue (
Supplementary Figure S6d), which is often considered to be more challenging than a healthy mouse brain specimen in terms of tissue dissociation and cell isolation.
Our findings corroborate the data generated by van den Brink et al. [
13], who identified transcriptomic bias in peripheral tissue cells isolated via ED37° (e.g., pancreatic cells and muscle stem cells). This consistency is particularly remarkable when considering the ED37°-mediated deregulation in genes associated with translation, RNA processing, and cellular metabolism. The study by van den Brink et al. [
13] has been used by the authors of the Tabula Muris as a reference database to remove ED37°-induced genes a posteriori from the single-cell transcriptional atlas produced in various mouse organs [
26]. However, the work by van den Brink et al. [
13] only considered genes that were upregulated upon ED37°, while not accounting for a potential downregulation of genes. Our study shows that the latter can occur as well. For instance, 586 out of the 771 significantly deregulated genes were found to be downregulated in neurons, and 118 out of the 226 significantly deregulated microglial genes were downregulated as well (
Supplementary Table S1). Likewise, according to our proteotype analysis, ED37° caused downregulation of 772 proteins in microglia and of 1230 proteins in astrocytes (
Supplementary Table S3). Moreover, in addition to the general consistency between our findings and those reported by van den Brink et al. [
13], we identified several brain cell-specific alterations in biological processes after ED37°, which could not have been predicted by analyses of peripheral cells. A recent study by Ayata et al. also raised this issue by comparing microglia isolated via ED with microglial specific mRNA isolated via the translating ribosome affinity purification (TRAP) method [
8]. Consistent with our findings, Ayata et al. [
8] noted increased expression of immediate early genes and immune-related genes in their bulk sequencing of freshly isolated microglial cells. It thus appears that ED37°-induced artifacts not only emerge in scSeq, but also bulk sequencing.
In summary, although any brain cell isolation method available at present is likely associated with a certain degree of technical and biological artifacts, MD4° of brain tissue may readily help minimize the profound alterations in the transcriptome and proteotype of specific brain cells, as seen after standard ED at 37 °C. Our dataset provides a mean of identifying brain cell-specific genes and proteins affected by ED37°, which in turn may serve to correct bias in previously published data sets produced via ED37°. Finally, we hereby offer a cost-effective, easily established, and optimized MD protocol at 4 °C which may be useful for the neuroscientific community.
4. Material and Methods
4.1. Animals
Nine to ten weeks old male C57BL6/N mice (Charles River Laboratories, Sulzfeld, Germany) were used throughout the study. They were caged 3–5 animals per cage in individually ventilated cages (IVCs). The animal vivarium was a specific-pathogen-free (SPF) holding room, which was temperature- and humidity-controlled (21 ± 3 °C, 50 ± 10%) and kept under a reversed light–dark cycle (lights off: 09:00 AM–09:00 PM). All animals had ad libitum access to the same food (Kliba 3436, Kaiseraugst, Switzerland) and water throughout the entire study. All procedures described in the present study were approved by the Cantonal Veterinarian’s Office of Zurich under the license 063/18 (approved 01/05/2018).
For the glioma model, six to eight weeks old C57BL/6JRj male mice (Janvier Labs, Le Genest-Saint-Isle, France) were used for the inoculation of the GL-261 brain tumor cell line. They were caged 3–5 animals per cage in individually ventilated cages (IVCs). The animal vivarium was an SPF holding room, which was temperature- and humidity-controlled (21 ± 3 °C, 50 ± 10%). All animals had ad libitum access to the same food and water throughout the entire study. All procedures described for the glioma model were performed according to institutional guidelines and approved by the Swiss Cantonal veterinary office (licenses ZH246/15, approved 27 June 2016).
4.2. GL-261luc Cells
The murine GL-261 brain tumor cell line (syngenic to C57BL/6) was stably transfected with pGl3-ctrl and pGK- Puro (Promega, Dübendorf, Switzerland) and selected with puromycin (Sigma-Aldrich) to generate luciferase-stable GL-261 cells. Cells were cultured at 37 °C 5% CO2 in DMEM supplemented with 10% heat-inactivated fetal calf serum, 1% L-glutamine (Thermo Fisher Scientific, Waltham, MA, USA), and 1% Pen-Strep (Sigma, St. Luois, MO, USA).
4.3. Surgical Procedures
For glioma inoculation, 6–10 weeks old mice were anesthetized using a mixture of fentanyl (Helvepharm AG, Thurgau, Switzerland), midazolam (Roche Pharma AG, Basel, Switzerland), and medetomidine (Orion Pharma AG, Zug, Switzerland). GL261 cells were injected intracranially (i. c.) in the right hemisphere using a stereotactic robot (Neurostar, Tubingen, Germany). Briefly, a blunt-ended syringe (Hamilton; 75N, 26s/2”/2, 5 µL) was placed 1.5 mm lateral and 1 mm frontal of bregma. The needle was lowered into the burr hole to a depth of 4 mm below the dura surface and retracted 1 mm to form a small reservoir. The injection was performed in a volume of 2 µL at 1 µL/min. A total of 20,000 cells in 2 μL PBS were injected at a speed of 1 μL/min intracranially into mice using a neurostar stereotaxic robot as described in Beffinger et al. 2019 [
27]. After leaving the needle in place for 2 min, it was retracted at 1 mm/min. The burr hole was closed with bone wax (Aesculap, Braun, Tuttlingen, Germany) and the scalp wound was sealed with tissue glue (Indermil, Henkel, Düsseldorf, Germany). Anesthesia was interrupted using a mixture of flumazenil (Labatec Pharma AG, Geneva, Switzerland) and Buprenorphine (Indivior Schweiz AG, Zug, Switzerland), followed by injection of atipamezole 20 min later (Janssen). Carprofen (Pfizer AG, Zurich, Switzerland) was used for perioperative analgesia. Mice were collected for experiments at 20 days post glioma inoculation and the tumor-bearing hemispheres were processed with either mechanical dissociation at 4 °C or with enzymatic digestion at 37 °C to test the respective technique’s efficiency in producing single-cell suspensions for flow cytometric analysis (see below).
4.4. Brain Dissociation and Cell Isolation
The protocol has been optimized from our previous protocol [
1] and the procedures provided by Miltenyi (adult brain dissociation kit, ABDK, Miltenyi, Bergisch Gladbach, Germany). The protocol is optimized for the dissociation and isolation of cells from brain tissue of small volume (e.g., mouse hippocampi). A detailed dissociation protocol for larger pools of tissue or whole adult mouse brain is provided in
Additional File S1. A detailed list of materials and reagents recommended for the following cell isolation protocol is displayed in
Table 1 below.
The animals were deeply anesthetized with an overdose of Nembutal (Abbott Laboratories, North Chicago, IL, USA) and transcardially perfused with 15 mL ice-cold, calcium- and magnesium-free Dulbecco’s phosphate-buffered saline (DPBS, pH 7.3–7.4) via a 20 mL syringe and a 23 G needle (25 mm length). The brains were quickly removed and washed with ice-cold DPBS, after which the hippocampi were dissected on a cooled petri dish and placed in an ice-cold Hibernate-A medium.
For enzymatic digestion (ED) at 37 °C, 2–4 hippocampi/samples were grossly minced with surgical scissors and placed in a sterile 12-well plate containing dissection medium pre-heated to 37 °C. The dissection medium contained Roswell Park Memorial Institute (RPMI) medium, 10% fetal bovine serum (FBS), 0.4mg/mL collagenase and 2 mg/mL DNaseI. The plate was then placed in a standard cell culture incubator at 37 °C with 95% O
2 and 5% CO
2 for a total of 30 min. After the first 15 min of incubation, the tissue was mixed with a pipette to optimize the enzymatic digestion. At the end of the 30 min enzymatic digestion, the plate was placed on ice, and the digested tissue was transferred to a 1 mL Dounce homogenizer to complete the dissociation of remaining tissue pieces (on ice). Thereafter, the homogenate was sieved through a 70 μm cell strainer mounted onto a 50 mL Falcon tube and transferred into 5 mL Eppendorf tubes on ice. Eppendorf tubes made of polypropylene were used because cells show less adherence to this material as opposed to polystyrene [
5].
Mechanical dissociation (MD) at 4 °C was carried out on ice, while all the solutions were kept at 4 °C. 2–4 hippocampi/sample were dissociated in 1.5 mL Hibernate-A medium in a 1 mL Dounce homogenizer with a loose pestle. The 1 mL Dounce homogenizer used here (see
Table 1) has enough capacity for a volume of 1.5 mL, which is preferable for optimal tissue dissociation. Furthermore, this mechanical homogenizer allows enough space between the glass pot and the loose pestle, which is required for efficient tissue homogenization without extensive cell loss. The tissue was gently homogenized until no bigger tissue pieces were visible. The homogenized tissue was then sieved through a 70 μm cell strainer mounted onto a 50 mL Falcon tube. The Dounce homogenizer was then washed twice with 1 mL Hibernate-A, whereby each wash is poured onto the cell strainer. The homogenized hippocampi were then transferred to 5 mL Eppendorf tubes and kept on ice as described above.
After ED at 37 °C or MD at 4 °C, all samples were handled the same way and further processed as follows: The homogenates were pelleted at 400× g for 6 min at 4 °C in a swing-bucket rotor centrifuge (Eppendorf, Schönenbuch, Switzerland). The supernatants were removed and 1 mL ice-cold DPBS (pH 7.3–7.4) was added to all samples. The pellets were then re-suspended with a P1000 micropipette, applying a pipette-tip cut-off. After re-suspension, the final volume in each tube was brought to 1.5 mL. 500 μL of freshly prepared isotonic percoll solution (percoll, GE Healthcare, Opfikon, Switzerland) was then added to each sample (final volume: 2 mL) and mixed well (applying a pipette-tip cut-off to optimize the mixing). Percoll was rendered isotonic by mixing 1 part of 10 × calcium- and magnesium-free DPBS (pH 7.3–7.4) with 9-parts of percoll. Importantly, the pH of percoll was adjusted to 7.3–7.4 with 5 molar hydrochloric acid before starting the isolation procedure. The percoll solution was mixed properly with the cell suspension, after which 2 mL of DPBS were gently layered on top of it with a pipette boy set on the slowest speed, creating two separate layers. The samples were centrifuged for 10 min at 3000× g. The centrifugation resulted in an upper layer consisting of DPBS and a lower layer consisting of percoll. The two layers were separated by a disk of myelin and debris, while the cells were located at the bottom of the tube. The layers were aspirated, leaving about 500 μL as some cells, depending on their size, usually float in percoll just above the pellet. The cells were then washed once in DPBS making sure not to resuspend the pellet. This was achieved by gently adding 4 mL DPBS, closing the tube and holding it in a horizontal position, and gently tilting it 145 degrees to mix the remaining percoll with the added DPBS. The cells were then pelleted by centrifuging them at 400× g for 10 min at 4 °C.
In
Supplementary Figure S7, we show the utility and effectiveness of the chosen brain dissociation and cell isolation protocol in obtaining a large amount of microglia and astrocytes from as little as 1 single hippocampus from 1 brain hemisphere of adult male mice. Indeed, enough RNA can be obtained from either microglia or astrocytes from 1 hippocampus to perform scSeq, or to generate an RNA library for bulk sequencing (
Supplementary Figure S7).
4.5. Microglia and Astrocyte Isolation
A schematic illustration of the procedures used for microglia and astrocyte isolation is provided in
Figure 3a. For the proteomic analysis, microglia or astrocytes were isolated from 4 hippocampi (2 mice/sample) via magnetic-activated cell sorting (MACS) using mouse anti-CD11b (for microglia) or anti-ACSA-2 (for astrocytes) magnetic microbeads (Miltenyi, Bergisch Gladbach, Germany, see
Table 1) according to the manufacturer’s instructions with some modifications. The MACS buffer used consisted of 1.5% bovine serum albumin (BSA) diluted in DPBS from a commercial 7.5% cell-culture grade BSA stock (Thermo Fisher Scientific). For the isolation of astrocytes, total hippocampal cell pellets after percoll (see above) were re-suspended in 80 μL MACS buffer and 10 μL FcR-blocking reagent (Miltenyi). The cells were then incubated for 10 min at 4 °C. Thereafter, 10 μL of anti-ACSA-2 microbeads were added and the cells were incubated for 15 min at 4 °C. The cells were then washed with 1 mL MACS buffer and pelleted at 300×
g for 5 min at 4 °C. The cells were then passed through an MS MACS column attached to a magnet. This led ACSA-2-labeled cells to stay attached to the column, whereas unlabeled cells flowed through the column. After washing the columns three times with MACS buffer, astrocytes were flushed from the column with 1 mL MACS buffer and pelleted at 300×
g for 5 min at 4 °C. Cell pellets were then snap-frozen in liquid nitrogen and stored at –80 °C. The same procedures (including the FcR-blocking step) were used to isolate microglia via anti-mouse CD11b microbeads.
Supplementary Figure S7b,d show a qRT-PCR-based ascertainment of microglial or astrocytic cell enrichment after MACS from total brain cells obtained with the 4 °C protocol described above (See
Additional File S1 for the detailed cell isolation protocol). Cells were counted manually using a standard hemocytometer (NanoEnTek, Seoul, South Korea, product code DHC-N01).
4.6. RNA Extraction and Quantification
The RNA was extracted via the Lexogen Split-RNA extraction kit (Lexogen, Vienna, Austria) according to the manufacturer’s instructions. The kit is based on phenol-chloroform extraction in acidic conditions, and we found this technique to yield the highest amount of RNA. RNA concentrations were measured via Qubit 4 fluorometer (Invitrogen, Carlsbad, CA, USA), using the RNA HS Assay kit (Invitrogen).
4.7. Quantitative Real-Time PCR
RNA was analyzed by TaqMan qRT-PCR instrument (CFX384 real-time system, Bio-Rad Laboratories, Cressier, Switzerland) using the iTaq™ Universal Probes One-Step Kit for probes (Bio-Rad Laboratories). The samples were run in 384-well formats in triplicates as multiplexed reactions with a normalizing internal control. We chose 36B4 as an internal standard for gene expression analyses. Thermal cycling was initiated with incubation at 50 °C for 10 min (RNA retrotranscription) and then at 95 °C for 5 min (TaqMan polymerase activation). After this initial step, 39 cycles of PCR were performed. Each PCR cycle consisted of heating the samples at 95 °C for 10 s to enable the melting process and then for 30 s at 60 °C for the annealing and extension reaction. Cutsom-made primers with probes for TaqMan were purchased from Thermo Fisher: housekeeping gene: 36B4, product code: NM_007475.5, Siglech, product code: Mm_00618627_m1, P2ry12, product code: Mm00446026_m1, Gfap, product code: Mm01253033_m1, Slc1a3, product code: Mm00600697_m1. The relative target gene expression was calculated according to the Delta C(T) method.
4.8. Single-cell RNA Sequencing (scRNA-seq) using 10X Genomics Platform
The quality and concentration of the single-cell preparations were evaluated using a hemocytometer in a Leica DM IL LED microscope and adjusted to 1000 cells/µL. 10,000 cells per sample were loaded into the 10X Chromium controller (10X Genomics, Pleasanton, CA, USA) and library preparation was performed according to the manufacturer’s indications (single-cell 3′ v3 protocol). The resulting libraries were sequenced in an Illumina NovaSeq sequencer according to 10X Genomics recommendations (paired-end reads, R1 = 28, i7 = 8, R2 = 91) to a depth of around 50,000 reads per cell. The quality check outcomes are displayed in
Supplementary Figure S2.
4.9. Single-cell RNA-Seq Analysis
10 x Chromium data were demultiplexed with cellranger mkfastq v2.0.2. Gene-cell count matrix was generated by cellranger count v2.0.2 against Ensembl GRCm38.p5 reference genome.
Single Cell RNA-Seq data analysis was carried out with R Seurat (V3) package. Specifically, to account for potential batch effects, we used canonical correlation analysis (utilized in IntegrateData function) that identifies a linear combination of features to construct a shared correlation structure and align the global transcriptome across 2 datasets [
28,
29]. Only genes that were detected in at least 5 cells were included in the analysis. Furthermore, we excluded from the analysis of all cells with less than 200 or more than 5000 genes detected, and cells that have more than 25% mitochondrial fraction. We carried out standard preprocessing (log-normalization) and identified the top 2000 variable features for each dataset (ED37 °C and MD4 °C). We then identified integration anchors using the FindIntegrationAnchors function. Here we used all default parameters for identifying anchors between the two data sets, setting the ‘dimensionality’ to 1:15. The final batch-corrected expression matrix was created from this anchor-set using IntegrateData function where the number of PCs used for weighting was set to 15. We employed a standard Seurat workflow for clustering and visualization: data scaling, PCA analysis, and UMAP clustering using PCA reduction. For improved visualization, we further filtered out all cells located more than 3 standard deviations away from their cluster center and those which had a different identity than the majority of their 10 nearest neighbors in the UMAP.
The differential expression analysis was carried out using the FindMarker function (logfc.threshold = 0). p-values were calculated using the Wilcoxon Rank Sum test and adjusted with Bonferroni correction
4.11. Proteotype Analysis
4.11.1. Liquid Chromatography–Tandem Mass Spectrometry (LC–MS/MS) Analysis
The samples used for proteotype analysis were prepared using S-trap (Protifi, Huntington, NY, USA) columns according to the manufacturer’s instructions. For MS analysis, peptides were reconstituted in 5% acetonitrile and 0.1% formic acid containing iRT peptides (Biognosys AG, Schlieren, Switzerland) as described in Escher et al., 2012 [
30].
The peptides resulting from the isolation of microglia were analyzed in data-independent acquisition (DIA) and data-dependent acquisition (DDA) mode for spectral library generation. For spectral library generation, a fraction of the samples originating from the same condition were pooled to generate mixed pools for each condition. Peptides were separated by reverse-phase chromatography on a high-pressure liquid chromatography (HPLC) column (75-μm inner diameter; New Objective, Littleton, MA, USA) packed in-house with a 50-cm stationary phase ReproSil-Pur 120A C18 1.9 µm (Dr. Maisch GmbH, Ammerbuch, Germany) and connected to an EASY-nLC 1000 instrument equipped with an autosampler (Thermo Fisher Scientific). The HPLC was coupled to a Fusion mass spectrometer equipped with a nanoelectrospray ion source (Thermo Fisher Scientific). Peptides were loaded onto the column with 100% buffer A (99% H2O, 0.1% formic acid) and eluted with increasing buffer B (99.9% acetonitrile, 0.1% formic acid) over a nonlinear gradient for 120 min. The DIA method (Bruderer et al. 2017) [
31] contained 26 DIA segments of 30,000 resolution with IT set to 60ms, AGC of 3 × 10
6, and a survey scan of 120,000 resolution with 60 ms max IT and AGC of 3 × 10
6. The mass range was set to 350–1650 m/z. The default charge state was set to 2. Loop count 1 and the normalized collision energy was stepped at 27. For the DDA, a 3 s cycle time method was recorded with 120,000 resolution of the MS1 scan and 20 ms max IT and AGC of 1 × 10
6. The MS2 scan was recorded with 15,000 resolution of the MS1 scan and 120 ms max IT and AGC of 5 × 10
4. The covered mass range was identical to the DIA.
The peptides resulting from the isolation of astrocytes were analyzed in the DIA and DDA mode for spectral library generation. For spectral library generation, a fraction of the samples originating from the same condition were pooled to generate mixed pools for each condition. Peptides were separated by reverse-phase chromatography on a 50 cm EASY-Spray C18 LC column (Thermo Fisher Scientific) connected to an EASY-nLC 1200 instrument equipped with an autosampler (Thermo Fisher Scientific). The HPLC was coupled to a Fusion Lumos mass spectrometer equipped with a nanoelectrospray ion source (Thermo Fisher Scientific). Peptides were loaded onto the column with 100% buffer A (99% H
2O, 0.1% formic acid) and eluted with increasing buffer B (80% acetonitrile, 0.1% formic acid) over a nonlinear gradient for 120 min. The DIA method [
32] contained 40 DIA segments of 30,000 resolution with IT set to 55 ms, AGC of 1 × 10
6, and a survey scan of 120,000 resolution with 50 ms max IT and AGC of 5 × 10
5. The mass range was set to 350–1650 m/z. The default charge state was set to 2. Loop count 1 and the normalized collision energy was set to 27. For the DDA, a 3 s cycle time method was recorded with 120,000 resolution of the MS1 scan and 25 ms max IT and AGC of 5 × 10
5. The MS2 scan was recorded with 15,000 resolution of the MS1 scan and 35 ms max IT and AGC of 2 × 10
4. The covered mass range was identical to the DIA.
4.11.2. Data Analysis DIA LC-MS/MS
LC-MS/MS DIA runs were analyzed with Spectronaut Pulsar X version 12 (Biognosys) [
31] using default settings. Briefly, a spectral library was generated from pooled samples measured in DDA (details above). The collected DDA spectra were searched against UniprotKB (UniProt Swiss-prot, Mus musculus retrieved 2018) using the Sequest HT search engine within Thermo Proteome Discoverer version 2.1 (Thermo Fisher Scientific). We allowed up to two missed cleavages and semi-specific tryptic digestion. Carbamidomethylation was set as fixed modification for cysteine, oxidation of methionine, and deamidation of arginine were set as variable modifications. Monoisotopic peptide tolerance was set to 10 ppm, and fragment mass tolerance was set to 0.02 Da. The identified proteins were assessed using Percolator and filtered using the high peptide confidence setting in Protein Discoverer. Analysis results were then imported to Spectronaut Pulsar version 12 (Biognosys AG, Schlieren, Switzerland) for the generation of spectral libraries.
Targeted data extraction of DIA-MS acquisitions was performed with Spectronaut version 12 (Biognosys AG) with default settings using the generated spectral libraries as previously described [
31]. The proteotypicity filter “only protein group-specific” was applied. Extracted features were exported from Spectronaut for statistical analysis with MSstats (version 3.8.6) using default settings [
33]. Briefly, features were filtered for calculation of Protein Group Quantity as defined in Spectronaut settings, common contaminants were excluded. For each protein, features were log-transformed and fitted to a mixed effect linear regression model for each sample in MSstats [
33]. In MSstats, the model estimated fold change and statistical significance for all compared conditions. Significantly different proteins were determined by the threshold fold-change > 2 and adjusted
p-value < 0.01. Benjamini–Hochberg method was used to account for multiple testing.
4.12. Gene Ontology Analysis
The functional enrichment analysis for the transcriptome data was carried out with R tmod package [
34], using Utest. For each cell type, we used genes that were detected by Seurat::FindMarker (logfc.threshold = 0) function and sorted them by adjusted
p-values: microglia—5631 genes, astrocytes—4108 genes, and neurons—3288 genes. The enrichment analysis is done using the GO gene set collection from MsigDB. To match MsigDB gene symbols, mouse gene ids were converted to upper case. Significantly different genes were determined by the threshold: log-fold change > 0.5, adjusted
p-value cut-off < 0.01.
Supplementary Table S1 contains a full list of deregulated genes for all cells and
Supplementary Table S2 contains the full GO-analysis of deregulated genes for each cell type analyzed. For the proteomic GO analysis, we used a hypergeometric test from the GOrilla online tool [
35]. For the proteomic GO analysis, we used the hypergeometric test from GOrilla online tool: all quantified microglial or astrocytic proteins were used as background, while the significantly deregulated proteins were used as target set (all as Uniprot IDs, log-fold change > 2, adjusted
p-value cut-off < 0.01). Significantly up- and downregulated proteins were analyzed separately using the same background set of proteins.
Supplementary Tables S3 and S4 contains the full list of deregulated proteins and GO analysis per cell type, respectively.
4.13. Comparison of RNA and Protein Expression Changes
In astrocytes, we quantified 3823 proteins present in both conditions (ED37° and MD4°), which were assigned to 3623 unique genes. Median log-fold changes (LFCs) were used for the comparison of RNA and protein expression changes. For microglia, we quantified 4328 proteins that were present in both conditions (ED37° and MD4°), and these were assigned to 4158 unique genes. Pearson’s correlation was used to assess the linear association between the datasets.
4.14. Flow Cytometric Analysis
Data analysis was performed using FlowJo 10.5.3 (BD, Franklin Lakes, NJ, USA). Populations of interest were manually pre-gated in FlowJo software. Microglia were identified as CD45medium CD11bmedium, live, single cells.
After preprocessing we combined an equal number of randomly selected cells from each group and visualized data using t-Distributed Stochastic Neighbor Embedding (t-SNE). The reagents used in flow cytometry are summarized in
Table 2 below.
One hippocampus/sample (from 1 brain hemisphere) was used for the flow cytometric experiments. Cells were isolated as described above. After cell isolation, the samples were washed with PBS and stained for surface markers and live/dead reagent. Following washing with PBS, the cells were fixed and permeabilized with Cytofix/Cytoperm (BD, #554715), followed by staining for intracellular markers. Flow cytometry was performed on an LSR II Fortessa (equipped with 405 nm, 488 nm, 561 nm, and 640 nm laser lines; special order research product, BD) with FACS Diva Software. Before the acquisition, PMT voltages were manually adjusted to reduce fluorescence spillover, and single-stain controls were acquired for compensation matrix calculation. The specific antibodies used for the flow cytometric staining are listed in
Table 2 below.
4.15. List of Abbreviations
ED37°, enzymatic digestion at 37 °C; MD4°, mechanical dissociation at 4 °C; RT, room temperature; scRNA-Seq, single-cell RNA-sequencing; UMAP, uniform manifold approximation and projection; GO-analysis, gene ontology analysis; FACS, fluorescence-activated cell sorting; DIA, data-independent acquisition; DDA, data-dependent acquisition; LC-MS/MS, liquid chromatography–tandem mass spectrometry; PE, phycoerythrin; APC, allophycocyanin; BV, brilliant violet; PerCP, Peridinin-Chlorophyll-Protein; CD, cluster of differentiation; SIRPα, Signal regulatory protein α; FcγR, Fc-gamma receptor; tSNE, t-distributed stochastic neighbor embedding; ICS, intracellular staining; PBS, phosphate buffered saline; PMT, photomultiplier tubes; MHC, major histocompatibility complex.
4.16. Accessibility and Availability of Data and Materials
All mass spectrometric data and acquisition information were deposited to the ProteomeXchange Consortium (
www.proteomexchange.org/) via the PRIDE partner repository [
37] (data set identifier: PXD015592, username: reviewer08386@ebi.ac.uk, password: kRa2alY7).

 ,
, 
