Article

Evolution of Transmissible Gastroenteritis Virus (TGEV): A Codon Usage Perspective

1
College of Veterinary Medicine, Yangzhou University, Yangzhou 225009, China
2
Joint International Research Laboratory of Agriculture and Agri-Product Safety, The Ministry of Education of China, Yangzhou University, Yangzhou 225009, China
3
Institute of Comparative Medicine, Yangzhou University, Yangzhou 225009, China
4
Jiangsu Co-Innovation Center for Prevention and Control of Important Animal Infectious Diseases and Zoonoses, Yangzhou University, Yangzhou 225009, China
*
Authors to whom correspondence should be addressed.
Int. J. Mol. Sci. 2020, 21(21), 7898; https://doi.org/10.3390/ijms21217898
Submission received: 26 September 2020 / Revised: 18 October 2020 / Accepted: 21 October 2020 / Published: 24 October 2020
(This article belongs to the Section Molecular Genetics and Genomics)

Abstract

:
Transmissible gastroenteritis virus (TGEV) is a coronavirus associated with diarrhea and high mortality in piglets. To gain insight into the evolution and adaptation of TGEV, a comprehensive analysis of phylogeny and codon usage bias was performed. The phylogenetic analyses of maximum likelihood and Bayesian inference displayed two distinct genotypes: genotypes I and II, and genotype I was classified into subtypes Ia and Ib. The compositional properties revealed that the coding sequence contained a higher number of A/U nucleotides than G/C nucleotides, and that the synonymous codon third position was A/U-enriched. The principal component analysis based on the values of relative synonymous codon usage (RSCU) showed the genotype-specific codon usage patterns. The effective number of codons (ENC) indicated moderate codon usage bias in the TGEV genome. Dinucleotide analysis showed that CpA and UpG were over-represented and CpG was under-represented in the coding sequence of the TGEV genome. The analyses of Parity Rule 2 plot, ENC-plot, and neutrality plot displayed that natural selection was the dominant evolutionary driving force in shaping codon usage preference in genotypes Ia and II. In addition, natural selection played a major role, while mutation pressure had a minor role in driving the codon usage bias in genotype Ib. The codon adaptation index (CAI), relative codon deoptimization index (RCDI), and similarity index (SiD) analyses suggested that genotype I might be more adaptive to pigs than genotype II. Current findings contribute to understanding the evolution and adaptation of TGEV.

1. Introduction

Transmissible gastroenteritis virus (TGEV) is a porcine enteropathogenic coronavirus, which causes watery diarrhea, severe villous atrophy, and high mortality in piglets. Pigs of different ages can be infected by TGEV and newborn piglets, under two weeks of age, are the most susceptible [1]. In adult pigs and piglets greater than 3 weeks of age, the response to TGEV is milder, causing loss of appetite and diarrhea for 1 to 2 days [2]. TGEV was first reported in the United States in 1946 [3], and it was subsequently identified in Europe, Asia, Africa, and South America, causing heavy losses in the global pig breeding industry [4,5,6,7,8,9,10].
TGEV belongs to the Alphacoronavirus 1 species, Alphacoronavirus genus, Orthocoronavirinae subfamily, Coronaviridae family in the order Nidovirales [11]. TGEV contains a single-stranded, positive-sense RNA genome with a length of approximately 28.5 kb. The TGEV genome consists of a 5′ untranslated region (UTR), open reading frame 1a/1b (ORF1a/1b), spike (S), ORF3a, ORF3b, envelope (E), membrane (M), nucleocapsid (N), ORF7, and 3′ UTR [12,13,14]. S glycoprotein is related to receptor binding and cellular fusion [15,16]. It is the major target of neutralizing antibodies and the main determinant of host cell tropism and pathogenicity [17,18,19]. ORF1a and ORF1b together encode viral replicase [13] and ORF3a is related to the TGEV virulence [2]. ORF7 encodes a small hydrophobic protein, which plays an important role in the process of membrane integrity in viral replication and/or virion assembly [20]. Previous studies have indicated that TGEV can be divided into traditional and variant genotypes [21].
Generally, degeneracy or redundancy of the genetic code allows that 61 triplet codons encode all 20 amino acids except for methionine and tryptophan. The multiple codons that encode the same amino acid are termed synonymous codons. It is known that different organisms use synonymous codons with different frequencies in their coding sequences (CDSs); this is called codon usage bias. The evolution of codon usage bias is very complex. The degree of codon usage bias is affected by many factors, including mutation bias, translational selection, and dinucleotide bias [22]. Compared with the genomes of prokaryotes and eukaryotes, viral genomes have specific characteristics, for example, relying on their host cell machinery for genome replication and protein synthesis. The relationships of codon usage between viruses and their hosts affect gene expression [23], viral protein translation [24], viral virulence [25], and evasion from host’s immune system [26]. In brief, a holistic analysis of codon usage bias is essential to understanding of viral evolution, host adaptability, and genome characteristics. Herein, a wide range of bioinformatic methods was used to investigate the phylogeny, codon usage pattern, factors driving codon usage bias of TGEV, and virus adaptation toward the host. The information obtained in the study not only can provide an insight into the TGEV evolution, but also can be used to rationally design the attenuated TGEV strain that may have vaccine potential.

2. Results

2.1. Distinct Genotypes

A total of 32 complete genomes of TGEV strains were downloaded from NCBI in July 2020 (Table S1). In our study, TGEV AHHF strain and TGEV/USA/Illinois139/2006 strain were identified as potential recombinants (Figure S1). After removing two recombinant sequences, 30 complete genomes of TGEV strains were further analyzed. Both the maximum likelihood (ML) tree and Bayesian inference (BI) tree showed three well-supported individual clades: genotypes Ia, Ib, and II (Figure 1). Pairwise p-distances between genotypes I and II, genotypes Ia and II, genotypes Ib and II, and sub-genotypes Ia and Ib were 0.0341 ± 0.0010, 0.0310 ± 0.0009, 0.0356 ± 0.0010, and 0.0127 ± 0.0006, respectively.
Considering that partial spike gene sequence (first 1383 nt) was more available than TGEV complete genome [21], the ML and BI trees were constructed to further study the evolutionary relationship between TGEV strains. Phylogenetic trees of partial spike genes (n = 58) showed three main clades—including genotypes Ia, Ib, and II—which were consistent with the genotyping results of TGEV complete genome (Figure S2).

2.2. Nucleotide U Is the Most Frequent in the TGEV Coding Sequence

Nucleotide U was most abundant (0.331 ± 0.002) in the CDS of TGEV, followed by A (0.293 ± 0.001), G (0.207 ± 0), and C (0.168 ± 0.001) (Table 1 and Table S2). The average nucleotides AU and GC contents were 0.625 ± 0.001 and 0.375 ± 0.001, respectively. The analysis of GC content at different codon positions (GC1s, GC2s, GC12s, and GC3s) revealed that the mean of GC1 (0.461 ± 0.001) was higher than that of GC12 (0.416 ± 0.001), GC2 (0.371 ± 0.001), and GC3 (0.294 ± 0.002). The nucleotides at the third positions of codons (A3, G3, U3, and C3) showed nucleotide U3 as the most abundant (0.457 ± 0.004), followed by A3 (0.249 ± 0.003), which had the highest value after U3, and then C3 (0.158 ± 0.004) and G3 (0.136 ± 0.002), indicating that A/U-end codons were enriched in the TGEV coding sequences. The average value of effective number of codons (ENC) was 44.827 ± 0.095 (<45), suggesting a moderate codon usage bias in the TGEV genome.
In order to investigate whether the genome features are similar across the entire TGEV genome, we analyzed the nucleotide contents and properties of ORF1ab and spike, which sequences account for most of TGEV complete CDS. Results showed the patterns of nucleotide contents and genome characteristics of ORF1ab and spike were similar to the patterns observed in the TGEV complete CDS (Table S3).

2.3. Genotype-Specific Codon Usage Pattern

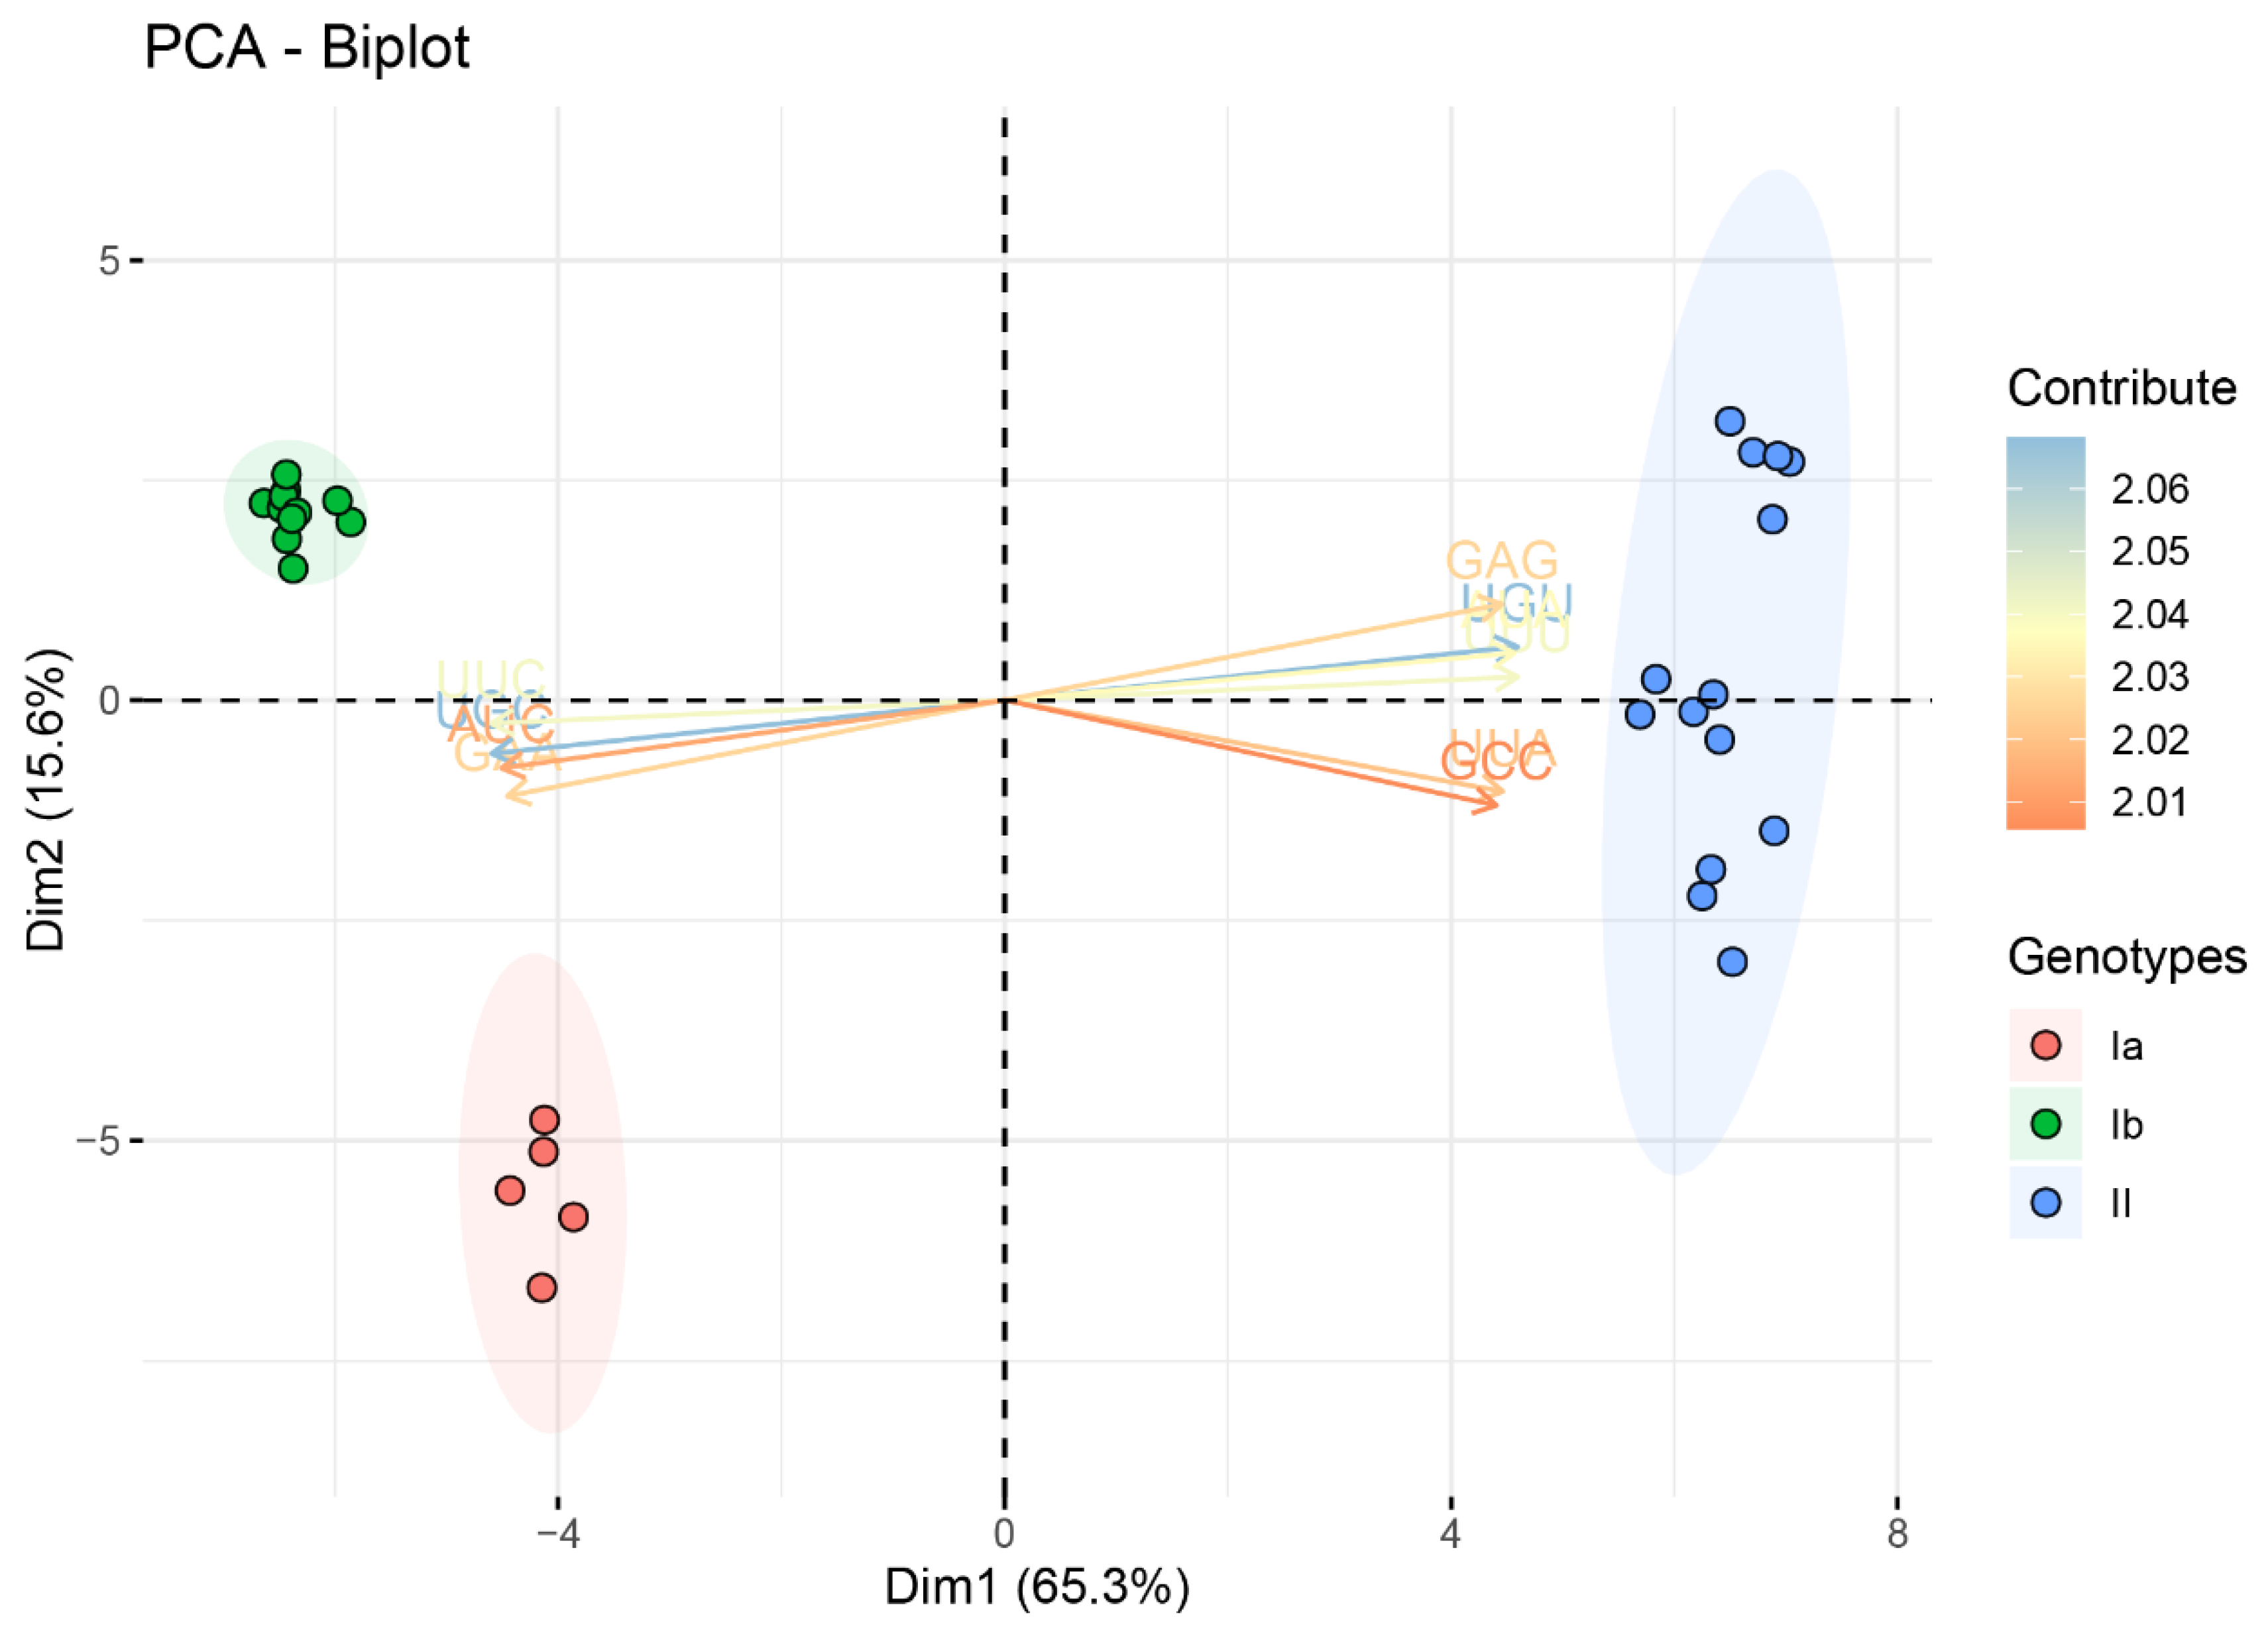
Relative synonymous codon usage (RSCU) analysis was performed to investigate the trend of codon usage and to further understand why A/U nucleotides are preferentially used at the third position of the codon. The preferred codons for 18 amino acids were commonly shared by three genotypes of the TGEV strains (Table 2). Surprisingly, all 18 of the preferred codons were A/U-end, including 4 A-end preferred codons (AGA[Arg], CAA[Gln], GAA[Glu], and AAA[Lys]) and 14 U-end preferred codons (GCU[Ala], AAU[Asn], GAU[Asp], UGU[Cys], GGU[Gly], CAU[His], AUU[Ile], CUU[Leu], UUU[Phe], CCU[Pro], UCU[Ser], ACU[Thr], UAU[Tyr], and GUU[Val]). Among 59 codons, about half of the codons were over-represented (RSCU > 1.6) or under-represented (RSCU < 0.6), including 12 over-represented (RSCU > 1.6) codons (20.34% of total 59 codons) and 21 under-represented (RSCU < 0.6) codons (35.59% of total 59 codons). Remarkably, the preferred codons and over-represented codons were A/U-end, while the under-represented codons were mostly G/C-ended codons except two A-end codons. The similar RSCU patterns were observed between ORF1ab, spike, and TGEV complete CDS (Table S4). In the principal component analysis (PCA) plot, the first two principal components accounted for 65.3% and 15.6% of total RSCU variations, respectively (Figure 2, Figures S3 and S4). The TGEV strains were significantly clustered into three groups: genotypes Ia, Ib, and II, which is consistent with the phylogenetic relationship of TGEV strains identified by the ML and BI analyses. These results displayed that a genotype-specific codon usage pattern was present in the TGEV strains.

2.4. Dinucleotides Influence the Codon Usage Pattern of TGEV

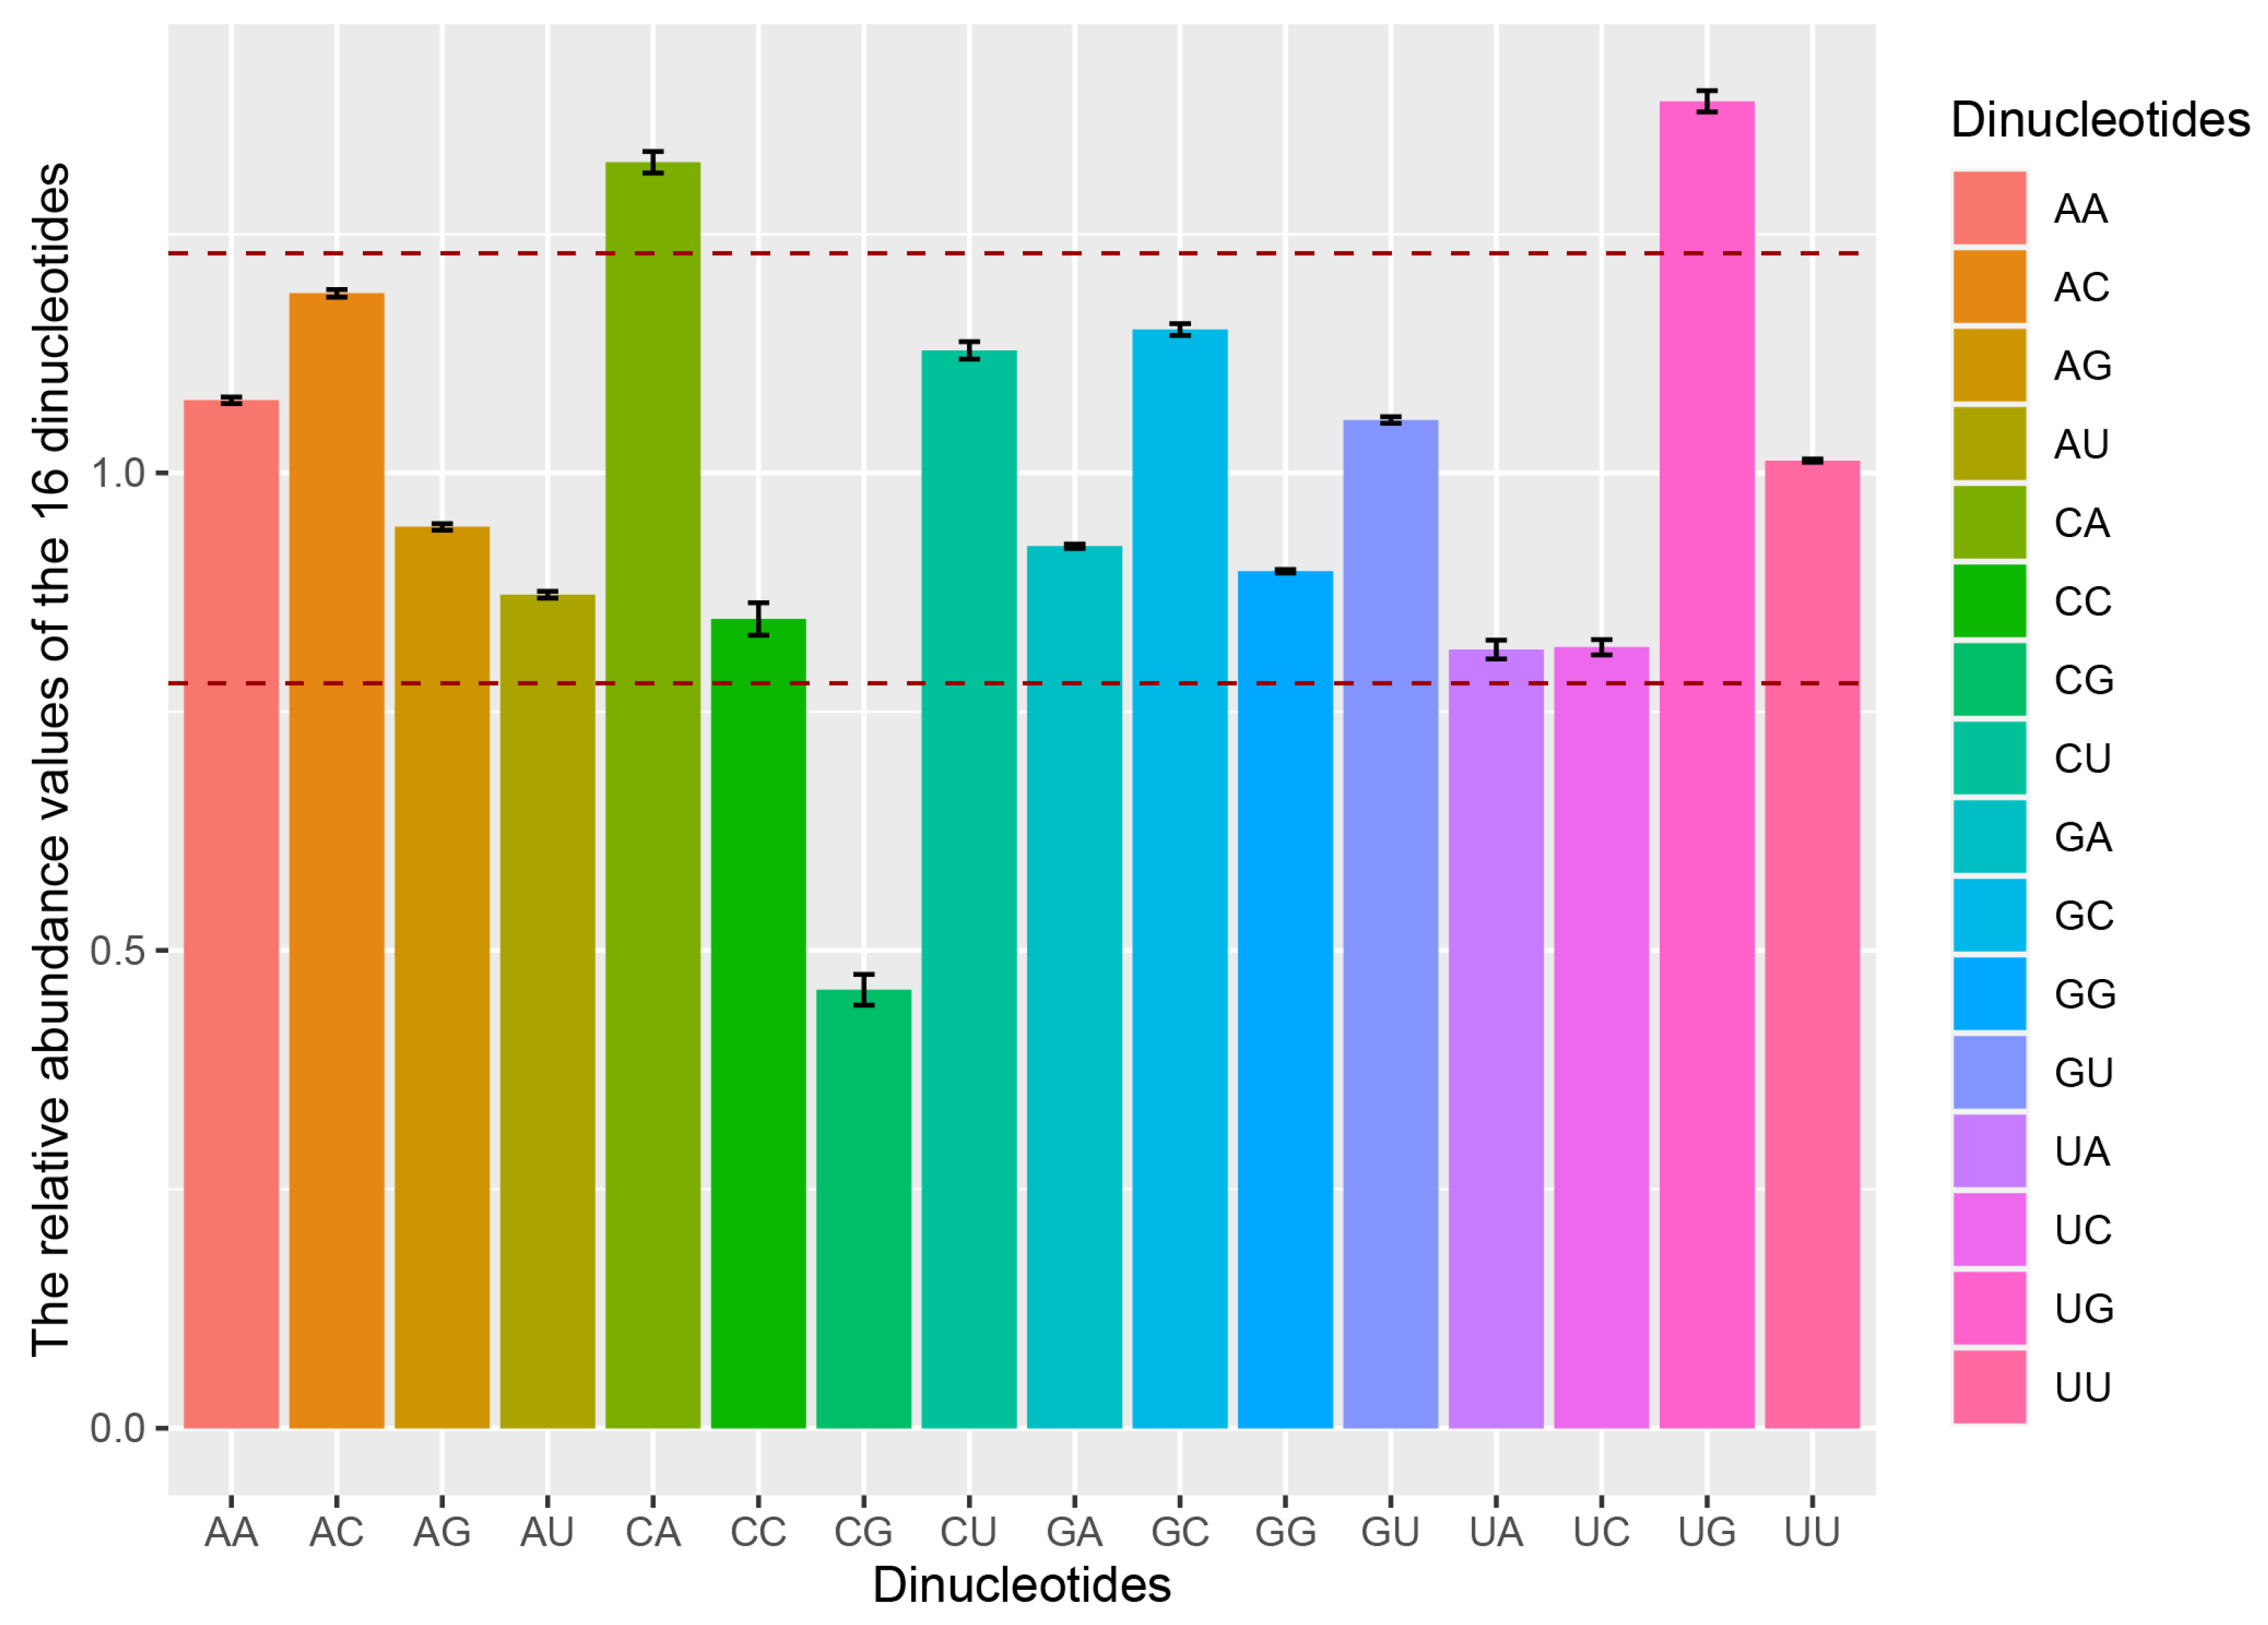
In the CDSs of ORF1ab, spike, and the TGEV genome, dinucleotides CpA and UpG were over-represented (Pxy > 1.23), whereas dinucleotide CpG was under-represented (Pxy < 0.78) (Figure 3 and Tables S5 and S6). Specially, dinucleotide ApC (Pxy = 1.349 ± 0.012) was over-represented in the spike gene, and dinucleotides UpA (Pxy = 0.775 ± 0.01) and GpA (Pxy = 0.778 ± 0.008) were under-represented in the ORF1ab and spike, respectively (Table S6). To investigate the possible effects of these three dinucleotides on codon usage bias, the RSCU values of CpA-containing, UpG-containing, and CpG-containing codons were analyzed. Among eight CpA-containing codons, CAA [Gln] and CAU [His] were preferentially used, and CCA [Pro] and ACA [Thr] were over-represented. Of the five codons using dinucleotide UpG, UGU [Cys], and CUG [Leu] were preferred and under-represented, respectively. Of the eight codons containing dinucleotide CpG, seven codons (GCG [Ala], CGA [Arg], CGC [Arg], CGG [Arg], CCG [Pro], UCG [Ser], and ACG [Thr]) were under-represented in the genome CDSs of TGEV. Taken together, these data suggest that the CpA over-representation and CpG depletion markedly influenced the codon usage pattern of the TGEV genome.

2.5. Effect of Mutation Pressure and Natural Selection on Codon Usage Bias

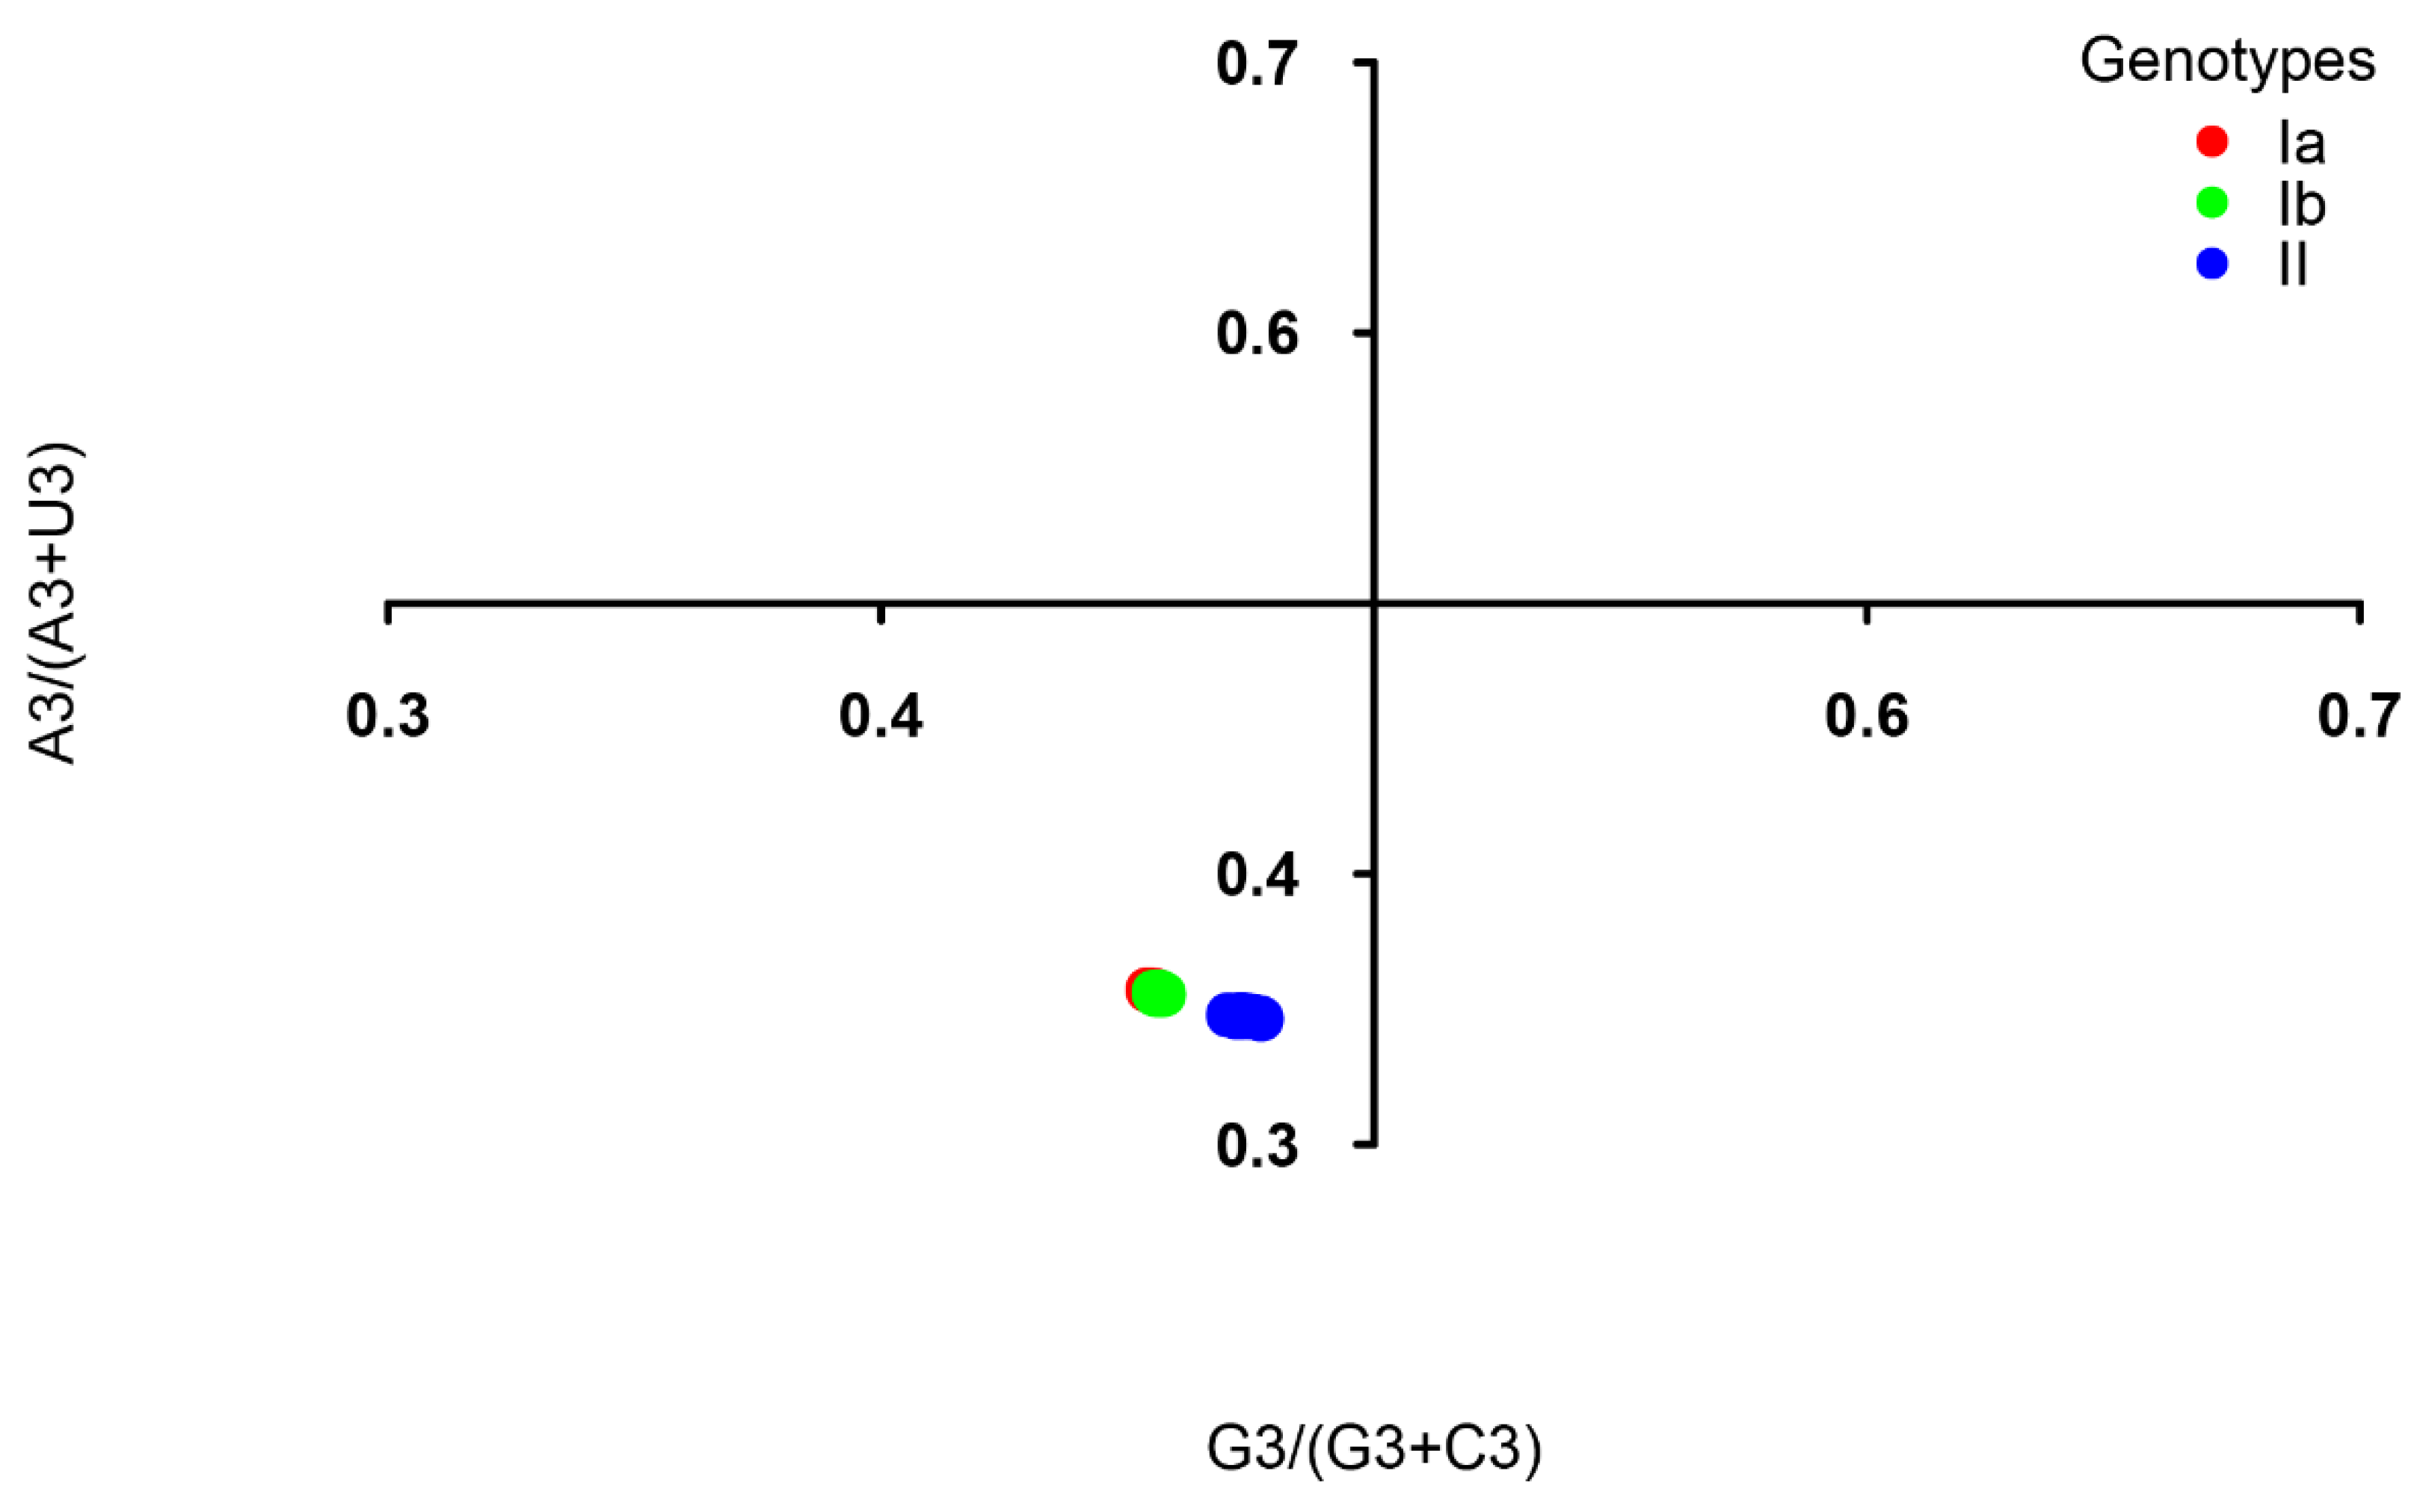
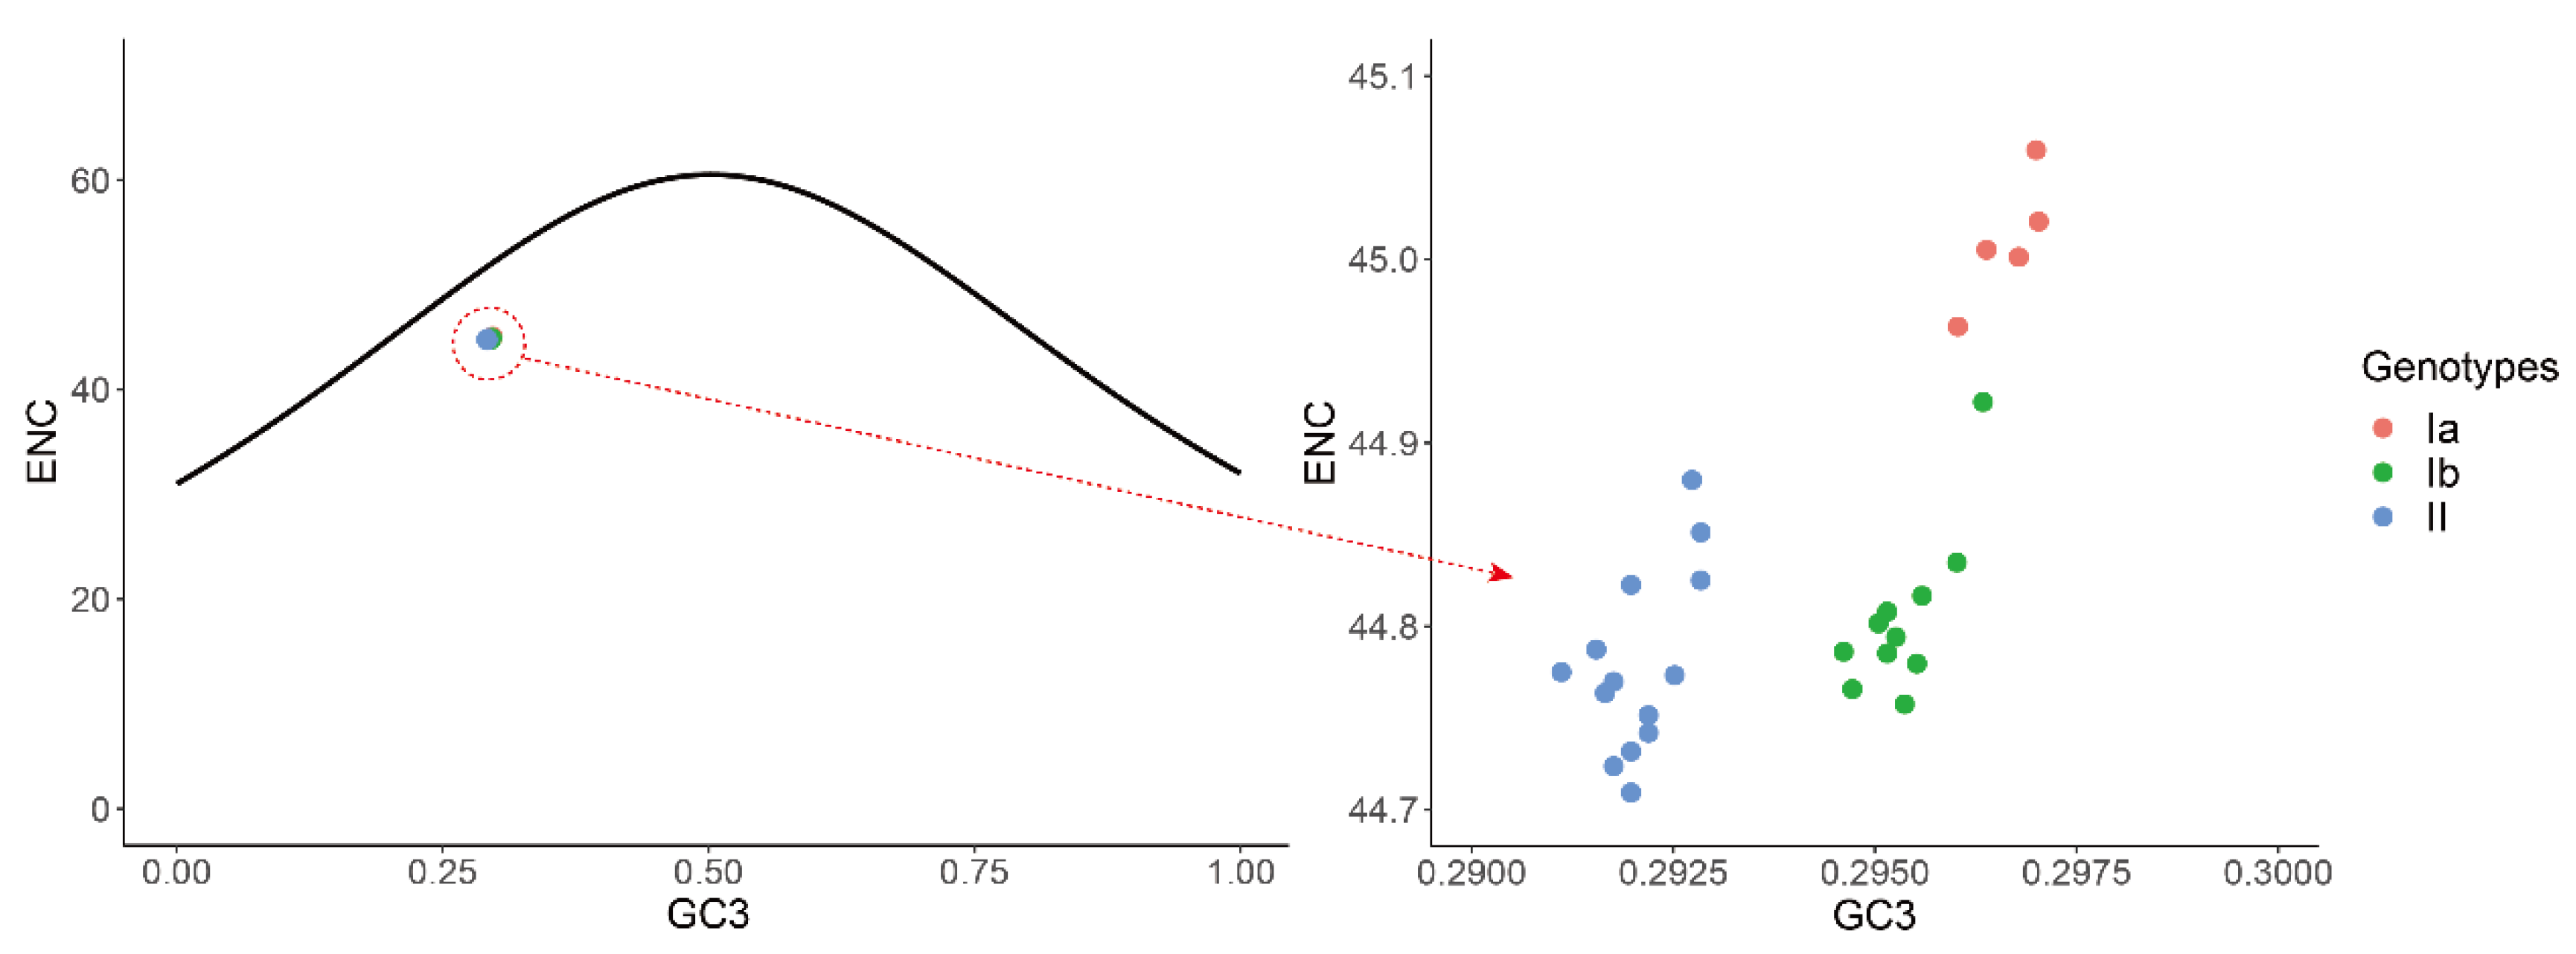
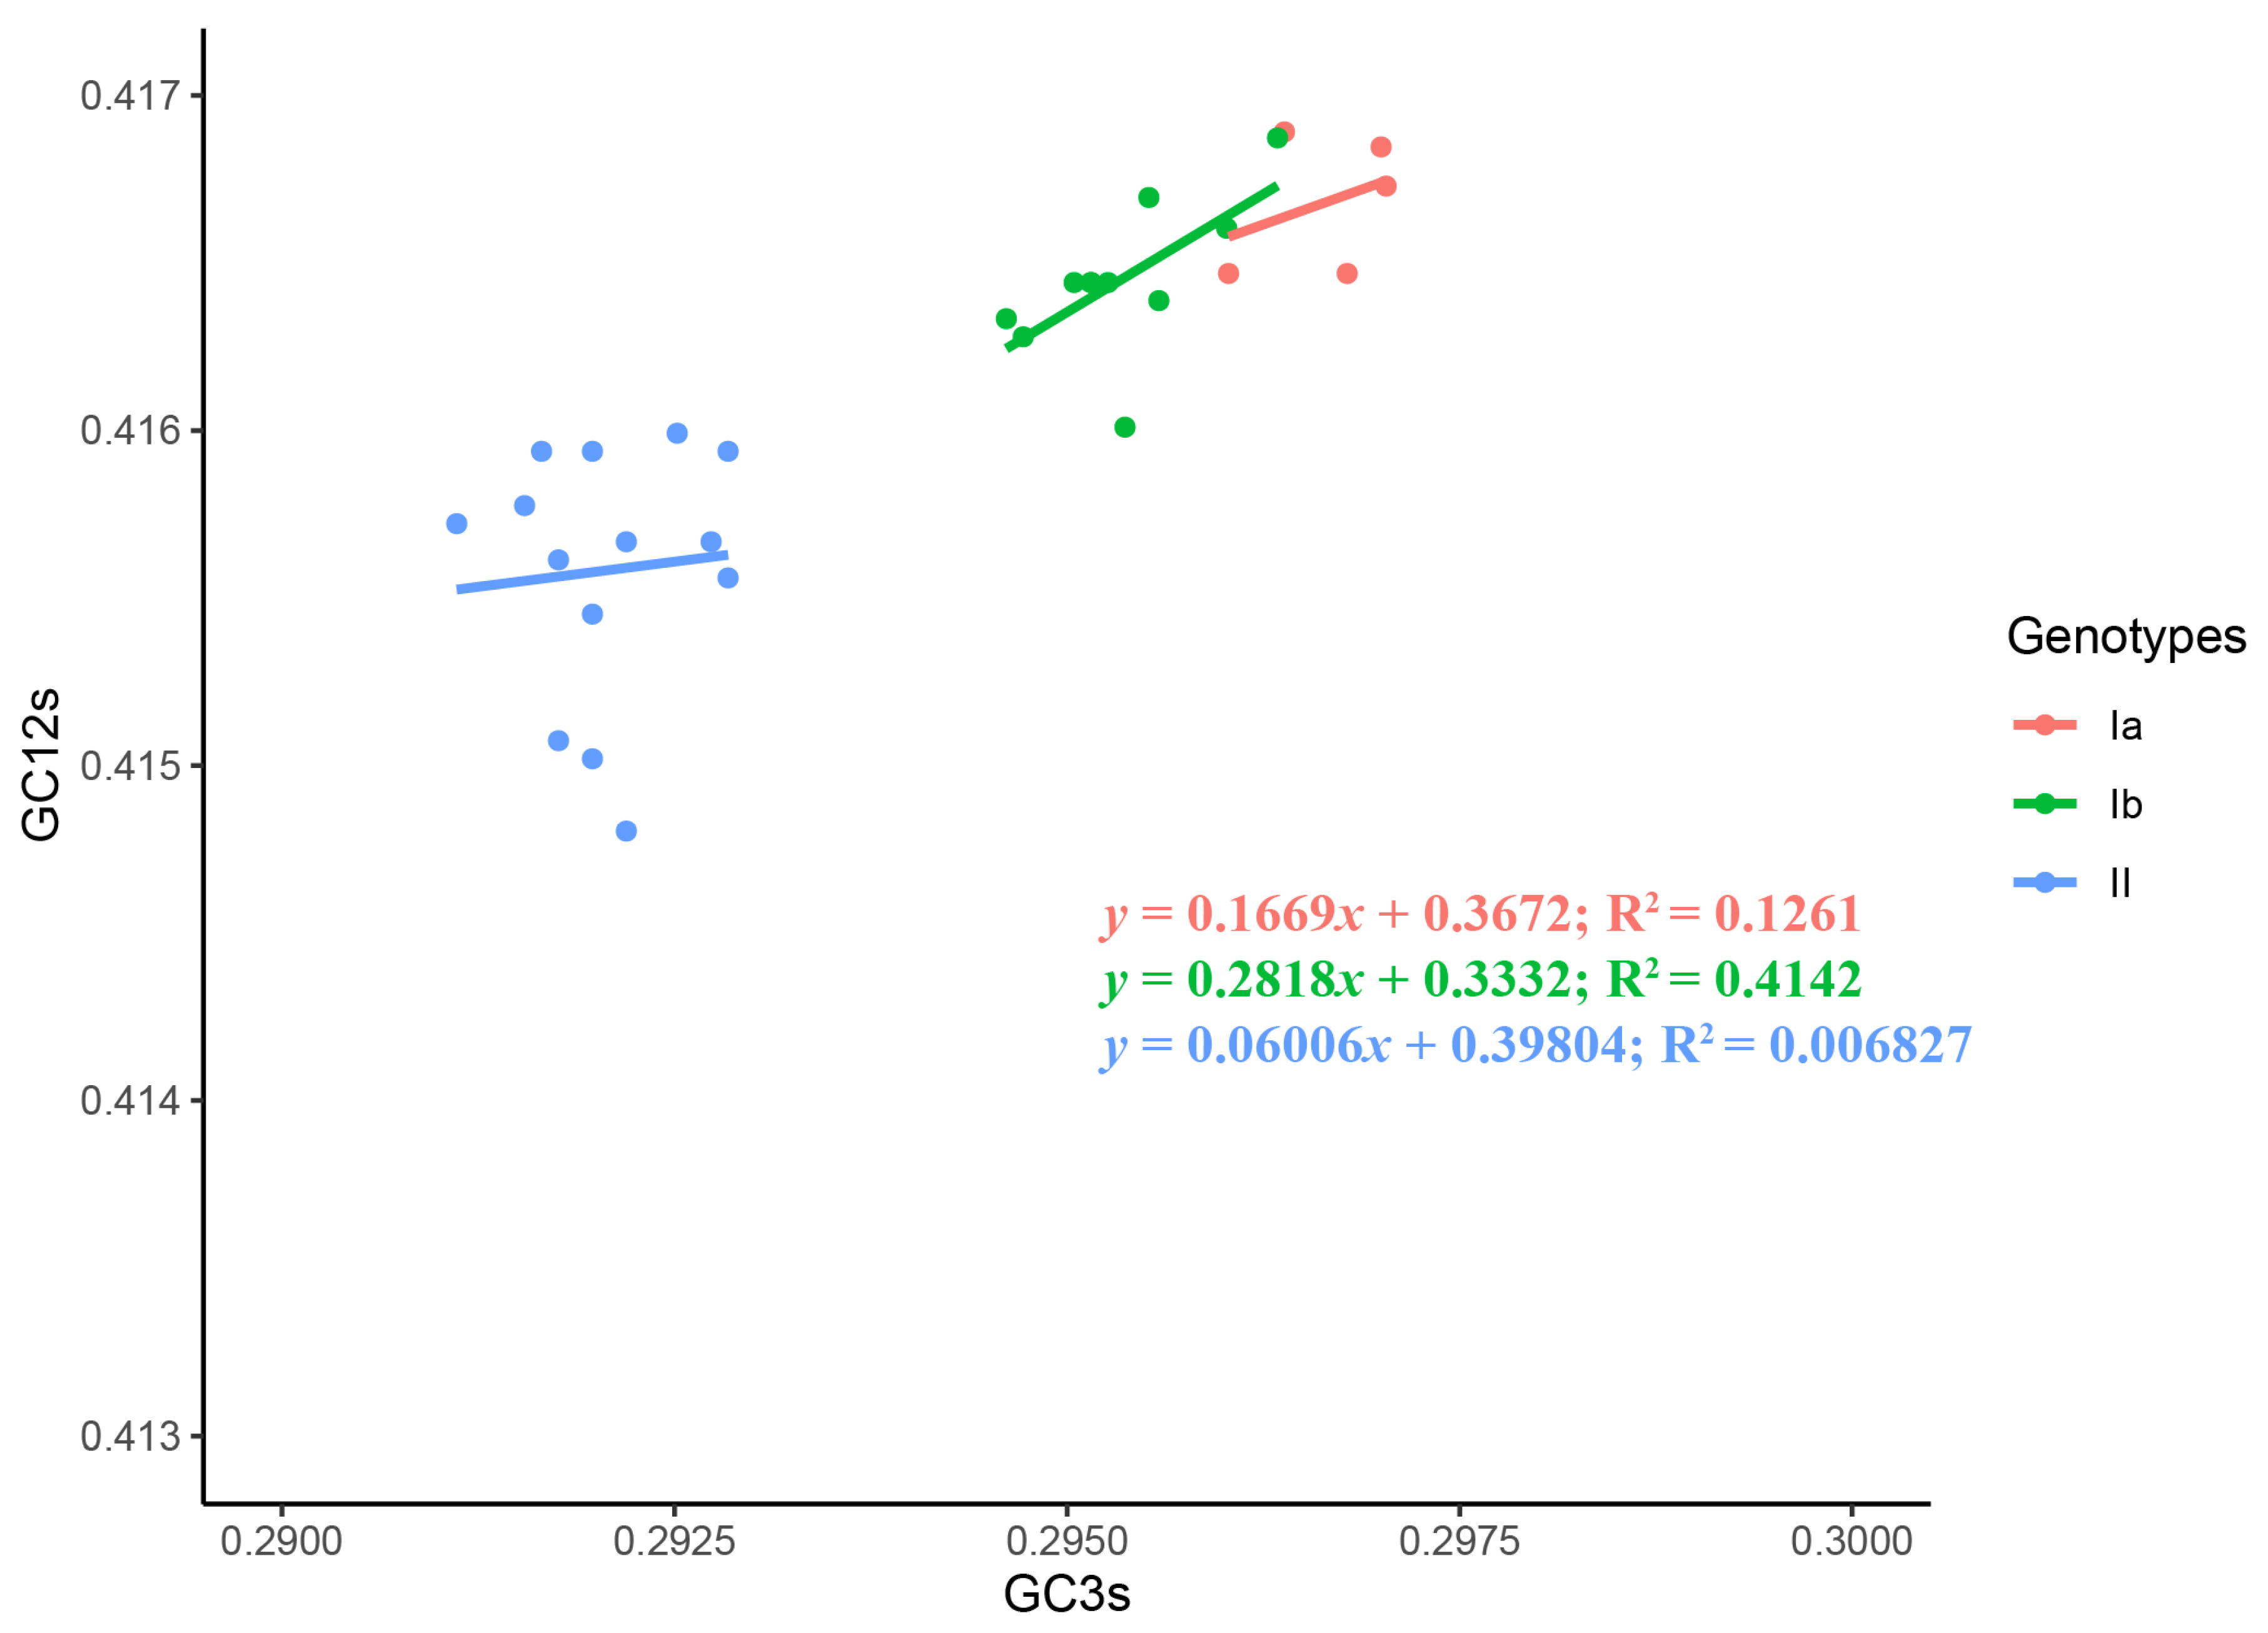
To investigate the force governing codon usage patterns of TGEV, analyses of Parity rule 2 (PR2) plot, ENC plot, and neutrality were carried out. The PR2 plot showed AU-bias and GC-bias at the third codon position (Figure 4), suggesting that both mutation and selection contribute to the codon usage bias of TGEV genomes. In the ENC-GC3 plot analysis, the points representing all of the TGEV strains were below the standard curve (Figure 5), indicating that, except for mutation pressure, other factors like natural selection play a major role in the codon usage bias of TGEV. Neutrality analysis revealed no significant correlation between GC12 and GC3 in genotypes Ia (R2 = 0.1261, p = 0.5576) and II (R2 = 0.006827, p = 0.7789), suggesting that natural selection totally drives the codon usage bias of genotypes Ia and II (Figure 6). In addition, a significant positive correlation was observed between GC12 and GC in genotype Ib (y = 0.2818x + 0.3332; R2 = 0.4142, p = 0.0326), showing that the influences of mutation pressure and natural selection on codon usage bias in genotype Ib were 28.18% and 71.82%, respectively.

2.6. Differences in Adaptation of Genotypes toward the Host

We explored the potential adaptation of the three clades to the host (pig). As shown in Figure 7, the mean codon adaptation index (CAI) values of genotypes Ia (0.6918 ± 0.0004) and Ib (0.6909 ± 0.0003) to the pig were significantly higher compared with the CAI value of genotype II (0.6896 ± 0.0005) (Figure 7). The relative codon deoptimization index (RCDI) analysis showed the mean RCDI value of genotype II (1.5454 ± 0.0017) to the pig was significantly higher as compared to genotypes Ia (1.5304 ± 0.0017) and Ib (1.5361 ± 0.0015) (Figure 7). The results of similarity index (SiD) analysis revealed that the mean SiD value of genotype Ia (0.1187 ± 0.0002) was statistically significantly lower compared with genotypes Ib (0.1203 ± 0.0002) and II (0.1206 ± 0.0004) (Figure 7). These results suggest that genotype I strains might be more adapted to their host (Sus scrofa) than genotype II strains.

3. Discussion

Phylogenetic analysis of the TGEV genomes revealed three distinct genotypes that are different than the previously reported traditional and variant lineages [21]. Analyses in the current study yielded a more accurate inference of the phylogeny because more methods were used and incomplete and recombinant genome sequences were excluded. Additionally, codon usage patterns of TGEV were categorized into three distinct groups based on the PCA of RSCU values, which were consistent with the well-supported genotypes Ia, Ib, and II of TGEV.
Analysis of nucleotide composition showed that nucleotide U was the most abundant in the CDS of the TGEV genome, and that the coding region and the third codon position of the TGEV genomes were A/U rich, but G/C poor, which is consistent with what has been found in porcine deltacoronavirus (PDCoV) [27] and porcine epidemic diarrhea virus (PEDV) [28] and in severe acute respiratory syndrome coronavirus 2 (SARS-CoV-2) [29]. TGEV genomes exhibited a moderate degree of codon usage bias (ENC = 44.827 ± 0.095) compared with PDCoV (52.63 ± 0.253) [27], PEDV (52.58 ± 11.24) [28], SARS-CoV-2 (48.54 ± 2.34) [30], Middle East respiratory syndrome coronavirus (MERS-CoV) (49.816 ± 0.08) [31], bovine coronavirus (BCoV) (43.78 ± 0.07) [32], and avian coronavirus infectious bronchitis virus (42.79 ± 2.25) [33]. ENC is usually used as an indicator of codon preference which is predominantly caused by under-/over-represented codons [34]. As evident from the RSCU analysis, more than half of the 59 codons were under-/over-represented in the TGEV genome. Specifically, it was noted that the preferred and over-represented codons of the TGEV genome were A/U-ended, while the most under-represented codons of the TGEV genome were G/C-ended. Overall, the peculiar compositional constraints (U and A in this case) may be the cause of codon usage bias in TGEV.
In the dinucleotide frequencies analysis of the TGEV genome, dinucleotides CpA and UpG were found to be over-represented, while the dinucleotide CpG was under-represented. The low-abundance of CpG is a genomic characteristic of positive-strand RNA viruses [35,36,37]. While over-representations of CpA and UpG are considered to be a consequence of CpG deficiency in virus genomes [37]. Notably, a prevailing influence of dinucleotides CpA and CpG on the codon usage of TGEV genome was observed, suggesting that dinucleotide bias influences codon bias of TGEV coding sequences.
To test whether GC content, nucleotide/dinucleotide frequencies, and codon usage bias were similar over the whole genome, a comprehensive comparison of these indexes of ORF1ab, spike, and TGEV complete CDS was performed. The similar patterns of the nucleotide contents, genomic properties, relative dinucleotide abundance, and RSCU were observed among ORF1ab, spike, and TGEV complete CDS. Besides, the over-represented ApC of spike, the under-represented UpA of ORF1ab, and the under-represented GpA of spike indicated the dinucleotide usage patterns were specific to a certain extent in the ORF1ab and spike.
Natural selection and mutation pressure are thought to be the two main factors driving codon usage patterns. Based on the results of the PR2 bias, ENC-GC3 plot, and neutrality analysis, the present study found that the codon biases of genotypes Ia and II were totally affected by natural selection, which is consistent with PEDV [28]. However, natural selection (71.82%) had a greater effect on codon usage than mutation pressure (28.18%) in genotype Ib of TGEV, which is consistent with PDCoV [27], MERS-CoV [38], SARSCoV [38], and SARS-CoV-2 [29,38]. These findings indicate that evolutionary forces driving the codon usage patterns in three genotypes of TGEV are different.
The CAI value is used to evaluate the adaptation of viral genes to the host [39]. In the CAI analysis of TGEV, genotypes Ia and Ib had higher CAI values than genotype II, suggesting a higher efficiency of protein expression in the host with genotypes Ia and Ib. Analyses of RCDI and SiD were also performed to further assess the adaptation of TGEV to the host pig. The RCDI was lower in genotypes Ia and Ib than in genotype II. Low RCDI values indicate better adaptation to the host, which is consistent with the high CAI values of genotypes Ia and Ib to the pig. Genotypes Ib and II had higher SiD values than genotype Ia, indicating that the pig might have induced stronger selection pressure on the CDS of genotypes Ib and II. The CAI, RCDI, and SiD analyses suggest that genotypes Ia and Ib might be more adapted to the host pig. These findings are consistent with a previous hypothesis that genotype II is significantly attenuated compared to genotype I of TGEV [21]. Further studies are needed to investigate the correlation between the translational efficiency, adaptation, and virulence in TGEV.
In summary, phylogenetic analysis revealed three distinct clades of TGEV strains. To our knowledge, these analyses are the first ones that reveal a moderate, but genotype-specific codon usage bias in the TGEV genome. Nucleotides (U and A) and dinucleotides (CpA and CpG) influence the codon preference of the TGEV genome. The codon usage bias of genotypes Ia and II is mainly affected by natural selection, whereas natural selection and mutational pressure emerged as a major and minor contributing factor for codon usage bias of genotype Ib, respectively. Theoretically, genotype I—including sub-genotypes Ia and Ib—may be more adapted to the pig than genotype II. Overall, this study provides insights for understanding the codon usage pattern and host adaptability of TGEV.

4. Materials and Methods

4.1. Sequence Data

The nucleotide sequences and features of the TGEV were obtained from those available up to July 2020 in the nucleotide database of National Center for Biotechnology Information (NCBI) (https://www.ncbi.nlm.nih.gov/nucleotide/). To produce high-quality genome annotations for a set of TGEV genome sequences, the CDSs for the nine genes (ORF1a, ORF1b, S, nsp3a, nsp3b, E, M, N, and nsp7) of TGEV were manually curated. Only the genome sequences with the complete CDSs of nine genes were retained for further analysis. The CDS of each TGEV genome was concatenated into a single super CDS with the following order: ORF1a-ORF1b-S-nsp3a-nsp3b-E-M-N-nsp7. The whole genome (n = 32), ORF1ab gene (n = 32), spike gene (n = 53), and the partial spike gene (first 1383 nt) (n = 58) used in this study were manually curated. The detailed sequence information—including accession number, strain name, location, and isolation year—are displayed in Supplementary Materials (Table S1).

4.2. Recombination Detection and Phylogenetic Analysis

To avoid the influence of recombination in shaping the phylogenetic tree, recombination detections for a total of 32 TGEV genome sequences were carried out. The CDSs were aligned with MACSE (version 2.03) [40]. The possible recombination events of TGEV were detected using the Recombination Detection Program (RDP, version 4.100) [41] with the default settings. Seven detection methods—including RDP, GENECONV, BootScan, MaxChi, Chimaera, SiScan, and 3Seq—were implemented in the RDP software (version 4.100) [41]. In order to avoid false positives, only results supported (Bonferroni-corrected p < 1 × 10⁻⁶) by at least four different methods were considered to be credible recombination events. After removing the recombinant sequences from the dataset, alignment and recombination detection was repeated for the remaining genome sequences until there were no recombination signals.
Non-recombinant genome sequences and the partial spike gene sequences (first 1383 nt) were aligned with MACSE (version 2.03) [40] using the BLOSUM62 scoring matrix, respectively. The jModelTest (version 2.1.10) [42] was used to estimate the appropriate nucleotide substitution model based on the corrected Akaike’s information criterion (AICc). The general time-reversible (GTR) model with gamma-distributed evolutionary rates (G) and invariable sites (I) (GTR + G + I) was chosen as the best fitting evolutionary model of TGEV genome evolution, while GTR + G model was identified as the best-fit model of partial spike gene evolution. Phylogenetic inferences were performed by maximum likelihood (ML) implemented in RAxML (version 8.2.12) [43], and by Bayesian inference (BI) implemented in MrBayes (version 3.2.7a) [44]. In the ML analysis, the node support was assessed by performing a 10,000 rapid bootstrap analysis. In the BI analysis, the Markov chain Monte Carlo (MCMC) search was conducted for 10,000,000 generations, and four chains (one cold, and three heated) sampling was carried out every 1000 generations. Tracer (version 1.7) [45] was used to check the trace files and ensure that the chains had reached convergence, which was assessed from the effective sample size (ESS) after a 10% burn-in. The first 25% of trees was discarded as burn-in and the posterior probabilities were estimated for each node. The phylogenetic trees were viewed in FigTree (version 1.4.4) (http://tree.bio.ed.ac.uk/software/figtree/). Nucleotide pairwise p-distances between three sister clades were calculated using MEGA X [46].

4.3. Compositional Properties and Principal Parameters Analysis

The contents of four constituent mononucleotides (A, U, C, and G), GC contents at the first (GC1s), second (GC2s), third (GC3s) codon positions, mean contents (GC12s) of GC1s and GC2s, and the contents of nucleotide compositions at the 3rd codon positions (A3, T3, G3, C3) were calculated using the Seqinr package (version 3.6-1) [47] of R (version 3.6.2) [48].

4.4. Relative Synonymous Codon Usage

RSCU quantifies the relative usage of a synonymous codon excluding the influence of amino acid composition and sequence length [49]. The RSCU values of codons in each TGEV strains were calculated according to the formula below (1) [50]
R S C U = g i j j n i g i j n i
where gij is the observed number of the ith codon for jth amino acid, which has ni type of synonymous codons. The synonymous codon with an RSCU value more than 1.0 indicates a positive codon usage bias, while an RSCU value < 1.0 indicates a negative codon usage bias. A codon with an RSCU value = 1.0 indicates that the codon was chosen equally and randomly. A codon with an RSCU value > 1.6 (or <0.6) is considered to be have an over-represented (or under-represented) relative abundance compared with a random association of codon [51]. The RSCU values of 59 codons (excluding AUG[Met], UGG[Trp], and three stop codons) were calculated using the Seqinr package (version 3.6-1) [47] of R (version 3.6.2) [48].

4.5. Principal Component Analysis

PCA is a multivariate statistical method that reduces the dimensionality and extracts a feature from original data [52]. To determine the trends of codon usage among the different TGEV strains, PCA using a 30 × 59 matrix constructed with 59-dimensional vectors of RSCU values was carried out for each codon and 30 rows of TGEV strains. PCA was done using the Factoextra package (version 1.0.6) [53] of R (version 3.6.2) [48].

4.6. Relative Dinucleotide Abundance Analysis

Relative dinucleotide abundance is defined as the ratio of observed to expected dinucleotide frequency. The relative abundances of 16 dinucleotides were calculated as (2)
P x y = f x y f x f y
where fx, fy, and fxy represent the frequency of nucleotide X, the frequency of nucleotide Y, and the observed frequency of the dinucleotide XY, respectively. When Pxy > 1.23 (or <0.78), the dinucleotide XY is considered to be over-represented (or under-represented).

4.7. Effective Number of Codons Analysis

ENC is used to measure the degree of deviation between codon usage and random selection. The value range of ENC is between 20 and 61 [34]. The smaller the ENC value, the stronger the codon usage bias. The ENC values were calculated as (3)
ENC = 2 + 9 F ¯ 2 + 1 F ¯ 3 + 5 F ¯ 4 + 3 F ¯ 6
where Fi (i = 2, 3, 4, 6) represents the average of Fi in the i-fold degenerate codon family. The value of Fi was calculated using the formula (4)
F ¯ i = n j = 1 i ( n j n ) 2 1 n 1
where n is the observed number of used codons; i is the number of synonymous codons; and nj is the observed number of jth codon. The ENC values were calculated using the coRdon package (version 1.4.0) [54] of R (version 3.6.2) [48].

4.8. ENC-Plot Analysis

ENC-plot describes the relationship between GC3 values and ENC values and provides a method to investigate the factors affecting codon bias. The expected ENC values represent the expected codon usage, which is only influenced by GC3 values. The expected ENC value was calculated according to the formula (5)
E N C e x p e c t e d = 2 + s + 29 s 2 + ( 1 s ) 2
where s is the frequency of GC3.
If the point representing the observed ENC value lies on the expected curve, this indicates that the codon usage of sequence is only influenced by mutation pressure. However, if the point falls below the expected curve, this means that the codon usage bias is influenced by natural pressure.

4.9. Parity Rule 2 Analysis

Parity rule 2 (PR2) analysis is used to evaluate the possible function of mutation and selection on codon usage. In the PR2 plot, the GC-bias [G3/(G3 + C3)] at the third codon position and the AU-bias [A3/(A3 + U3)] at the third codon position is the abscissa and ordinate, respectively. The origin point (0.5, 0.5) indicates no bias between the influence of the mutation and selection [55,56].

4.10. Neutrality Analysis

Neutral analysis is used to quantitatively measure the impact of mutation and selection on codon usage bias [57]. In the neutrality plot, GC3 and GC12 are used as the horizontal coordinate and the vertical coordinate, respectively. The GC3 and GC12 contents of the genome CDSs of TGEV strains were plotted to create a scatterplot, and the relation between GC3 and GC12 was determined by the fitted regression line using R (version 3.6.2) [48]. In the neutrality analysis, if the slope of regression line is statistically significant (the closer the slope is to 1), the influence of mutation on codon usage bias is greater [57]. If the slope = 0 or the slope is not statistically significant, the codon usage bias is totally determined by natural selection [57].

4.11. Codon Adaptation Index Analysis

To evaluate the adaptation of the genome CDSs of TGEV strains to host, CAI was calculated using the CAIcal (version 1.4) [58]. The range of CAI is between 0 and 1. Theoretically, the higher the CAI of a sequence, the better the adaptability to the host [39]. The codon usage table of the pig (Sus scrofa) was obtained from the Codon and Codon Pair Usage Tables (CoCoPUTs) database [59].

4.12. Relative Codon Deoptimization Index Analysis

RCDI can be used to compare the similarity of codon usage between virus and host. An RCDI close to 1 indicates a better adaptation of the virus to the host [24], whereas an RCDI higher than 1 indicates that the virus is less adaptable to the host [60]. RCDIs of the TGEV sequences were calculated using the CAIcal (version 1.4) [58].

4.13. Similarity Index Analysis

SiD was constructed to estimate the effects of the host on the codon usage of the pathogen [61] and was calculated as (6) and (7) [62]
R ( A , B ) = i = 1 59 a i × b i i = 1 59 a i 2 × i = 1 59 b i 2
D ( A , B ) = 1 R ( A , B ) 2
where ai is defined as the RSCU value of the synonymous codon of the virus coding sequence and bi represents the RSCU value of the same codon of the host. D (A, B) is the SiD value, which represents the potential influence of the host on the virus. The higher the SiD value, the greater the influence of the host on the virus codon.

4.14. Statistical Analysis

Since the values of CAI, RCDI, and SiD were not normally distributed and the variances of the three genotypes were unequal, the non-parametric Kruskal–Wallis test followed by Dunn multiple comparison posthoc analysis were used. p-values of multiple comparisons were corrected using the Bonferroni method. A p-value < 0.05 was used as the cut-off criterion for statistical significance. The statistical analysis was performed using the dunn.test (version 1.3.5) [63] of R (version 3.6.2) [48].

Supplementary Materials

Supplementary Materials can be found at https://www.mdpi.com/1422-0067/21/21/7898/s1. Figure S1: Recombination analysis of TGEV strains. Figure S2: Phylogenetic trees of the partial spike gene of TGEV. Figure S3: PCA scree plot based on the RSCU values of TGEV complete CDS. Figure S4: The variable correlation plots of PCA. Table S1: The detailed information of TGEV strains used in this study. Table S2: The nucleotide contents and properties of TGEV complete CDS. Table S3: Comparison of nucleotide contents and properties of the ORF1ab gene, spike gene, and TGEV genome complete CDS. Table S4: Comparison of synonymous codon usage of the ORF1ab gene, spike gene, and TGEV genome complete CDS. Table S5: Relative dinucleotide abundance of TGEV complete CDS. Table S6: Comparison of relative dinucleotide abundance of the ORF1ab gene, spike gene, and TGEV genome complete CDS.

Author Contributions

Data curation, S.C.; Formal analysis, H.W.; Writing—original draft preparation, S.C. and H.W.; Writing—review and editing, H.W. and Z.C.; Supervision, H.W. and Z.C.; Project administration, Z.C.; Funding acquisition, H.W. and Z.C. All authors have read and agreed to the published version of the manuscript.

Funding

This research was funded by National Key Research and Development Program of China, grant no. 2017YFD0500104 to Z.C.; Priority Academic Program Development of Jiangsu Higher Education Institutions, grant ‘PAPD’ to Z.C.; National Natural Science Foundation of China, grant no. 31660648 to H.W.

Acknowledgments

This research was supported by the High-Performance Computing Cluster of College of Veterinary Medicine, Yangzhou University.

Conflicts of Interest

The authors declare no conflict of interest. The funders had no role in the design of the study; in the collection, analyses, or interpretation of data; in the writing of the manuscript, or in the decision to publish the results.

References

  1. Wang, L.; Qiao, X.; Zhang, S.; Qin, Y.; Guo, T.; Hao, Z.; Sun, L.; Wang, X.; Wang, Y.; Jiang, Y. Porcine transmissible gastroenteritis virus nonstructural protein 2 contributes to inflammation via NF-κB activation. Virulence 2018, 9, 1685–1698. [Google Scholar] [CrossRef] [PubMed] [Green Version]
  2. Woods, R.D. Efficacy of a transmissible gastroenteritis coronavirus with an altered ORF-3 gene. Can. J. Vet. Res. 2001, 65, 28–32. [Google Scholar] [PubMed]
  3. Doyle, L.; Hutchings, L. A transmissible gastroenteritis in pigs. J. Am. Vet. Med. Assoc. 1946, 108, 257–259. [Google Scholar] [PubMed]
  4. Pritchard, C.; Paton, D.; Wibberley, G.; Ibata, G. Transmissible gastroenteritis and porcine epidemic diarrhoea in Britain. Vet. Rec. 1999, 144, 616–618. [Google Scholar] [CrossRef]
  5. Williams, R.; Esterhuysen, J.; Robinson, J. Pseudorabies and transmissible gastroenteritis: A serological survey in South Africa. Onderstepoort J. Vet. Rec. 1994, 61, 67–70. [Google Scholar]
  6. Cubero, M.; Leon, L.; Contreras, A.; Astorga, R.; Lanza, I.; Garcia, A. Transmissible gastroenteritis in pigs in south east Spain: Prevalence and factors associated with infection. Vet. Rec. 1993, 132, 238–241. [Google Scholar] [CrossRef]
  7. Hu, X.; Li, N.; Tian, Z.; Yin, X.; Qu, L.; Qu, J. Molecular characterization and phylogenetic analysis of transmissible gastroenteritis virus HX strain isolated from China. BMC Vet. Res. 2015, 11, 72. [Google Scholar] [CrossRef] [Green Version]
  8. Takahashi, K.; Okada, K.; Ohshima, K. An outbreak of swine diarrhea of a new-type associated with coronavirus-like particles in Japan. Jpn. J. Vet. Sci. 1983, 45, 829–832. [Google Scholar] [CrossRef] [Green Version]
  9. Hou, Y.; Yue, X.; Cai, X.; Wang, S.; Liu, Y.; Yuan, C.; Cui, L.; Hua, X.; Yang, Z. Complete genome of transmissible gastroenteritis virus AYU strain isolated in Shanghai, China. J. Virol. 2012, 86, 11935. [Google Scholar] [CrossRef] [Green Version]
  10. Hu, W.; Yu, Q.; Zhu, L.; Liu, H.; Zhao, S.; Gao, Q.; He, K.; Yang, Q. Complete genomic sequence of the coronavirus transmissible gastroenteritis virus SHXB isolated in China. Arch. Virol. 2014, 159, 2295–2302. [Google Scholar] [CrossRef] [Green Version]
  11. Laude, H.; Rasschaert, D.; Delmas, B.; Godet, M.; Gelfi, J.; Charley, B. Molecular biology of transmissible gastroenteritis virus. Vet. Microbiol. 1990, 23, 147–154. [Google Scholar] [CrossRef]
  12. Yount, B.; Curtis, K.M.; Baric, R.S. Strategy for systematic assembly of large RNA and DNA genomes: Transmissible gastroenteritis virus model. J. Virol. 2000, 74, 10600–10611. [Google Scholar] [CrossRef] [PubMed] [Green Version]
  13. Eleouet, J.-F.; Rasschaert, D.; Lambert, P.; Levy, L.; Vende, P.; Laude, H. Complete sequence (20 kilobases) of the polyprotein-encoding gene 1 of transmissible gastroenteritis virus. Virology 1995, 206, 817–822. [Google Scholar] [CrossRef] [PubMed] [Green Version]
  14. Brian, D.; Baric, R. Coronavirus genome structure and replication. In Coronavirus Replication and Reverse Genetics; Springer: Berlin/Heidelberg, Germany, 2005; pp. 1–30. [Google Scholar]
  15. Heald-Sargent, T.; Gallagher, T. Ready, set, fuse! The coronavirus spike protein and acquisition of fusion competence. Viruses 2012, 4, 557–580. [Google Scholar] [CrossRef] [PubMed] [Green Version]
  16. Li, F. Structure, function, and evolution of coronavirus spike proteins. Annu. Rev. Virol. 2016, 3, 237–261. [Google Scholar] [CrossRef] [PubMed] [Green Version]
  17. Delmas, B.; Rasschaert, D.; Godet, M.; Gelfi, J.; Laude, H. Four major antigenic sites of the coronavirus transmissible gastroenteritis virus are located on the amino-terminal half of spike glycoprotein S. J. Gen. Virol. 1990, 71, 1313–1323. [Google Scholar] [CrossRef] [PubMed]
  18. Ballesteros, M.; Sanchez, C.; Enjuanes, L. Two amino acid changes at the N-terminus of transmissible gastroenteritis coronavirus spike protein result in the loss of enteric tropism. Virology 1997, 227, 378–388. [Google Scholar] [CrossRef] [Green Version]
  19. Sánchez, C.M.; Izeta, A.; Sánchez-Morgado, J.M.; Alonso, S.; Sola, I.; Balasch, M.; Plana-Durán, J.; Enjuanes, L. Targeted recombination demonstrates that the spike gene of transmissible gastroenteritis coronavirus is a determinant of its enteric tropism and virulence. J. Virol. 1999, 73, 7607–7618. [Google Scholar] [CrossRef] [Green Version]
  20. Tung, F.Y.; Abraham, S.; Sethna, M.; Hung, S.-L.; Sethna, P.; Hogue, B.G.; Brian, D.A. The 9-kDa hydrophobic protein encoded at the 3′ end of the porcine transmissible gastroenteritis coronavirus genome is membrane-associated. Virology 1992, 186, 676–683. [Google Scholar] [CrossRef]
  21. Chen, F.; Knutson, T.P.; Rossow, S.; Saif, L.J.; Marthaler, D.G. Decline of transmissible gastroenteritis virus and its complex evolutionary relationship with porcine respiratory coronavirus in the United States. Sci. Rep. 2019, 9, 3953. [Google Scholar] [CrossRef] [Green Version]
  22. Pan, S.; Mou, C.; Wu, H.; Chen, Z. Phylogenetic and codon usage analysis of atypical porcine pestivirus (APPV). Virulence 2020, 11, 916–926. [Google Scholar] [CrossRef] [PubMed]
  23. Gustafsson, C.; Govindarajan, S.; Minshull, J. Codon bias and heterologous protein expression. Trends Biotechnol. 2004, 22, 346–353. [Google Scholar] [CrossRef] [PubMed]
  24. Mueller, S.; Papamichail, D.; Coleman, J.R.; Skiena, S.; Wimmer, E. Reduction of the Rate of Poliovirus Protein Synthesis through Large-Scale Codon Deoptimization Causes Attenuation of Viral Virulence by Lowering Specific Infectivity. J. Virol. 2006, 80, 9687–9696. [Google Scholar] [CrossRef] [Green Version]
  25. Lauring, A.S.; Acevedo, A.; Cooper, S.B.; Andino, R. Codon usage determines the mutational robustness, evolutionary capacity, and virulence of an RNA virus. Cell Host Microbe 2012, 12, 623–632. [Google Scholar] [CrossRef] [Green Version]
  26. Costafreda, M.I.; Pérez-Rodriguez, F.J.; D’Andrea, L.; Guix, S.; Ribes, E.; Bosch, A.; Pintó, R.M. Hepatitis A virus adaptation to cellular shutoff is driven by dynamic adjustments of codon usage and results in the selection of populations with altered capsids. J. Virol. 2014, 88, 5029–5041. [Google Scholar] [CrossRef] [Green Version]
  27. He, W.; Wang, N.; Tan, J.; Wang, R.; Yang, Y.; Li, G.; Guan, H.; Zheng, Y.; Shi, X.; Ye, R. Comprehensive codon usage analysis of porcine deltacoronavirus. Mol. Phylogenet. Evol. 2019, 141, 106618. [Google Scholar] [CrossRef]
  28. Cao, H.; Zhang, H. Synonymous Codon Usage Bias in Porcine Epidemic Diarrhea Virus. Isr. J. Vet. Med. 2013, 68, 185–189. [Google Scholar]
  29. Dutta, R.; Buragohain, L.; Borah, P. Analysis of codon usage of Severe Acute Respiratory Syndrome Corona Virus 2 (SARS-CoV-2) and its adaptability in dog. Virus Res. 2020, 198113. [Google Scholar] [CrossRef]
  30. Tort, F.L.; Castells, M.; Cristina, J. A comprehensive analysis of genome composition and codon usage patterns of emerging coronaviruses. Virus Res. 2020, 197976. [Google Scholar] [CrossRef]
  31. Chen, Y.; Xu, Q.; Yuan, X.; Li, X.; Zhu, T.; Ma, Y.; Chen, J.-L. Analysis of the codon usage pattern in Middle East Respiratory Syndrome Coronavirus. Oncotarget 2017, 8, 110337. [Google Scholar] [CrossRef] [PubMed] [Green Version]
  32. Castells, M.; Victoria, M.; Colina, R.; Musto, H.; Cristina, J. Genome-wide analysis of codon usage bias in Bovine Coronavirus. Virol. J. 2017, 14, 115. [Google Scholar] [CrossRef] [Green Version]
  33. Brandão, P.E. Avian coronavirus spike glycoprotein ectodomain shows a low codon adaptation to Gallus gallus with virus-exclusive codons in strategic amino acids positions. J. Mol. Evol. 2012, 75, 19–24. [Google Scholar] [CrossRef] [PubMed] [Green Version]
  34. Wright, F. The ‘effective number of codons’ used in a gene. Gene 1990, 87, 23–29. [Google Scholar] [CrossRef]
  35. Cheng, X.; Virk, N.; Chen, W.; Ji, S.; Ji, S.; Sun, Y.; Wu, X. CpG usage in RNA viruses: Data and hypotheses. PLoS ONE 2013, 8, e74109. [Google Scholar] [CrossRef] [Green Version]
  36. Di Giallonardo, F.; Schlub, T.E.; Shi, M.; Holmes, E.C. Dinucleotide composition in animal RNA viruses is shaped more by virus family than by host species. J. Virol. 2017, 91, e02381-16. [Google Scholar] [CrossRef] [Green Version]
  37. Rima, B.K.; McFerran, N.V. Dinucleotide and stop codon frequencies in single-stranded RNA viruses. J. Gen. Virol. 1997, 78, 2859–2870. [Google Scholar] [CrossRef]
  38. Nambou, K.; Anakpa, M. Deciphering the co-adaptation of codon usage between respiratory coronaviruses and their human host uncovers candidate therapeutics for COVID-19. Infect. Genet. Evol. 2020, 85, 104471. [Google Scholar] [CrossRef] [PubMed]
  39. Sharp, P.M.; Li, W.-H. The codon adaptation index-a measure of directional synonymous codon usage bias, and its potential applications. Nucleic Acids Res. 1987, 15, 1281–1295. [Google Scholar] [CrossRef] [PubMed] [Green Version]
  40. Ranwez, V.; Douzery, E.J.; Cambon, C.; Chantret, N.; Delsuc, F. MACSE v2: Toolkit for the alignment of coding sequences accounting for frameshifts and stop codons. Mol. Biol. Evol. 2018, 35, 2582–2584. [Google Scholar] [CrossRef]
  41. Martin, D.P.; Murrell, B.; Golden, M.; Khoosal, A.; Muhire, B. RDP4: Detection and analysis of recombination patterns in virus genomes. Virus Evol. 2015, 1, vev003. [Google Scholar] [CrossRef] [Green Version]
  42. Darriba, D.; Taboada, G.L.; Doallo, R.; Posada, D. jModelTest 2: More models, new heuristics and parallel computing. Nat. Methods 2012, 9, 772. [Google Scholar] [CrossRef] [Green Version]
  43. Stamatakis, A. RAxML version 8: A tool for phylogenetic analysis and post-analysis of large phylogenies. Bioinformatics 2014, 30, 1312–1313. [Google Scholar] [CrossRef] [PubMed]
  44. Ronquist, F.; Teslenko, M.; Van Der Mark, P.; Ayres, D.L.; Darling, A.; Höhna, S.; Larget, B.; Liu, L.; Suchard, M.A.; Huelsenbeck, J.P. MrBayes 3.2: Efficient Bayesian phylogenetic inference and model choice across a large model space. Syst. Biol. 2012, 61, 539–542. [Google Scholar] [CrossRef] [Green Version]
  45. Rambaut, A.; Drummond, A.J.; Xie, D.; Baele, G.; Suchard, M.A. Posterior summarization in Bayesian phylogenetics using Tracer 1.7. Syst. Biol. 2018, 67, 901. [Google Scholar] [CrossRef] [PubMed] [Green Version]
  46. Kumar, S.; Stecher, G.; Li, M.; Knyaz, C.; Tamura, K. MEGA X: Molecular evolutionary genetics analysis across computing platforms. Mol. Biol. Evol. 2018, 35, 1547–1549. [Google Scholar] [CrossRef]
  47. Charif, D.; Lobry, J.R. SeqinR 1.0-2: A contributed package to the R project for statistical computing devoted to biological sequences retrieval and analysis. In Structural Approaches to Sequence Evolution; Springer: Berlin/Heidelberg, Germany, 2007; pp. 207–232. [Google Scholar]
  48. R Core Team. R: A Language and Environment for Statistical Computing; R Foundation for Statistical Computing: Vienna, Austria, 2019; Available online: https://www.R-project.org/ (accessed on 24 October 2020).
  49. Sharp, P.M.; Li, W.-H. An evolutionary perspective on synonymous codon usage in unicellular organisms. J. Mol. Evol. 1986, 24, 28–38. [Google Scholar] [CrossRef]
  50. Sharp, P.M.; Tuohy, T.M.; Mosurski, K.R. Codon usage in yeast: Cluster analysis clearly differentiates highly and lowly expressed genes. Nucleic Acids Res. 1986, 14, 5125–5143. [Google Scholar] [CrossRef] [PubMed]
  51. Wong, E.H.; Smith, D.K.; Rabadan, R.; Peiris, M.; Poon, L.L. Codon usage bias and the evolution of influenza A viruses. Codon Usage Biases of Influenza Virus. BMC Evol. Biol. 2010, 10, 253. [Google Scholar] [CrossRef] [Green Version]
  52. Wold, S.; Esbensen, K.; Geladi, P. Principal component analysis. Chemom. Intell. Lab. Syst. 1987, 2, 37–52. [Google Scholar] [CrossRef]
  53. Kassambara, A.; Mundt, F. Factoextra: Extract and Visualize the Results of Multivariate Data Analyses. R Package Version 1.0.6. 2017. Available online: https://github.com/kassambara/factoextra (accessed on 24 October 2020).
  54. Elek, A.; Kuzman, M.; Vlahoviček, K. coRdon: Codon Usage Analysis and Prediction of Gene Expressivity. R Package Version 1.4.0. 2019. Available online: https://github.com/BioinfoHR/coRdon (accessed on 24 October 2020).
  55. Sueoka, N. Intrastrand parity rules of DNA base composition and usage biases of synonymous codons. J. Mol. Evol. 1995, 40, 318–325. [Google Scholar] [CrossRef]
  56. Sueoka, N. Translation-coupled violation of Parity Rule 2 in human genes is not the cause of heterogeneity of the DNA G+ C content of third codon position. Gene 1999, 238, 53–58. [Google Scholar] [CrossRef]
  57. Sueoka, N. Directional mutation pressure and neutral molecular evolution. Proc. Natl. Acad. Sci. USA 1988, 85, 2653–2657. [Google Scholar] [CrossRef] [Green Version]
  58. Puigbò, P.; Bravo, I.G.; Garcia-Vallve, S. CAIcal: A combined set of tools to assess codon usage adaptation. Biol. Direct 2008, 3, 38. [Google Scholar] [CrossRef] [PubMed] [Green Version]
  59. Athey, J.; Alexaki, A.; Osipova, E.; Rostovtsev, A.; Santana-Quintero, L.V.; Katneni, U.; Simonyan, V.; Kimchi-Sarfaty, C. A new and updated resource for codon usage tables. BMC Bioinform. 2017, 18, 391. [Google Scholar] [CrossRef] [PubMed] [Green Version]
  60. Butt, A.M.; Nasrullah, I.; Qamar, R.; Tong, Y. Evolution of codon usage in Zika virus genomes is host and vector specific. Emerg. Microbes Infect. 2016, 5, 1–14. [Google Scholar] [CrossRef] [Green Version]
  61. Khandia, R.; Singhal, S.; Kumar, U.; Ansari, A.I.; Tiwari, R.; Dhama, K.; Das, J.; Munjal, A.; Singh, R.K. Analysis of Nipah virus codon usage and adaptation to hosts. Front. Microbiol. 2019, 10, 886. [Google Scholar] [CrossRef] [Green Version]
  62. Zhou, J.; Zhang, J.; Sun, D.; Ma, Q.; Chen, H.; Ma, L.; Ding, Y.; Liu, Y. The distribution of synonymous codon choice in the translation initiation region of dengue virus. PLoS ONE 2013, 8, e77239. [Google Scholar] [CrossRef]
  63. Dinno, A. Dunn. Test: Dunn’s Test of Multiple Comparisons Using Rank Sums. R Package Version 1.3.5. 2017. Available online: https://CRAN.R-project.org/package=dunn.test (accessed on 24 October 2020).
Figure 1. Phylogenetic trees of the complete coding sequence (CDS) of TGEV. (a) Bayesian inference tree of the complete CDS of TGEV. Posterior probability values calculated by MrBayes are shown at each node. (b) Maximum likelihood tree of the complete CDS of TGEV. Bootstrap support values computed by RAxML are indicated on the nodes of tree. Scale bar at the bottom of the figure indicates a length corresponding to 0.5 nucleotide substitutions per site. The colored sectors represent three genotypes of TGEV.
Ijms 21 07898 g001
Figure 2. Principal components analysis (PCA) based on the RSCU values of the TGEV complete coding sequences. The significant separation in codon usage bias between the three genotypes of TGEV was present. Genotypes Ia, Ib, and II are represented in orange, green, and blue, respectively.
Ijms 21 07898 g002
Figure 3. Relative dinucleotide abundance of the complete CDS of TGEV. The above and below dashed lines represent 1.23 and 0.78, respectively.
Ijms 21 07898 g003
Figure 4. PR2 plot analysis of the TGEV complete CDS. Genotypes Ia, Ib, and II are represented in orange, green, and blue, respectively. G3/(G3 + C3) and A3/(A3 + U3) are horizontal and vertical axes, respectively.
Ijms 21 07898 g004
Figure 5. ENC plot analysis of the TGEV complete CDS. The relationships between ENC values and GC contents at the third codon position (GC3s) of synonymous codons are represent. The expected curve represents the expected ENC values toward all GC3 compositions. Genotypes Ia, Ib, and II are represented in orange, green, and blue, respectively.
Ijms 21 07898 g005
Figure 6. Neutrality analysis of the TGEV complete CDS. The correlation between GC12 and GC3 are represent. Genotypes Ia, Ib, and II are represented in orange, green, and blue, respectively.
Ijms 21 07898 g006
Figure 7. Analysis of TGEV adaptation to pig. (a) Codon adaptation index (CAI) of the TGEV complete CDS to pig. (b) Codon deoptimization index (RCDI) of the TGEV complete CDS to pig. (c) Similarity index (SiD) of the TGEV complete CDS to pig. Different lowercase letters indicate significant difference at the 5% level. Genotypes Ia, Ib, and II are represented in orange, green, and blue, respectively.
Ijms 21 07898 g007
Table 1. Nucleotide contents and properties of the TGEV complete CDS
CategoriesIaIbIIAll
A0.294 ± 00.294 ± 00.292 ± 00.293 ± 0.001
C0.17 ± 00.169 ± 00.167 ± 00.168 ± 0.001
G0.207 ± 00.207 ± 00.208 ± 00.207 ± 0
U0.329 ± 00.33 ± 00.333 ± 00.331 ± 0.002
A30.251 ± 00.251 ± 00.246 ± 00.249 ± 0.003
C30.162 ± 00.161 ± 00.154 ± 0.0010.158 ± 0.004
G30.135 ± 00.135 ± 00.138 ± 00.136 ± 0.002
U30.452 ± 00.454 ± 00.462 ± 0.0010.457 ± 0.004
GC0.377 ± 00.376 ± 00.374 ± 00.375 ± 0.001
AU0.623 ± 00.624 ± 00.626 ± 00.625 ± 0.001
GC10.461 ± 00.462 ± 00.46 ± 00.461 ± 0.001
GC20.372 ± 00.371 ± 00.371 ± 00.371 ± 0.001
GC120.417 ± 00.416 ± 00.416 ± 00.416 ± 0.001
GC30.297 ± 00.295 ± 0.0010.292 ± 0.0010.294 ± 0.002
ENC45.01 ± 0.03544.805 ± 0.04544.779 ± 0.0544.827 ± 0.095
Table 2. Synonymous codon usage of the TGEV complete CDS. The RSCU values of 59 synonymous codons are presented. The preferred, over-represented (RSCU > 1.6), and under-represented (RSCU < 0.6) codons are displayed in bold, italics, and underscore, respectively.
Codon (Amino Acid)IaIbIIAll
GCA (Ala)1.299 ± 0.0081.337 ± 0.0051.267 ± 0.0131.298 ± 0.034
GCC (Ala)0.458 ± 0.0060.396 ± 0.0050.508 ± 0.0090.459 ± 0.052
GCG (Ala)0.154 ± 0.0050.136 ± 0.0030.164 ± 0.0160.152 ± 0.017
GCU (Ala)2.089 ± 0.0032.13 ± 0.0062.061 ± 0.0142.091 ± 0.034
AGA (Arg)2.745 ± 0.012.78 ± 0.012.738 ± 0.0222.755 ± 0.026
AGG (Arg)0.914 ± 0.0020.873 ± 0.0110.915 ± 0.0130.899 ± 0.023
CGA (Arg)0.209 ± 0.0080.208 ± 0.0080.222 ± 0.0190.215 ± 0.016
CGC (Arg)0.537 ± 0.0090.491 ± 0.0090.54 ± 0.0120.522 ± 0.025
CGG (Arg)0.209 ± 0.0080.21 ± 0.0050.232 ± 0.0090.22 ± 0.014
CGU (Arg)1.387 ± 0.0081.438 ± 0.011.353 ± 0.0171.39 ± 0.041
AAC (Asn)0.699 ± 0.0050.694 ± 0.0030.669 ± 0.0050.683 ± 0.014
AAU (Asn)1.301 ± 0.0051.306 ± 0.0031.331 ± 0.0051.317 ± 0.014
GAC (Asp)0.68 ± 0.0070.681 ± 0.0050.64 ± 0.0090.662 ± 0.022
GAU (Asp)1.32 ± 0.0071.319 ± 0.0051.36 ± 0.0091.338 ± 0.022
UGC (Cys)0.64 ± 0.0020.638 ± 0.0020.549 ± 0.0070.597 ± 0.046
UGU (Cys)1.36 ± 0.0021.362 ± 0.0021.451 ± 0.0071.403 ± 0.046
CAA (Gln)1.229 ± 0.0031.268 ± 0.0041.26 ± 0.0111.258 ± 0.016
CAG (Gln)0.771 ± 0.0030.732 ± 0.0040.74 ± 0.0110.742 ± 0.016
GAA (Glu)1.485 ± 0.0021.477 ± 0.0041.425 ± 0.0091.454 ± 0.029
GAG (Glu)0.515 ± 0.0020.523 ± 0.0040.575 ± 0.0090.546 ± 0.029
GGA (Gly)0.739 ± 0.0050.716 ± 0.0030.705 ± 0.010.714 ± 0.014
GGC (Gly)0.582 ± 0.0050.573 ± 0.0040.554 ± 0.0130.566 ± 0.015
GGG (Gly)0.116 ± 00.136 ± 0.0020.154 ± 0.0070.141 ± 0.015
GGU (Gly)2.564 ± 0.012.575 ± 0.0062.587 ± 0.0172.579 ± 0.016
CAC (His)0.51 ± 00.499 ± 0.0070.452 ± 0.0060.479 ± 0.027
CAU (His)1.49 ± 01.501 ± 0.0071.548 ± 0.0061.521 ± 0.027
AUA (Ile)0.691 ± 0.0060.693 ± 0.0030.759 ± 0.0070.723 ± 0.034
AUC (Ile)0.49 ± 0.0070.488 ± 0.0040.421 ± 0.0110.457 ± 0.035
AUU (Ile)1.819 ± 0.0091.82 ± 0.0031.821 ± 0.0091.82 ± 0.008
CUA (Leu)0.538 ± 0.0080.562 ± 0.0050.512 ± 0.010.535 ± 0.025
CUC (Leu)0.555 ± 0.0060.534 ± 0.0050.552 ± 0.010.546 ± 0.012
CUG (Leu)0.258 ± 0.0090.283 ± 0.0050.251 ± 0.0070.264 ± 0.017
CUU (Leu)2.147 ± 0.0072.187 ± 0.0042.155 ± 0.012.166 ± 0.018
UUA (Leu)1.263 ± 0.0071.224 ± 0.0061.315 ± 0.0121.273 ± 0.043
UUG (Leu)1.239 ± 0.0051.208 ± 0.0031.216 ± 0.0111.217 ± 0.013
AAA (Lys)1.249 ± 0.0021.221 ± 0.0041.205 ± 0.0051.218 ± 0.016
AAG (Lys)0.751 ± 0.0020.779 ± 0.0040.795 ± 0.0050.782 ± 0.016
UUC (Phe)0.576 ± 0.0030.584 ± 0.0030.517 ± 0.0080.551 ± 0.033
UUU (Phe)1.424 ± 0.0031.416 ± 0.0031.483 ± 0.0081.449 ± 0.033
CCA (Pro)1.636 ± 0.0051.64 ± 0.011.627 ± 0.0071.633 ± 0.01
CCC (Pro)0.274 ± 0.0110.247 ± 0.0040.274 ± 0.0110.264 ± 0.016
CCG (Pro)0.168 ± 00.197 ± 0.0080.234 ± 0.0110.209 ± 0.027
CCU (Pro)1.921 ± 0.0121.916 ± 0.0051.865 ± 0.0141.893 ± 0.029
AGC (Ser)0.646 ± 0.0040.665 ± 0.0070.614 ± 0.0080.638 ± 0.025
AGU (Ser)1.624 ± 0.0111.598 ± 0.0041.648 ± 0.0051.626 ± 0.024
UCA (Ser)1.295 ± 0.0111.299 ± 0.011.26 ± 0.0111.28 ± 0.022
UCC (Ser)0.457 ± 0.0010.44 ± 0.0060.455 ± 0.0130.45 ± 0.012
UCG (Ser)0.118 ± 0.0050.123 ± 0.0040.15 ± 0.0090.135 ± 0.016
UCU (Ser)1.861 ± 0.0061.874 ± 0.0141.873 ± 0.021.871 ± 0.017
ACA (Thr)1.606 ± 0.0161.633 ± 0.0061.564 ± 0.0051.596 ± 0.033
ACC (Thr)0.4 ± 0.0030.414 ± 0.0050.392 ± 0.0080.401 ± 0.012
ACG (Thr)0.29 ± 0.0080.257 ± 0.0030.313 ± 0.0090.288 ± 0.027
ACU (Thr)1.704 ± 0.0071.696 ± 0.0051.732 ± 0.0091.714 ± 0.018
UAC (Tyr)0.772 ± 0.0030.781 ± 0.0040.728 ± 0.0070.755 ± 0.026
UAU (Tyr)1.228 ± 0.0031.219 ± 0.0041.272 ± 0.0071.245 ± 0.026
GUA (Val)0.785 ± 0.0030.774 ± 0.0050.744 ± 0.0050.762 ± 0.018
GUC (Val)0.652 ± 0.0050.666 ± 0.0050.631 ± 0.0120.648 ± 0.019
GUG (Val)0.651 ± 0.0050.652 ± 0.0030.65 ± 0.0040.651 ± 0.004
GUU (Val)1.911 ± 0.0081.907 ± 0.0031.975 ± 0.0131.94 ± 0.035
Publisher’s Note: MDPI stays neutral with regard to jurisdictional claims in published maps and institutional affiliations.