Dissecting Total Plasma and Protein-Specific Glycosylation Profiles in Congenital Disorders of Glycosylation

 , , ,
, , ,
Abstract
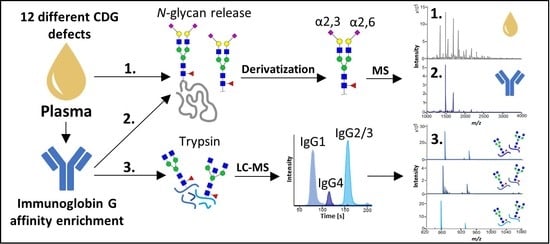
1. Introduction
2. Results
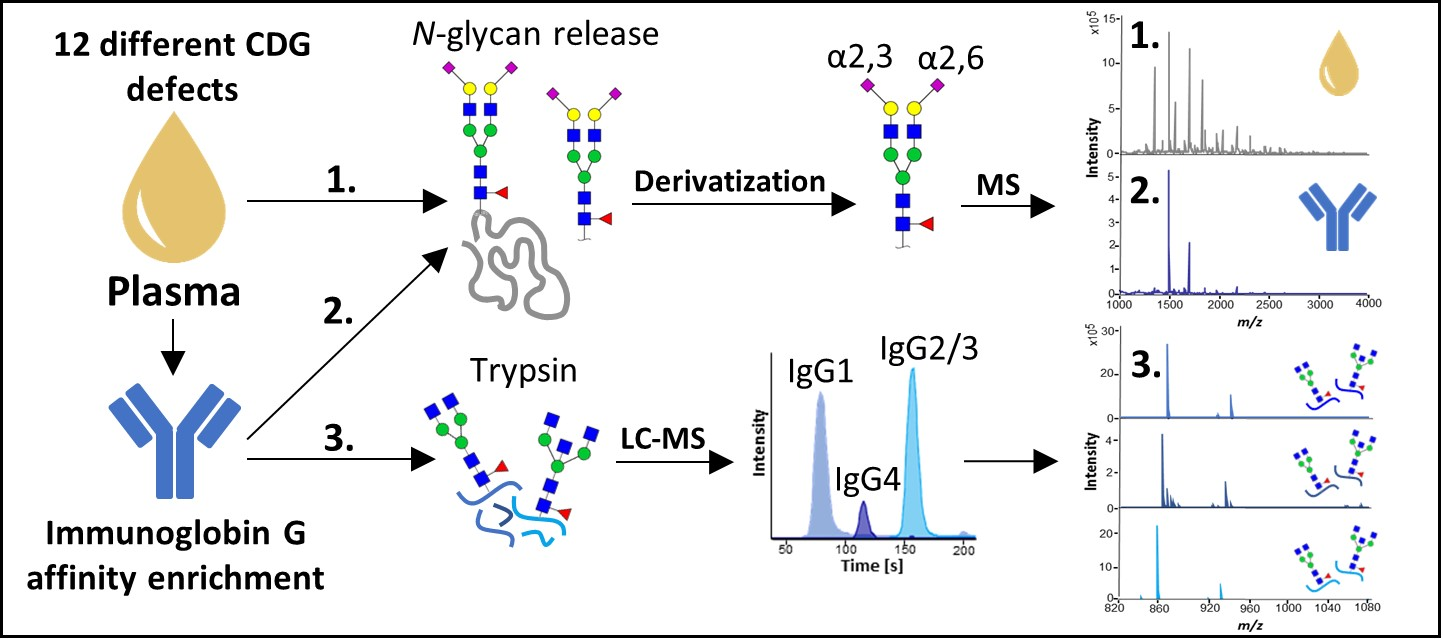
2.1. Glycosylation Analysis of Plasma Proteins in Controls
2.2. N-Glycosylation in Nucleotide Sugar Transporter Defects
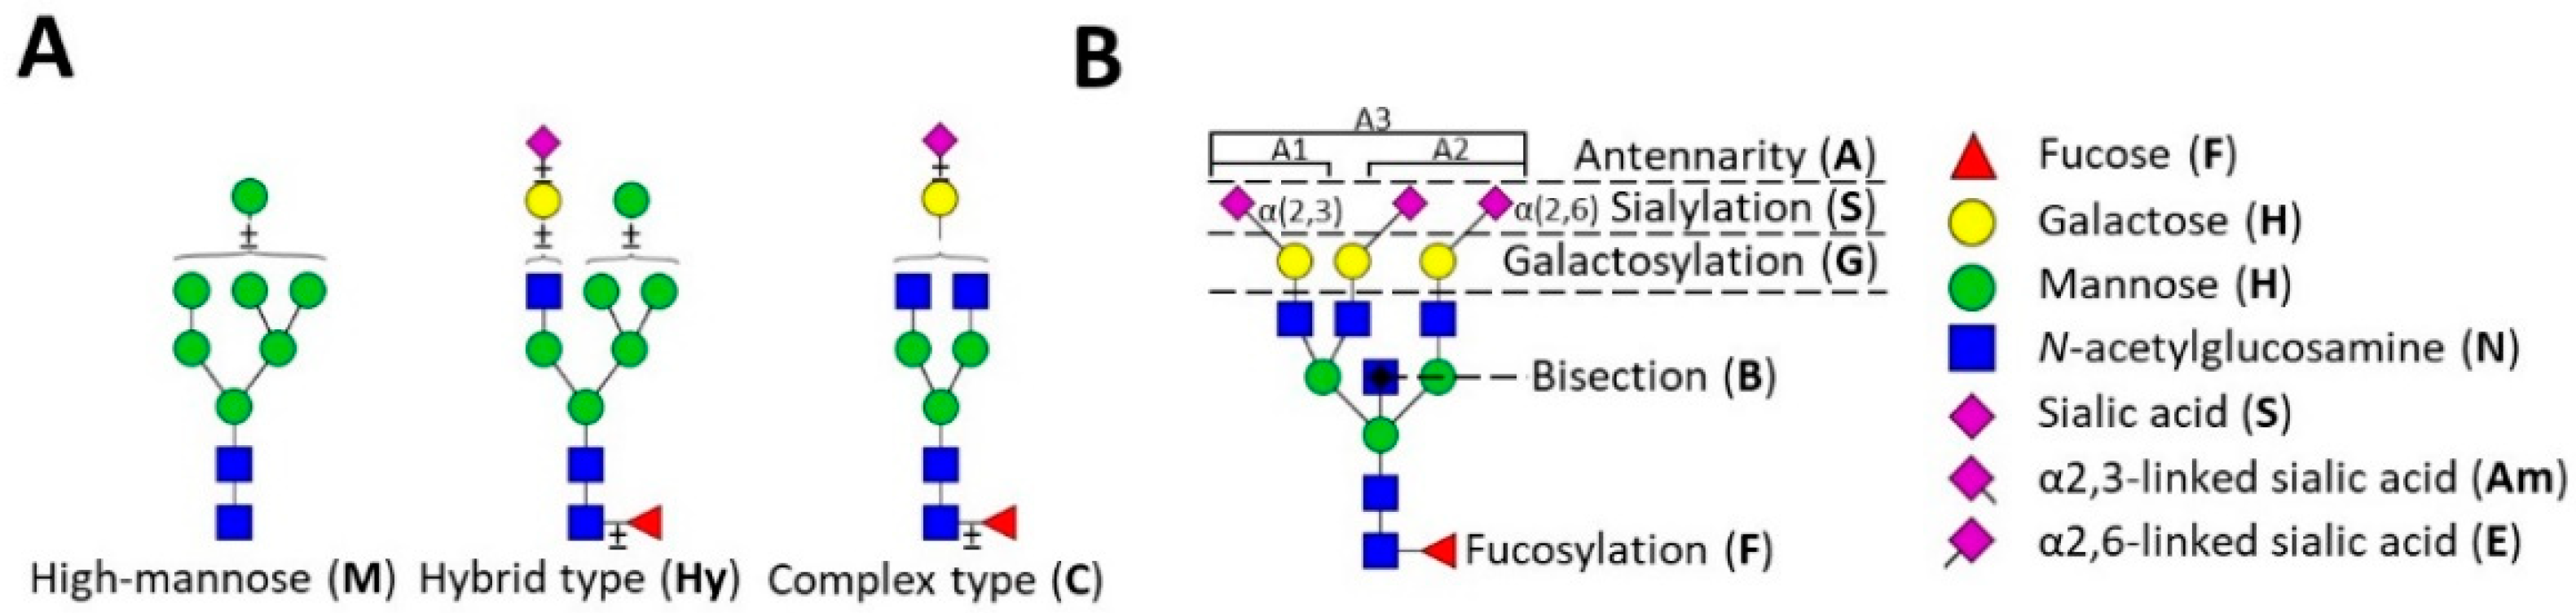
2.3. Defects in Golgi N-Glycosylation
2.4. N-Glycosylation in Golgi Homeostasis and Trafficking Defects
3. Discussion
3.1. N-Glycosylation
3.2. N-Glycosylation from Total Plasma Proteins
3.3. N-Glycosylation of Immunoglobin G
3.4. Concluding Remarks
4. Materials and Methods
4.1. Patient Samples
4.2. Plasma Immunoglobin G Enrichment and Digestion
4.3. Released N-Glycans and MALDI-TOF-MS Analysis
4.4. Data Processing
Supplementary Materials
Author Contributions
Funding
Acknowledgments
Conflicts of Interest
Abbreviations
| ATP6AP1 | ATPase H+ transporting accessory protein 1 |
| ATP6V0A2 | ATPase H+ transporting lyosomal V0 subunit a2 |
| B4GALT1 | β-1,4-galactosyltransferase 1 |
| CCDC115 | Coiled-coil domain containing 115 protein |
| CDG | Congenital disorders of glycosylation |
| CMP | Cytidine monophosphate |
| COG5 | Component of oligomeric Golgi complex 5 |
| ER | Endoplasmic reticulum |
| GDP | Guanosine diphosphate |
| IgG | Immunoglobin G |
| LC | Liquid chromatography |
| MALDI | Matrix-assisted laser desorption/ionization |
| MAN1B1 | Mannosyl-oligosaccharide 1,2-α-mannosidase |
| MGAT2 | Mannosyl(α-1,6-)-glycoprotein β-1,2-N-acetylglucosaminyltransferase |
| MS | Mass spectrometry |
| SLC35A1 | CMP-sialic acid transporter |
| SLC35A2 | UDP-galactose transporter |
| SLC35C1 | GDP-fucose transporter |
| TIEF | Transferrin isoelectric focusing |
| TMEM199 | Transmembrane protein 199 |
| TOF | Time-of-flight |
| TPNG | Total plasma N-glycome |
| Tf | Transferrin |
| UDP | Uridine diphosphate |
| VMA21 | Vacuolar ATPase assembly factor |
References
- Varki, A. Biological roles of glycans. Glycobiology 2017, 27, 3–49. [Google Scholar] [CrossRef] [PubMed]
- Lauc, G.; Pezer, M.; Rudan, I.; Campbell, H. Mechanisms of disease: The human N-glycome. Biochim. Biophys. Acta 2016, 1860, 1574–1582. [Google Scholar] [CrossRef]
- Thaysen-Andersen, M.; Packer, N.H. Site-specific glycoproteomics confirms that protein structure dictates formation of N-glycan type, core fucosylation and branching. Glycobiology 2012, 22, 1440–1452. [Google Scholar] [CrossRef] [PubMed]
- Reily, C.; Stewart, T.J.; Renfrow, M.B.; Novak, J. Glycosylation in health and disease. Nat. Rev. Nephrol. 2019, 15, 346–366. [Google Scholar] [CrossRef] [PubMed]
- Freeze, H.H.; Chong, J.X.; Bamshad, M.J.; Ng, B.G. Solving glycosylation disorders: Fundamental approaches reveal complicated pathways. Am. J. Hum. Genet. 2014, 94, 161–175. [Google Scholar] [CrossRef]
- Jaeken, J.; van Eijk, H.G.; van der Heul, C.; Corbeel, L.; Eeckels, R.; Eggermont, E. Sialic acid-deficient serum and cerebrospinal fluid transferrin in a newly recognized genetic syndrome. Clin. Chim. Acta 1984, 144, 245–247. [Google Scholar] [CrossRef]
- Fujita, M.; Satoh, C.; Asakawa, J.; Nagahata, Y.; Tanaka, Y.; Hazama, R.; Krasteff, T. Electrophoretic variants of blood proteins in Japanese. VI. Transferrin. Jpn. J. Hum. Genet. 1985, 30, 191–200. [Google Scholar] [CrossRef] [PubMed]
- Lacey, J.M.; Bergen, H.R.; Magera, M.J.; Naylor, S.; O’Brien, J.F. Rapid determination of transferrin isoforms by immunoaffinity liquid chromatography and electrospray mass spectrometry. Clin. Chem. 2001, 47, 513–518. [Google Scholar] [CrossRef]
- van Scherpenzeel, M.; Steenbergen, G.; Morava, E.; Wevers, R.A.; Lefeber, D.J. High-resolution mass spectrometry glycoprofiling of intact transferrin for diagnosis and subtype identification in the congenital disorders of glycosylation. Transl. Res. 2015, 166, 639–649e631. [Google Scholar] [CrossRef]
- Post, M.A.; Lefeber, D.J. Clinical glycomics in the diagnostic laboratory. Ann. Transl. Med. 2019, 7, S220. [Google Scholar] [CrossRef]
- Van Scherpenzeel, M.; Willems, E.; Lefeber, D.J. Clinical diagnostics and therapy monitoring in the congenital disorders of glycosylation. Glycoconj. J. 2016, 33, 345–358. [Google Scholar] [CrossRef] [PubMed]
- Sadat, M.A.; Moir, S.; Chun, T.W.; Lusso, P.; Kaplan, G.; Wolfe, L.; Memoli, M.J.; He, M.; Vega, H.; Kim, L.J.Y.; et al. Glycosylation, hypogammaglobulinemia, and resistance to viral infections. N. Engl. J. Med. 2014, 370, 1615–1625. [Google Scholar] [CrossRef] [PubMed]
- Ashikov, A.; Abu Bakar, N.; Wen, X.Y.; Niemeijer, M.; Rodrigues Pinto Osorio, G.; Brand-Arzamendi, K.; Hasadsri, L.; Hansikova, H.; Raymond, K.; Vicogne, D.; et al. Integrating glycomics and genomics uncovers SLC10A7 as essential factor for bone mineralization by regulating post-Golgi protein transport and glycosylation. Hum. Mol. Genet. 2018, 27, 3029–3045. [Google Scholar] [CrossRef]
- Stanley, P.; Taniguchi, N.; Aebi, M. N-Glycans. In Essentials of Glycobiology; Varki, A., Cummings, R.D., Esko, J.D., Stanley, P., Hart, G.W., Aebi, M., Darvill, A.G., Eds.; Cold Spring Harbor: New York, NY, USA, 2015; pp. 99–111. [Google Scholar] [CrossRef]
- de Haan, N.; Falck, D.; Wuhrer, M. Monitoring of immunoglobulin N- and O-glycosylation in health and disease. Glycobiology 2020, 30, 226–240. [Google Scholar] [CrossRef] [PubMed]
- Lageveen-Kammeijer, G.S.M.; de Haan, N.; Mohaupt, P.; Wagt, S.; Filius, M.; Nouta, J.; Falck, D.; Wuhrer, M. Highly sensitive CE-ESI-MS analysis of N-glycans from complex biological samples. Nat. Commun. 2019, 10, 2137. [Google Scholar] [CrossRef] [PubMed]
- Stumpo, K.A.; Reinhold, V.N. The N-glycome of human plasma. J. Proteome Res. 2010, 9, 4823–4830. [Google Scholar] [CrossRef] [PubMed]
- Knezevic, A.; Bones, J.; Kracun, S.K.; Gornik, O.; Rudd, P.M.; Lauc, G. High throughput plasma N-glycome profiling using multiplexed labelling and UPLC with fluorescence detection. Analyst 2011, 136, 4670–4673. [Google Scholar] [CrossRef]
- Reiding, K.R.; Vreeker, G.C.M.; Bondt, A.; Bladergroen, M.R.; Hazes, J.M.W.; van der Burgt, Y.E.M.; Wuhrer, M.; Dolhain, R.J.E.M. Serum Protein N-Glycosylation Changes with Rheumatoid Arthritis Disease Activity during and after Pregnancy. Front. Med. (Lausanne) 2017, 4, 241. [Google Scholar] [CrossRef]
- Clerc, F.; Reiding, K.R.; Jansen, B.C.; Kammeijer, G.S.M.; Bondt, A.; Wuhrer, M. Human plasma protein N-glycosylation. Glycoconj. J. 2016, 33, 309–343. [Google Scholar] [CrossRef]
- Bladergroen, M.R.; Reiding, K.R.; Hipgrave Ederveen, A.L.; Vreeker, G.C.M.; Clerc, F.; Holst, S.; Bondt, A.; Wuhrer, M.; van der Burgt, Y.E.M. Automation of High-Throughput Mass Spectrometry-Based Plasma N-Glycome Analysis with Linkage-Specific Sialic Acid Esterification. J. Proteome Res. 2015, 14, 4080–4086. [Google Scholar] [CrossRef]
- Vreeker, G.C.M.; Nicolardi, S.; Bladergroen, M.R.; van der Plas, C.J.; Mesker, W.E.; Tollenaar, R.A.E.M.; van der Burgt, Y.E.M.; Wuhrer, M. Automated Plasma Glycomics with Linkage-Specific Sialic Acid Esterification and Ultrahigh Resolution MS. Anal. Chem. 2018, 90, 11955–11961. [Google Scholar] [CrossRef] [PubMed]
- Bondt, A.; Rombouts, Y.; Selman, M.H.J.; Hensbergen, P.J.; Reiding, K.R.; Hazes, J.M.W.; Dolhain, R.J.E.M.; Wuhrer, M. Immunoglobulin G (IgG) Fab glycosylation analysis using a new mass spectrometric high-throughput profiling method reveals pregnancy-associated changes. Mol. Cell. Proteomics 2014, 13, 3029–3039. [Google Scholar] [CrossRef]
- de Haan, N.; Reiding, K.R.; Driessen, G.; van der Burg, M.; Wuhrer, M. Changes in Healthy Human IgG Fc-Glycosylation after Birth and during Early Childhood. J. Proteome Res. 2016, 15, 1853–1861. [Google Scholar] [CrossRef] [PubMed]
- Cannata Serio, M.; Graham, L.A.; Ashikov, A.; Larsen, L.E.; Raymond, K.; Timal, S.; Le Meur, G.; Ryan, M.; Czarnowska, E.; Jansen, J.C.; et al. sMutations in the V-ATPase assembly factor VMA21 cause a congenital disorder of glycosylation with autophagic liver disease. Hepatology 2020, 10.1002/hep.31218. [Google Scholar] [CrossRef] [PubMed]
- Scott, K.; Gadomski, T.; Kozicz, T.; Morava, E. Congenital disorders of glycosylation: New defects and still counting. J. Inherit. Metab. Dis. 2014, 37, 609–617. [Google Scholar] [CrossRef] [PubMed]
- Guillard, M.; Morava, E.; van Delft, F.L.; Hague, R.; Korner, C.; Adamowicz, M.; Wevers, R.A.; Lefeber, D.J. Plasma N-glycan profiling by mass spectrometry for congenital disorders of glycosylation type II. Clin. Chem. 2011, 57, 593–602. [Google Scholar] [CrossRef] [PubMed]
- Gornik, O.; Lauc, G. Glycosylation of serum proteins in inflammatory diseases. Dis. Markers 2008, 25, 267–278. [Google Scholar] [CrossRef]
- Connelly, M.A.; Gruppen, E.G.; Otvos, J.D.; Dullaart, R.P.F. Inflammatory glycoproteins in cardiometabolic disorders, autoimmune diseases and cancer. Clin. Chim. Acta 2016, 459, 177–186. [Google Scholar] [CrossRef]
- Zhang, Z.; Wuhrer, M.; Holst, S. Serum sialylation changes in cancer. Glycoconj. J. 2018, 35, 139–160. [Google Scholar] [CrossRef]
- Smith, R.D.; Lupashin, V.V. Role of the conserved oligomeric Golgi (COG) complex in protein glycosylation. Carbohydr. Res. 2008, 343, 2024–2031. [Google Scholar] [CrossRef]
- Freeze, H.H.; Hart, G.W.; Schnaar, R.L. Glycosylation Precursors. In Essentials of Glycobiology; Varki, A., Cummings, R.D., Esko, J.D., Stanley, P., Hart, G.W., Aebi, M., Darvill, A.G., Kinoshita, T., Packer, N.H., Eds.; Cold Spring Harbor: New York, NY, USA, 2015; pp. 51–63. [Google Scholar] [CrossRef]
- Reynders, E.; Foulquier, F.; Leao Teles, E.; Quelhas, D.; Morelle, W.; Rabouille, C.; Annaert, W.; Matthijs, G. Golgi function and dysfunction in the first COG4-deficient CDG type II patient. Hum. Mol. Genet. 2009, 18, 3244–3256. [Google Scholar] [CrossRef] [PubMed]
- Miles, A.L.; Burr, S.P.; Grice, G.L.; Nathan, J.A. The vacuolar-ATPase complex and assembly factors, TMEM199 and CCDC115, control HIF1alpha prolyl hydroxylation by regulating cellular iron levels. eLife 2017, 6, e22693. [Google Scholar] [CrossRef] [PubMed]
- Maeda, Y.; Kinoshita, T. The acidic environment of the Golgi is critical for glycosylation and transport. Methods Enzymol. 2010, 480, 495–510. [Google Scholar] [CrossRef] [PubMed]
- Kellokumpu, S. Golgi pH, Ion and Redox Homeostasis: How Much Do They Really Matter? Front. Cell. Dev. Biol. 2019, 7, 93. [Google Scholar] [CrossRef] [PubMed]
- Rivinoja, A.; Hassinen, A.; Kokkonen, N.; Kauppila, A.; Kellokumpu, S. Elevated Golgi pH impairs terminal N-glycosylation by inducing mislocalization of Golgi glycosyltransferases. J. Cell. Physiol. 2009, 220, 144–154. [Google Scholar] [CrossRef] [PubMed]
- Axelsson, M.A.; Karlsson, N.G.; Steel, D.M.; Ouwendijk, J.; Nilsson, T.; Hansson, G.C. Neutralization of pH in the Golgi apparatus causes redistribution of glycosyltransferases and changes in the O-glycosylation of mucins. Glycobiology 2001, 11, 633–644. [Google Scholar] [CrossRef] [PubMed]
- Kellokumpu, S.; Sormunen, R.; Kellokumpu, I. Abnormal glycosylation and altered Golgi structure in colorectal cancer: Dependence on intra-Golgi pH. FEBS Lett. 2002, 516, 217–224. [Google Scholar] [CrossRef]
- Rivinoja, A.; Kokkonen, N.; Kellokumpu, I.; Kellokumpu, S. Elevated Golgi pH in breast and colorectal cancer cells correlates with the expression of oncofetal carbohydrate T-antigen. J. Cell. Physiol. 2006, 208, 167–174. [Google Scholar] [CrossRef]
- Tang, H.; Singh, S.; Partyka, K.; Kletter, D.; Hsueh, P.; Yadav, J.; Ensink, E.; Bern, M.; Hostetter, G.; Hartman, D.; et al. Glycan motif profiling reveals plasma sialyl-lewis x elevations in pancreatic cancers that are negative for sialyl-lewis A. Mol. Cell Proteomics 2015, 14, 1323–1333. [Google Scholar] [CrossRef]
- Trinchera, M.; Aronica, A.; Dall’Olio, F. Selectin Ligands Sialyl-Lewis a and Sialyl-Lewis x in Gastrointestinal Cancers. Biology 2017, 6, 16. [Google Scholar] [CrossRef]
- Jansen, J.C.; Timal, S.; van Scherpenzeel, M.; Michelakakis, H.; Vicogne, D.; Ashikov, A.; Moraitou, M.; Hoischen, A.; Huijben, K.; Steenbergen, G.; et al. TMEM199 Deficiency Is a Disorder of Golgi Homeostasis Characterized by Elevated Aminotransferases, Alkaline Phosphatase, and Cholesterol and Abnormal Glycosylation. Am. J. Hum. Genet. 2016, 98, 322–330. [Google Scholar] [CrossRef]
- Dotz, V.; Wuhrer, M. N-glycome signatures in human plasma: Associations with physiology and major diseases. FEBS Lett. 2019, 593, 2966–2976. [Google Scholar] [CrossRef] [PubMed]
- Mohamed, M.; Ashikov, A.; Guillard, M.; Robben, J.H.; Schmidt, S.; van den Heuvel, B.; de Brouwer, A.P.; Gerardy-Schahn, R.; Deen, P.M.; Wevers, R.A.; et al. Intellectual disability and bleeding diathesis due to deficient CMP--sialic acid transport. Neurology 2013, 81, 681–687. [Google Scholar] [CrossRef] [PubMed]
- Hafkenscheid, L.; de Moel, E.; Smolik, I.; Tanner, S.; Meng, X.; Jansen, B.C.; Bondt, A.; Wuhrer, M.; Huizinga, T.W.J.; Toes, R.E.M.; et al. N-Linked Glycans in the Variable Domain of IgG Anti-Citrullinated Protein Antibodies Predict the Development of Rheumatoid Arthritis. Arthritis Rheumatol. 2019, 71, 1626–1633. [Google Scholar] [CrossRef]
- Gudelj, I.; Lauc, G.; Pezer, M. Immunoglobulin G glycosylation in aging and diseases. Cell. Immunol. 2018, 333, 65–79. [Google Scholar] [CrossRef]
- Ng, B.G.; Buckingham, K.J.; Raymond, K.; Kircher, M.; Turner, E.H.; He, M.; Smith, J.D.; Eroshkin, A.; Szybowska, M.; Losfeld, M.E.; et al. Mosaicism of the UDP-galactose transporter SLC35A2 causes a congenital disorder of glycosylation. Am. J. Hum. Genet. 2013, 92, 632–636. [Google Scholar] [CrossRef]
- Vals, M.A.; Ashikov, A.; Ilves, P.; Loorits, D.; Zeng, Q.; Barone, R.; Huijben, K.; Sykut-Cegielska, J.; Diogo, L.; Elias, A.F.; et al. Clinical, neuroradiological, and biochemical features of SLC35A2-CDG patients. J. Inherit. Metab. Dis. 2019, 42, 553–564. [Google Scholar] [CrossRef]
- Dorre, K.; Olczak, M.; Wada, Y.; Sosicka, P.; Gruneberg, M.; Reunert, J.; Kurlemann, G.; Fiedler, B.; Biskup, S.; Hortnagel, K.; et al. A new case of UDP-galactose transporter deficiency (SLC35A2-CDG): Molecular basis, clinical phenotype, and therapeutic approach. J. Inherit. Metab. Dis. 2015, 38, 931–940. [Google Scholar] [CrossRef] [PubMed]
- Arnold, J.N.; Wormald, M.R.; Sim, R.B.; Rudd, P.M.; Dwek, R.A. The impact of glycosylation on the biological function and structure of human immunoglobulins. Annu. Rev. Immunol. 2007, 25, 21–50. [Google Scholar] [CrossRef]
- Keusch, J.; Lydyard, P.M.; Delves, P.J. The effect on IgG glycosylation of altering beta1, 4-galactosyltransferase-1 activity in B cells. Glycobiology 1998, 8, 1215–1220. [Google Scholar] [CrossRef]
- Jones, M.B.; Oswald, D.M.; Joshi, S.; Whiteheart, S.W.; Orlando, R.; Cobb, B.A. B-cell-independent sialylation of IgG. Proc. Natl. Acad. Sci. USA 2016, 113, 7207–7212. [Google Scholar] [CrossRef]
- van de Bovenkamp, F.S.; Hafkenscheid, L.; Rispens, T.; Rombouts, Y. The Emerging Importance of IgG Fab Glycosylation in Immunity. J. Immunol. 2016, 196, 1435–1441. [Google Scholar] [CrossRef] [PubMed]
- Bohm, S.; Schwab, I.; Lux, A.; Nimmerjahn, F. The role of sialic acid as a modulator of the anti-inflammatory activity of IgG. Semin. Immunopathol. 2012, 34, 443–453. [Google Scholar] [CrossRef]
- Dekkers, G.; Bentlage, A.E.H.; Plomp, R.; Visser, R.; Koeleman, C.A.M.; Beentjes, A.; Mok, J.Y.; van Esch, W.J.E.; Wuhrer, M.; Rispens, T.; et al. Conserved FcgammaR- glycan discriminates between fucosylated and afucosylated IgG in humans and mice. Mol. Immunol. 2018, 94, 54–60. [Google Scholar] [CrossRef] [PubMed]
- de Taeye, S.W.; Bentlage, A.E.H.; Mebius, M.M.; Meesters, J.I.; Lissenberg-Thunnissen, S.; Falck, D.; Senard, T.; Salehi, N.; Wuhrer, M.; Schuurman, J.; et al. FcgammaR Binding and ADCC Activity of Human IgG Allotypes. Front. Immunol. 2020, 11, 740. [Google Scholar] [CrossRef]
- Dauber, A.; Ercan, A.; Lee, J.; James, P.; Jacobs, P.P.; Ashline, D.J.; Wang, S.R.; Miller, T.; Hirschhorn, J.N.; Nigrovic, P.A.; et al. Congenital disorder of fucosylation type 2c (LADII) presenting with short stature and developmental delay with minimal adhesion defect. Hum. Mol. Genet. 2014, 23, 2880–2887. [Google Scholar] [CrossRef]
- Dinauer, M.C. Primary immune deficiencies with defects in neutrophil function. Hematol. Am. Soc. Hematol. Educ. Program 2016, 2016, 43–50. [Google Scholar] [CrossRef] [PubMed]
- Abu Bakar, N.; Lefeber, D.J.; van Scherpenzeel, M. Clinical glycomics for the diagnosis of congenital disorders of glycosylation. J. Inherit. Metab. Dis. 2018, 41, 499–513. [Google Scholar] [CrossRef]
- Holst, S.; van Pelt, G.W.; Mesker, W.E.; Tollenaar, R.A.; Belo, A.I.; van Die, I.; Rombouts, Y.; Wuhrer, M. High-Throughput and High-Sensitivity Mass Spectrometry-Based N-Glycomics of Mammalian Cells. Methods Mol. Biol. 2017, 1503, 185–196. [Google Scholar] [CrossRef]
- Falck, D.; Jansen, B.C.; de Haan, N.; Wuhrer, M. High-Throughput Analysis of IgG Fc Glycopeptides by LC-MS. Methods Mol. Biol. 2017, 1503, 31–47. [Google Scholar] [CrossRef]
- Kapur, R.; Kustiawan, I.; Vestrheim, A.; Koeleman, C.A.; Visser, R.; Einarsdottir, H.K.; Porcelijn, L.; Jackson, D.; Kumpel, B.; Deelder, A.M.; et al. A prominent lack of IgG1-Fc fucosylation of platelet alloantibodies in pregnancy. Blood 2014, 123, 471–480. [Google Scholar] [CrossRef] [PubMed]
- Reiding, K.R.; Blank, D.; Kuijper, D.M.; Deelder, A.M.; Wuhrer, M. High-throughput profiling of protein N-glycosylation by MALDI-TOF-MS employing linkage-specific sialic acid esterification. Anal. Chem. 2014, 86, 5784–5793. [Google Scholar] [CrossRef]
- Reiding, K.R.; Lonardi, E.; Hipgrave Ederveen, A.L.; Wuhrer, M. Ethyl Esterification for MALDI-MS Analysis of Protein Glycosylation. Methods Mol. Biol. 2016, 1394, 151–162. [Google Scholar] [CrossRef] [PubMed]
- Selman, M.H.; Hemayatkar, M.; Deelder, A.M.; Wuhrer, M. Cotton HILIC SPE microtips for microscale purification and enrichment of glycans and glycopeptides. Anal. Chem. 2011, 83, 2492–2499. [Google Scholar] [CrossRef]
- Jansen, B.C.; Falck, D.; de Haan, N.; Hipgrave Ederveen, A.L.; Razdorov, G.; Lauc, G.; Wuhrer, M. LaCyTools: A Targeted Liquid Chromatography-Mass Spectrometry Data Processing Package for Relative Quantitation of Glycopeptides. J. Proteome Res. 2016, 15, 2198–2210. [Google Scholar] [CrossRef]
- Jansen, B.C.; Reiding, K.R.; Bondt, A.; Hipgrave Ederveen, A.L.; Palmblad, M.; Falck, D.; Wuhrer, M. MassyTools: A High-Throughput Targeted Data Processing Tool for Relative Quantitation and Quality Control Developed for Glycomic and Glycoproteomic MALDI-MS. J. Proteome Res. 2015, 14, 5088–5098. [Google Scholar] [CrossRef]
- Dotz, V.; Lemmers, R.F.H.; Reiding, K.R.; Hipgrave Ederveen, A.L.; Lieverse, A.G.; Mulder, M.T.; Sijbrands, E.J.G.; Wuhrer, M.; van Hoek, M. Plasma protein N-glycan signatures of type 2 diabetes. Biochim. Biophys. Acta Gen. Subj. 2018, 1862, 2613–2622. [Google Scholar] [CrossRef]


| Patient Nr. | Gene Defect | Sex | Life Stage 2 | Clinical Phenotype |
|---|---|---|---|---|
| 1 | MGAT2 | - 1 | child | Intellectual disability (ID), microcephaly, dysmorphic features, failure to thrive |
| 2 | SLC35C1 | F | child | ID, short stature, leucocyte adhesion deficiency |
| 3 | B4GALT1 | F | child | Mild hepatomegaly, diarrhea, dysmorphic features, abnormal coagulation |
| 4 | B4GALT1 | M | child | |
| 5 | SLC35A1 | F | adolescent | ID, ataxia, seizures, macrothrombocytopenia, proteinuria |
| 6 | MAN1B1 | M | adolescent | ID, macrocephaly, truncal obesity, dysmorphic features |
| 7 | MAN1B1 | M | adolescent | |
| 8 | SLC35A2 | F | toddler | ID, short stature, seizures, dysmorphic features |
| 9 | SLC35A2 | M | toddler | |
| 10 | ATP6V0A2 | F | infant | ID, cutis laxa, dysmorphic features |
| 11 | ATP6V0A2 | M | adolescent | |
| 12 | COG5 | M | infant | Skeletal dysplasia, dysmorphic features, cholestasis |
| 13 | TMEM199 | M | child | Hypercholesterolemia, elevated aminotransferases and alkaline phosphatase |
| 14 | TMEM199 | M | adult | |
| 15 | CCDC115 | F | child | Hypercholesterolemia, elevated aminotransferases and alkaline phosphatase, hepatomegaly, psychomotor retardation |
| 16 | CCDC115 | M | child | |
| 17 | VMA21 | M | adolescent | Hypercholesterolemia, elevated aminotransferases, steatosis |
| 18 | VMA21 | M | adult | Myopathy |
| 19 | ATP6AP1 | M | child | Jaundice, elevated aminotransferases, low immunoglobulins |
| 20 | ATP6AP1 | M | adolescent | Jaundice, elevated aminotransferases, low immunoglobulins, hepatosplenomegaly |
| Healthy controls | - | 6 F/4 M | 3–58 (18) yrs 3 | - |
Publisher’s Note: MDPI stays neutral with regard to jurisdictional claims in published maps and institutional affiliations. |
© 2020 by the authors. Licensee MDPI, Basel, Switzerland. This article is an open access article distributed under the terms and conditions of the Creative Commons Attribution (CC BY) license (http://creativecommons.org/licenses/by/4.0/).
Share and Cite
Hipgrave Ederveen, A.L.; de Haan, N.; Baerenfaenger, M.; Lefeber, D.J.; Wuhrer, M. Dissecting Total Plasma and Protein-Specific Glycosylation Profiles in Congenital Disorders of Glycosylation. Int. J. Mol. Sci. 2020, 21, 7635. https://doi.org/10.3390/ijms21207635
Hipgrave Ederveen AL, de Haan N, Baerenfaenger M, Lefeber DJ, Wuhrer M. Dissecting Total Plasma and Protein-Specific Glycosylation Profiles in Congenital Disorders of Glycosylation. International Journal of Molecular Sciences. 2020; 21(20):7635. https://doi.org/10.3390/ijms21207635
Chicago/Turabian StyleHipgrave Ederveen, Agnes L., Noortje de Haan, Melissa Baerenfaenger, Dirk J. Lefeber, and Manfred Wuhrer. 2020. "Dissecting Total Plasma and Protein-Specific Glycosylation Profiles in Congenital Disorders of Glycosylation" International Journal of Molecular Sciences 21, no. 20: 7635. https://doi.org/10.3390/ijms21207635
APA StyleHipgrave Ederveen, A. L., de Haan, N., Baerenfaenger, M., Lefeber, D. J., & Wuhrer, M. (2020). Dissecting Total Plasma and Protein-Specific Glycosylation Profiles in Congenital Disorders of Glycosylation. International Journal of Molecular Sciences, 21(20), 7635. https://doi.org/10.3390/ijms21207635